Article

Physical and Mechanical Properties Evolution of Coal Subjected to Salty Solution and a Damage Constitutive Model under Uniaxial Compression

1
School of Civil and Resource Engineering, University of Science and Technology Beijing, Beijing 100083, China
2
State Key Laboratory of Coal Resources in Western China, Xi’an University of Science and Technology, Xi’an 710054, China
3
State Key Laboratory of Water Resource Protection and Utilization in Coal Mining, China Energy Investiment, Beijing 100000, China
4
School of Resource Environment and Safety Engineering, University of South China, Hengyang 421001, China
*
Author to whom correspondence should be addressed.
Mathematics 2021, 9(24), 3264; https://doi.org/10.3390/math9243264
Submission received: 5 November 2021 / Revised: 3 December 2021 / Accepted: 8 December 2021 / Published: 16 December 2021

Abstract

:
Many underground reservoirs for storing water have been constructed in China’s western coal mines to protect water resources. Coal pillars which work as dams are subjected to a long-term soaking environment of concentrated salty water. Deterioration of the coal dam under the attack of the salty solution poses challenges for the long-term stability and serviceability of underground reservoirs. The evolution of the physical and mechanical properties of coal subjected to salty solutions are investigated in this paper. Coal from a western China mine is made to standard cylinder samples. The salty solution is prepared according to chemical tests of water in the mine. The coal samples soaked in the salty solution for different periods are tested by scanning electron microscope, nuclear magnetic resonance, and ultrasonic detector techniques. Further, uniaxial compression tests are carried out on the coal specimens. The evolutions of porosity, mass, microstructures of coal, solution pH values, and stress–strain curves are obtained for different soaking times. Moreover, a damage constitutive model for the coal samples is developed by introducing a chemical-stress coupling damage variable. The result shows that the corrosion effect of salty solution on coal samples becomes stronger with increasing immersion time. The degree of deterioration of the longitudinal wave velocity (vp) is positively correlated with the immersion time. With the increase in soaking times, the porosity of coal gradually increases. The relative mass firstly displays an increasing trend and then decreases with time. The peak strength and elastic modulus of coal decreases exponentially with soaking times. The developed damage constitutive model can well describe the stress–strain behavior of coal subjected to salty solution under the uniaxial compression.

1. Introduction

Coal mining is normally accompanied by discharge of a large amount of water. This drained mine water with a high level of salt, in some cases, may damage ecosystem balance. Some theories and techniques, including the adsorbent method, evaporation, bioremediation, and irrigation of croplands, have been proposed and applied to treat the sodic–salty associated water from coal seams [1]. The coal resources of China are mainly distributed in western mining areas where the ecological environment is fragile and water resources are scarce. Large-scale coal mining could result in environmental problems, such as surface water waste and environmental pollution [2,3]. To protect and utilize water resources, some underground mines [4] built underground reservoirs in the underground coal mines for water storage. However, mine water in some of these mines [4] has high salinity level with K+, Na+, Cl, and SO42−, etc. As the dams of underground reservoirs, coal pillars are in a long-term soaking environment of concentrated saltwater that could significantly change the microstructure of coal and affect the performance of coal dams. The immersion of salty solutions poses a serious threat to the stability of the coal dams. Therefore, it is crucial to understand the mechanical behavior of coal subjected to saltwater for the design and management of underground coal dams.
In past decades, considerable research has been carried out on the water–rock interaction. The chemical solutions mainly affect the rocks through hydro-physical and hydro-chemical interactions. The physical effects of water on rocks include water lubrication, water wedge, etc. The presence of water promotes the dissolution of soluble salts, accelerates the hydrolysis of colloids, weakens the connection force between mineral particles, and finally reduces the strength of the rock. Scholars have conducted a lot of research on the influence of water on the physical and mechanical properties of rock materials. Dyke and Dobereiner [5] studied the influence of water content on the strength and deformation characteristics of sandstone and found that small changes in water content can significantly affect the mechanical response of the rock. The increase in water content promotes the propagation of microcracks and the occurrence of dilatancy, which results in a decrease in rock strength. Hawkins and McConnell [6] discussed the sensitivity of different types of sandstone to water. It showed that the water sensitivity of sandstone increases with the increase in the proportion of quartz and clay minerals, and the strength of sandstone is in an exponential relationship with water content. Vásárhelyi [7] carried out experiments on the physical and mechanical properties of dry and saturated limestone and found that the porosity, elastic modulus, uniaxial compressive strength, and tensile strength of limestone under saturated conditions are all 66% of the dry specimens. Erguler [8] conducted uniaxial compression tests and Brazilian splitting tests on clay-bearing rocks with different water content. With the increase in water content, the uniaxial compressive strength, elastic modulus, and tensile strength of the rock were reduced by 90%, 93%, and 90%, respectively, compared with the specimen in the dry state. Zhao [9] studied coal’s dynamic tensile failure characteristics in dry and saturated states, and found that saturated coal samples have higher tensile strength compared with dry coal samples. Gu [10,11] tested the static and dynamic mechanical properties of coal samples under different water-bearing conditions. The results showed that with the increase in water content, the static mechanical parameters of coal samples deteriorated to a certain degree, while the dynamic mechanical parameters increased first and then decreased.
The chemical effects of water on rocks include ion exchange, dissolution, and hydrolysis. The water and rock chemical action changes the mineral composition in the rock mass and increases the pore structure, which leads to the change in macro-mechanical properties. M. G. Karfakis and M. Akram [12] discussed the influence of water–rock interactions on rock fracture toughness. Fencht et al. [13] carried out triaxial compression tests on fractured quartz sandstones with different pH levels of NaCl and CaCl2, and studied the effects of different solutions on the friction strength of sandstone fracture surfaces. Feng and Chen et al. [14,15,16] carried out experiments on the mechanical properties of sandstone under different corrosion conditions, discussed the microscopic failure mechanism of the rock under the action of corrosion, and carried out a quantitative analysis of the damage evolution inside the rock. Han et al. [17] conducted mechanical tests on sandstone after soaking in different chemical solutions and analyzed the corrosion effect of different solutions on the rock. Hutchinson and Johnson [18] studied the corrosion and degradation of limestone under the action of acid. Qiao [19] carried out uniaxial compression tests of sandstone after soaking in aqueous solutions with different ion concentrations, and analyzed the influence of water chemistry on the microstructure and macro-mechanical properties of the rock. Lin [20] studied the evolution of mechanical damage of rocks under the coupled chemical-stress conditions, and found that chemical corrosion increased the porosity of the rocks, which led to the decline of mechanical properties. Xie [21] tested the influence of chemical degradation on the mechanical behavior of limestone and found that chemical degradation enhanced the deformation of rock and significantly increased the permeability. Li [22] employed the nuclear magnetic imaging technology and mechanical tests method to study the effect of chemical solutions on the degradation of the microstructure and mechanical properties of limestone.
However, most existing research on the effects of water and chemistry on rock mechanical behaviors were focused on rock, e.g., limestone, granite, sandstone, etc. Some studies on the influence of salty solution on coal have been carried out in surfactant absorption and mineral flotation. Ozdemir et al. [23] used a series of experimental measurement methods to study the influence of hypersaline on surface chemistry characteristics of coal flotation. They found that the hypersaline reduced the surface tension between coal particles and air bubbles. Zhang et al. [24] studied the effect of different ions on interfacial tension between water and kerosene and found that the surface tension decreased with the increasing salt concentration. Ni et al. [25] studied the effect of NaCl–SDS compound solution on the wetting performance of coal. It found that the addition of sodium salt can efficiently decrease the surface tension of coal and improve the wettability. To date, research on coal’s physical and mechanical properties subjected to salty solutions is rarely reported. The physics and mechanisms behind coal damage affected by salty mine water are unclear, bringing difficulties to design, management, and stability control of coal dams in underground reservoirs.
This paper aims to study the evolution of the physical and mechanical properties of coal subjected to salty solution. Firstly, coal samples from Ningdong mining area in western China are prepared to standard cylinders. A salty solution is prepared based on chemical test results of mine water. The scanning electron microscope and nuclear magnetic resonance technology are employed to study the changes in porosity, mass, and microstructure of coal samples for different soaking times. Then, uniaxial compression tests are carried out to obtain the stress–strain curves of coal samples for different soaking times. The effects of salty solution on the damage of coal samples are discussed. Moreover, a damage constitutive model for the coal samples is developed by introducing a chemical-stress coupling damage variable. The developed model is verified with the stress–strain curves from uniaxial compression tests.

2. Experimental Materials and Methods

2.1. Preparation of Coal Samples

The coal used in the test is taken from Lingxin coal mine in Ningdong Mining Area, China. The coal samples are drilled from the same coal block to ensure uniformity. According to the ISRM rock preparation standard [26], the coal samples are made into a standard cylinder with a diameter of 50 mm and a height of 100 mm. The unevenness of the two end faces should not exceed ±0.05 mm. The end face is perpendicular to the axis of the rock sample, and the allowable deviation is ±0.25°.

2.2. Salt Solution

Groundwater is a complex chemical solution containing various ionic components. The cations in the mine water retrieved from the Lingxin mining area were determined by using inductively coupled plasma atomic emission spectroscopy (ICP-OES 730, Agilent, Santa Clara, CA, USA) and the anions were tested by using Chromatograph (LC-2010 PLUS, SHIMADZU, Kyoto, Japan). The chemical test results are presented in Table 1. The main ion components of the mine water are Na+, SO42−, and Cl and the calculated concentration ratio is about 5:1:3. In this study, the mixed anions of SO42−-Cl and the cation Na+ are selected to study the degradation effect of the salty solution on coal samples. Since the water–coal reaction is a long-term process, we used a higher ion concentration in the configuration solution than that in mine water to shorten the experimental period. The ratio of the cation (Na+) to mixed anions (SO42−-Cl) is the same as the ratio in mine water. In the final salty solution, the concentration of sulfate ions is 0.1 mol/L, and the solution pH is 9. The chemical reagents used in this study are sodium chloride (≥99.5% purity), sodium sulfate (≥99% purity), and sodium hydroxide (≥96% purity) that are all made by Sinopharm Chemical Reagent Co. Ltd. (Shanghai, China). High-purity distilled water is used throughout the experiment.

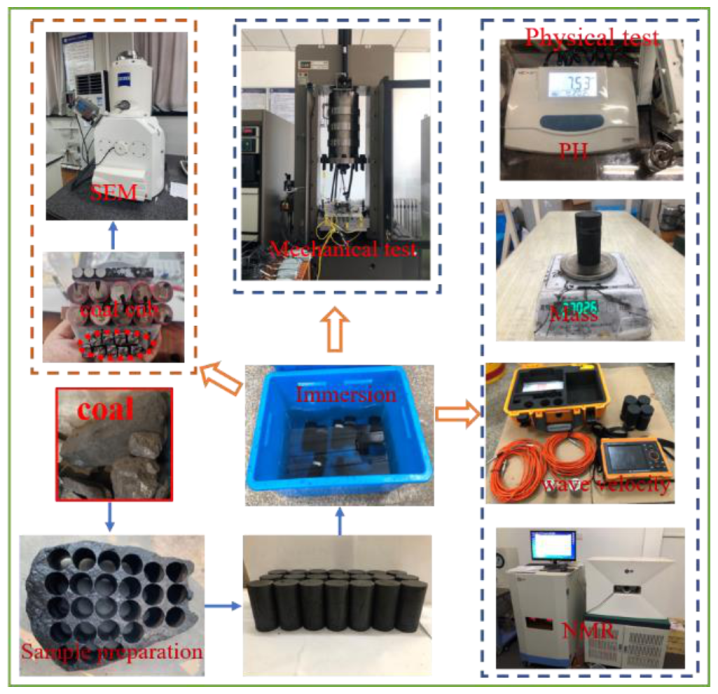
2.3. Experimental Procedure

After the coal samples were prepared, the longitudinal wave velocities of coal samples were measured to ensure uniformity of samples. The coal samples with close wave velocities were divided into seven groups (US1-US6 and P) according to the immersion time. Each group contained three samples, and a total of 21 samples were used for further experiments. The sample group US1-US6 were used for mechanical tests and the sample group P was used for physical tests. The coal samples were dried before immersion and the original mass were weighed. The solution was regularly agitated during the soaking process to make the coal and solution fully interact. During the soaking process, the pH value of the solution, the mass, the longitudinal wave velocity, and the porosity of the coal samples were measured, and the experimental temperature was 20 °C. The measurement time interval was determined according to the change rate of pH value of the salty solution. When the pH value of the solution becomes stable, it is considered that the water–coal interaction has reached a steady state. An acidity meter PHS-3E from China Shanghai INESA Scientific Instrument Co. Ltd. was used to measure the pH value of the solution. The accuracy of the acidity meter is 0.01. The longitudinal wave velocity was tested by a ZBL-U5200 non-metallic ultrasonic detector produced by China Beijing ZBL SCI & TECH Co. Ltd. An electronic scale with accuracy of 0.01 g was used for the measurement of coal mass. The sample group P was chosen for the mass and the longitudinal wave velocity test throughout the whole immersion time.
The coal sample P-2 was selected for the porosity test, and the evolution law of porosity throughout the immersion period was analyzed. The low-field nuclear magnetic resonance analyzer produced by China Suzhou Newmarket analytical instrument company was applied for porosity tests.
In order to understand the microscopic mechanism of the effect of salty solution on coal’s pore feature, SEM technology was used to analyze the microstructure of coal. The coal was cut into a 1 cm × 1 cm × 1 cm square piece to meet the requirements of the SEM sample size. In this study, the SEM of ZEISS EVO 18 (Jena, Germany) was used for the microscopy experiment. The related parameters are: acceleration voltage, 200 V–30 Kv; magnification times, 5–106 times; focused working distance, 2–145 mm; and sample size, diameter ≤ 250 mm, height ≤ 145 mm.
For the uniaxial compression tests, the MTS815 rock mechanics testing machine was applied. The maximum axial load of the MTS815 testing machine is 2700 kN. The ranges of the axial and circular extensometers are respectively 5 mm and 8 mm. A combination of stress loading and hoop displacement loading was adopted in the test. The loading rate is 100 N/s. When the axial load increases to 30 KN, it converts to displacement loading with a 0.01 mm/min loading rate. Figure 1 shows the detailed flow of experiments.

3. Results and Discussion

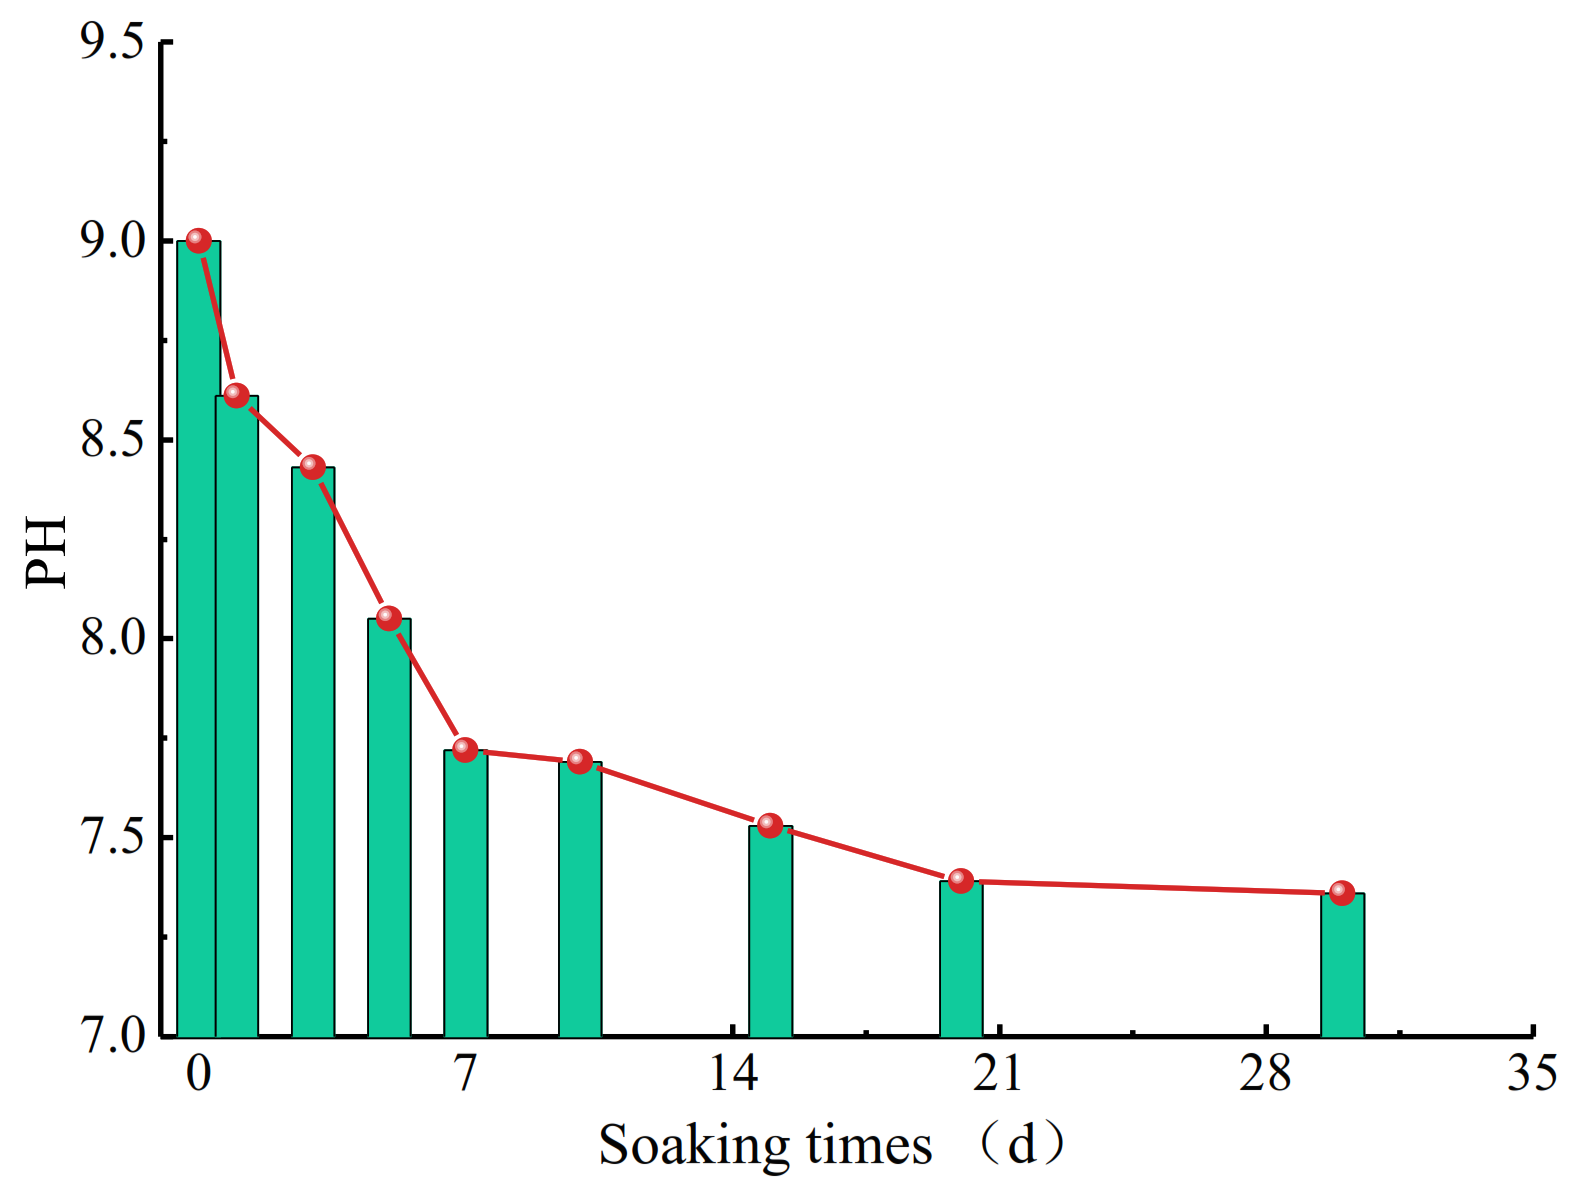
3.1. Changes in PH Values of Salt Solution

Figure 2 shows the relationship between the soaking times and pH value of the solution. It can be seen that as the soaking time increasing, the pH value of the solution gradually tends to be neutral, indicating that the PH value of the solution has the ability of self-balancing during the process of the water–rock interaction. The pH value of the solution first changed very obviously, and then the changing rate gradually decreased. This indicates that the water–rock interaction is time dependent, i.e., the water–rock reaction will gradually weaken with the increase in the soaking time, and eventually tend to be stable.

3.2. Variation Law of Longitudinal Wave Velocity of Coal Samples

Many studies have shown that the longitudinal wave velocity of rock samples is sensitive to the development of microstructures such as internal pores and defects [27,28,29,30,31,32]. In order to eliminate the errors caused by the differences in samples, the longitudinal wave velocity of the same sample was tested during the immersion period. Therefore, the changes in longitudinal wave velocity can be used to characterize the influence of salty solution on the damage to the internal microstructure of the coal samples.
The test results indicated that the longitudinal wave velocity of coal samples displays different degrees of deterioration with the increasing soaking times. In this paper, the change rate of longitudinal wave velocity (vcr) was used to characterize the damage law of vp caused by chemical corrosion. The larger the value of vcr, the higher the degree of damage. The expression of the change rate of vcr is shown as follows:
v c r = v p t v p 0 v p 0 × 100 %
In the above, vp0 and vpt are the longitudinal wave velocities of coal samples before and after the different soaking times.
Figure 3 displays the relationship between soaking times and vcr of sample P-2. As the soaking time increases, the longitudinal wave velocities of the coal sample exhibit a deteriorating trend. At the beginning of the test, the longitudinal wave velocity of coal samples deteriorated at a high rate and the water–coal reaction was violent, which caused the increase in pores of the coal sample. Macroscopically, the longitudinal wave velocity decreased to varying degrees. Table 2 displays the mass and vp of coal samples under different soaking times.

3.3. Mass Changes of Coal Samples

During the immersion process, the water–coal reaction dissolves the mineral components in the coal samples and finally changes the mass of the coal sample. The mass differences between the original dried samples and saturated samples with different soaking times were analyzed, which can indirectly reflect the water–coal process’s degradation law. The prepared coal samples were dried for 24 h with temperature of 50 °C and the original mass m0 were weighed. After different soaking times, the coal samples were taken out from the salt water, the moisture on the surface of the samples was wiped off, and the mass of the saturated samples (mt) were weighed. The relationship between the m0 and mt is shown as follows:
m 0 + m l m r = m t Δ m = m t m 0 = m l m r
where ml represents the mass of pore water inside the coal sample; mr represents the mass of the dissolved substance.
Figure 4 shows the relationship between soaking times and the relative mass difference of sample P-2. It can be seen that the relative mass difference of the coal sample increases rapidly at the beginning of the test, then gradually decreases. At the initial state of immersion, the solution diffuses through the pores accompanied by the water–coal reaction, but the mass of the immersed solution was obviously greater than that of the dissolved substance, which led to a rapid increase in the relative mass difference. As the soaking time increased, the coal sample reached a saturated state. The pore volume of the coal sample gradually increased with the dissolution, and the immersed solution in the pores continued to increase. However, the strong water–coal reaction made the mass of dissolved substance greater than that of the added immersion solution, which decreased the relative mass difference. After that, the interaction between solution and coal sample gradually weakened, and the variation range of relative mass difference gradually reduced.

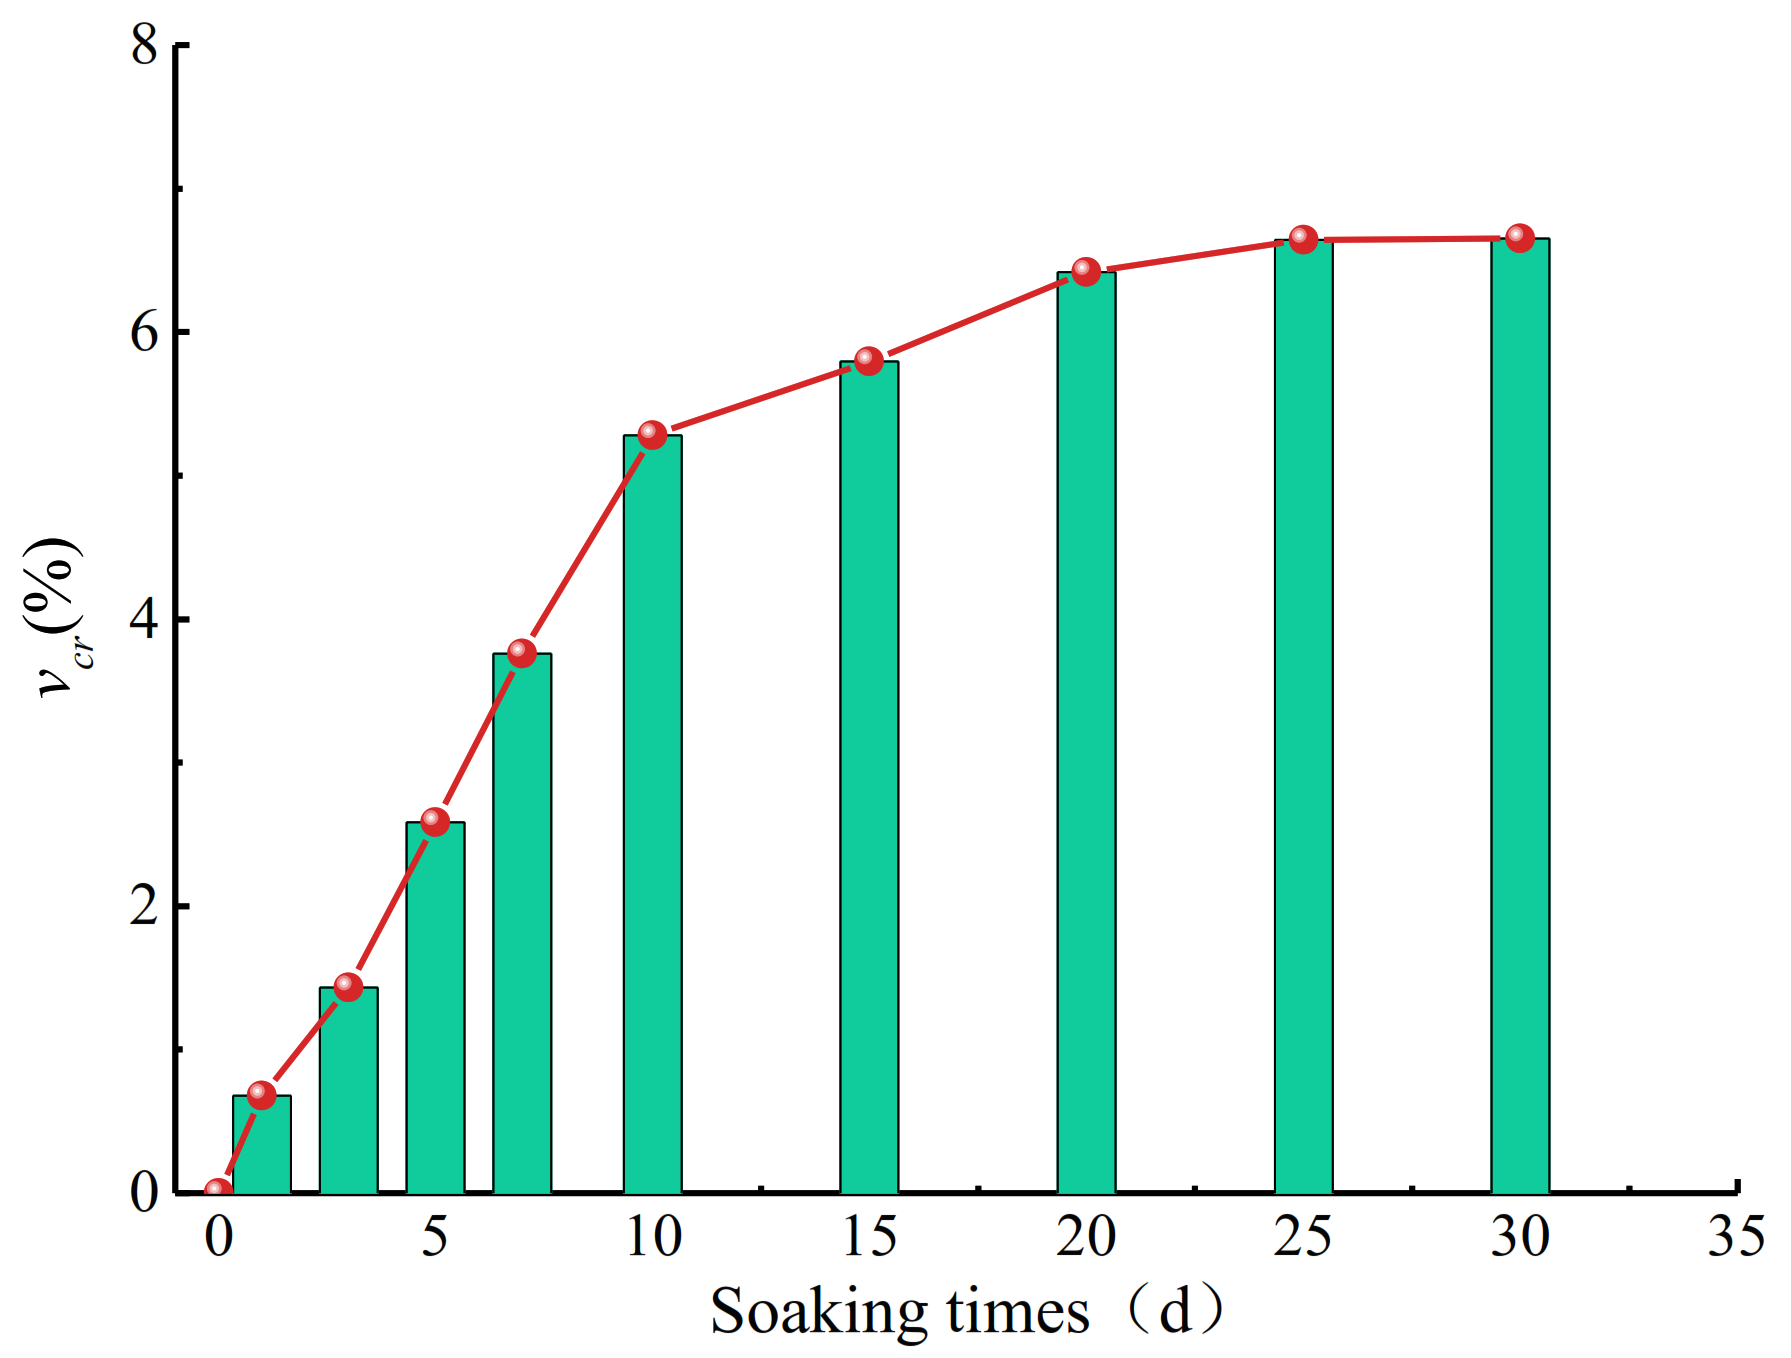
3.4. Porosity of Coal Samples

The nuclear magnetic resonance (NMR) method was used to observe the change of porosity and pore size distribution of coal samples under different soaking times. The signal source in the NMR test is hydrogen ion. Based on the hydrogen ion signal detected in the pores, the analysis software obtains the relaxation time (T2) and the initial magnetic field vectors of pores with different sizes through a special sequence (CPMG). Finally, the distribution of the relaxation time can be obtained through inversion. Different relaxation times represent different sizes of pores and the larger relaxation times represent larger pore sizes. The area of the relaxation peak in the T2 curves reflects the number of pores [33]. Equation (3) represents the relationship between T2 and parameters of pores [33].
1 / T 2 = ρ ( S / V ) = F s ( ρ / r )
where T2 represents the inversion relaxation time, ms; ρ represents lateral relaxation density, um/ms; S represents the surface area of pore, cm2; V represents pore volume, cm3; r represents pore size, nm; and Fs represents shape factor of pore.
Figure 5 exhibits the T2 distribution of coal samples under different soaking times. The pore structure of coal is divided into three regions: the adsorption pores with a pore size of 1–100 nm (corresponding T2 smaller than 2.5 ms), seepage pores with a pore size of 100–10,000 nm (corresponding T2 larger than 2.5 ms and smaller than 50 ms), and fractures with a pore size larger than 10,000 nm (corresponding T2 larger than 50 ms) [34,35,36,37]. Figure 5 shows that the T2 distribution of coal under different soaking times has a bimodal characteristic. After the immersion in salty solution, the T2 distribution curves of coal move towards the right, indicating that the immersion effect increases the connectivity of the micropores and results in the appearance of pores with larger sizes. The area of T2 distribution curves corresponding to the relaxation times of 0–2.5 ms, 2.5–50 ms, and 50 ms–1000 ms were calculated and the values represent the number of pores. Table 3 displays the pore number of coal samples after different soaking times. It is obvious that the number of seepage pores and fractures increased with the increase in soaking times. While the number of adsorption pores exhibits a trend of rapid increase first and then a slow decline. It is mainly because the small pores gradually connect to form larger pores in the later stage of immersion.
Under the effect of the water–coal interaction, the minerals in the coal sample dissolved, leading to increased porosity. Figure 6 shows the relationship curve between soaking times and porosity of coal sample.

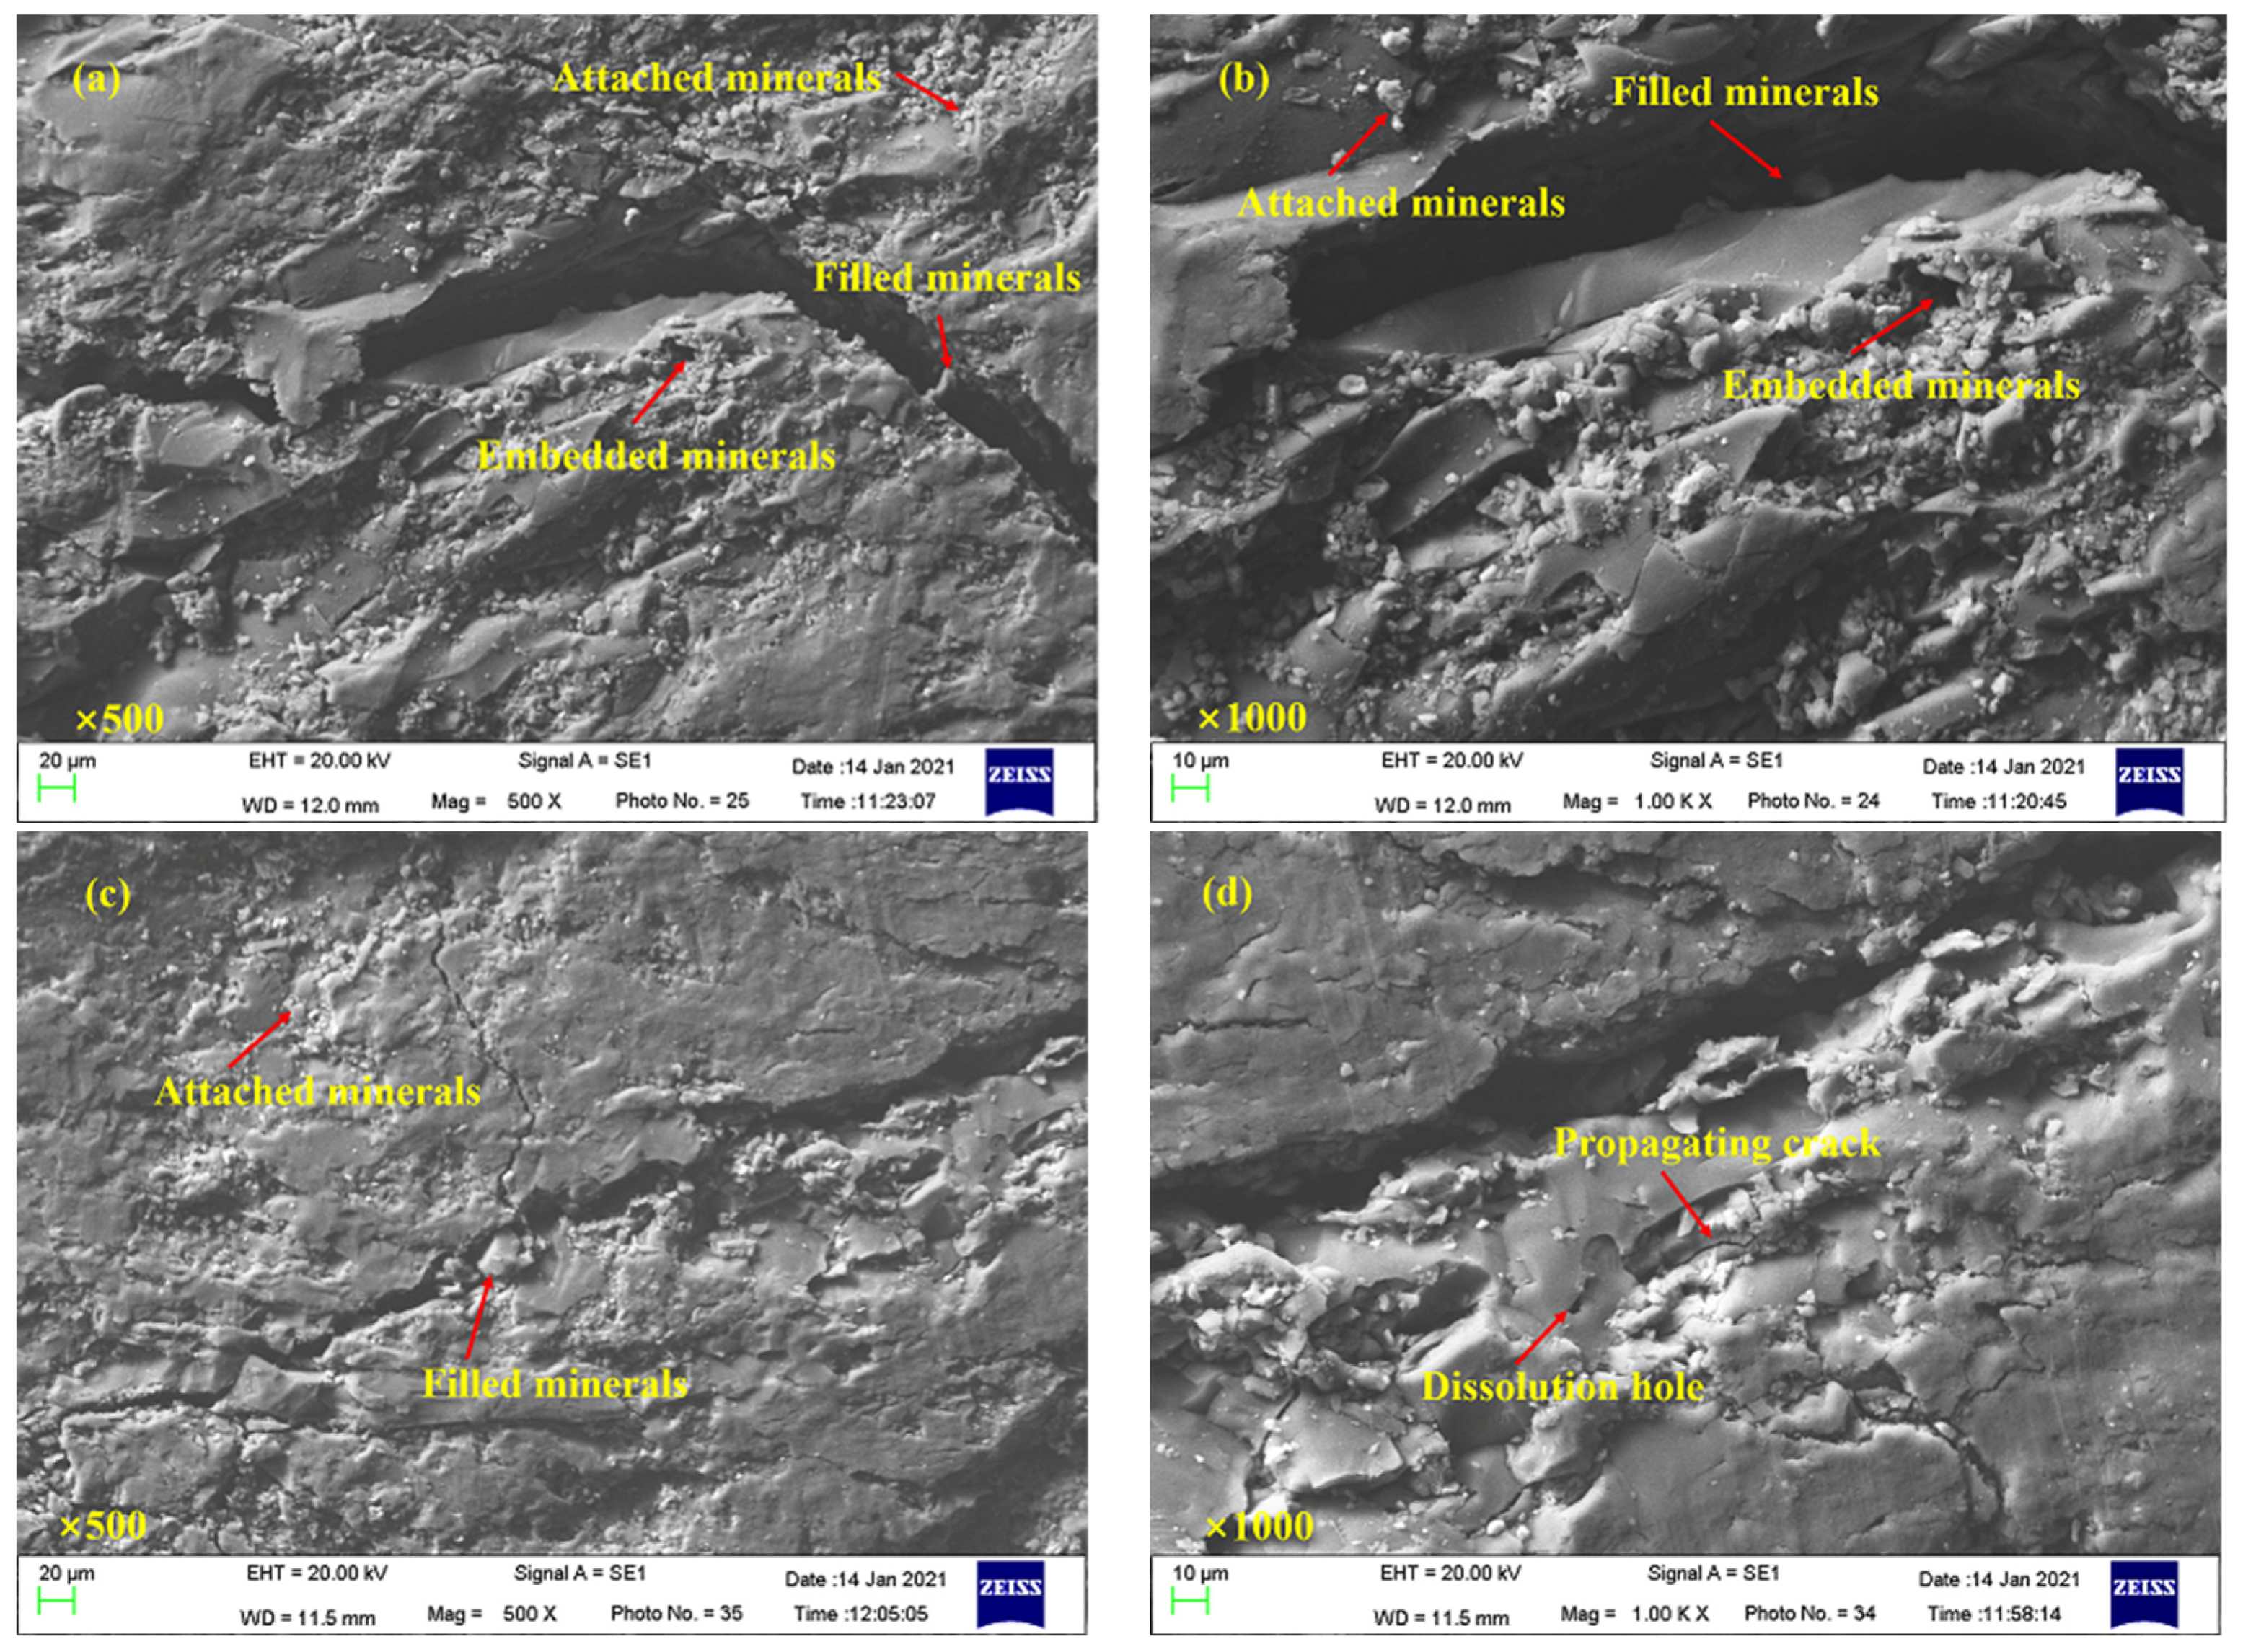
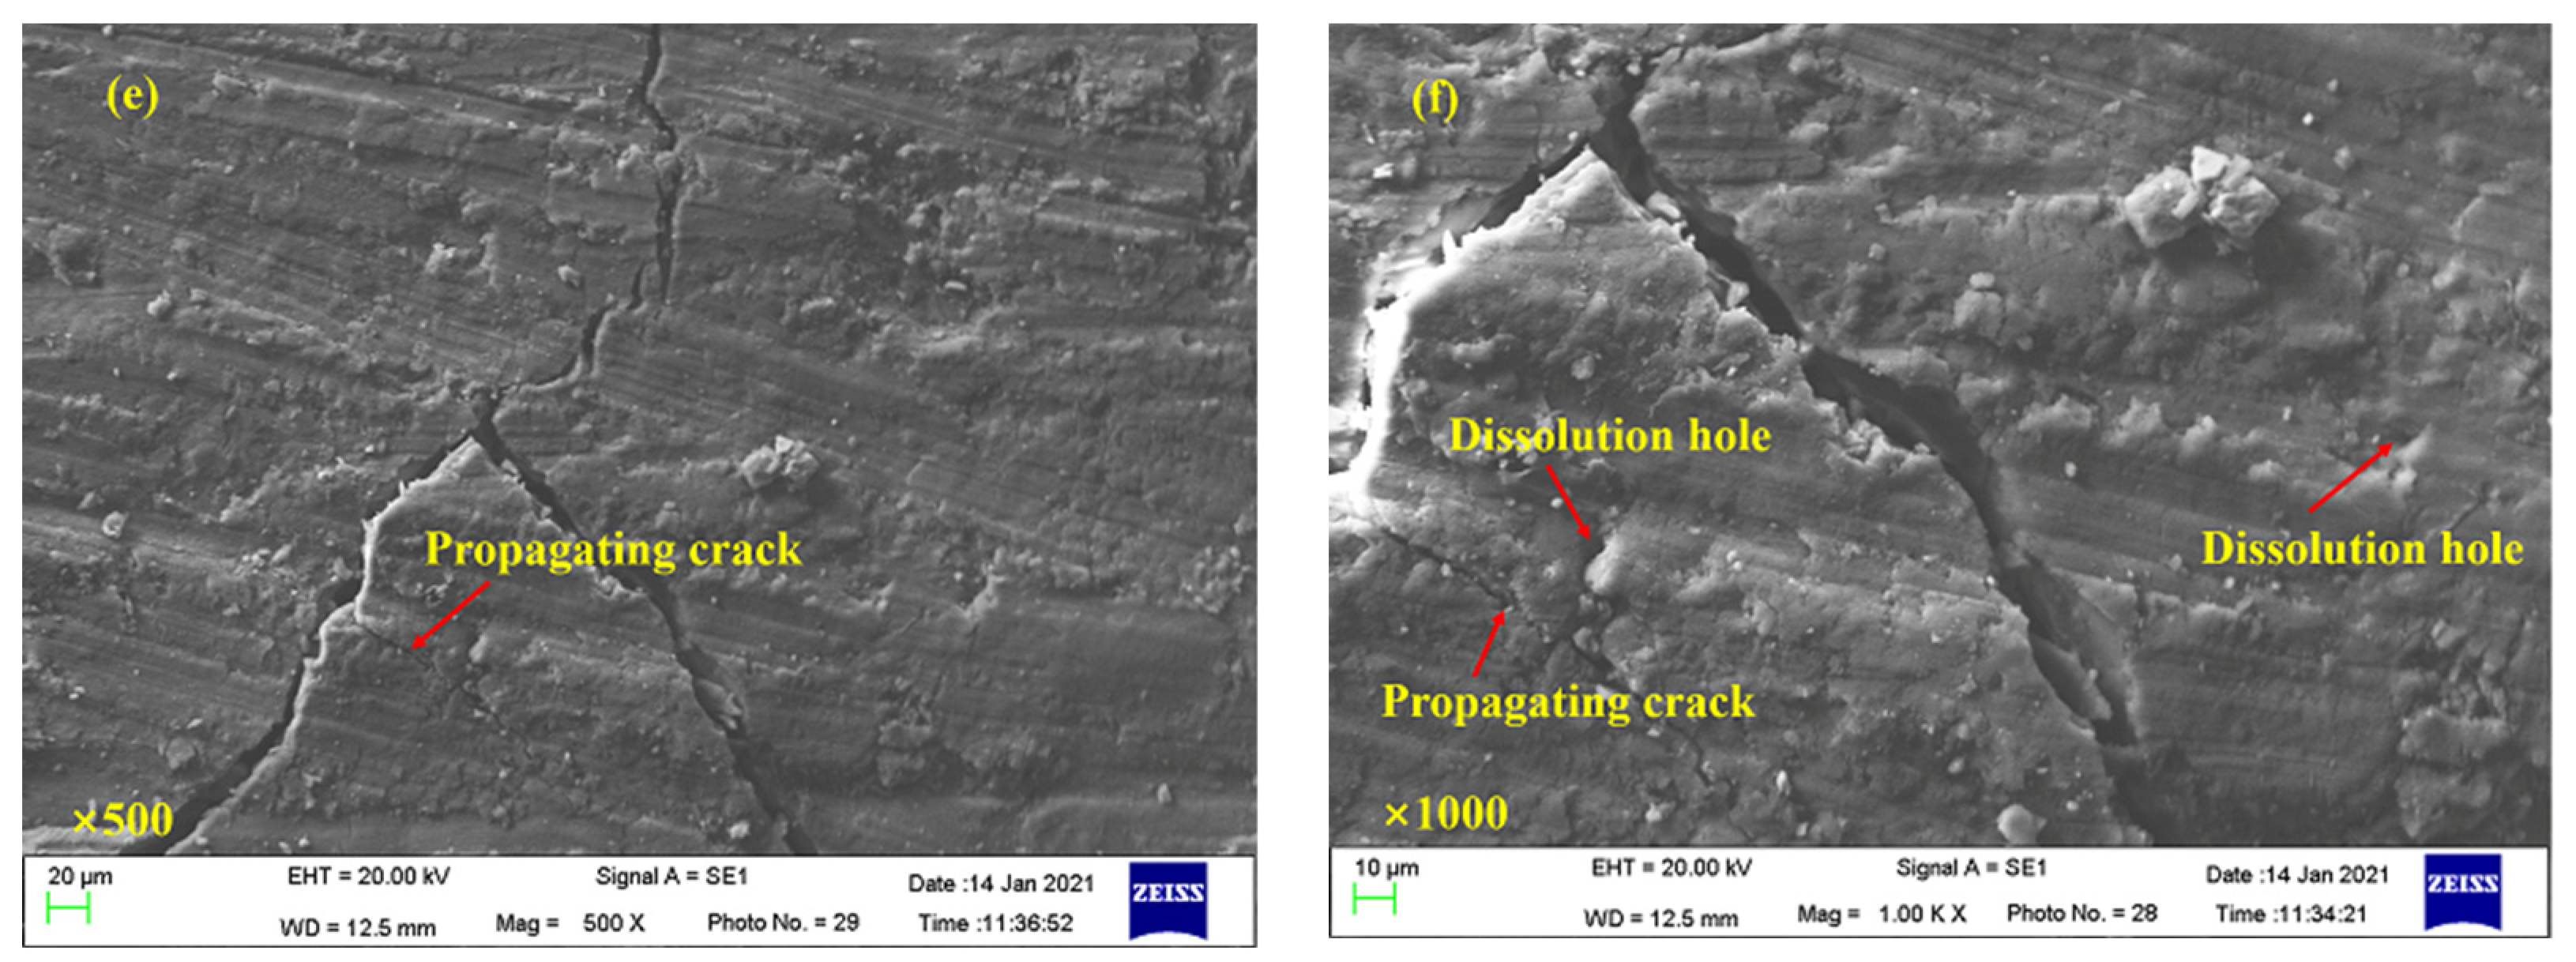
3.5. Microscopic Morphological Characteristics of Coal Samples

The structure of coal is very complex due to the many mineral components in the coal. During the immersion process, the salty solution and the coal undergo a series of water–rock reactions, which lead to the dissolution of minerals, changes in the microscopic structure, and the increase in microcracks inside the samples.
It can be seen from Figure 7 that a large number of mineral particles are distributed on the surface of the coal sample under the natural state. At the same time, it can be observed that microfractures and micropores exist on the surface of coal. Most pores are blocked by mineral components, resulting in poor connectivity between pores. After being soaked for different times, the coal samples showed different degrees of corrosion, and the microscopic morphology changed to a certain extent. As the immersion time increases, the number of mineral particles on the surface of the coal samples decreases significantly. The mineral particles originally embedded in the coal body were corroded into holes of different sizes. Under the effect of the salty solution, microfractures gradually appeared and connected with the internal structure. The number of pores and fractures in the coal samples increased after being soaked with the salty solution. At the same time, the strength of the coal samples will gradually decrease with the increasing number of pores and cracks.

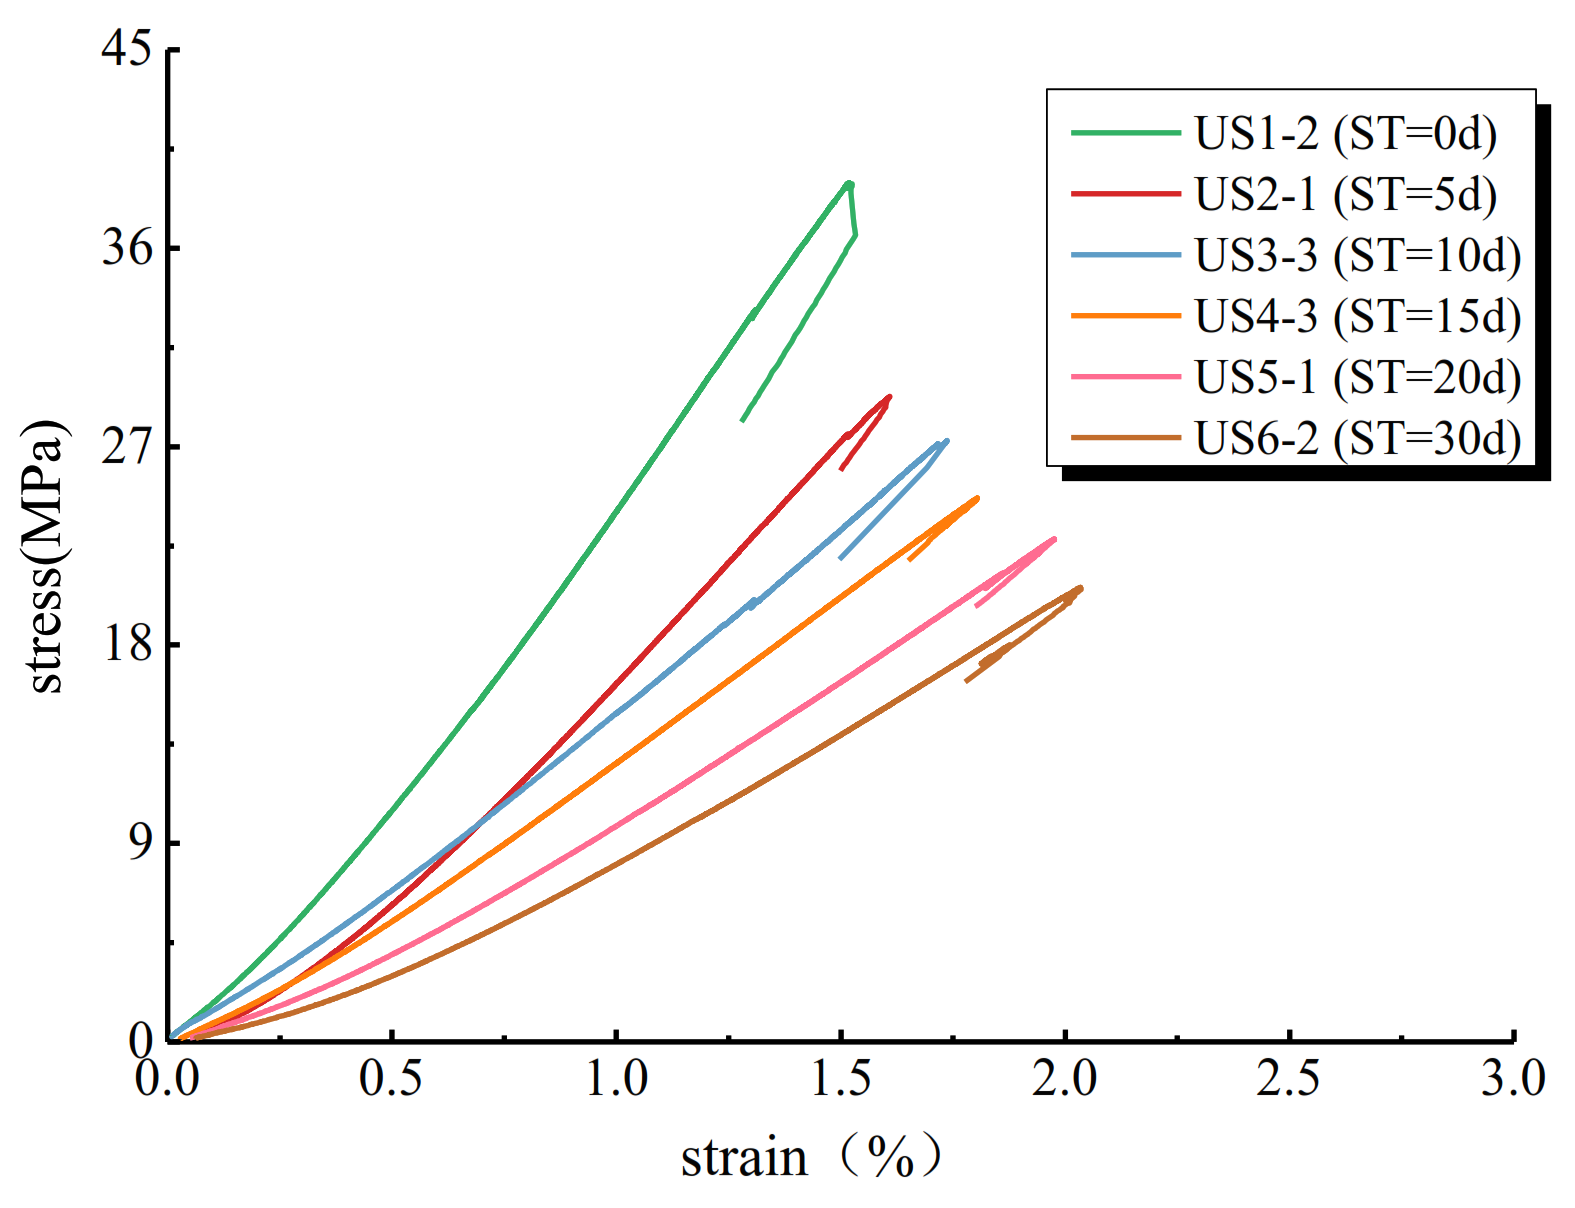
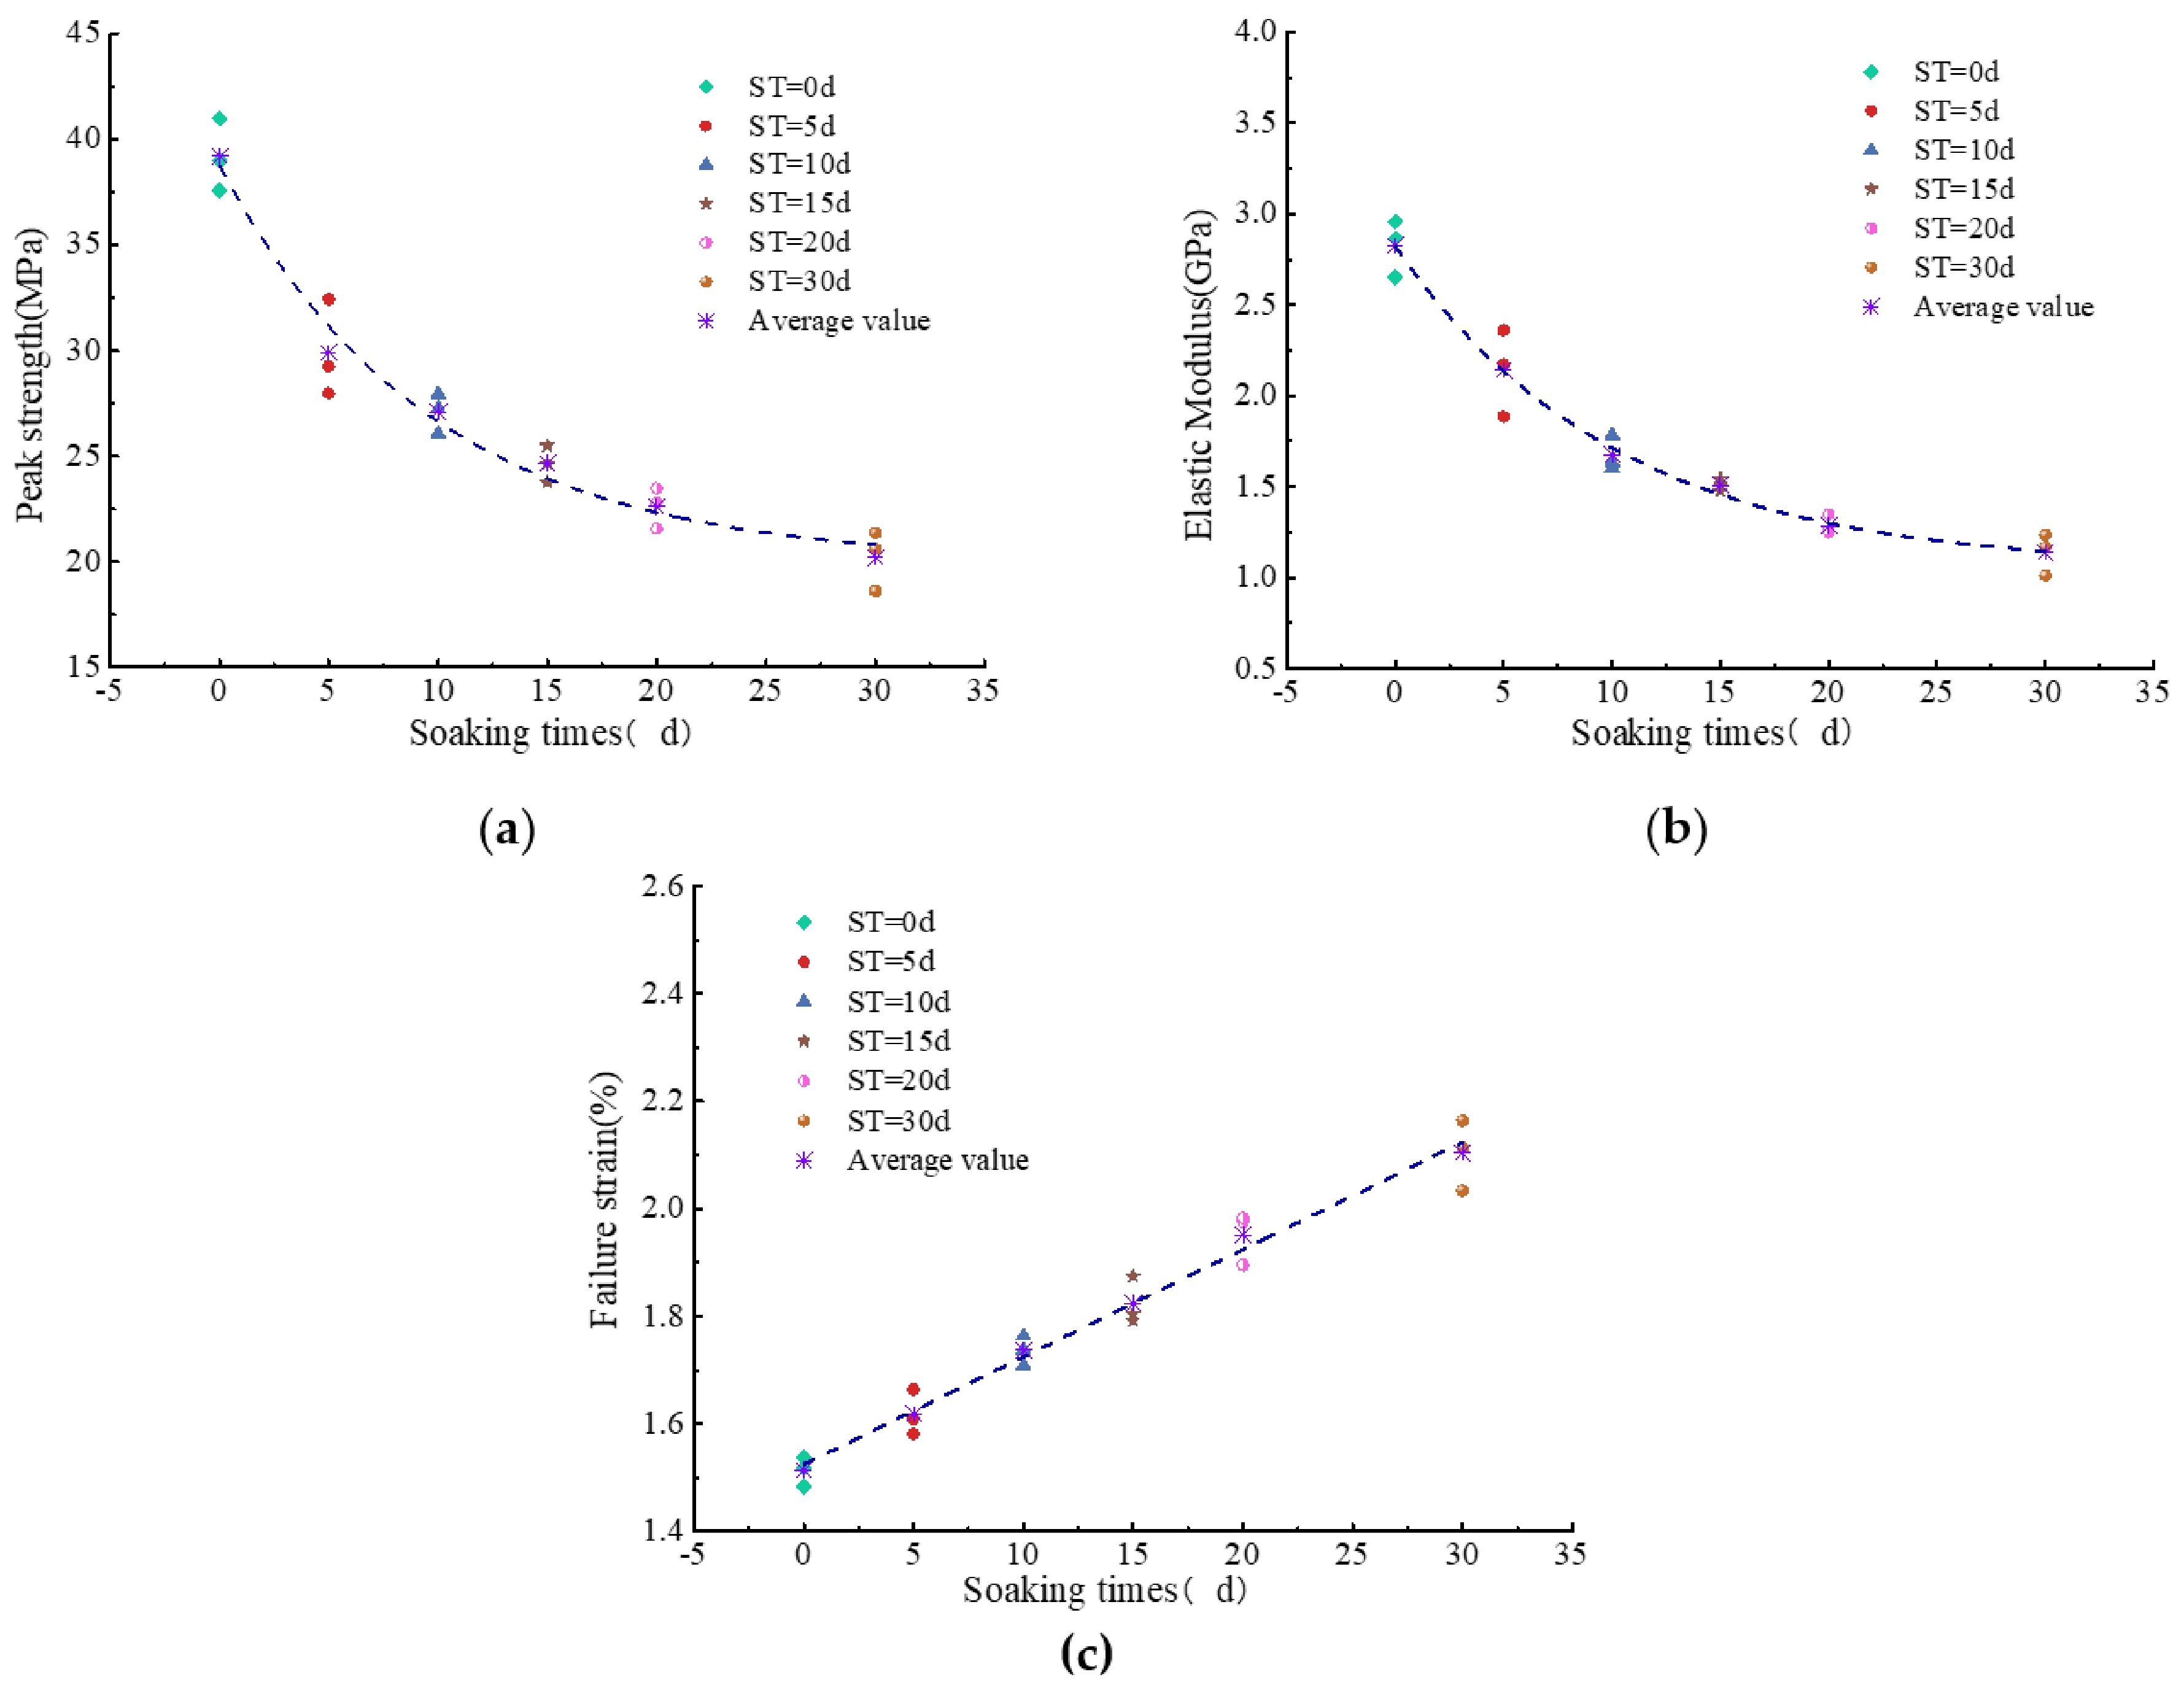
3.6. Mechanical Properties of Coal Samples

In the mechanical test, the stress and the strain of coal samples during the failure process were obtained. The stress–strain curves of coal samples for different soaking times (i.e., ST) are illustrated as Figure 8. The mechanical parameters calculated according to the stress–strain curve are shown in Table 4. It can be seen from Figure 8 that the compaction stage of the coal samples after immersion is longer than that of the natural state. As the soaking time increases, the compaction stage becomes longer. This is mainly because the internal defects such as pores and microfractures increased with the soaking time and more defects result in longer initial compaction stage of the stress–strain curve.
Figure 9 displays the relationship between soaking times and several mechanical parameters of coal samples. It appears that the peak strength and elastic modulus of the coal samples gradually decrease with the soaking time, while the failure strain exhibits an increasing trend with soaking time. The reduction in the peak strength of coal under the salty solution immersion is related to the adsorption of ions or molecules in the solution to the coal surface. The adsorbed ions or molecules on the coal surface reduce the surface energy and its fracture strength. The result manifests that the immersion of salty solution significantly influences the mechanical properties at the initial state, and the declining amplitude becomes smaller with the increasing soaking time.

4. Statistical Damage Constitutive Relationship of Coal Samples under the Coupling Action of Salty Solution and Uniaxial Compression

4.1. Damage Constitutive Relationship and Damage Evolution Equation under Uniaxial Compression

According to the principle of strain equivalence [38,39], the strain produced by the damaged material under the stress σ is equivalent to the strain produced by the undamaged material under the effective stress σ′.
ε = σ E = σ E = σ E 0 1 D s
In the above, σ and σ′ are nominal stress and effective stress, respectively; ε is strain; E0 is the elastic modulus of the sample in the initial state; E′ is the elastic modulus of the sample in a damaged state; and Ds is the damage variable under loading.
According to Equation (4), the damage constitutive model of coal samples during uniaxial compression can be obtained as follows:
σ = E ε 1 D s
The rock material contains various defects, and the microstructure is nonuniform. The random distribution of these defects in the rock causes the damage to distribute randomly inside the rock during the compression process, resulting in great differences in the mechanical properties of the rock [40,41]. It can be considered that the mechanical properties of the rock are a random variable. The rock can be divided into micro-element bodies containing several defects, and the relationship between the statistical distribution density of material failure and the damage variable is assumed as in [41].
d D s = P ε d ε
There, P(ε) is a measure of the damage rate of the micro-element body during the loading process and F is the strength parameters of rock micro-element body.
Assuming that the strength of the micro-element body obeys the Weibull distribution during the loading process, the probability density function can be expressed as in [41].
P ε = m ε 0 ε ε 0 m 1 exp ε ε 0 m
In the above, ε0 is the average value of the strength of the micro-element body, and m is the shape factor of the distribution function, representing the uniformity of the rock material.
Substituting Equation (7) into Equation (6), the internal damage evolution equation during compression can be obtained as:
d D s = P ε d ε = m ε 0 ε ε 0 m 1 exp ε ε 0 m d ε
D s = 0 ε m ε 0 ε ε 0 m 1 exp ε ε 0 m d ε = 1 exp ε ε 0 m
Substituting Equation (9) into Equation (5), the damage constitutive relation of rock under uniaxial compression is:
σ = E ε 1 D s = E ε exp ε ε 0 m
The stress–strain relationship curve of the rock should meet the following boundary conditions:
ε = 0 ,   σ = 0 D s = 0 , d σ / d ε = 0 σ = σ p ,   ε = ε p ε = ε p ,   d σ / d ε = 0
In the above, σp and εp are the peak stress and peak strain of the rock, respectively.
By combining Equations (10) and (11), the following Equation can be obtained:
m = 1 ln E ε p σ p ε 0 = ε p 1 / m 1 / m
Substituting Equation (12) into Equation (9), the damage evolution Equation of the rock is obtained as:
D s = 1 exp 1 m ε ε p m
Substituting Equation (13) into Equation (10), the damage constitutive Equation of the rock can be obtained:
σ = E ε 1 D s = E ε exp 1 m ε ε p m

4.2. The Chemical Damage Variable under the Action of Salty Solution

The damage of the coal sample after immersion in salt solution includes not only the load damage, but also the chemical damage caused by the immersion. According to the principle of strain equivalence, the constitutive relationship of the internal damage of the coal sample after immersion in the salt solution is expressed as:
σ = 1 D c E 0 ε
There, E0 is the elastic modulus of a sample in the initial state and Dc is defined as the chemical damage variable under salt solution immersion.
According to Equation (15), the expression of Dc can be obtained:
E c = 1 D c E 0
D c = 1 E c E 0
In the above, Ec is the elastic modulus of a coal sample after immersion in salty solution.
Figure 10 shows the relationship between the average values of chemical damage variable and immersion time. With the increase in the immersion time, the chemical damage variable of the coal sample firstly grows rapidly, and then the growth rate gradually slows down. By fitting the test data of the damage variable, the relationship expression between the chemical damage variable and the immersion time is obtained as shown in Equation (18). Under the action of the salty solution, the chemical damage variable of the coal sample is in an exponential relationship with the immersion time and the correlation coefficient is 0.977. The increase in immersion time causes more accumulated damage inside the coal sample, resulting in the deterioration of the coal sample’s compressive strength.
D c = 0.582 0.712 × 0.862 t   R 2 = 0.977

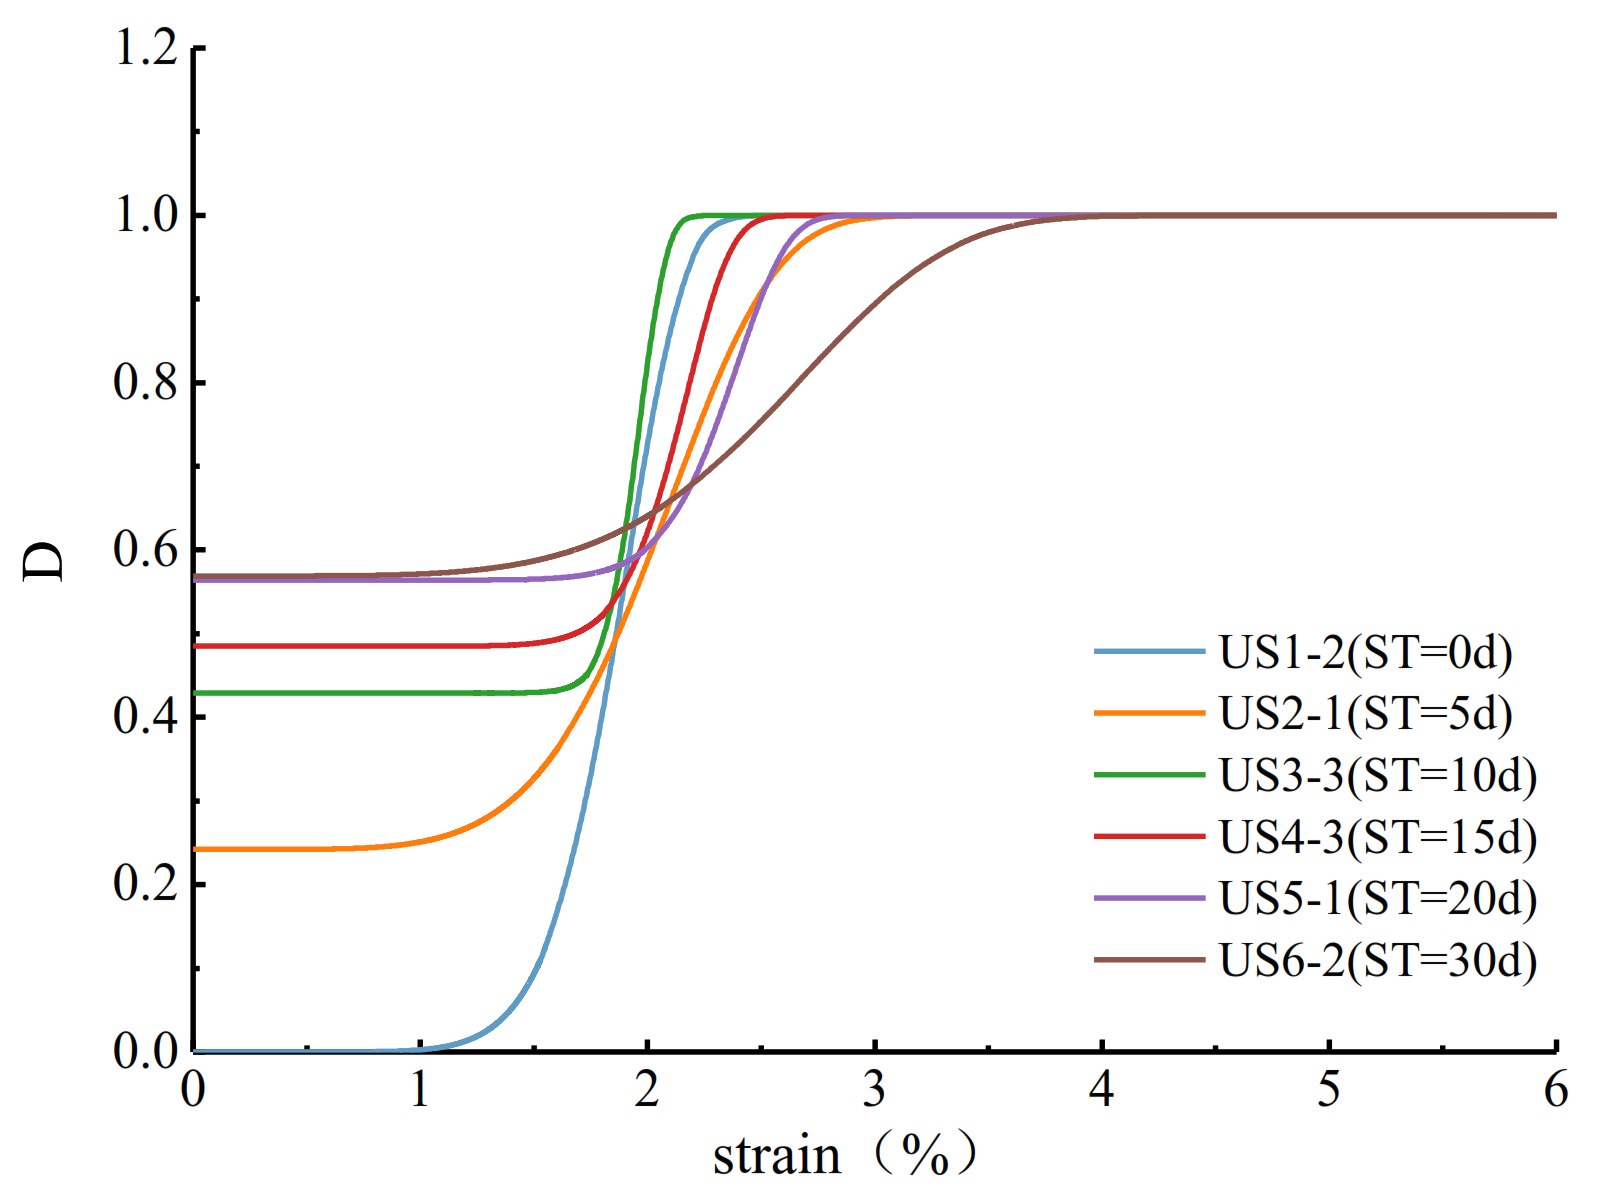
4.3. The Damage Evolution Law under the Coupling Action of Uniaxial Compression and Salty Solution Immersion

The failure of the salty solution immersed coal sample under the action of the uniaxial load is caused by the mutual coupling and mutual influence of chemical damage and load damage. For the coal sample after soaking in salty solution, the total damage consists of two parts. The chemical damage caused by the salty solution immersion is considered as the first type of damage, and the damage caused by the load is regarded as the second type of damage.
σ = 1 D s E c ε
Substituting Equation (16) into Equation (19), the damage constitutive relationship of the coal sample under the coupling effect of salty solution immersion and uniaxial load can be obtained.
σ = 1 D s 1 D c E 0 ε
The total damage variable D under the coupling action of chemical and load is expressed as Equation (21):
D = D s + D c D s D c
Combing Equations (13), (17), and (21), the final form of total damage variable D is shown as Equation (22):
D = 1 E c E 0 exp 1 m ε ε p m
The typical damage evolution curve under the coupling action of salty solution corrosion and uniaxial compression is shown in Figure 11. The damage degree of the specimen gradually increases with the increase in axial strain. The damage evolution of the coal sample under the coupling action of salty solution corrosion and load has obvious nonlinear characteristics. In the initial stage of compression, the internal microcracks and pores of the specimen are compressed. The degree of damage in the compaction stage is relatively small, resulting in a linear damage evolution curve. The continued action of the external load leads to the expansion of the microcracks, and increases the damage of the internal structure. Finally, crack penetration caused the specimen to be destroyed. Comparing the length of the linear section of the damage evolution curve, it is found that the length of the linear section of the curve gradually increases with the increase in the immersion time. It indicates that the porosity inside the coal sample increases with the increase in immersion time, resulting in the linear segment being more pronounced.

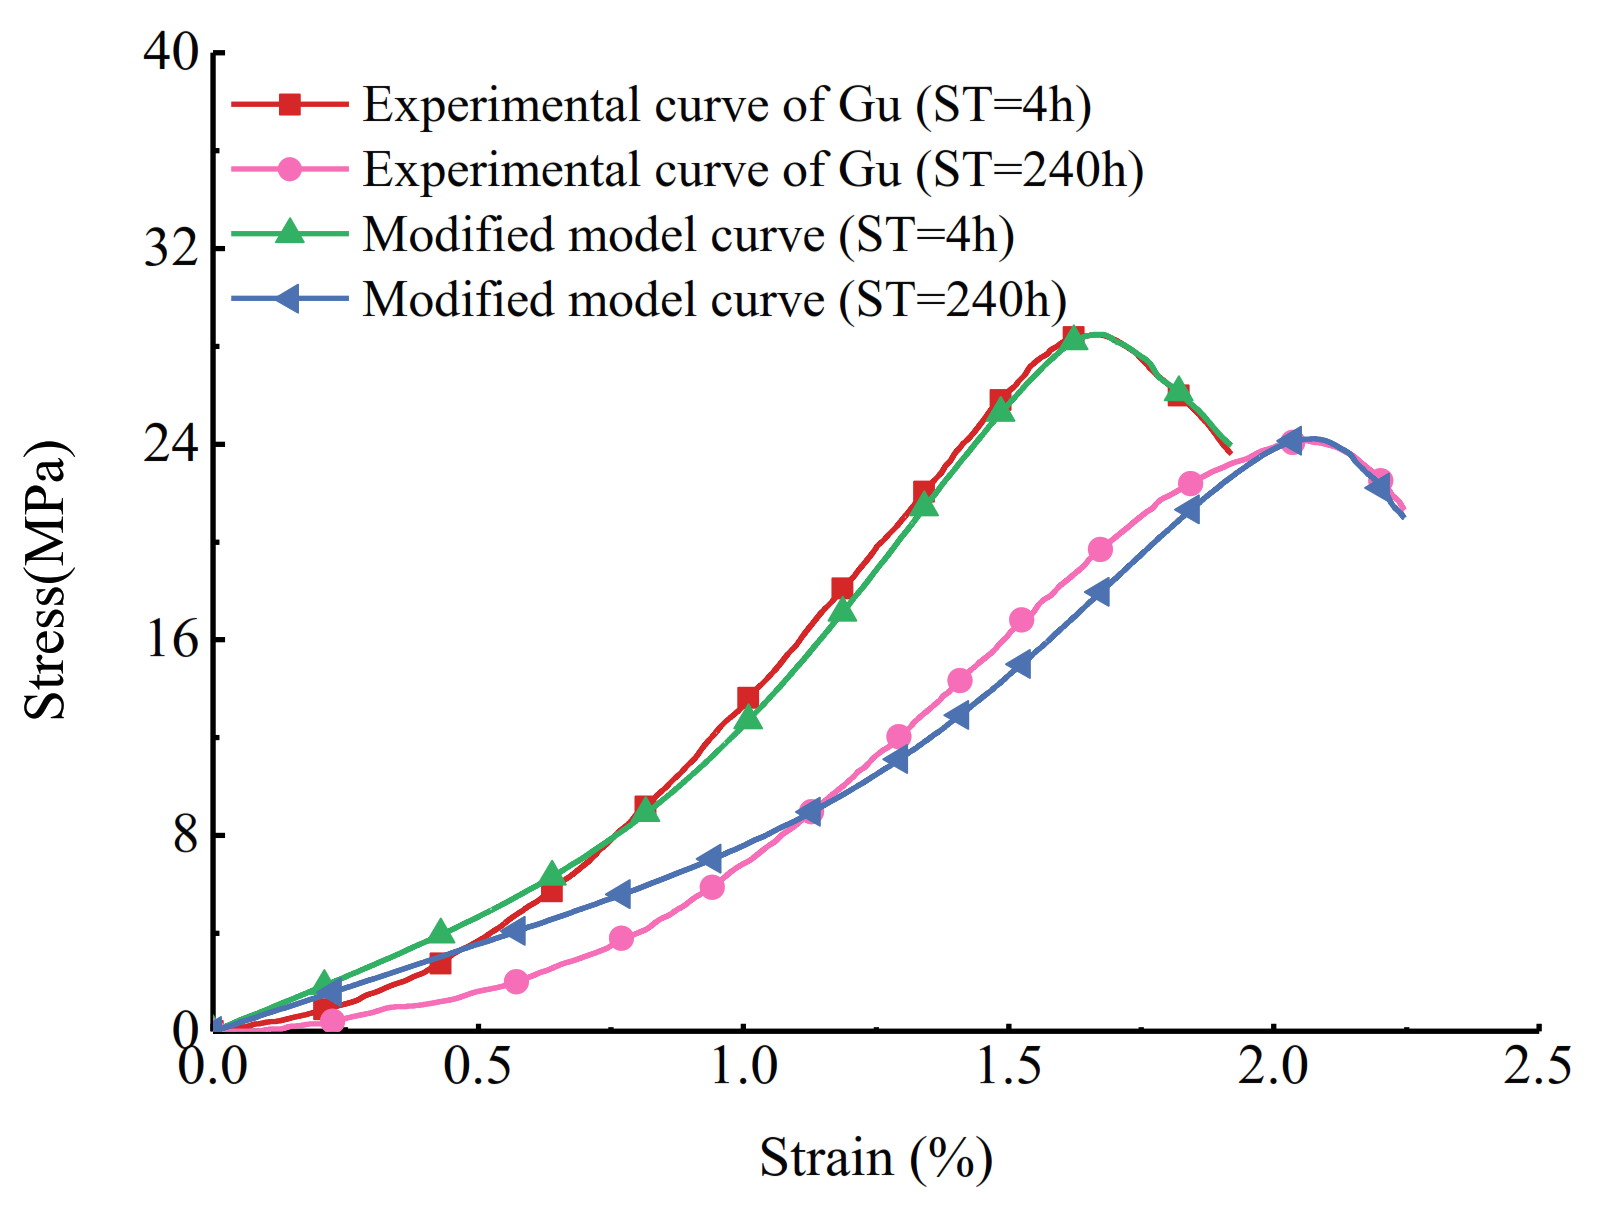
4.4. Damage Constitutive Model Considering Chemical-Stress Coupling Factor

Combining Equations (12) and (20)–(22), the damage constitutive equation of the coal sample under the coupling action of chemical and uniaxial load can be expressed as Equation (23):
σ = E c ε exp 1 m ε ε p m m = 1 ln E c ε p σ p ε 0 = ε p m 1 / m
In order to verify the damage constitutive model of the coal sample under the coupling effect of salty solution immersion and the uniaxial load, the stress–strain curve of the uniaxial test was compared with the curve obtained by the damage constitutive which is expressed as Equation (23). The damage constitutive curve is shown as the dotted line in Figure 12. It is found that the unmodified damage constitutive relationship curve is in poor agreement with the test curve. The characteristics of the stress–strain curve caused by the corrosion of the salty solution are not well described by using the unmodified damage constitutive (Equation (23)). Further, a chemical-stress coupling factor μ was proposed to modify the damage constitutive. Literature [42] has introduced a thermal-mechanical coupling factor in the damage constitutive model to display the damage process of rock under high temperatures. Like the rock treated with high temperature, the number of pores and cracks in the coal sample increased under the effect of the corrosion of salty solution. This leads to an increase in the length of the compaction stage. In this study, the expression of chemical-stress coupling factor μ refers to that in literature [42]. The expression of coupling factor μ and modified damage constitutive model are expressed as follows:
μ = μ 0 + A exp 2 ε ε p 2 / ω 2 / ω π / 2
σ = μ 1 D s 1 D c E 0 ε
In the above, εp is the peak strain, μ0 is the lower limit of the chemical-stress coupling factor, A is the integrated area of the function curve above the baseline, and ω is the standard deviation of the function, which indicate the concentration of the chemical-stress coupling effect. The related parameters (μ0, A, w) in coupling factor μ need to be determined by fitting the experimental data. The fitting parameters of coupling factor μ are shown in Table 5.
As shown in Figure 12, the modified damage constitutive relationship (Equation (25)), considering the chemical-stress coupling factor μ, is in good agreement with the test results and the change of compaction stage can be well described. In addition, the experimental data of Gu [10] were applied to verify the effectiveness of the modified damage constitutive model. The mechanical response of coal under different soaking times was analyzed in Gu’s study. Figure 13 displays the verification of the modified damage constitutive model with the experimental data of Gu. It is obvious that the modified model is highly consistent with the test curve. The modified model well described the stress–strain curves of coal under the different soaking times.

5. Conclusions

In this paper, physical and mechanical tests were carried out on coal samples subjected to a salty solution. The degradation mechanisms of the physical and mechanical properties of the coal samples were studied. A damage constitutive model for coal subjected to the salty solution under uniaxial compression was proposed by introducing the chemical-stress coupling factor. The relevant results are summarized as follows:
(1) The physical characteristics of coal under the action of salty solution show varying degrees of deterioration. Under the attack of salty solution, the relative mass difference of the coal samples displays an increasing trend at the beginning of the test, then gradually decreases. With the increase in immersion time, the pH value gradually tends to be neutral. The mineral particles of coal samples are dissolved by the salty solution, resulting in aggravated chemical damage to the microstructure and an increase in the coal sample’s porosity.
(2) The microstructure morphology of coal samples for different immersion times were analyzed. With the effect of the salty solution, the microscopic morphology has changed to a certain extent. As the immersion time increases, the number of mineral particles on the surface of the coal decreases significantly and the connectivity of the internal structure increases.
(3) The peak strength and elastic modulus of the coal samples changes exponentially as a function of soaking time. The failure strain exhibits an increasing trend with soaking time. As the soaking time increases, the initial damage of the coal sample increases exponentially. According to the theory of damage mechanics, the chemical-stress coupling damage variable was introduced, and the variation law of the coupled damage variable with time was obtained. Under the effect of salty solution, the changes of the stress–strain curve can be well described by modified damage constitutive model that considers the coupling factor μ.
In the present study, the deterioration mechanism of coal under the action of salty solution was studied and a damage model for coal subjected to the salty solution under uniaxial compression was proposed. The modified damage model can well describe the changes in the compaction stage of the stress–strain curve caused by the water–rock reaction. The pre-peak behavior can also be well described by the modified model. However, the post-peak behavior cannot be fully characterized. In order to fully describe the mechanical behavior during rock failure, it is necessary to characterize the post-peak behavior. We will focus on this issue in future work.

Author Contributions

Conceptualization, methodology, formal analysis, software, validation, writing—original draft preparation, M.W.; writing—review and editing, Q.G.; supervision, project administration, Y.T.; funding acquisition, Q.G. and B.D. All authors have read and agreed to the published version of the manuscript.

Funding

This work was supported by the Open Fund of the Key Laboratory of Western Mine Exploitation and Hazard Prevention, Ministry of Education (SKLCRKF1901), Open Fund of State Key Laboratory of Water Resource Protection and Utilization in Coal Mining (grant no. GJNY-18-73.11), the National Natural Science Foundation of China (grant no. 51804163).

Institutional Review Board Statement

Not applicable.

Informed Consent Statement

Not applicable.

Data Availability Statement

Not applicable.

Conflicts of Interest

The authors declare no conflict of interest.

References

  1. Hamawand, I.; Yusaf, T.; Hamawand, S.G. Coal seam gas and associated water: A review paper. Renew. Sustain. Energy Rev. 2013, 22, 550–560. [Google Scholar] [CrossRef]
  2. Gu, D.Z.; Li, J.F.; Cao, Z.G.; Wu, B.Y.; Jiang, B.B.; Yang, Y.; Yang, J.; Chen, Y.P. Technology and engineering development strategy of water protection and utilization of coal mine in China. J. China Coal Soc. 2021, 46, 3079–3089. (In Chinese) [Google Scholar]
  3. Xu, H.; Lai, X.; Zhang, S.; Zhang, Y.; Shan, P.; Zhang, X.; Liu, B.; Wan, P. Multiscale Intelligent Inversion of Water-Conducting Fractured Zone in Coal Mine Based on Elastic Modulus Calibration Rate Response and Its Application: A Case Study of Ningdong Mining Area. Lithosphere 2021, 2021. [Google Scholar] [CrossRef]
  4. Gu, D.Z. Theory framework and technological system of coal mine underground reservoir. J. China Coal Soc. 2015, 40, 239–246. (In Chinese) [Google Scholar]
  5. Dyke, C.; Dobereiner, L. Evaluating the Strength and Deformability of Sandstones; Geological Society of London: London, UK, 1991. [Google Scholar]
  6. Hawkins, A.B.; McConnell, B.J. Sensitivity of sandstone strength and deformability to changes in moisture content. Q. J. Eng. Geol. Hydrogeol. 1992, 25, 115–130. [Google Scholar] [CrossRef]
  7. Vasarhelyi, B. Statistical Analysis of the Influence of Water Content on the Strength of the Miocene Limestone. Rock Mech. Rock Eng. 2004, 38, 69–76. [Google Scholar] [CrossRef]
  8. Erguler, Z.; Ulusay, R. Water-induced variations in mechanical properties of clay-bearing rocks. Int. J. Rock Mech. Min. Sci. 2008, 46, 355–370. [Google Scholar] [CrossRef]
  9. Zhao, Y.; Liu, S.; Jiang, Y.; Wang, K.; Huang, Y. Dynamic Tensile Strength of Coal under Dry and Saturated Conditions. Rock Mech. Rock Eng. 2015, 49, 1709–1720. [Google Scholar] [CrossRef]
  10. Gu, H.; Tao, M.; Li, X.; Li, Q.; Cao, W.; Wang, F. Dynamic response and failure mechanism of fractured coal under different soaking times. Theor. Appl. Fract. Mech. 2018, 98, 112–122. [Google Scholar] [CrossRef]
  11. Gu, H.; Tao, M.; Li, X.; Cao, W.; Li, Q. Dynamic tests and mechanical model for water-saturated soft coal with various particle gradations. Int. J. Rock Mech. Min. Sci. 2020, 132, 104386. [Google Scholar] [CrossRef]
  12. Karfakis, M.G.; Akram, M. Effects of chemical solutions on rock fracturing. Int. J. Rock Mech. Min. Sci. Geomech. Abstr. 1993, 30, 1253–1259. [Google Scholar] [CrossRef]
  13. Feucht, L.; Logan, J.M. Effects of chemically active solutions on shearing behavior of a sandstone. Tectonophysics 1990, 175, 159–176. [Google Scholar] [CrossRef]
  14. Feng, X.; Ding, W.X. Coupled chemical stress processes in rock fracturing. Mater. Res. Innov. 2011, 15, s547–s550. [Google Scholar] [CrossRef]
  15. Feng, X.-T.; Chen, S.; Zhou, H. Real-time computerized tomography (CT) experiments on sandstone damage evolution during triaxial compression with chemical corrosion. Int. J. Rock Mech. Min. Sci. 2004, 41, 181–192. [Google Scholar] [CrossRef]
  16. Feng, X.-T.; Ding, W. Experimental study of limestone micro-fracturing under a coupled stress, fluid flow and changing chemical environment. Int. J. Rock Mech. Min. Sci. 2007, 44, 437–448. [Google Scholar] [CrossRef]
  17. Han, T.; Wang, X.; Li, Z.; Li, D.; Xing, F.; Han, N. Laboratory investigation of the mode-I fracture of sandstone caused by a combination of freeze-thaw cycles and chemical solutions. Bull. Int. Assoc. Eng. Geol. 2020, 79, 3689–3706. [Google Scholar] [CrossRef]
  18. Hutchinson, A.; Johnson, J.; Thompson, G.; Wood, G.; Sage, P.; Cooke, M. Stone degradation due to wet deposition of pollutants. Corros. Sci. 1993, 34, 1881–1898. [Google Scholar] [CrossRef]
  19. Qiao, L.; Wang, Z.; Huang, A. Alteration of Mesoscopic Properties and Mechanical Behavior of Sandstone Due to Hydro-Physical and Hydro-Chemical Effects. Rock Mech. Rock Eng. 2016, 50, 255–267. [Google Scholar] [CrossRef]
  20. Lin, Y.; Gao, F.; Zhou, K.; Gao, R.; Guo, H. Mechanical Properties and Statistical Damage Constitutive Model of Rock under a Coupled Chemical-Mechanical Condition. Geofluids 2019, 2019, 1–17. [Google Scholar] [CrossRef]
  21. Xie, S.; Shao, J.; Xu, W. Influences of chemical degradation on mechanical behaviour of a limestone. Int. J. Rock Mech. Min. Sci. 2011, 48, 741–747. [Google Scholar] [CrossRef]
  22. Li, H.; Zhong, Z.; Liu, X.; Sheng, Y.; Yang, D. Micro-damage evolution and macro-mechanical property degradation of limestone due to chemical effects. Int. J. Rock Mech. Min. Sci. 2018, 110, 257–265. [Google Scholar] [CrossRef] [Green Version]
  23. Ozdemir, O.; Taran, E.; Hampton, M.; Karakashev, S.; Nguyen, A. Surface chemistry aspects of coal flotation in bore water. Int. J. Miner. Process. 2009, 92, 177–183. [Google Scholar] [CrossRef]
  24. Zhang, Y.; Zhu, H.; Zhu, J.; Yang, F.; He, H.; Qin, Z.; Shi, Q.; Pan, G. Experimental and emulational study on the role of ion in coal adsorbing kerosene: Water–kerosene interface and catenoid characteristics. Fuel 2021, 294, 120540. [Google Scholar] [CrossRef]
  25. Guanhua, N.; Qian, S.; Meng, X.; Hui, W.; Yuhang, X.; Weimin, C.; Gang, W. Effect of NaCl-SDS compound solution on the wettability and functional groups of coal. Fuel 2019, 257, 116077. [Google Scholar] [CrossRef]
  26. ISRM. SM for Determining the Uniaxial Compressive Strength and Deformability of Rock Materials; ISRM Lisbon: Lisbon, Portugal, 1979; pp. 137–140. [Google Scholar]
  27. Huang, Y.-H.; Yang, S.-Q.; Hall, M.R.; Zhang, Y.-C. The Effects of NaCl Concentration and Confining Pressure on Mechanical and Acoustic Behaviors of Brine-Saturated Sandstone. Energies 2018, 11, 385. [Google Scholar] [CrossRef] [Green Version]
  28. Song, Z.; Frühwirt, T.; Konietzky, H. Inhomogeneous mechanical behaviour of concrete subjected to monotonic and cyclic loading. Int. J. Fatigue 2019, 132, 105383. [Google Scholar] [CrossRef]
  29. Zheng, H.; Feng, X.-T.; Pan, P.-Z. Experimental investigation of sandstone properties under CO2–NaCl solution-rock interactions. Int. J. Greenh. Gas Control. 2015, 37, 451–470. [Google Scholar] [CrossRef]
  30. Song, Z.; Wang, Y.; Konietzky, H.; Cai, X. Mechanical behavior of marble exposed to freeze-thaw-fatigue loading. Int. J. Rock Mech. Min. Sci. 2021, 138, 104648. [Google Scholar] [CrossRef]
  31. Wang, S.; Tang, Y.; Wang, S. Influence of brittleness and confining stress on rock cuttability based on rock indentation tests. J. Cent. South Univ. 2021, 2021. 28, 2786–2800. [Google Scholar] [CrossRef]
  32. Wang, S.; Sun, L.; Li, X.; Wang, S.; Du, K.; Li, X.; Feng, F. Experimental Investigation of Cuttability Improvement for Hard Rock Fragmentation Using Conical Cutter. Int. J. Geomech. 2021, 21, 06020039. [Google Scholar] [CrossRef]
  33. Xu, J.; Zhai, C.; Liu, S.; Qin, L.; Wu, S. Pore variation of three different metamorphic coals by multiple freezing-thawing cycles of liquid CO2 injection for coalbed methane recovery. Fuel 2017, 208, 41–51. [Google Scholar] [CrossRef]
  34. Zhang, Z.; Weller, A. Fractal dimension of pore-space geometry of an Eocene sandstone formation. Geophysics 2014, 79, D377–D387. [Google Scholar] [CrossRef]
  35. Zhou, S.; Liu, D.; Cai, Y.; Yao, Y. Fractal characterization of pore–fracture in low-rank coals using a low-field NMR relaxation method. Fuel 2016, 181, 218–226. [Google Scholar] [CrossRef]
  36. Chen, S.; Tang, D.; Tao, S.; Ji, X.; Xu, H. Fractal analysis of the dynamic variation in pore-fracture systems under the action of stress using a low-field NMR relaxation method: An experimental study of coals from western Guizhou in China. J. Pet. Sci. Eng. 2018, 173, 617–629. [Google Scholar] [CrossRef]
  37. Hongchao, X.; Guanhua, N.; Shang, L.; Qian, S.; Kai, D.; Jingna, X.; Gang, W.; Yixin, L. The influence of surfactant on pore fractal characteristics of composite acidized coal. Fuel 2019, 253, 741–753. [Google Scholar] [CrossRef]
  38. Lemaître, J. A continuous damage mechanics model for ductile fracture. J. Eng. Mater. Technol. Trans. ASME 1985, 107, 83–89. [Google Scholar] [CrossRef]
  39. Lemaitre, J. A Course on Damage Mechanics; Springer Science & Business Media: Cham, Switzerland, 2012. [Google Scholar]
  40. Song, Z.; Konietzky, H.; Herbst, M. Bonded-particle model-based simulation of artificial rock subjected to cyclic loading. Acta Geotech. 2018, 14, 955–971. [Google Scholar] [CrossRef]
  41. Tang, C.A. Catastrophe in the Process of Rock Rupture.; China Coal Industry Publishing House: Beijing, China, 1993. (In Chinese) [Google Scholar]
  42. Zhang, Z.Z.; Gao, F.; Xu, X.L. Experimental study of temperature effect of mechanical properties of granite. Rock Soil Mech. 2011, 32, 2346–2352. (In Chinese) [Google Scholar]
Figure 1. Diagrammatic sketch showing the flow of experiments.
Mathematics 09 03264 g001
Figure 2. The relationship curve between soaking times and PH values of solution.
Mathematics 09 03264 g002
Figure 3. The relationship curve between the soaking times and the change rate of longitudinal wave velocities.
Mathematics 09 03264 g003
Figure 4. The relationship between Δm and soaking times.
Mathematics 09 03264 g004
Figure 5. The T2 distribution curves of coal samples.
Mathematics 09 03264 g005
Figure 6. The change law of porosity as a function of soaking times.
Mathematics 09 03264 g006
Figure 7. Microscopic morphology of coal samples after soaking for different times: (a,b) represent natural state; (c,d) soaking for 10 days; and (e,f) soaking for 30 days.
Mathematics 09 03264 g007aMathematics 09 03264 g007b
Figure 8. The stress–strain curve of coal samples.
Mathematics 09 03264 g008
Figure 9. The relationship between soaking times and mechanical parameters of coal: (a) peak strength; (b) elastic modulus; and (c) failure strain.
Mathematics 09 03264 g009
Figure 10. The relationship curve between average value of chemical damage variable and soaking times.
Mathematics 09 03264 g010
Figure 11. The typical damage evolution curve.
Mathematics 09 03264 g011
Figure 12. Comparison of stress–strain test curve and theoretical curve: (a) ST = 5 d, (b) ST = 10 d, (c) ST = 15 d, (d) ST = 20 d, and (e) ST = 30 d.
Mathematics 09 03264 g012
Figure 13. Verification of modified damage constitutive model with experimental data of Gu [10].
Mathematics 09 03264 g013
Table 1. Chemical test results of mine water.
PHTDSK+Na+Ca2+ClSO42−
mg/Lmg/Lmg/Lmg/Lmg/Lmg/L
8.79472010.713508612301145
Table 2. The mass and longitudinal wave velocity (vp) of coal samples under different soaking times.
Soaking Times/dP-1P-2P-3
Mass/gvp/km·s−1Mass/gvp/km·s−1Mass/gvp/km·s−1
0257.791.83255.321.76253.071.80
0.25261.15-258.85-256.12-
0.5265.33-263.13-261.18-
1270.911.82268.241.75265.861.79
3269.921.80267.061.73264.991.77
5269.541.79267.301.71264.441.76
7269.041.76266.501.69264.491.73
10268.401.73265.711.67263.321.71
15268.021.73265.731.66262.731.70
20266.851.72264.471.65262.041.69
25266.801.71264.281.64262.001.68
30266.771.71264.261.64262.021.68
Table 3. Number of pores in coal samples after different soaking times.
Soaking Times/dPorosity/%Adsorption PoresSeepage PoresFractures
021.2898092570213
321.9198192765354
522.9610,0412983517
1023.6610,0623172688
1524.8810,3853749710
2025.2510,2083982807
3025.58991542101026
Table 4. Mechanical parameters of coal samples.
Sample No.Soaking Time (d)Peak Strength (MPa)Elastic Modulus (GPa)Failure Strain (%)
US1-1040.9802.9571.483
US1-2038.9742.8651.519
US1-3037.5842.6511.538
US2-1529.2692.1721.609
US2-2532.4272.3611.581
US2-3527.9851.8861.664
US3-11026.0871.7851.763
US3-21027.9531.6031.709
US3-31027.2661.6361.737
US4-11523.7581.5081.874
US4-21525.4811.5451.792
US4-31524.6631.4751.804
US5-12022.8061.2501.976
US5-22023.4691.3471.895
US5-32021.5681.2571.983
US6-13021.3571.1662.113
US6-23020.6051.2352.034
US6-33018.6241.0132.164
Table 5. Fitting parameters in coupling factor μ.
Sampleεc/10−2A/10−2w/10−2μ0Correlation Coefficient
US2-11.6090.280.560.600.93
US2-21.5810.260.460.550.95
US2-31.6640.280.550.590.96
US3-11.7630.510.810.500.94
US3-21.7090.420.820.600.98
US3-31.7370.150.800.850.98
US4-11.8740.320.780.680.97
US4-21.7920.230.800.780.98
US4-31.8040.250.850.760.98
US5-11.9760.300.850.720.96
US5-21.8950.350.830.680.94
US5-31.9830.340.810.660.95
US6-12.1130.410.810.600.93
US6-22.0340.400.800.600.95
US6-32.1640.210.850.820.99
Publisher’s Note: MDPI stays neutral with regard to jurisdictional claims in published maps and institutional affiliations.

