Article

Corrosion-Fatigue Life Prediction Modeling for RC Structures under Coupled Carbonation and Repeated Loading

1
School of Civil Engineering, Central South University, Changsha 410075, China
2
National Engineering Laboratory for High Speed Railway Construction, Changsha 410075, China
*
Author to whom correspondence should be addressed.
Mathematics 2021, 9(24), 3296; https://doi.org/10.3390/math9243296
Submission received: 15 November 2021 / Revised: 2 December 2021 / Accepted: 17 December 2021 / Published: 18 December 2021

Abstract

:
The coupled action of concrete carbonation and repeated loading strongly influences the safety of reinforced concrete (RC) structures and substantially reduces service life. A novel corrosion-fatigue life prediction model for RC structures under coupled carbonation and repeated loading was developed. The effect of fatigue damage on concrete carbonation and carbonation-induced corrosion rate was considered, and the acceleration of fatigue damage accumulation due to reinforcement corrosion was considered in this approach. The proposed corrosion-fatigue life prediction model was illustrated by a 6 m-span RC slab in a simply supported slab bridge for the highway, and the effects of traffic frequency, overloading, carbonation environment grade, and environmental temperature and relative humidity on corrosion-fatigue life were discussed. The results indicate that the proposed model can predict the corrosion-fatigue life of RC structures simply and conveniently. Traffic frequency, overloading, carbonation environment grade, and environmental temperature and relative humidity can decrease the corrosion-fatigue life of the RC slab by up to 66.86%, 58.90%, 77.45%, and 44.95%, respectively. The research is expected to provide a framework for the corrosion-fatigue life prediction of RC structures under coupled carbonation and repeated loading.

1. Introduction

Concrete is the most widely utilized building construction material for the development of infrastructures due to its cost, technical properties, and durability characteristics [1,2], and reinforced concrete (RC) structures are the most common structural form in civil engineering. Many RC structures or members, such as highway and railway bridges, crane beams of industrial plants, and offshore oil production platforms not only bear static loads but also bear repeated loads such as vehicle loads, crane loads, or wave loads [3]. Repeated loading will cause fatigue damage in materials. Moreover, fatigue failure, one of the main failure modes of RC structures, will occur with the continuous accumulation of fatigue damage [4,5]. These RC structures also bear the long-term action of the environment, such as carbonation environment and chloride environment. After a period of service, rebar corrosion caused by concrete carbonation or chloride ion ingress commonly occurs in RC structures or members [6,7,8]. Reinforcement corrosion will cause the bearing capacity degradation of RC structures. Both repeated loading and environmental action will cause material deterioration in RC structures. Fatigue damage and reinforcement corrosion are the dominant reasons for the performance degradation of RC structures [9,10]. The fatigue failure mechanism of corroded RC structures is more complex than that of RC structures without corrosion. The reason is that the failure of RC structures caused by the combined action of corrosion and fatigue is not a simple superposition of these two failure factors, but a coupled process of their mutual influence [11].
Concrete carbonation is the primary factor that causes the reinforcing bar corrosion of RC structures exposed to an atmospheric environment. With the accelerating process of global industrialization, the concentration of carbon dioxide (CO2) in the air is increasing, and the carbonation of RC structures is becoming increasingly serious [12,13]. Concrete carbonation refers to CO2 ingression concrete interior and neutralization with alkaline substances. Carbonation will decrease the pH value of concrete, leading to reinforcing bar depassivation [14]. Then, reinforcement corrosion will occur in the presence of oxygen and water. Repeated loading will lead to a rapid accumulation of fatigue damage in concrete, and fatigue damage will accelerate the transport of aggressive agents into concrete [15]. The tensile performance of concrete material is weak, and fatigue cracks are easy to generate and propagate under repeated loading. The transport path enlarged by concrete fatigue cracking further accelerates the transport of aggressive agents in concrete and causes reinforcing bars to corrode earlier and faster [16,17]. When the reinforcing bar is corroded, the cross-sectional area of the reinforcing bar decreases, resulting in a decrease in fatigue resistance of the reinforcement [18]. With the accumulation of corrosion products, the corrosion-induced cracking of concrete cover occurs, which also accelerates the transport of aggressive agents and the reinforcing bar corrosion rate [19]. The fatigue damage caused by repeated loading accelerates the process of concrete carbonation and reinforcing bar corrosion, and corrosion decreases the fatigue resistance of the reinforcing bar. Therefore, the coupled corrosion-fatigue is more serious than the separate effect or the simple superposition of the corrosion and fatigue, and the coupled effect will lead to a serious reduction of the service life of RC structures [20,21]. Accordingly, it is important to investigate the corrosion-fatigue life of RC structures under coupled carbonation and repeated loading to ensure their service safety.
The performance degradation of RC structures under carbonation [22,23,24,25] or fatigue [26,27,28] has been widely studied. The research related to the deterioration of RC structures under the combined action of carbonation and fatigue has mainly focused on the fatigue performance of corroded RC structures [29,30] and the carbonation of fatigue damaged concrete [31,32]. To date, there have been some studies related to the corrosion-fatigue life prediction of RC structures, but they have mainly focused on RC structures with artificial accelerated corrosion or chloride-induced corrosion. Zhang et al. [33] proposed a piecewise linear model to predict the fatigue life of corroded RC beams. Verma and Mishra [34] established a calculation method for corrosion-fatigue life prediction of RC beams based on fracture mechanics and proposed a simplified numerical method to estimate the corrosion-fatigue life. Bastidas et al. [35] presented a novel corrosion-fatigue life assessment model for RC structures in a chloride environment and applied the proposed model to the corrosion-fatigue life assessment of a RC bridge. Wu et al. [36] established a fatigue life prediction model for RC beams under the combined action of chloride-induced corrosion and fatigue based on Fick’s second law and Paris’ law. Ge and Kim [37] presented a probabilistic method to update the predicted service life of deteriorated RC structures under the coupled process of corrosion and fatigue. Song et al. [38] proposed a corrosion-fatigue life assessment model for railway bridges under the combined carbonation-induced corrosion and train loads, but the model did not consider the impact of fatigue damage on concrete carbonation.
In view of the scarce studies that have predicted the service life of RC structures under coupled carbonation and repeated loading, the current research presents a novel corrosion-fatigue life prediction model for RC structures under coupled carbonation and repeated loading. The effect of repeated loading on concrete carbonation and carbonation-induced corrosion rate was considered, and the acceleration of fatigue damage accumulation due to reinforcement corrosion was considered in this approach. To illustrate the proposed model, a 6 m-span RC slab in a simply supported slab bridge for the highway was studied. The fatigue damage evolution behavior was obtained, and the corrosion-fatigue life was predicted. The influences of key variables, including traffic frequency, overloading, carbonation environment grade, and environmental temperature and relative humidity, were discussed through a parametric analysis. The research is expected to provide a framework for the corrosion-fatigue life prediction of RC structures.

2. Corrosion-Fatigue Life Prediction Modeling

2.1. Concrete Carbonation

CO2 transport in fatigue-damaged concrete is accommodated by the gas transfer between pores and cracks. Considering the adsorption and reaction rate of CO2 in concrete, the CO2 transport in concrete can be expressed as [39]:
t ( φ ( 1 s ) C CO 2 ) = x ( D CO 2 C CO 2 x ) Q
where x is the CO2 transport distance in concrete at service time t, C CO 2 is the CO2 concentration around the concrete surface (kg/m3), D CO 2 is the CO2 diffusion coefficient in concrete (m2/s), φ is the porosity of the fatigue damaged concrete, s is the pore saturation of concrete, and Q is the total consumption rate of the concrete carbonation.
The amount of CO2 transport in fatigue-damaged RC structures includes the CO2 transport in cracks and damaged but uncracked concrete. The diffusion coefficient can be expressed as [15]:
D CO 2 = D p + w m l m D c
where Dp is the CO2 diffusion coefficient in damaged but uncracked concrete, Dc is the CO2 diffusion coefficient in concrete cracks, and wm and lm are the average crack width and spacing of RC members under repeated loading, respectively.
CO2 transport in concrete is related to the environment temperature [40], humidity [41], and pore structure [15]. Dp can be expressed as:
D p = 1.64 × 10 6 φ 1.8 ( 1 R H ) 2.2 exp [ U R ( 1 T 0 1 T a ) ] p 2.8
where RH is the environmental relative humidity, U is the activation energy of carbon dioxide gas, R is the universal gas constant, T0 is the standard temperature of the natural environment (298.15 K), Ta is the environmental absolute temperature (K), and p is the factor related to fatigue damage, which can be obtained via regression of experimental data in our previous work and is expressed as follows [15]:
p = 1 + 0.311 D b
where Db is the damage degree of RC members (0 ≤ Db ≤ 1).
Jiang et al. [32] indicated the CO2 diffusion coefficient in concrete cracks, which can be calculated as:
D c = ( 1 δ ) D air + δ D agg
where δ is the area fraction of aggregates in the concrete crack, and Dair and Dagg are the CO2 diffusion coefficients in air and aggregates, respectively.
The test results indicate that the repeated loading slightly affects the primary crack spacing. Therefore, it can be assumed that the average crack spacing of the RC members remains constant during the repeated loading process and can be computed as [42]:
l m = ξ ( 1.9 c + 0.08 d eq / ρ te )
where ξ is the influence coefficient of the average crack spacing under repeated loading, c is the thickness of concrete cover (mm), deq is the equivalent diameter of the reinforcements under tension (mm), and ρte is the reinforcement ratio of the tensile reinforcements.
Based on the fatigue test results, the concrete crack width of a RC member under repeated loading is given by [15]:
w m = ( 0.891 + 0.1123 ln n f ) w 0
where w0 is the average initial crack width of the RC members and nf is the number of repeated loading cycles.
The known experimental studies have shown that the carbonation process of fatigue-damaged concrete can be calculated by Fick’s first law [31]. Consequently, the carbonation depth X of the concrete at service time t can be calculated as:
X = K t
where K is the carbonation coefficient. Papadakis et al. [43] proposed a theoretical model for concrete carbonation through the mass-balance condition of the carbonatable substance, which can be expressed as:
X = 2 D CO 2 C CO 2 [ Ca ( OH ) 2 ] 0 + 3 [ CSH ] 0 + 3 [ C 3 S ] 0 + 2 [ C 2 S ] 0 t
where [Ca(OH)2]0, [CSH]0, [C3S]0, and [C2H]0 are the carbonatable substance densities in the concrete.

2.2. Carbonation-Induced Reinforcing Bar Corrosion

Carbonation-induced reinforcing bar corrosion is usually considered uniform (general) corrosion [44]. For the uniform corrosion model, the cross-sectional loss area ratio of reinforcement ε(t) (i.e., cross-sectional corrosion ratio) can be computed as:
ε ( t ) = Δ A s A s = 4 a ( t ) d 0 4 a 2 ( t ) d 0 2
where As is the initial cross-sectional area of the reinforcing bar (mm2), ΔAs is the cross-sectional loss area of the reinforcing bar caused by uniform corrosion (mm2), a(t) is the reinforcement corrosion depth (mm), and d0 is the initial diameter of reinforcement (mm). The uniform corrosion form of the reinforcing bar is shown in Figure 1.
The Chinese code GB/T 51355-2019 [45] suggests a method for carbonation-induced reinforcing bar corrosion. When reinforcing bar corrosion initiates, a certain depth of concrete cover free of carbonation still exists, which can be defined as carbonation remaining depth X0. The carbonation remaining depth X0 can be estimated by:
X 0 = ( 1.2 0.35 K 0.5 ) D k 6 m ef + 1.6 ( 1.5 + 0.84 K )
where mef is the carbonation environmental factor; Dk is the factor associated with both c and K. The carbonation environment factor mef can be determined by carbonation environmental aggressiveness, including the four grades A, B, C, and D (Table 1).
For the factor Dk, when c ≤ 28 mm,
D k = { c 0.16 / K , K < 0.8 c , K 0.8
When c > 28 mm,
D k = { c 0.389 ( c 28 ) ( 0.16 / K ) 1.5 , K < 1.0 c + 0.066 ( c 28 ) 0.47 K , 1.0 K < 3.3 c + 0.066 ( c 28 ) 1.55 , K 3.3
When reinforcing bar corrosion initiates, the corrosion initiation time tini can be calculated as:
t ini = ( c X 0 K ) 2
The reinforcing bar corrosion rate before concrete cracking can be computed by:
i ini = 7.53 K cl m ef ( 0.75 + 0.0125 T ) ( R H 0.45 ) 2 / 3 c 0.675 f cu 1.8
where Kcl is the reinforcement location factor, Kcl is equal to 1.6 at the corner of RC members and 1.0 at other locations, T is the environmental temperature (°C), and fcu is the concrete cubic compressive strength (MPa).
With the increase of corrosion degree, the concrete cover will crack (corrosion-induced cracking). When the concrete cracks due to corrosion, the reinforcement corrosion depth can be estimated as:
a cr , c = 0.012 c / d 0 + 0.00084 f cu + 0.018
The time to corrosion-induced cracking can be calculated as:
t cr , c = a cr , c / i ini + t ini
Concrete will also crack when the RC members are subjected to repeated loading. Li [46] proposed the S-N curve of concrete cracking due to repeated loading, which can be represented as:
f t max / f t = 1.3681 0.1214 lg N cr
where f t max is the maximum tensile stress of the concrete under constant amplitude repeated loading (MPa), ft is the concrete tensile strength (MPa), and Ncr is the number of loading cycles when concrete cracks due to fatigue.
When using the S-N curve for concrete cracking prediction, fatigue damage in concrete under tension caused by repeated loading is accumulated according to Miner’s rule [47]:
D cr = i = 1 n cr , i N cr , i = i = 1 10 f t , i max / f t 1.3681 0.1214 · n cr , i
where Dcr is the fatigue damage of tensile concrete caused by repeated loading, Dcr ≥ 1 indicates the concrete cracking, ncr,i is the number of concrete tensile stress cycles with the i-th maximum tensile stress f t , i max , and Ncr,i is the number of concrete tensile stress cycles when concrete cracks due to fatigue under the i-th maximum tensile stress f t , i max .
Under the constant amplitude repeated loading, the fatigue-induced cracking time of concrete cover can be obtained:
t cr , t = 10 1.3681 f t max / f t 0.1214 / f
where f is the loading frequency of each period. For variable amplitude repeated loading, Song et al. [38] showed the calculation method for equivalent maximum tensile stress.
The concrete cracking time tcr is the smaller value of corrosion-induced cracking time tcr,c and fatigue-induced cracking time tcr,f. Thus, the concrete cracking time tcr can be calculated as:
t cr = min { t cr , c ,   t cr , f }
When fatigue-induced concrete cracking occurs, the reinforcement corrosion depth acr,f can be computed as:
a cr , f = { 0 t cr , f t ini i ini ( t cr , f t ini ) t cr , f > t ini
When concrete cracking begins, the corrosion depth acr can be expressed as:
a cr = min { a cr , c ,   a cr , f }
Because concrete cracks will accelerate reinforcing bar corrosion, the corrosion rate after concrete cracking can be estimated by:
i cr = ( 4.5 340 i ini ) i ini
According to the above models, the reinforcing bar corrosion depth can be calculated as:
a ( t ) = { 0 , t < t ini i ini ( t t ini ) , t ini < t t cr a cr + i cr ( t t cr ) , t > t cr

2.3. Corrosion-Fatigue Life Prediction

The corrosion-fatigue failure mode of RC structures or members is generally the brittle fracture of reinforcing bars under the coupled corrosion and fatigue [48]. The S-N curve describes the fatigue resistance of materials, and the S-N curve of reinforcing bars can be expressed as:
lg N = lg C m lg ( Δ σ )
where Δ σ is the stress range of reinforcing bars (MPa), N is the number of stress cycles at reinforcement fatigue fracture under the stress range Δ σ , and C and m are the material coefficients for the reinforcing bars.
Fatigue damage accumulation in the reinforcing bar caused by repeated loading is also calculated by Miner’s rule, which can be determined as [47]:
D t = i = 1 n i N i = 1 C i = 1 n i ( Δ σ i ) m
where Dt is the cumulative fatigue damage in the reinforcing bar, and Dt ≥ 1 indicates the reinforcing bar rupture; ni is the number of reinforcing bar stress cycles with the i-th stress range Δ σ i ; and Ni is the number of reinforcing bar stress cycles when the reinforcing bar fatigue ruptures under the i-th stress range Δ σ i . For variable amplitude repeated loading, Li et al. [49] showed the calculation method for equivalent stress range.
As the corrosion degree increases, the fatigue stress ranges increase, and the fatigue resistance decreases [10]. Considering the time-variant of fatigue stress range and fatigue resistance, Equation (26) can be rewritten as follows:
lg N = lg C ( t ) m lg ( Δ σ ( t ) )
The time-variant effect of material coefficient C can be represented by:
C ( t ) = C 0 ϕ ( t )
where C0 is the initial value material coefficient C of the reinforcing bar without corrosion. ϕ ( t ) can be calculated as [50]:
ϕ ( t ) = { 1 , a ( t ) < 1.3428   mm 0.79 a ( t ) 2 + 1.88 a ( t ) 0.1 , 1.34   mm a ( t ) 2.3353   mm 0 , a ( t ) 2.3353   mm
The time-variant reinforcement stress range can be calculated as:
Δ σ ( t ) = Δ σ 0 / ( 1 ε ( t ) )
where Δ σ 0 is the reinforcement stress range without corrosion under repeated loading (MPa).
When the RC structure is in service until the J-th period, the cumulative fatigue damage of reinforcement Dt can be calculated as:
D t = j = 1 J i = 1 ( Δ σ i ( t ) ) m f i , j C ( t )
where fi,j is the loading frequency of the i-th stress range Δ σ i in the j-th period. When Dt reaches 1, fatigue failure will occur, and the fatigue life tr can be obtained.

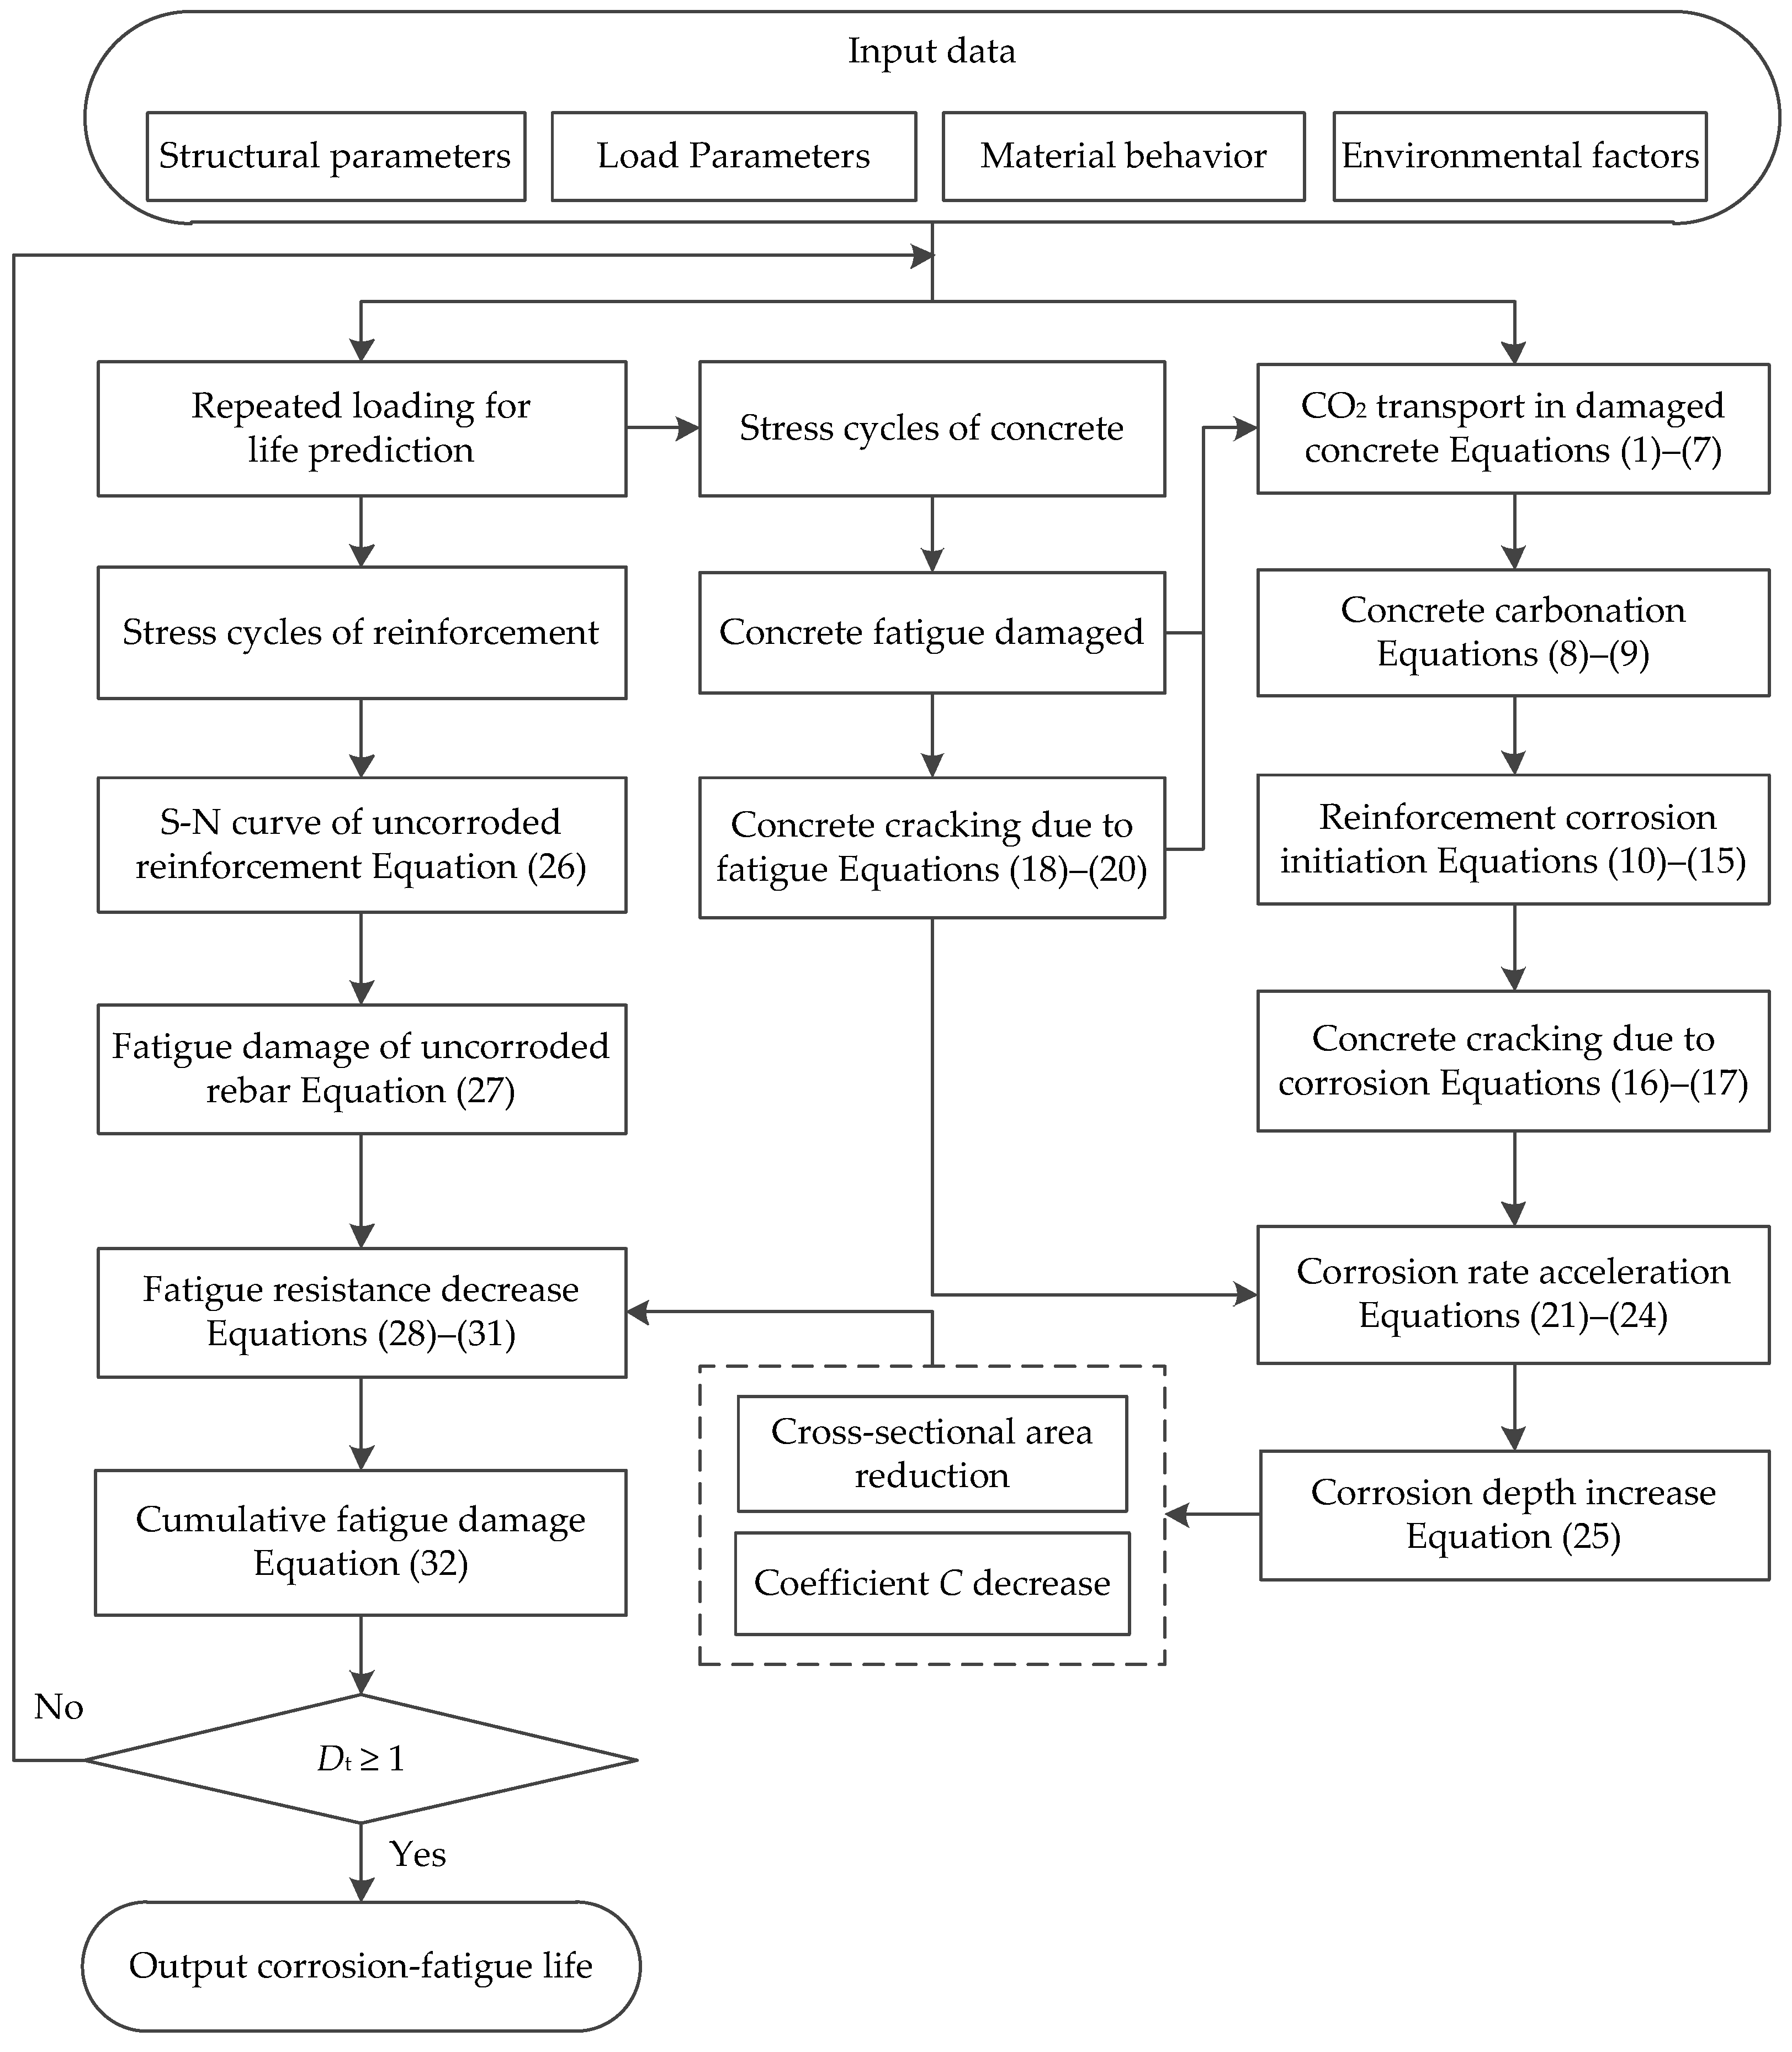
2.4. Corrosion-Fatigue Life Prediction Flowchart

The above models are applied to the corrosion-fatigue life prediction of RC structures under coupled carbonation and repeated loading. A computational program for the corrosion-fatigue life prediction was developed in the MATLAB environment (version 2016a, The Mathworks, Natick, MA, USA) following the steps outlined in Figure 2. The additional details can be summarized as follows:
(1)
Input the structural parameters, load parameters, material behavior, and environmental factors. Then, calculate the reinforcement and concrete stress cycles due to repeated loading.
(2)
Determine the CO2 transport in fatigue damaged process through Equations (1)–(7).
(3)
Obtain the carbonation process of fatigue-damaged concrete through Equations (8) and (9).
(4)
Estimate the reinforcement corrosion initiation time and the corrosion rate before concrete cracking through Equations (11)–(15).
(5)
Compute the concrete cracking time and the corrosion rate after concrete cracking through Equations (16)–(24).
(6)
Calculate the reinforcement corrosion depth and corrosion ratio through Equations (10) and (25).
(7)
Obtain the fatigue resistance and fatigue damage of uncorroded reinforcement through Equations (26) and (27).
(8)
Determine the fatigue resistance decrease behavior through Equations (28)–(31).
(9)
Calculate the cumulative fatigue damage Dt through Equation (32),
(10)
Output the corrosion-fatigue life by judging whether Dt reaches 1.

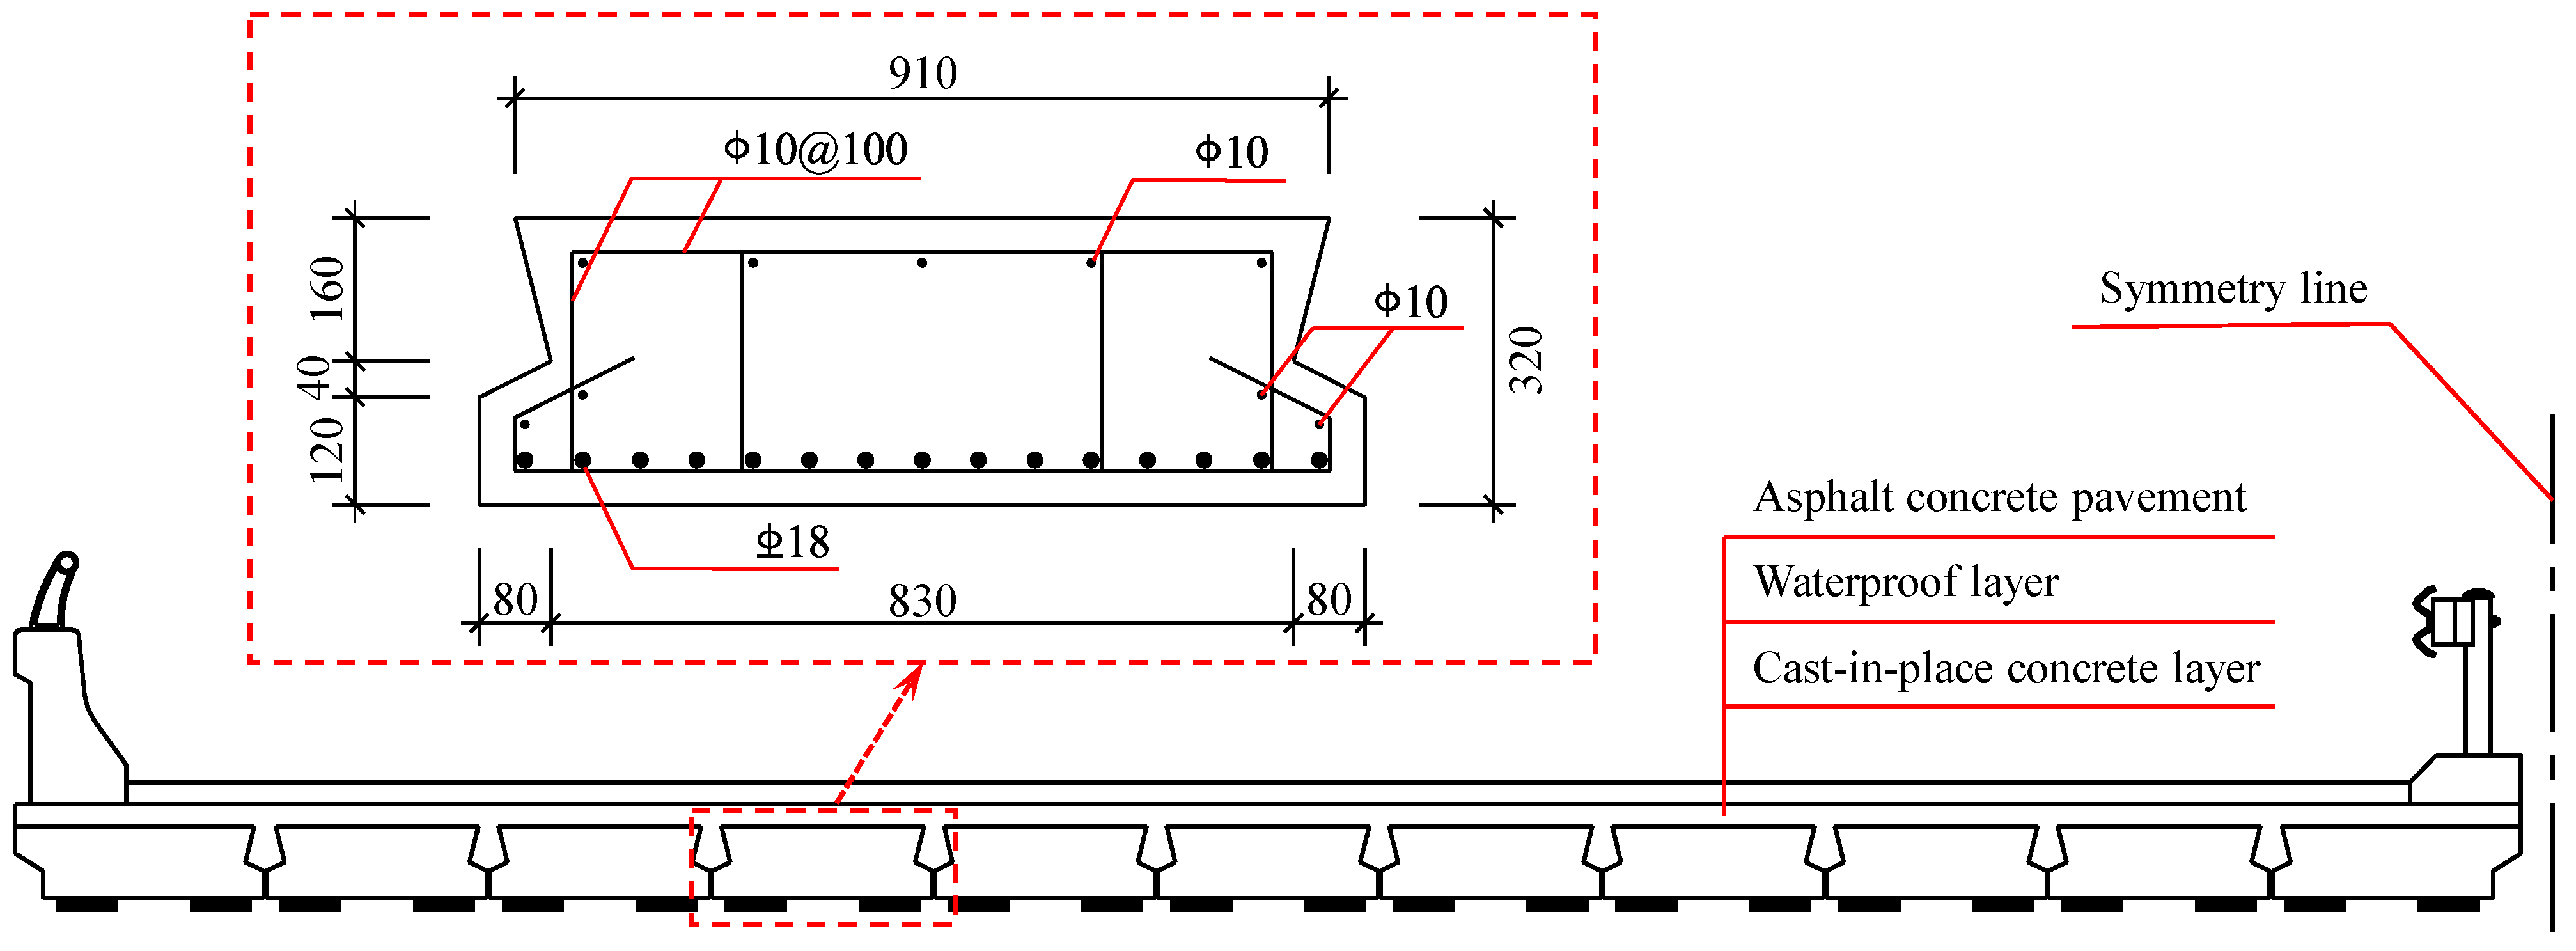
3. Model Application

To illustrate the corrosion-fatigue life prediction model of RC structures under the coupled carbonation and repeated loading, the fatigue damage and corrosion-fatigue life of an RC slab in a highway RC simply supported slab bridge were evaluated. The span of the analyzed RC slab was 6 m, with a height of 0.32 m and a width of 0.91 m. The concrete strength grade of the slab was C30 (150 mm cubic compressive strength of 30 MPa at age of 28 days). Tensile reinforcement with a diameter of 18 mm was configured at the bottom of the slab, and the reinforcement strength grade was HRB335 (hot-rolled ribbed steel bar with a yield strength standard value of 335 MPa). The other reinforcements were 10 mm in diameter and HPB300 (hot-rolled plain steel bar with a yield strength standard value of 300 MPa) in strength grade. The geometric dimensions and reinforcement of the mid-span cross-section of the RC slab are shown in Figure 3. The design service life of the 6 m-span RC slab is 100 years. The thickness of the concrete cover is 50 mm, and the carbonation environment grade of the bridge is B. The annual average environmental temperature and relative humidity at the location of the slab bridge are 15 °C and 65%, respectively. Table 2 lists the material properties and environmental factors used in the corrosion-fatigue life prediction.
Because the small car only has a slight influence on the fatigue performance of the bridge, to simplify the analysis, only the influences of heavy vehicles on corrosion-fatigue life are considered in this paper. Under the dead load, secondary dead load, and vehicle load, the design values of the mid-span bending moment of the RC slab are 43.33 kN·m, 16.25 kN·m, and 132.69 kN·m, respectively. Therefore, the mid-span bending moment caused by the maximum and minimum of repeated loading acting on the RC slab is 59.58 kN·m and 192.27 kN·m, respectively. The design value of traffic frequency f of heavy vehicles on the highway is 1000/day. For highway RC bridges, it is necessary to obtain the stress response of tensile reinforcement under repeated vehicle loads when predicting the corrosion-fatigue life. Because the RC slab is a flexural member, the tensile reinforcement stress of the mid-span cross-section can be calculated as:
σ s = n s M y I
where ns is the ratio of elastic modulus of tensile reinforcement to concrete, M is the bending moment at the mid-span of the slab, y is the distance from the position of tensile reinforcement to the neutral axis of the mid-span transfer section, and I is the inertia moment of the mid-span transfer section. For the 6 m-span RC slab, y = 0.0989 m, I = 2.8230 × 10⁻³ m4; and y = 0.1345 m, I = 1.3153 × 10⁻³ m4 after the concrete cover cracking. Under repeated vehicle loading, the maximum and minimum of the stress cycles in tensile reinforcements are 40.61 MPa and 131.06 MPa, respectively, and the stress range of the tensile reinforcements is 90.45 MPa.
The selection of the S-N curve is very important to the corrosion-fatigue life prediction results. Eurocode [51] presents the S-N curve for reinforcing bars in RC structures, which can be expressed as:
{ log N = 17.0543 5 log Δ σ , N 10 6 log N = 25.8977 9 log Δ σ , N > 10 6

4. Results and Discussion

4.1. Corrosion-Fatigue Life Prediction

The fatigue damage of tensile reinforcing bar with different corrosion ratios caused by a heavy vehicle passage is shown in Figure 4. When the corrosion ratio of reinforcement is 0%, 10%, 20%, 30%, and 40%, the corrosion depth is 0 mm, 0.462 mm, 0.950 mm, 1.470 mm, and 2.029 mm, respectively, and the corresponding fatigue damage caused by a heavy vehicle passage is 5.13 × 10⁻⁹, 1.32 × 10⁻⁸, 3.82 × 10⁻⁸, 1.33 × 10⁻⁷, and 1.10 × 10⁻⁶, respectively. With the increase of corrosion ratio, the fatigue damage caused by a heavy vehicle passage increases significantly.
The repeated loading frequency is the design traffic frequency of heavy vehicles (1000/day). Under a B-grade carbonation environment, the cumulative fatigue damage of tensile reinforcement in the 6 m-span RC slab is shown in Figure 5. Under the design service condition, the corrosion-fatigue performance of the RC slab is satisfactory. When the bridge is operated to the design service life, the cumulative fatigue damage in the tensile reinforcement in the slab is 0.372. With the deepening of reinforcement corrosion and the accelerating of fatigue damage accumulation, the corrosion-fatigue failure of the RC slab will occur, and the corrosion-fatigue life of the RC slab is 162.1 years.

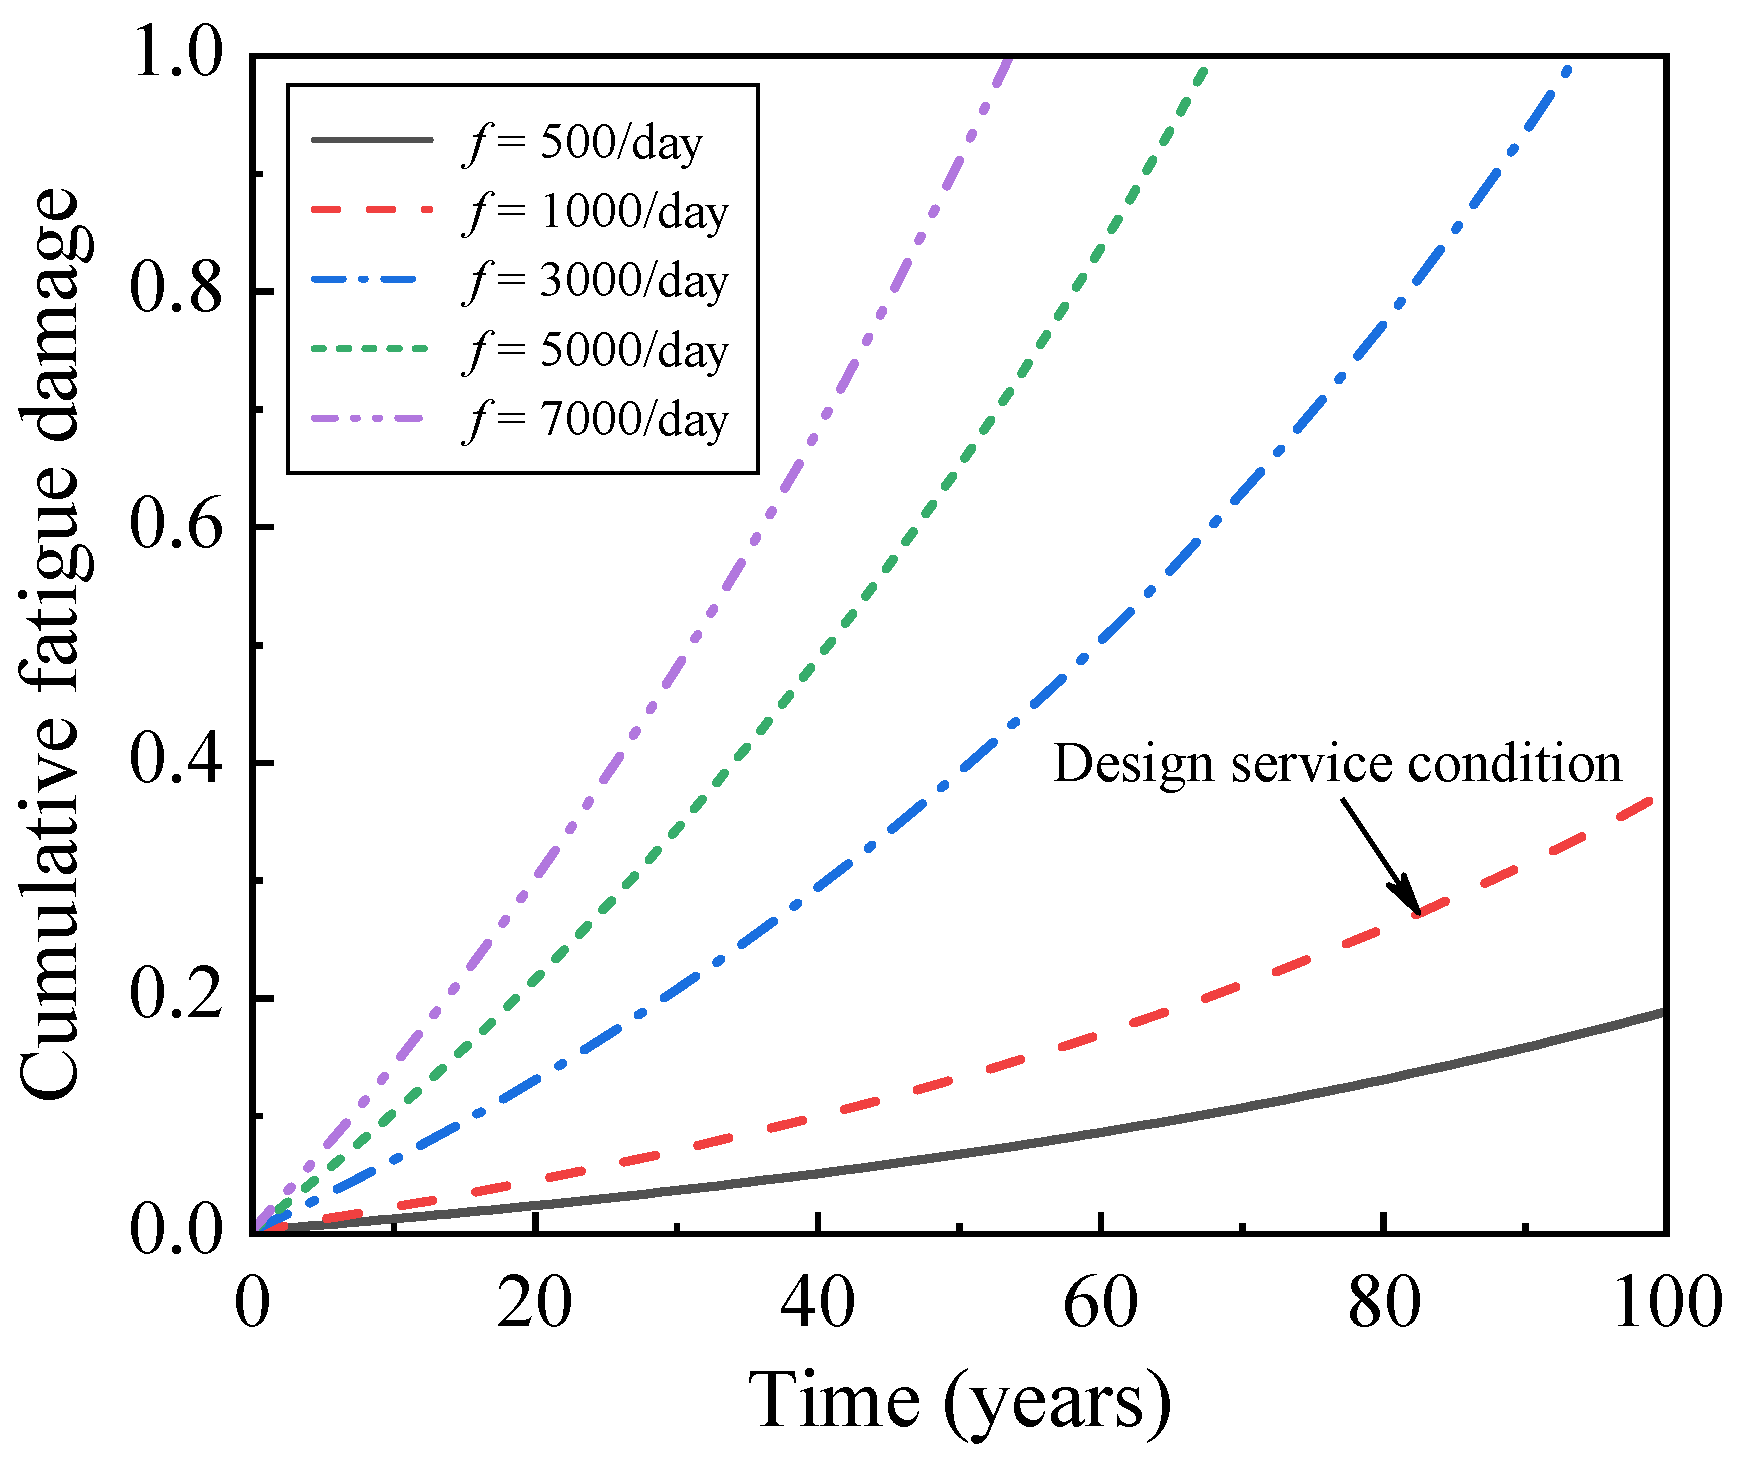
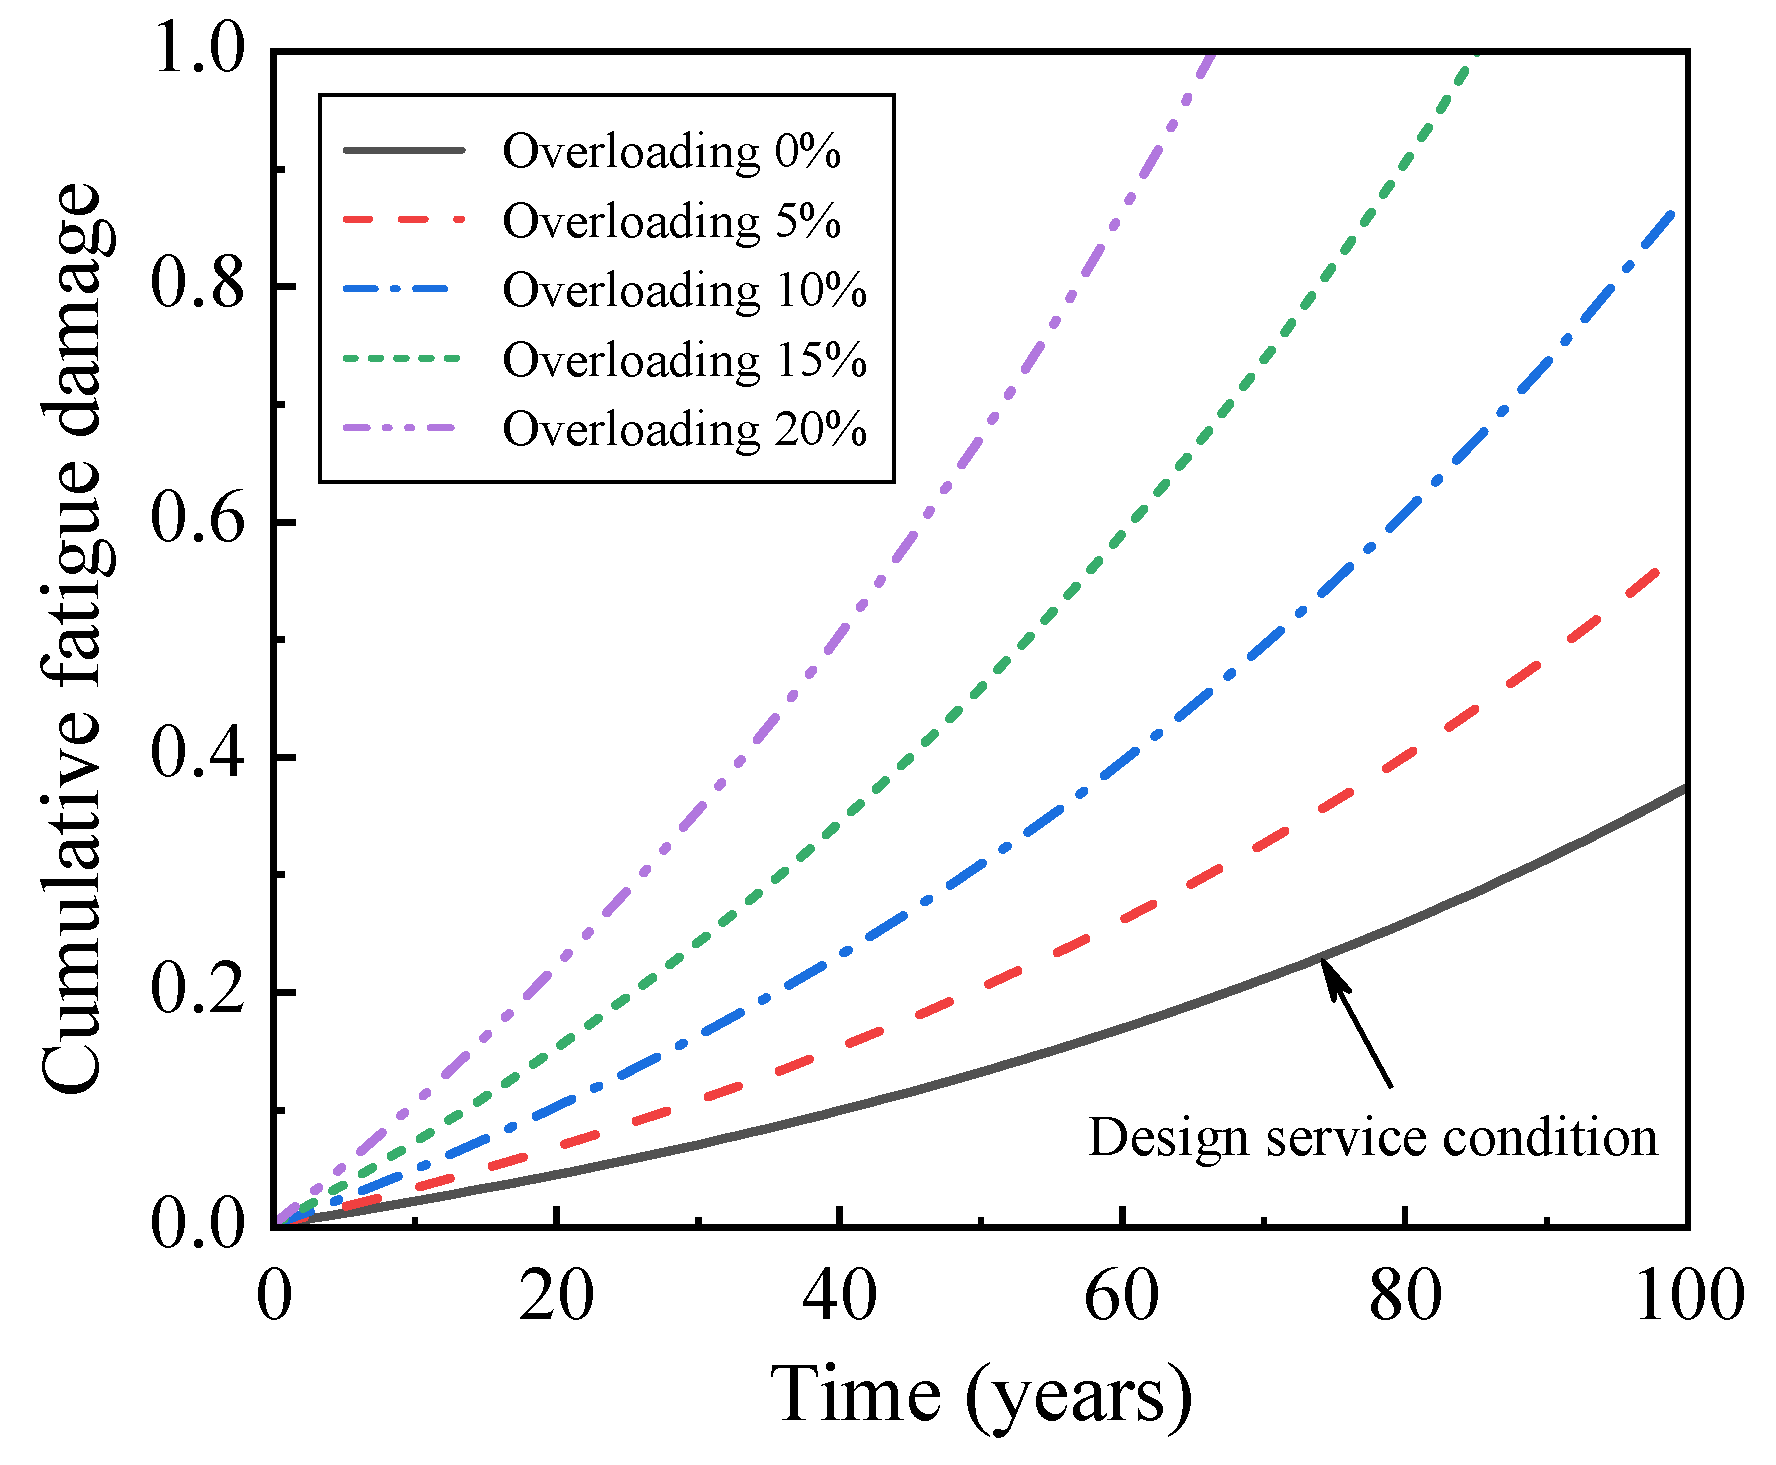
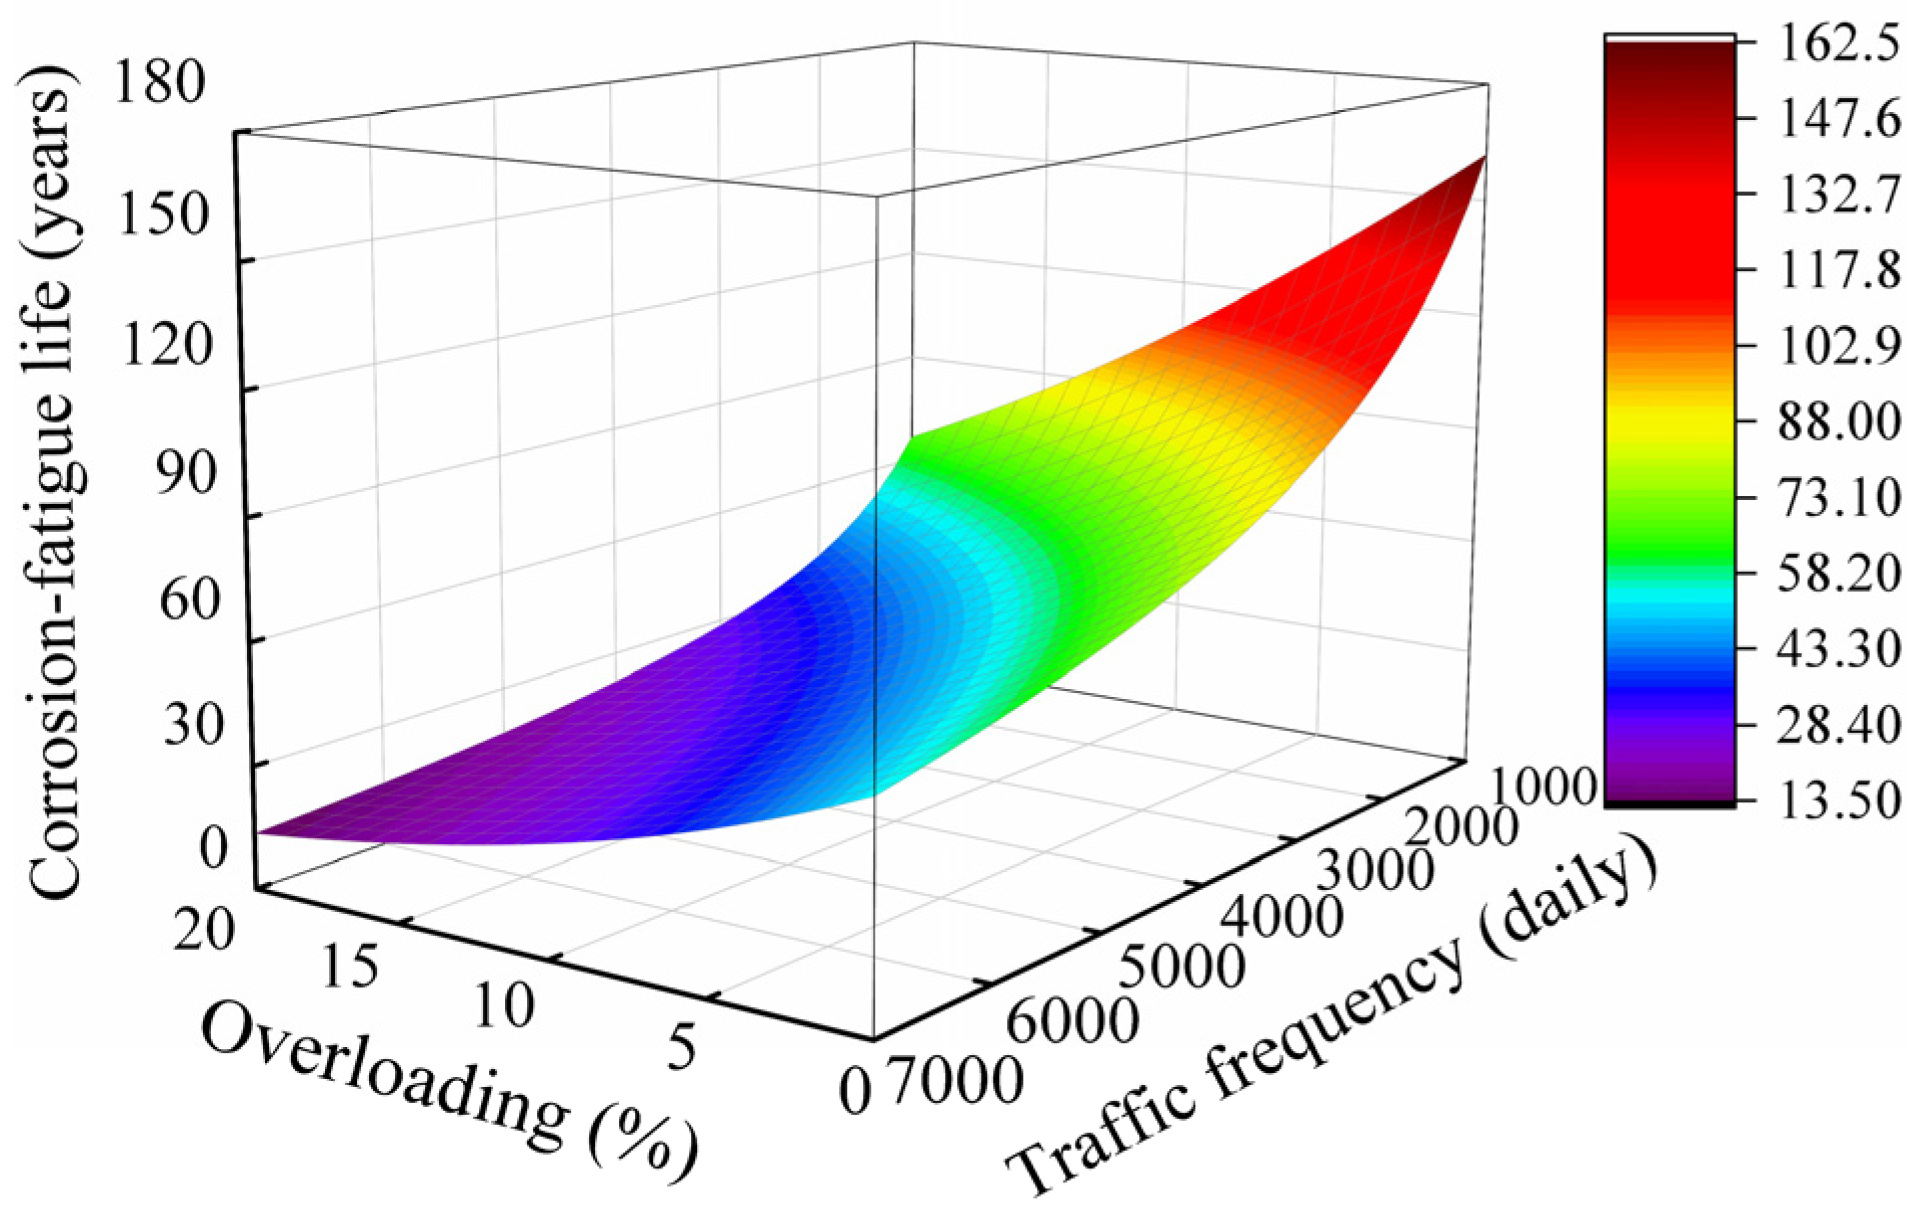
4.2. Effect of Traffic Frequency and Overloading

In recent years, the traffic frequency of highways in China has increased significantly, which will cause a detrimental impact on the corrosion-fatigue performance of RC bridges. To study the influence of traffic frequency, the corrosion-fatigue life of the RC slab with traffic frequencies of 500/day, 1000/day, 3000/day, 5000/day, and 7000/day is predicted. These traffic frequencies are defined by the monitoring of a highway bridge in China [52] and the design traffic frequency. To simplify the analysis, the traffic frequencies are considered time-invariant. The carbonation environment grade, environmental temperature, and relative humidity under different cases of traffic frequency are the same as the design service condition in Section 4.1.
Figure 6 illustrates the cumulative fatigue damage evolution of the tensile reinforcement in the 6 m-span RC slab under different cases of traffic frequency. With the increase of traffic frequency, the fatigue damage increases, and fatigue damage accumulation accelerates. When the highway bridge is operated to the design service life, the cumulative fatigue damage of the two cases with traffic frequency of 500/day and 1000/day is 0.186 and 0.372, respectively. Under the three cases with traffic frequency 3000/day, 5000/day, and 7000/day, the cumulative fatigue damage reaches the limit value in the 95th, 70th, and 54th years of bridge operation, and corrosion-fatigue failure of RC slab occurs. Under these three cases, the corrosion-fatigue life of the 6 m-span RC slab under the coupled carbonation and repeated vehicle load cannot reach the expected design service life. Therefore, it is necessary to strengthen the maintenance and repair of the bridge.
Overloading may occur with the increase of highway traffic volume. Previous research results have shown that overloading will substantially reduce the corrosion-fatigue life of bridges [53]. Consequently, it is necessary to investigate the effect of overloading on the corrosion-fatigue life of RC structures. To simplify the analysis, this study considers the overloading condition by increasing the design vehicle load. Four overloading cases with different overloading ratios are considered in this study, increasing the design load by 5%, 10%, 15%, and 20%, respectively. The traffic frequency, carbonation environment grade, and environmental temperature and relative humidity of each overloading case are the same as the design service condition in Section 4.1.
Figure 7 plots the cumulative fatigue damage evolution of the tensile reinforcement in the 6 m-span RC slab under different overloading cases. Similarly, with the increase of the overloading ratio, the fatigue damage increases, and fatigue damage accumulation accelerates. When the highway bridge is operated to the design service life, the cumulative fatigue damage of the two cases with overloading ratios of 5% and 10% is 0.567 and 0.861, respectively. Compared with the design service condition without overloading, the fatigue damage of the two cases increases by 55.1% and 135.8%, respectively. When the overloading ratio is 15% and 20%, the cumulative fatigue damage reaches the limit value in the 87th and 68th years of bridge operation, and corrosion-fatigue failure of RC slab occurs. An overloading ratio of 20% will reduce the corrosion-fatigue life of the RC slab significantly. Therefore, overloading must be strictly prohibited during bridge operation.
Figure 8 depicts the corrosion-fatigue life of the 6 m-span RC slab under different traffic frequencies and overloading cases. It can be obtained from Figure 8 that the corrosion-fatigue life will be substantially reduced as the traffic frequency and overloading ratio increase simultaneously, and the corrosion-fatigue life of the RC slab is 13.5 to 162.1 years under different traffic frequencies and overloading cases. The corrosion-fatigue life is 93.9 years, 68.0 years, and 53.7 years, respectively, under the traffic frequency cases of 3000/day, 5000/day, and 7000/day without overloading. Compared with the design service condition, the corrosion-fatigue life of the three traffic frequency cases decrease by 42.07%, 58.02%, and 66.86%, respectively. When the traffic frequency is 1000/day and the overloading ratio is 5%, 10%, 15%, and 20%, respectively, the corrosion-fatigue life is 133.3 years, 107.6 years, 85.3 years, and 66.6 years, respectively. The four overloading cases will reduce the corrosion-fatigue life by 17.77%, 33.61%, 47.35%, and 58.90%, respectively, compared with the design service condition.

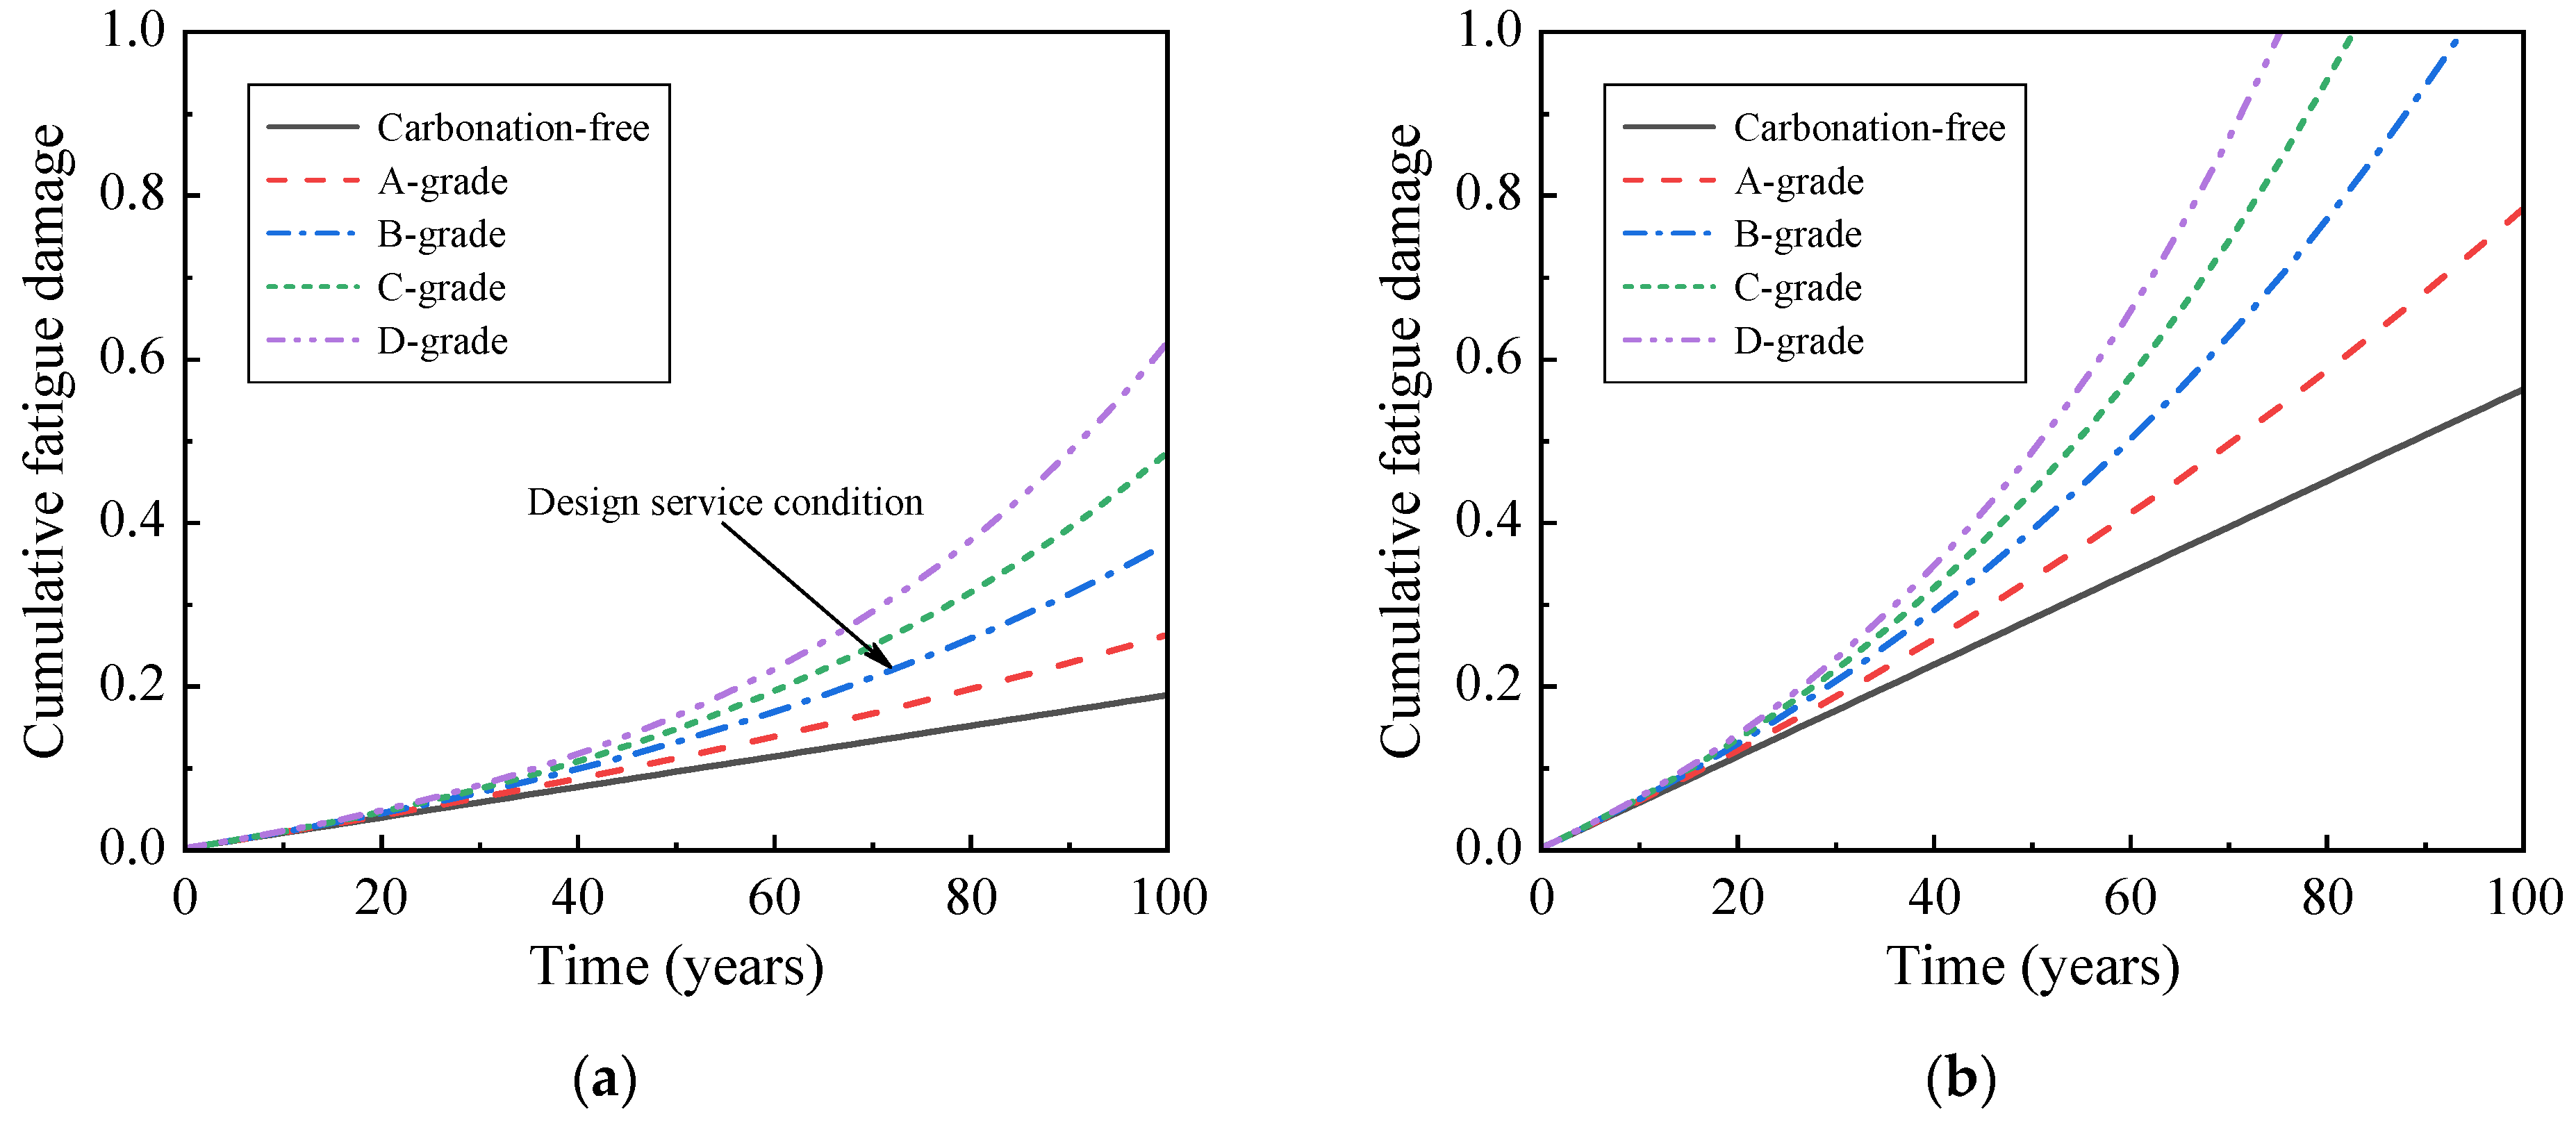
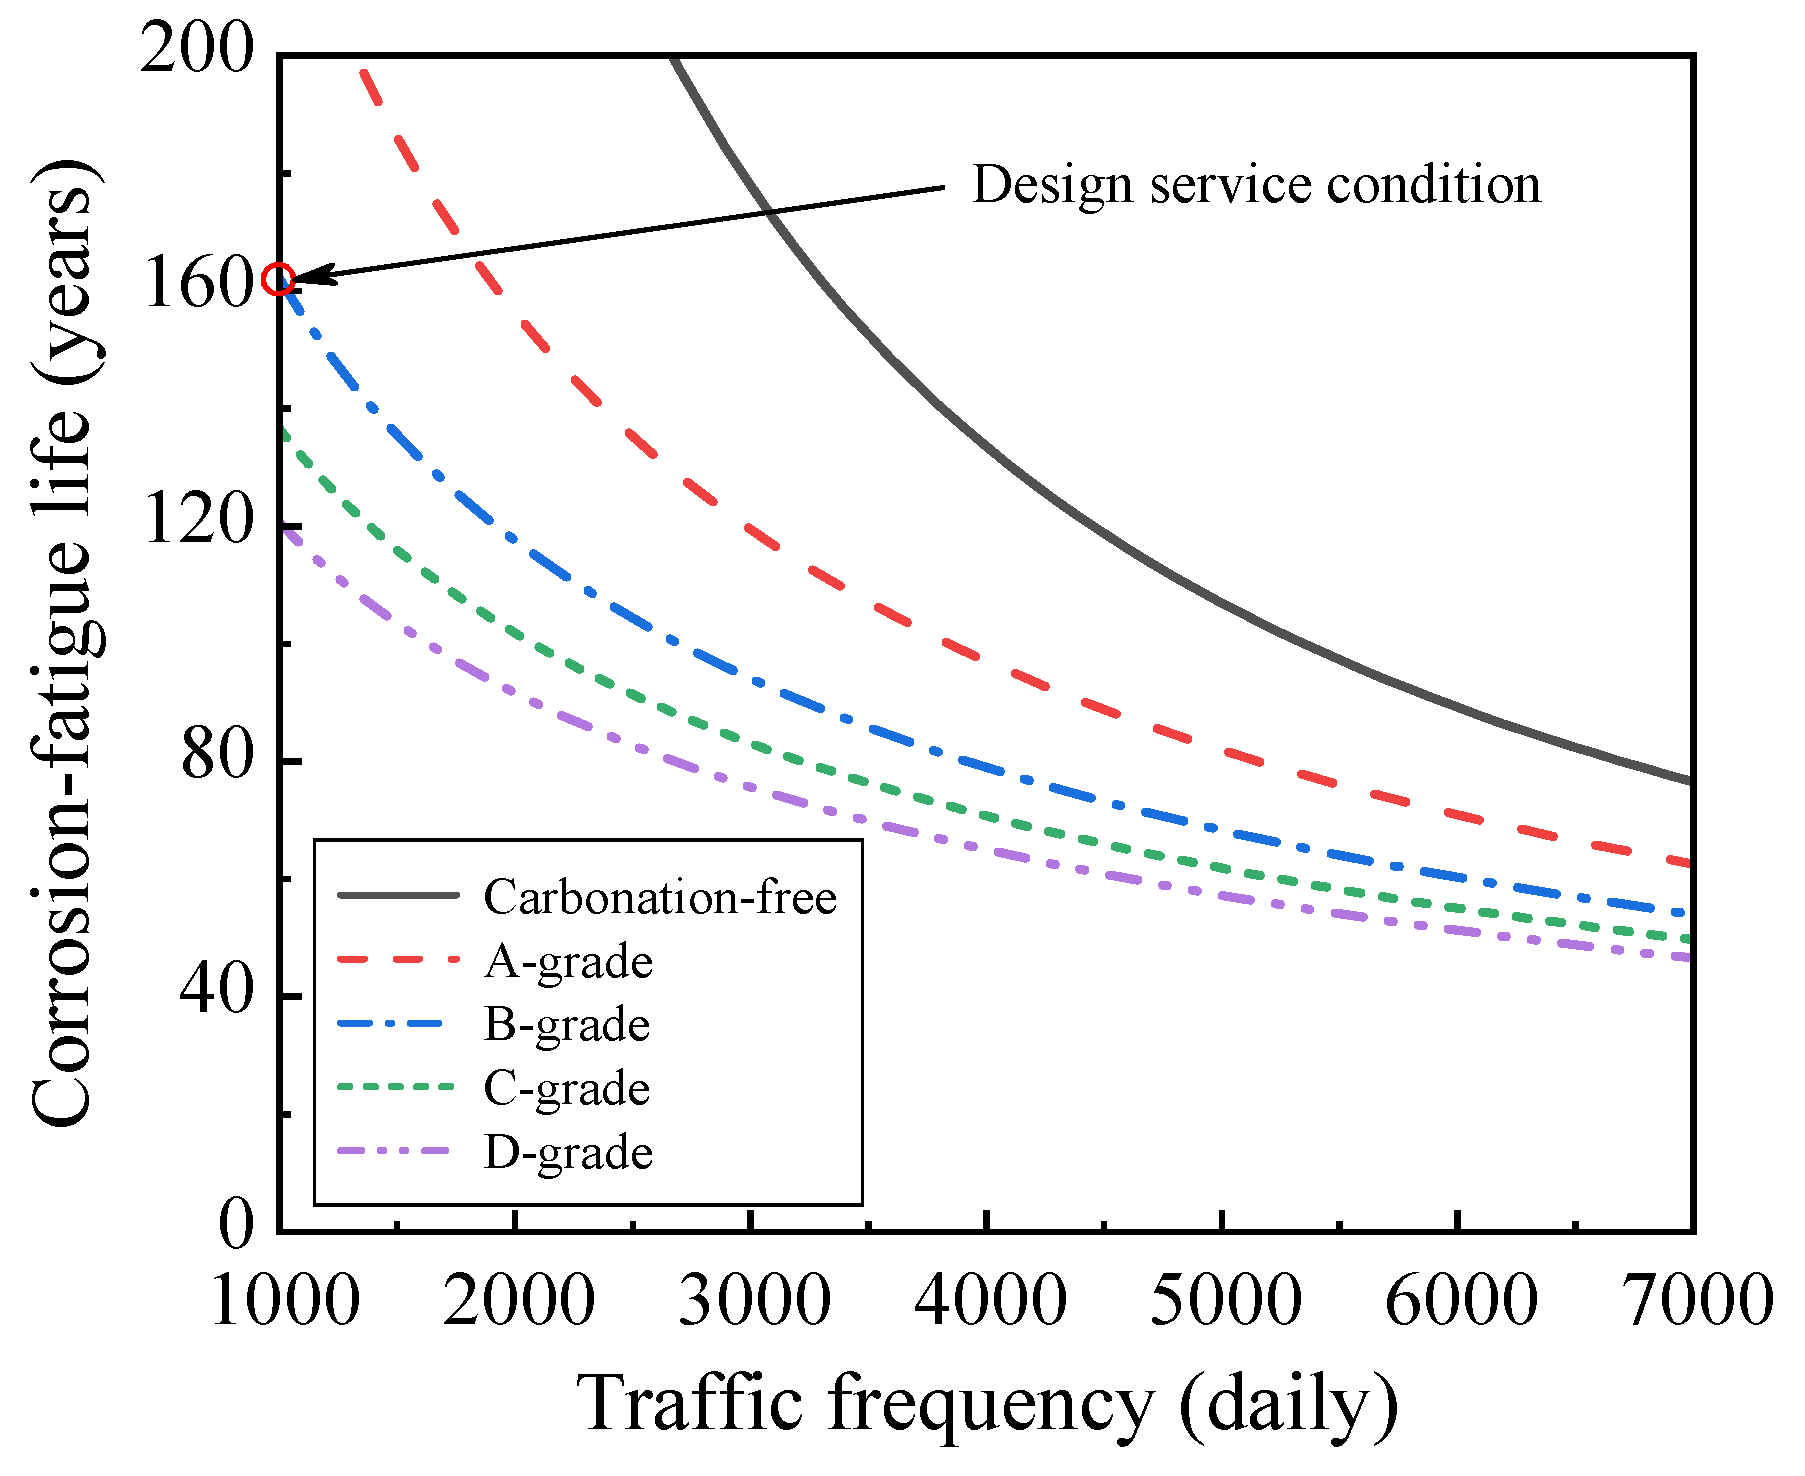
4.3. Effect of Carbonation Environment Grade

The carbonation environment grade will affect the concrete carbonation and the corrosion rate of the reinforcing bar, which, in turn, affects the corrosion-fatigue life of RC structures. To study the effect of carbonation environment grade on corrosion-fatigue life, the cumulative fatigue damage and corrosion-fatigue life of the 6 m-span RC slab under different carbonation environments are evaluated. The environmental temperature and relative humidity are the same as the design service condition. Figure 9 shows the cumulative fatigue damage evolution of the tensile reinforcement in the 6 m-span RC slab under different carbonation environments and different traffic frequencies.
It can be seen from Figure 9 that with the increase of carbonation environment level, the fatigue damage increases, and fatigue damage accumulation accelerates. When the bridge is operated for 100 years with the traffic frequency of 1000/day, the cumulative fatigue damage of tensile reinforcement is 0.187, 0.261, 0.372, 0.483, and 0.616, respectively, under five environmental cases of carbonation-free and carbonation environment grades A to D. Compared with the carbonation-free environment, the fatigue damage increases by 39.31%, 98.69%, 158.00%, and 229.24% under the four different carbonation environment grades. As the traffic frequency increases to 7000/day, the corrosion-fatigue failure of the RC slab will occur when the bridge is operated for 77th, 63th, 55th, 55th, and 47th years, respectively, under carbonation-free and carbonation environment grades A to D.
Figure 10 shows the corrosion-fatigue life of 6 m-span RC slab under different carbonation environment grades and different traffic frequencies. A higher carbonation environment grade will cause a shorter corrosion-fatigue life. With the increase of traffic frequency, the effect of carbonization environment grade on corrosion-fatigue life decreases. Similarly, the higher the carbonization environment grade, the lower the influence of traffic frequency on corrosion-fatigue life.
When the traffic frequency is 1000/day to 7000/day, the fatigue life is 534.3–76.3 years under a carbonation-free environment, and the corrosion-fatigue life is 232.5–62.3 years, 162.1–53.7 years, 136.5–49.4 years, and 120.5–46.2 years, respectively, under the carbonation environment grades A to D. When the traffic frequency increases from 1000/day to 7000/day, the fatigue life decreases by 85.71% under the carbonation-free environment, and the corrosion-fatigue life decreases by 73.20%, 66.86%, 63.83%, and 61.66%, respectively, under the carbonation environment grades A to D. Under the traffic frequency of 1000/day to 7000/day, carbonation environment grades A, B, C, and D can decrease the corrosion-fatigue life by 56.48%–18.37%, 69.67%–29.64%, 74.46%–35.33%, and 77.45%–39.48%, respectively, compared with a carbonation-free environment.

4.4. Effect of Environmental Temperature and Relative Humidity

The environmental temperature and relative humidity of the bridge service environment will affect the corrosion-fatigue life of RC structures [54]. Therefore, the corrosion-fatigue life of the 6 m-span RC slab under four grades of carbonation environment with various temperatures (5–25 °C) and relative humidity (55–85%) is predicted, and the prediction results are shown in Figure 11. The traffic frequency of all cases is 1000/day. It can be seen from Figure 11 that the increase of environmental temperature and relative humidity will reduce the corrosion-fatigue life.
For the environmental temperatures from 5 °C to 25 °C and environmental relative humidity from 55% to 85%, the corrosion-fatigue life of the RC slab is 299.9–174.7 years, 218.9–120.5 years, 185.8–103.7 years, and 163.5–95.0 years, respectively, under carbonation environment grades A to D. The service conditions with different environmental temperatures and relative humidity will reduce the corrosion-fatigue life by up to 41.76%, 44.95%, 44.16%, and 41.87%, under the four different carbonation environment grades A to D.

5. Conclusions

The current study proposed a novel corrosion-fatigue life prediction model for RC structures under coupled carbonation and repeated loading. The proposed corrosion-fatigue life prediction model was illustrated by a 6 m-span RC slab in a simply supported slab bridge for the highway. The fatigue damage and the corrosion-fatigue life were predicted. The influences of traffic frequency, overloading, carbonation environment grade, and environmental temperature and relative humidity were analyzed. The following conclusions can be drawn:
(1)
The proposed corrosion-fatigue life prediction model can predict the corrosion-fatigue life simply and conveniently for RC structures under coupled carbonation and repeated loading.
(2)
Under the design service condition, the corrosion-fatigue performance of the 6 m-span RC slab is satisfactory. The cumulative fatigue damage in the tensile reinforcement at the slab bottom is 0.372 when the bridge is operated to the design service life, and the corrosion-fatigue life of the RC slab is 162.1 years.
(3)
The increase of traffic frequency and overloading ratio will reduce the corrosion-fatigue life of the 6 m-span RC slab. When the traffic frequency increases from 1000/day to 7000/day, the corrosion-fatigue life will decrease by 66.86%. When the overloading ratio increases from 0% to 20%, the corrosion-fatigue life will decrease by 58.90%.
(4)
The corrosion-fatigue life of the 6 m-span RC slab decreases with the increase of carbonation environment grade. Compared with the carbonation-free environment, the four carbonation environments grades A, B, C, and D will reduce the corrosion-fatigue life by 56.48%, 69.67%, 74.46%, and 77.45%, respectively.
(5)
The increase of environmental temperature and relative humidity will reduce the corrosion-fatigue life of the 6 m-span RC slab. Under the four different carbonation environment grades of A to D, the increase of environmental temperature and relative humidity can reduce the corrosion-fatigue life by up to 41.76%, 44.95%, 44.16%, and 41.87%, respectively.

Author Contributions

Conceptualization, C.C. and L.S.; Methodology, C.C.; Software, C.C. and J.L.; Validation, C.C. and J.L.; Formal Analysis, C.C.; Investigation, C.C.; Resources, L.S. and Z.Y.; Data Curation, J.L.; Writing—Original Draft Preparation, C.C.; Writing—Review & Editing, L.S.; Visualization, C.C.; Supervision, L.S.; Project Administration, L.S. and Z.Y.; Funding Acquisition, L.S. All authors have read and agreed to the published version of the manuscript.

Funding

Financial support provided by the National Natural Science Foundation of China (Grant Nos. 51778631, 52078492, and U1934217), the Scientific Research Project of Shuohuang Railway Development Co., Ltd. (Grant No. SHGF-18-50), and the Major Research Project of China Railway Group Limited (Grant No. 2020-Major-2) are greatly appreciated.

Institutional Review Board Statement

Not applicable.

Informed Consent Statement

Not applicable.

Data Availability Statement

Not applicable.

Conflicts of Interest

The authors declare no conflict of interest.

References

  1. Hrabová, K.; Lehner, P.; Ghosh, P.; Konečný, P.; Teplý, B. Sustainability Levels in Comparison with Mechanical Properties and Durability of Pumice High-Performance Concrete. Appl. Sci. 2021, 11, 4964. [Google Scholar] [CrossRef]
  2. Bheel, N.; Tafsirojjaman, T.; Liu, Y.; Awoyera, P.; Kumar, A.; Keerio, M.A. Experimental Study on Engineering Properties of Cement Concrete Reinforced with Nylon and Jute Fibers. Buildings 2021, 11, 454. [Google Scholar] [CrossRef]
  3. Lu, Y.; Tang, W.; Li, S.; Tang, M. Effects of simultaneous fatigue loading and corrosion on the behavior of reinforced beams. Constr. Build. Mater. 2018, 181, 85–93. [Google Scholar] [CrossRef]
  4. Song, L.; Hou, J.; Yu, Z. Fatigue and post-fatigue monotonic behaviour of partially prestressed concrete beams. Mag. Concrete Res. 2016, 68, 109–117. [Google Scholar] [CrossRef]
  5. Lantsoght, E.O.L.; Koekkoek, R.; Vander, V.C.; Sliedrecht, H. Fatigue Assessment of Prestressed Concrete Slab-Between-Girder Bridges. Appl. Sci. 2019, 9, 2312. [Google Scholar] [CrossRef] [Green Version]
  6. Kumar, V. Protection of steel reinforcement for concrete—A review. Corros. Rev. 1998, 16, 317–358. [Google Scholar] [CrossRef]
  7. Lee, H.; Lee, H.; Min, S.; Lim, S.; Singh, J. Carbonation-induced corrosion initiation probability of rebars in concrete with/without finishing materials. Sustainability 2018, 10, 3814. [Google Scholar] [CrossRef] [Green Version]
  8. Wu, J.; Diao, B.; Xu, J.; Zhang, R.; Zhang, W. Effects of the reinforcement ratio and chloride corrosion on the fatigue behavior of RC beams. Int. J. Fatigue 2020, 131, 105299. [Google Scholar] [CrossRef]
  9. Song, L.; Yu, Z. Fatigue performance of corroded reinforced concrete beams strengthened with CFRP sheets. Constr. Build. Mater. 2015, 90, 99–109. [Google Scholar] [CrossRef]
  10. Blikharskyy, Y.; Selejdak, J.; Kopiika, N. Corrosion fatigue damages of rebars under loading in time. Materials 2021, 14, 3416. [Google Scholar] [CrossRef]
  11. Bigaud, D.; Ali, O. Time-variant flexural reliability of RC beams with externally bonded CFRP under combined fatigue-corrosion actions. Reliab. Eng. Syst. Saf. 2014, 131, 257–270. [Google Scholar] [CrossRef] [Green Version]
  12. Koh, T.; Kim, M.; Yang, K.; Yoon, Y.; Kwon, S. Service life evaluation of RC T-girder under carbonation considering cold joint and loading effects. Constr. Build. Mater. 2019, 226, 106–116. [Google Scholar] [CrossRef]
  13. Kwon, S.; Na, U. Prediction of durability for RC columns with crack and joint under carbonation based on probabilistic approach. Int. J. Concr. Struct. Mater. 2011, 5, 11–18. [Google Scholar] [CrossRef] [Green Version]
  14. Jiang, Z.; Gu, X.; Huang, Q.; Zhang, W. Statistical analysis of concrete carbonation depths considering different coarse aggregate shapes. Constr. Build. Mater. 2019, 229, 116856. [Google Scholar] [CrossRef]
  15. Song, L.; Liu, J.; Cui, C.; Yu, Z.; Fan, Z.; Hou, J. Carbonation process of reinforced concrete beams under the combined effects of fatigue damage and environmental factors. Appl. Sci. 2020, 10, 3981. [Google Scholar] [CrossRef]
  16. Liu, Z.; Philip, V.D.H.; Belie, N.D. Effect of the mechanical load on the carbonation of concrete: A review of the underlying mechanisms, test methods, and results. Materials 2021, 14, 4407. [Google Scholar] [CrossRef] [PubMed]
  17. Wu, J.; Zhang, R.; Diao, B.; Zhang, W.; Xu, J. Effects of pre-fatigue damage on high-cycle fatigue behavior and chloride permeability of RC beams. Int. J. Fatigue 2019, 122, 9–18. [Google Scholar] [CrossRef]
  18. Ma, Y.; Xiang, Y.; Wang, L.; Zhang, J.; Liu, Y. Fatigue life prediction for aging RC beams considering corrosive environments. Eng. Struct. 2014, 79, 211–221. [Google Scholar] [CrossRef]
  19. Li, Y.; Chen, Y.; Shao, W.; Zhang, J.; Liao, S.; Fernandez-Steeger, T.M. Service life prediction and lateral bearing capacity analysis of piles considering coupled corrosion-temperature deterioration processes. J. Mar. Sci. Eng. 2021, 9, 614. [Google Scholar] [CrossRef]
  20. Sun, J.; Ding, Z.; Huang, Q. Corrosion fatigue life prediction for steel bar in concrete based on fatigue crack propagation and equivalent initial flaw size. Constr. Build. Mater. 2019, 195, 208–217. [Google Scholar] [CrossRef]
  21. Yang, D.; Yi, T.; Li, H. Coupled fatigue-corrosion failure analysis and performance assessment of RC bridge deck slabs. J. Bridge Eng. 2017, 22, 4017077. [Google Scholar] [CrossRef]
  22. Wang, X. Effects of crack and climate change on service life of concrete subjected to carbonation. Appl. Sci. 2018, 8, 572. [Google Scholar] [CrossRef] [Green Version]
  23. Marques, P.F.; Costa, A. Service life of RC structures: Carbonation induced corrosion. Prescriptive vs. performance-based methodologies. Constr. Build. Mater. 2010, 24, 258–265. [Google Scholar] [CrossRef]
  24. Chen, Y.; Liu, P.; Yu, Z. Effects of environmental factors on concrete carbonation depth and compressive strength. Materials 2018, 11, 2167. [Google Scholar] [CrossRef] [Green Version]
  25. Wang, J.; Zheng, W.; Zhao, Y.; Zhang, X. Time-varying reliability evaluation of concrete based on carbonation Depth. Appl. Sci. 2019, 9, 5116. [Google Scholar] [CrossRef] [Green Version]
  26. Rastayesh, S.; Mankar, A.; Dalsgaard Sørensen, J.; Bahrebar, S. Development of stochastic fatigue model of reinforcement for reliability of concrete structures. Appl. Sci. 2020, 10, 604. [Google Scholar] [CrossRef] [Green Version]
  27. Al-Rousan, R.; Issa, M. Fatigue performance of reinforced concrete beams strengthened with CFRP sheets. Constr. Build. Mater. 2011, 25, 3520–3529. [Google Scholar] [CrossRef]
  28. Ganesh, P.; Ramachandra Murthy, A. Fatigue performance of damaged RC beams rehabilitated with GGBS based ultra high performance concrete. Int. J. Fatigue 2020, 138, 105707. [Google Scholar] [CrossRef]
  29. Sun, J.; Ding, Z.; Huang, Q. Development of EIFS-based corrosion fatigue life prediction approach for corroded RC beams. Eng. Fract. Mech. 2019, 209, 1–16. [Google Scholar] [CrossRef]
  30. Li, S.; Tang, H.; Gui, Q.; Ma, Z. Fatigue behavior of naturally corroded plain reinforcing bars. Constr. Build. Mater. 2017, 152, 933–942. [Google Scholar] [CrossRef]
  31. Jiang, C.; Huang, Q.; Gu, X.; Zhang, W. Experimental investigation on carbonation in fatigue-damaged concrete. Cement. Concrete Res. 2017, 99, 38–52. [Google Scholar] [CrossRef]
  32. Jiang, C.; Huang, Q.; Gu, X.; Zhang, W. Modeling the effects of fatigue damage on concrete carbonation. Constr. Build. Mater. 2018, 191, 942–962. [Google Scholar] [CrossRef]
  33. Zhang, W.; Ye, Z.; Gu, X.; Liu, X.; Li, S. Assessment of fatigue life for corroded reinforced concrete beams under uniaxial bending. J. Struct. Eng. 2017, 143, 4017048. [Google Scholar] [CrossRef]
  34. Verma, M.; Mishra, S.S. Coupled fatigue-corrosion life estimation of reinforced concrete beam: Numerical versus experimental approach. Struct. Concrete 2019, 20, 2194–2205. [Google Scholar] [CrossRef]
  35. Bastidas-Arteaga, E.; Bressolette, P.; Chateauneuf, A.; Sanchez-Silva, M. Probabilistic lifetime assessment of RC structures under coupled corrosion-fatigue deterioration processes. Struct. Saf. 2009, 31, 84–96. [Google Scholar] [CrossRef] [Green Version]
  36. Wu, J.; Xu, J.; Diao, B.; Jin, L.; Du, X. Fatigue life prediction for the reinforced concrete (RC) beams under the actions of chloride attack and fatigue. Eng. Struct. 2021, 242, 112543. [Google Scholar] [CrossRef]
  37. Ge, B.; Kim, S. Probabilistic service life prediction updating with inspection information for RC structures subjected to coupled corrosion and fatigue. Eng. Struct. 2021, 238, 112260. [Google Scholar] [CrossRef]
  38. Song, L.; Cui, C.; Liu, J.; Yu, Z.; Jiang, L. Corrosion-fatigue life assessment of RC plate girder in heavy-haul railway under combined carbonation and train loads. Int. J. Fatigue 2021, 151, 106368. [Google Scholar] [CrossRef]
  39. Zhang, Q. Mathematical modeling and numerical study of carbonation in porous concrete materials. Appl. Math. Comput. 2016, 281, 16–27. [Google Scholar] [CrossRef]
  40. Papadakis, V.G.; Fardis, M.N.; Vayenas, C.G. Effect of composition, environmental factors and cement-lime mortar coating on concrete carbonation. Mater. Struct. 1992, 25, 293–304. [Google Scholar] [CrossRef]
  41. Song, H.; Kwon, S.; Byun, K.; Park, C. Predicting carbonation in early-aged cracked concrete. Cement. Concrete Res. 2006, 36, 979–989. [Google Scholar] [CrossRef]
  42. GB50010-2010. Code for Design of Concrete Structures; China Architecture & Building Press: Beijing, China, 2015. (In Chinese) [Google Scholar]
  43. Papadakis, V.G.; Vayenas, C.G.; Fardis, M.N. Fundamental modeling and experimental investigation of concrete carbonation. ACI Mater. J. 1991, 88, 363–373. [Google Scholar]
  44. Wang, X.; Zhang, W.; Gu, X.; Dai, H. Determination of residual cross-sectional areas of corroded bars in reinforced concrete structures using easy-to-measure variables. Constr. Build. Mater. 2013, 38, 846–853. [Google Scholar] [CrossRef]
  45. GB/T 51355-2019. Standard for Durability Assessment of Existing Concrete Structures; China Architecture & Building Press: Beijing, China, 2019. (In Chinese) [Google Scholar]
  46. Li, J. Study on Fatigue Mechanics Behavior of Prestressed Concrete Bridges. Ph.D. Thesis, Central South University, Changsha, China, 2013. (In Chinese). [Google Scholar]
  47. Miner, M.A. Cumulative damage in fatigue. J. Appl. Mech. 1945, 12, A159–A164. [Google Scholar] [CrossRef]
  48. Ma, Y.; Wang, G.; Su, X.; Wang, L.; Zhang, J. Experimental and modelling of the flexural performance degradation of corroded RC beams under fatigue load. Constr. Build. Mater. 2018, 191, 994–1003. [Google Scholar] [CrossRef]
  49. Li, H.; Frangopol, D.M.; Soliman, M.; Xia, H. Fatigue reliability assessment of railway bridges based on probabilistic dynamic analysis of a coupled train-bridge system. J. Struct. Eng. 2016, 142, 4015158. [Google Scholar] [CrossRef]
  50. Li, X.; Wang, Z.; Ren, W. Time-Dependent Reliability Assessment of Reinforced Concrete Bridge under Fatigue Loadings. China Railw. Sci. 2009, 30, 49–53. (In Chinese) [Google Scholar]
  51. EN 1992-1-1 Eurocode 2: Design of Concrete Structures. General Rules. Rules for Buildings; European Committee for Standardization (CEN): Brussels, Belgium, 2014.
  52. Yan, D.; Luo, Y.; Lu, N.; Yuan, M.; Beer, M. Fatigue stress spectra and reliability evaluation of short-to medium-span bridges under stochastic and dynamic traffic loads. J. Bridge Eng. 2017, 22, 04017102. [Google Scholar] [CrossRef] [Green Version]
  53. Deng, L.; Yan, W.; Nie, L. A simple corrosion fatigue design method for bridges considering the coupled corrosion-overloading effect. Eng. Struct. 2019, 178, 309–317. [Google Scholar] [CrossRef]
  54. Bastidas-Arteaga, E. Reliability of reinforced concrete structures subjected to corrosion-fatigue and climate change. Int. J. Concr. Struct. Mater. 2018, 12, 77–89. [Google Scholar] [CrossRef] [Green Version]
Figure 1. Uniform corrosion of the reinforcing bar.
Mathematics 09 03296 g001
Figure 2. Corrosion-fatigue life prediction process for RC structures.
Mathematics 09 03296 g002
Figure 3. Details of the 6 m-span simply supported RC slab bridge.
Mathematics 09 03296 g003
Figure 4. Fatigue damage caused by a heavy vehicle passage.
Mathematics 09 03296 g004
Figure 5. Cumulative fatigue damage evolution under the design service condition.
Mathematics 09 03296 g005
Figure 6. Cumulative fatigue damage evolution with different traffic frequency cases.
Mathematics 09 03296 g006
Figure 7. Cumulative fatigue damage evolution with different overloading cases.
Mathematics 09 03296 g007
Figure 8. Corrosion-fatigue life with different traffic frequency and overloading cases.
Mathematics 09 03296 g008
Figure 9. Cumulative fatigue damage evolution with different carbonation environment grades: (a) f = 1000/day; (b) f = 3000/day; (c) f = 5000/day; and (d) f = 7000/day.
Mathematics 09 03296 g009aMathematics 09 03296 g009b
Figure 10. Corrosion-fatigue life under different carbonation environments.
Mathematics 09 03296 g010
Figure 11. Corrosion-fatigue life with different environmental temperatures and relative humidity under the carbonation environment grades (a) A, (b) B, (c) C, and (d) D.
Mathematics 09 03296 g011
Table 1. Description of the carbonation environment grades.
Grade of Carbonation
Environment
Descriptionmef
AA general indoor environment or a general outdoor environment without rain and pollution.1.0–1.2
BAn indoor humid environment, an indoor dry and wet alternative environment, or a slightly polluted environment without rain.1.2–2.5
CAn outdoor rain environment, an acid rain environment, a general freezing-thawing environment, or a heavily polluted environment.2.5–4.0
DAn outdoor rain environment in a humid and hot area.4.0–4.5
Table 2. Parameter values of the 6 m-span RC slab.
ParameterValueDescription
fcu30 MPaCubic compressive strength of concrete
fc20.1 MPaCompressive strength of concrete
ft1.43 MPaTensile strength of concrete
Ec3 × 104 MPaElastic modulus of concrete
vc0.2Poisson’s ratio of concrete
fy335 MPaYield strength of tensile reinforcement
Es2 × 105 MPaElastic modulus of tensile reinforcement
d018 mmDiameter of tensile reinforcement
c50 mmThickness of concrete cover
γ25 kN/m3Weight of reinforced concrete
mef2.5B-grade carbonation environment factor
T15 °CEnvironmental temperature
RH65%Environmental relative humidity
Publisher’s Note: MDPI stays neutral with regard to jurisdictional claims in published maps and institutional affiliations.

