
Discovery of Resident Behavior Patterns Using Machine Learning Techniques and IoT Paradigm

 , ,
, ,  and
and
Abstract
:
1. Introduction
2. Related Work
3. Materials and Methods
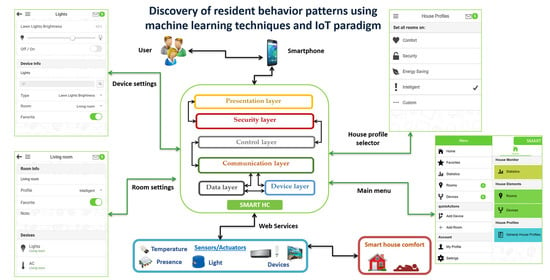
3.1. Smart Home Control’s Architecture
- Presentation layer represents the interface that enables a user to interact with the Smart Home Control platform.
- ○
- Mobile Application is an Android-based interface through which a user gets access to the system. From this interface, the user can request to show real-time or historical data, select between automatic or manual control of the IoT devices and define their configurations.
- Security layer represents the set of technological elements whose activity is necessary to ensure secure access to the platform’s functions.
- ○
- Authentication Module is responsible for validating the user’s access data with the information from the User Data module, through the implementation of the OAuth 2.0 authorization framework that enables a third-party application to obtain limited access to an HTTP service.
- Control layer represents the functionality of the platform. It contains the necessary methods to access each device’s functions connected to the Smart Home Control platform.
- ○
- User control module: A user has access to this module from the mobile application. From this module, the user can turn on, turn off, or change their devices’ configuration settings. This module does not use prediction models.
- ○
- Automatic control module: This module is in charge of processing the data from the devices’ readings. The module analyzes the information from the devices of the house to discover the behavior patterns and conditions by recording some action or state changes. Said analysis is carried out using the C4.5 machine learning algorithm that can avoid data overclassification and subsequent overtraining. C4.5 can also handle both discrete and continuous incomplete data [43]. It is essential to mention that the behavior patterns detected allow generating decision trees that are translated into automatic configuration rules applicable to each device.
- Communication layer is the software infrastructure needed to establish communication between the various modules and elements of the Smart Home Control platform.
- ○
- REST API contains methods that allow communication between the control layer, the device layer and the data layer. This layer collects data from sensor devices and transports the respective commands to control them.
- Data layer represents the information that Smart Home Control is focused on and the data of interest for the platform’s various modules.
- ○
- Device data corresponds to the stored data of each device connected to the platform. These data are mainly used to identify each device and its current status.
- ○
- Device history is the historical information that includes each change in status registered by a specific device. This information is crucial because the record of all the devices’ meaningful changes conveys the data necessary to analyze and discover the house inhabitants’ behavior patterns. This cumulative information will effectively carry out the training of the automatic control module of the system.
- ○
- User data corresponds to the stored data of the Smart Home Control users. These data are stored to personalize the user profile.
- ○
- House data represents the stored data of the house where the Smart Home Control platform is installed. It includes information about the rooms to which home automation control devices are associated.
- ○
- Configuration rules corresponds to the rules built by the automatic control module for each household device. The registered rules for a device may change as the automatic control module recognizes new device usage patterns.
- Device layer includes the communication technology necessary to control and monitor home automation devices. The intelligent system is implemented on this domotic system.
- ○
- Sensors: These are devices that detect and record changes in the environmental conditions (light, temperature, presence of people, etc.) for the home automation system.
- ○
- IoT Devices: These are devices connected to the domotic system through the use of IoT technology.
Smart Home Control Workflow
- The environment of a house should always provide access to domotic devices to obtain information of interest. It is advisable to consider an approach that includes IoT technology devices to facilitate communication and access to data corresponding to the history of use of the devices.
- The domotic devices, possibly having different communication interfaces, are accessed for reading and control purposes through web services. Each web service conforms to each device’s specific communication interface, returning the information in the appropriate format so that the platform correctly stores the data of interest for later analysis.
- The data obtained from the devices are stored and subsequently analyzed by taking advantage of the Weka API that already has an implementation of the C4.5 algorithm, which aims to classify the collected data and thus allow the discovery of resident use patterns.
- After the usage patterns have been discovered, it is then possible to build decision trees that serve as a base for constructing custom comfort setting rules for each specific home’s history. Consequently, each house where Smart Home Control is implemented will have appropriate rules fully adapted to the residents’ conditions, allowing the automatic control to be dynamic by following an “always training–always evolving” approach.
- Finally, these new configuration rules will allow the platform to send the proper instructions to the devices through web services, thus improving the house’s comfort conditions in terms of device control.
3.2. Automatic Control Module: Pattern Discovery
3.3. Experimental Case Study
- Users were asked to manually control their domotic devices via the mobile app for 10 months, from March to December 2019.
- During this period, data were collected on changes in the state of the devices and sensors in the house that served as input values to train the automatic configuration module.
- The records of the state of all devices connected to Smart Home Control obtained throughout each day of the week were used to get the home automation usage patterns. The states of each device determined the global state of the house.
- Once the dataset was obtained, an analysis of each device’s usage behavior was performed, taking into account the rest of the devices and sensors in the home.
- Each device was classified with possible “On” and “Off” values. Then, by using C4.5, decision trees were obtained whose conditions are based on the behavior observed during the training period. The rules resulting from the construction of the decision trees are dynamic and vary according to the particular behavior observed during the training.
- Precision is, in the data classification field, the fraction of items correctly classified as positive out of all items that the algorithm classified as positive. The calculation considers true positive classification instances (tp) between the sum of true positive and false positive (fp) instances as
- ○
- .
- Recall is the fraction of elements correctly classified as positive out of all the positive elements, and it is calculated considering true positive classification instances between the sum of true positive and false negative (fn) instances as
- ○
- F-measure provides a single score that balances both the concerns of precision and recall in one number, and it is calculated based on the precision and recall as
- ○
- Matthews Correlation Coefficient (MCC) measures the quality of binary (two-class) classifications taking into account true and false positives and negatives and returning values between −1 and +1, where +1 represents a perfect prediction and −1 indicates a total discrepancy between observation and prediction. The MCC can be calculated using the formula
- ○
- Receiver Operating Characteristics Area (ROC Area) represents a classification model’s performance at all classification thresholds. The PRC is a graph with:the x-axis showing False positive rate (FPR) calculated as
- ■
and the y-axis showing True positive rate (TPR) calculated as- ■
- Precision–Recall Curve Area (PRC Area) shows the relationship between precision and recall for every possible cut-off. The PRC is a graph with the x-axis showing recall and the y-axis showing precision
4. Results and Discussion
- The Automatic Control Module developed automatic configurations for each device, according to the data analysis carried out during the first observation period (March–December 2019).
- Residents could always cancel or update the orders established by the automatic control module to home automation devices.
- The devices’ usage pattern of the residents is not necessarily static, as it also depends on external factors and unrelated to measurement devices, such as mood, health or other personal considerations.
- Significant social changes, such as the confinement measures established against the recent COVID-19 pandemic, drastically impacted residents’ style and pace of life. This disruptive situation caused a radical change in the behavior patterns registered at home, which exacerbated the need for automatic configuration schemes.
- Some home automation devices may be less susceptible to subjective control factors by a resident. Consequently, these devices’ control rules do not change—for example, the turning on or off of the odor extractor when a resident enters the bathroom.
- The discovery of behavior patterns of the residents of a home is relevant to improving home automation conditions.
- The construction of automatic configuration rules must be dynamic and must evolve as residents’ behavior patterns change.
- The analysis of the residents’ behavior patterns accounts for continued training of the system. The training frees users from getting involved in making control decisions of their devices. However, no matter how close the system behaves to the residents, there will always be factors or conditions that cause changes in the home automation device usage.
- The automation of homes based on residents’ behavior patterns brings benefits and improvements in home automation control schemes. Some of the schemes that can be improved under this approach are comfort, energy-saving, safety and healthcare schemes.
- The human being is unpredictable, and behavior patterns can change drastically according to personal considerations, mood, mental health and medication.
5. Conclusions
Author Contributions
Funding
Institutional Review Board Statement
Informed Consent Statement
Data Availability Statement
Acknowledgments
Conflicts of Interest
References
- Reilly, E.D.; Ralston, A.; Hemmendinger, D. Encyclopedia of Computer Science; Nature Pub. Group: London, UK, 2000. [Google Scholar]
- Thema, J.; Suerkemper, F.; Couder, J.; Mzavanadze, N.; Chatterjee, S.; Teubler, J.; Thomas, S.; Ürge-Vorsatz, D.; Hansen, M.B.; Bouzarovski, S.; et al. The Multiple Benefits of the 2030 EU Energy Efficiency Potential. Energies 2019, 12, 2798. [Google Scholar] [CrossRef] [Green Version]
- Krishna, A.; Le Pallec, M.; Mateescu, R.; Noirie, L.; Salaun, G. IoT Composer: Composition and Deployment of IoT Applications. In Proceedings of the 2019 IEEE/ACM 41st International Conference on Software Engineering: Companion Proceedings (ICSE-Companion), Montreal, QC, Canada, 25–31 May 2019; pp. 19–22. [Google Scholar]
- Filho, G.P.R.; Villas, L.A.; Gonçalves, V.P.; Pessin, G.; Loureiro, A.A.; Ueyama, J. Energy-efficient smart home systems: Infrastructure and decision-making process. Internet Things 2019, 5, 153–167. [Google Scholar] [CrossRef]
- Reyes-Campos, J.; Alor-Hernández, G.; Machorro-Cano, I.; Sánchez-Cervantes, J.L.; Muñoz-Contreras, H.; Olmedo-Aguirre, J.O. Energy Saving by Using Internet of Things Paradigm and Machine Learning. In Lecture Notes in Computer Science (including subseries Lecture Notes in Artificial Intelligence and Lecture Notes in Bioinformatics); Springer Science and Business Media: Berlin/Heidelberg, Germany, 2020; pp. 447–458. [Google Scholar]
- Paredes-Valverde, M.A.; Alor-Hernández, G.; García-Alcaráz, J.L.; Salas-Zárate, M.D.P.; Colombo-Mendoza, L.O.; Sánchez-Cervantes, J.L. IntelliHome: An internet of things-based system for electrical energy saving in smart home environment. Comput. Intell. 2020, 36, 203–224. [Google Scholar] [CrossRef]
- Machorro-Cano, I.; Alor-Hernández, G.; Paredes-Valverde, M.A.; Rodríguez-Mazahua, L.; Sánchez-Cervantes, J.L.; Olmedo-Aguirre, J.O. HEMS-IoT: A Big Data and Machine Learning-Based Smart Home System for Energy Saving. Energies 2020, 13, 1097. [Google Scholar] [CrossRef] [Green Version]
- Azar, J.; Makhoul, A.; Barhamgi, M.; Couturier, R. An energy efficient IoT data compression approach for edge machine learning. Future Gener. Comput. Syst. 2019, 96, 168–175. [Google Scholar] [CrossRef] [Green Version]
- Valerio, L.; Conti, M.; Passarella, A. Energy efficient distributed analytics at the edge of the network for IoT environments. Pervasive Mob. Comput. 2018, 51, 27–42. [Google Scholar] [CrossRef]
- Mahdavinejad, M.S.; Rezvan, M.; Barekatain, M.; Adibi, P.; Barnaghi, P.; Sheth, A. Machine learning for internet of things data analysis: A survey. Digit. Commun. Netw. 2018, 4, 161–175. [Google Scholar] [CrossRef]
- Filho, G.P.R.; Mano, L.Y.; Valejo, A.D.B.; Villas, L.A.; Ueyama, J. A Low-Cost Smart Home Automation to Enhance Decision-Making based on Fog Computing and Computational Intelligence. IEEE Lat. Am. Trans. 2018, 16, 186–191. [Google Scholar] [CrossRef]
- Kasnesis, P.; Patrikakis, C.Z.; Venieris, I.S. Collective domotic intelligence through dynamic injection of semantic rules. In Proceedings of the 2015 IEEE International Conference on Communications (ICC), London, UK, 8–12 June 2015; pp. 592–597. [Google Scholar]
- Fensel, A.; Tomic, D.K.; Koller, A. Contributing to appliances’ energy efficiency with Internet of Things, smart data and user engagement. Future Gener. Comput. Syst. 2017, 76, 329–338. [Google Scholar] [CrossRef]
- Frontoni, E.; Liciotti, D.; Paolanti, M.; Pollini, R.; Zingaretti, P. Design of an interoperable framework with domotic sensors network integration. In Proceedings of the 2017 IEEE 7th International Conference on Consumer Electronics—Berlin (ICCE-Berlin), Berlin, Germany, 3–6 September 2017; pp. 49–50. [Google Scholar]
- Silva, E.M.; Agostinho, C.; Jardim-Goncalves, R. A multi-criteria decision model for the selection of a more suitable Internet-of-Things device. In Proceedings of the 2017 International Conference on Engineering, Technology and Innovation (ICE/ITMC), Funchal, Portuga, 27–29 June 2017; pp. 1268–1276. [Google Scholar]
- Wen, Y.; Wang, Z.; Zhang, Y.; Liu, J.; Cao, B.; Chen, J. Energy and cost aware scheduling with batch processing for instance-intensive IoT workflows in clouds. Future Gener. Comput. Syst. 2019, 101, 39–50. [Google Scholar] [CrossRef]
- Terroso-Saenz, F.; González-Vidal, A.; Ramallo-González, A.P.; Skarmeta, A.F. An open IoT platform for the management and analysis of energy data. Future Gener. Comput. Syst. 2019, 92, 1066–1079. [Google Scholar] [CrossRef]
- Pawar, P. Design and development of advanced smart energy management system integrated with IoT framework in smart grid environment. J. Energy Storage 2019, 25, 100846. [Google Scholar] [CrossRef]
- Zekić-Sušac, M.; Mitrović, S.; Has, A. Machine learning based system for managing energy efficiency of public sector as an approach towards smart cities. Int. J. Inf. Manag. 2020, 102074. [Google Scholar] [CrossRef]
- Rafsanjani, H.N.; Ghahramani, A.; Nabizadeh, A.H. iSEA: IoT-based smartphone energy assistant for prompting energy-aware behaviors in commercial buildings. Appl. Energy 2020, 266, 114892. [Google Scholar] [CrossRef]
- Martína, E.G.-; Rodrigues, C.F.; Rileyb, G.; Grahn, H. Estimation of energy consumption in machine learning. J. Parallel Distrib. Comput. 2019, 134, 75–88. [Google Scholar] [CrossRef]
- Li, X.; Chen, S.-Q.; Li, H.; Lou, Y.; Li, J. Multi-dimensional analysis of air-conditioning energy use for energy-saving management in university teaching buildings. Build. Environ. 2020, 185, 107246. [Google Scholar] [CrossRef]
- Raza, R.; Hassan, N.U.; Morstyn, T. Determination of consumer behavior based energy wastage using IoT and machine learning. Energy Build. 2020, 220, 110060. [Google Scholar] [CrossRef]
- Chacon-Troya, D.P.; Gonzalez, O.O.; Campoverde, P.C. Domotic application for the monitoring and control of residential electrical loads. In Proceedings of the 2017 IEEE 37th Central America and Panama Convention (CONCAPAN XXXVII), Managua, Nicaragua, 15–17 November 2017; pp. 1–6. [Google Scholar]
- Saba, D.; Degha, H.E.; Berbaoui, B.; Laallam, F.Z.; Maouedj, R. Contribution to the modeling and simulation of multiagent systems for energy saving in the habitat. In Proceedings of the 2017 International Conference on Mathematics and Information Technology (ICMIT), Adrar, Algeria, 4–5 December 2017; pp. 204–208. [Google Scholar] [CrossRef]
- Buono, P.; Balducci, F.; Cassano, F.; Piccinno, A. EnergyAware: A non-intrusive load monitoring system to improve the domestic energy consumption awareness. In EnSEmble 2019: Proceedings of the 2nd ACM SIGSOFT International Workshop on Ensemble-Based Software Engineering for Modern Computing Platforms August 2019; Association for Computing Machinery: New York, NY, USA, 2019; pp. 1–8. [Google Scholar] [CrossRef]
- Li, W.; Logenthiran, T.; Phan, V.-T.; Woo, W.L. Implemented IoT-Based Self-Learning Home Management System (SHMS) for Singapore. IEEE Internet Things J. 2018, 5, 2212–2219. [Google Scholar] [CrossRef]
- Elkhorchani, H.; Grayaa, K. Novel home energy management system using wireless communication technologies for carbon emission reduction within a smart grid. J. Clean. Prod. 2016, 135, 950–962. [Google Scholar] [CrossRef]
- Matsui, K. An Information Provision System as a Function of HEMS to Promote Energy Conservation and Maintain Indoor Comfort. Energy Procedia 2017, 105, 3213–3218. [Google Scholar] [CrossRef]
- Al-Turjman, F.; Altrjman, C.; Din, S.; Paul, A. Energy monitoring in IoT-based ad hoc networks: An overview. Comput. Electr. Eng. 2019, 76, 133–142. [Google Scholar] [CrossRef]
- Baker, T.; Asim, M.; Tawfik, H.; Aldawsari, B.; Buyya, R. An energy-aware service composition algorithm for multiple cloud-based IoT applications. J. Netw. Comput. Appl. 2017, 89, 96–108. [Google Scholar] [CrossRef] [Green Version]
- Ganesan, T.; Vasant, P.; Elamvazuthi, I. Advances in Metaheuristics: Applications in Engineering Systems; CRC Press: Boca Raton, FL, USA, 2016. [Google Scholar]
- Vasant, P.; Kose, U.; Watada, J. Metaheuristic Techniques in Enhancing the Efficiency and Performance of Thermo-Electric Cooling Devices. Energies 2017, 10, 1703. [Google Scholar] [CrossRef] [Green Version]
- Zelinka, I.; Tomaszek, L.; Vasant, P.; Dao, T.T.; Hoang, D.V. A novel approach on evolutionary dynamics analysis—A progress report. J. Comput. Sci. 2018, 25, 437–445. [Google Scholar] [CrossRef]
- Vasant, P.; Marmolejo, J.A.; Litvinchev, I.; Aguilar, R.R. Nature-inspired meta-heuristics approaches for charging plug-in hybrid electric vehicle. Wirel. Netw. 2019, 26, 4753–4766. [Google Scholar] [CrossRef]
- Li, D.; Deng, L.; Lee, M.; Wang, H. IoT data feature extraction and intrusion detection system for smart cities based on deep migration learning. Int. J. Inf. Manag. 2019, 49, 533–545. [Google Scholar] [CrossRef]
- Alli, A.A.; Alam, M.M. SecOFF-FCIoT: Machine learning based secure offloading in Fog-Cloud of things for smart city applications. Internet Things 2019, 7, 100070. [Google Scholar] [CrossRef]
- Lanfor, O.G.F.; Perez, J.F.P. Implementación de un sistema de seguridad independiente y automatización de una residencia por medio del internet de las cosas. In Proceedings of the 2017 IEEE Central America and Panama Student Conference (CONESCAPAN), Panama City, Panama, 20–22 September 2017; pp. 1–5. [Google Scholar]
- Malina, L.; Srivastava, G.; Dzurenda, P.; Hajny, J.; Fujdiak, R. A Secure Publish/Subscribe Protocol for Internet of Things. In ARES ′19, Proceedings of the 14th International Conference on Availability, Reliability and Security, Canterbury, UK, 26–29 August 2019; Association for Computing Machinery: New York, NY, USA, 2019; pp. 1–10. [Google Scholar]
- Mozaffari, N.; Rezazadeh, J.; Farahbakhsh, R.; Yazdani, S.; Sandrasegaran, K. Practical fall detection based on IoT technologies: A survey. Internet Things 2019, 8, 100124. [Google Scholar] [CrossRef]
- Din, I.U.; Guizani, M.; Rodrigues, J.J.; Hassan, S.; Korotaev, V. Machine learning in the Internet of Things: Designed techniques for smart cities. Future Gener. Comput. Syst. 2019, 100, 826–843. [Google Scholar] [CrossRef]
- Nizetic, S.; Šolić, P.; González-De-Artaza, D.L.-D.-I.; Patrono, L. Internet of Things (IoT): Opportunities, issues and challenges towards a smart and sustainable future. J. Clean. Prod. 2020, 274, 122877. [Google Scholar] [CrossRef]
- Singh, S.; Gupta, P. Comparative study id3, cart and c4.5 decision tree algorithm: A survey. Int. J. Adv. Inf. Sci. Technol. 2014, 27, 97–103. [Google Scholar]
- Sood, S.K.; Mahajan, I. A Fog-Based Healthcare Framework for Chikungunya. IEEE Internet Things J. 2018, 5, 794–801. [Google Scholar] [CrossRef]
- Kureshi, N.; Abidi, S.S.R.; Blouin, C. A Predictive Model for Personalized Therapeutic Interventions in Non-small Cell Lung Cancer. IEEE J. Biomed. Health Inform. 2016, 20, 424–431. [Google Scholar] [CrossRef] [PubMed]
- Pintelas, E.; Livieris, I.E.; Pintelas, P. A Grey-Box Ensemble Model Exploiting Black-Box Accuracy and White-Box Intrinsic Interpretability. Algorithms 2020, 13, 17. [Google Scholar] [CrossRef] [Green Version]


| Room | Dimensions of Room | Devices |
|---|---|---|
| Living room | 3.00 m × 2.20 m | Devices: television, stereo, three lights, air conditioning Sensors: natural light, temperature, presence |
| Dining room | 1.60 m × 3.00 m | Devices: three lights Sensors: presence, natural light |
| Kitchen | 1.40 m × 3.00 m | Devices: three lights Sensors: presence, natural light |
| Bathroom | 1.20 m × 2.40 m | Devices: two lights, odor extractor Sensors: presence, natural light |
| Bedroom 1 | 3.00 m × 2.80 m | Devices: television, two lights, two lamps, air conditioning Sensors: natural light, presence, temperature |
| Bedroom 2 | 3.00 m × 2.80 m | Devices: television, two lights, two lamps Sensors: natural light, presence, temperature |
| Day | Date | TV | Lights | AC | Temperature |
|---|---|---|---|---|---|
| Monday | 07/09/2019 | On | Off | Off | 20.0 °C |
| Monday | 07/09/2019 | Off | Off | On | 32.0 °C |
| Monday | 07/09/2019 | Off | Off | On | 27.0 °C |
| Monday | 07/09/2019 | Off | On | Off | 25.0 °C |
| Monday | 07/09/2019 | On | On | Off | 19.0 °C |
| Monday | 07/09/2019 | Off | Off | On | 25.0 °C |
| Tuesday | 08/09/2019 | On | On | On | 23.0 °C |
| Tuesday | 08/09/2019 | Off | Off | On | 23.0 °C |
| Tuesday | 08/09/2019 | On | Off | On | 21.0 °C |
| Tuesday | 08/09/2019 | Off | Off | On | 22.0 °C |
| Tuesday | 08/09/2019 | On | Off | On | 27.0 °C |
| Tuesday | 08/09/2019 | On | On | On | 21.0 °C |
| Tuesday | 08/09/2019 | Off | On | Off | 21.0 °C |
| Tuesday | 08/09/2019 | Off | Off | Off | 21.0 °C |
| Wednesday | 09/09/2019 | Off | Off | On | 23.0 °C |
| Wednesday | 09/09/2019 | Off | Off | On | 26.0 °C |
| Wednesday | 09/09/2019 | Off | Off | On | 16.0 °C |
| Wednesday | 09/09/2019 | Off | Off | On | 22.0 °C |
| Wednesday | 09/09/2019 | On | On | On | 26.0 °C |
| Wednesday | 09/09/2019 | Off | On | On | 21.0 °C |
| Wednesday | 09/09/2019 | Off | Off | On | 22.0 °C |
| Wednesday | 09/09/2019 | On | Off | On | 21.0 °C |
| Thursday | 10/09/2019 | On | Off | On | 28.0 °C |
| Thursday | 10/09/2019 | On | Off | On | 24.0 °C |
| Thursday | 10/09/2019 | On | Off | Off | 24.0 °C |
| Thursday | 10/09/2019 | Off | Off | On | 21.0 °C |
| Thursday | 10/09/2019 | Off | Off | On | 21.0 °C |
| Thursday | 10/09/2019 | Off | Off | On | 30.0 °C |
| Thursday | 10/09/2019 | On | On | On | 23.0 °C |
| Thursday | 10/09/2019 | Off | On | Off | 19.0 °C |
| Thursday | 10/09/2019 | Off | Off | Off | 22.0 °C |
| Friday | 11/09/2019 | Off | Off | Off | 20.0 °C |
| Friday | 11/09/2019 | On | Off | On | 28.0 °C |
| Friday | 11/09/2019 | Off | Off | On | 18.0 °C |
| Friday | 11/09/2019 | Off | Off | On | 16.0 °C |
| Friday | 11/09/2019 | On | Off | On | 22.0 °C |
| Friday | 11/09/2019 | Off | Off | On | 20.0 °C |
| Friday | 11/09/2019 | Off | On | On | 17.0 °C |
| Friday | 11/09/2019 | Off | Off | On | 20.0 °C |
| Friday | 11/09/2019 | Off | Off | Off | 22.0 °C |
| Attribute | Type | Device | Room | Description | Possible Values |
|---|---|---|---|---|---|
| TV @Livingroom | Nominal | Television | Living room | On/Off device log | [“On”, “Off”] |
| Stereo @ Livingroom | Nominal | Stereo | Living room | On/Off device log | [“On”, “Off”] |
| Lights @Livingroom | Nominal | Lights | Living room | On/Off device log | [“On”, “Off”] |
| NaturalLight @Livingroom | Nominal | Natural light sensor | Living room | Log of natural light in the room | [“Yes”, “No”] |
| AC @ Livingroom | Nominal | Air conditioner | Living room | On/Off device log | [“On”, “Off”] |
| Temp @Livingroom | Numeric | Temperature sensor | Living room | Temperature log (°C) | [Numeric value] |
| Presence @Livingroom | Nominal | Presence sensor | Living room | Log of human presence in the room | [“Yes”, “No”] |
| Presence @Diningroom | Nominal | Presence sensor | Dining room | Log of human presence in the room | [“Yes”, “No”] |
| Lights @Diningroom | Nominal | Lights | Dining room | On/Off device log | [“On”, “Off”] |
| NaturalLight@Diningroom | Nominal | Natural light sensor | Dining room | Log of natural light in the room | [“Yes”, “No”] |
| Presence @Kitchen | Nominal | Presence sensor | Kitchen | Log of human presence in the room | [“Yes”, “No”] |
| Lights @Kitchen | Nominal | Lights | Kitchen | On/Off device log | [“On”, “Off”] |
| NaturalLight @ Kitchen | Nominal | Natural light sensor | Kitchen | Log of natural light in the room | [“Yes”, “No”] |
| Presence @Bathroom | Nominal | Presence sensor | Bathroom | Log of human presence in the room | [“Yes”, “No”] |
| Lights @ Bathroom | Nominal | Lights | Bathroom | On/Off device log | [“On”, “Off”] |
| NaturalLight @ Bathroom | Nominal | Natural light sensor | Bathroom | Log of natural light in the room | [“Yes”, “No”] |
| Extractor @ Bathroom | Nominal | Odor extractor | Bathroom | On/Off device log | [“On”, “Off”] |
| TV @B1 | Nominal | Television | Bedroom 1 | On/Off device log | [“On”, “Off”] |
| Lights @B1 | Nominal | Lights | Bedroom 1 | On/Off device log | [“On”, “Off”] |
| Lamps @B1 | Nominal | Lamps | Bedroom 1 | On/Off device log | [“On”, “Off”] |
| NaturalLight @B1 | Nominal | Natural light sensor | Bedroom 1 | Log of natural light in the room | [“Yes”, “No”] |
| AC @B1 | Nominal | Air conditioner | Bedroom 1 | On/Off device log | [“On”, “Off”] |
| Temp @B1 | Numeric | Temperature sensor | Bedroom 1 | Temperature log (°C) | [Numeric value] |
| Presence @B1 | Nominal | Presence sensor | Bedroom 1 | Log of human presence in the room | [“Yes”, “No”] |
| TV @B2 | Nominal | Television | Bedroom 2 | On/Off device log | [“On”, “Off”] |
| Lights @B2 | Nominal | Lights | Bedroom 2 | On/Off device log | [“On”, “Off”] |
| Lamps @B2 | Nominal | Lamps | Bedroom 2 | On/Off device log | [“On”, “Off”] |
| NaturalLight @B2 | Nominal | Natural light sensor | Bedroom 2 | Log of natural light in the room | [“Yes”, “No”] |
| Presence @B2 | Nominal | Presence sensor | Bedroom 2 | Log of human presence in the room | [“Yes”, “No”] |
| Class Attribute | Selected Attributes |
|---|---|
| TV @Livingroom | Stereo @Livingroom |
| Presence @Livingroom | |
| AC @Bedroom1 | |
| Presence @Bedroom2 | |
| Stereo @Livingroom | TV @Livingroom |
| Lights @Livingroom | |
| TV @Bedroom1 | |
| Lights @Livingroom | Stereo @Livingroom |
| Presence @Livingroom | |
| NaturalLight @Diningroom | |
| Lights @Kitchen | |
| Lights @Bathroom | |
| Lights @Bedroom2 | |
| AC @Livingroom | Temperature @Livingroom |
| Presence @Livingroom | |
| Presence @Bedroom1 | |
| Lights @Diningroom | Stereo @Livingroom |
| Presence @Diningroom | |
| NaturalLight @Diningroom | |
| Lights @Kitchen | |
| Lights @Kitchen | Lights @Livingroom |
| Lights @Diningroom | |
| Presence @Kitchen | |
| TV @Bedroom2 | |
| Lights @Bathroom | Lights @Livingroom |
| Presence @Bathroom | |
| Extractor @Bathroom | |
| Lights @Bedroom1 | |
| Extractor @Bathroom | Presence @Bathroom |
| Lights @Bathroom | |
| TV @Bedroom1 | Lights @Bedroom1 |
| Lamps @Bedroom1 | |
| Presence @Bedroom1 | |
| Presence @Bedroom2 | |
| Lights @Bedroom1 | NaturalLight @Diningroom |
| Lights @Bathroom | |
| TV @Bedroom1 | |
| Lamps @Bedroom1 | |
| Presence @Bedroom1 | |
| Lamps @Bedroom1 | Temperature @Livingroom |
| TV @Bedroom1 | |
| Lights @Bedroom1 | |
| NaturalLight @Bedroom1 | |
| Presence @Bedroom1 | |
| Lamps @Bedroom2 | |
| AC @Bedroom1 | AC @Livingroom |
| Lights @Diningroom | |
| NaturalLight @Diningroom | |
| NaturalLight @Kitchen | |
| Lights @Bathroom | |
| TV @Bedroom1 | |
| Lights @Bedroom1 | |
| TV @Bedroom2 | Lights @Bedroom2 |
| Presence @Bedroom2 | |
| Lights @Bedroom2 | Lights @Livingroom |
| NaturalLight @Diningroom | |
| TV @Bedroom1 | |
| TV @Bedroom2 | |
| Lamps @Bedroom2 | Temperature @Livingroom |
| NaturalLight @Bedroom1 | |
| Lamps @Bedroom1 | |
| Presence @Bedroom2 |
| Class Attribute | Precision | Recall | F-Measure | MCC | ROC Area | PRC Area |
|---|---|---|---|---|---|---|
| TV @ Livingroom | 0.742 | 0.747 | 0.743 | 0.44 | 0.785 | 0.78 |
| Stereo Livingroom | 0.791 | 0.788 | 0.79 | 0.396 | 0.82 | 0.837 |
| Lights @Livingroom | 0.833 | 0.848 | 0.838 | 0.405 | 0.604 | 0.782 |
| AC @Livingroom | 0.947 | 0.949 | 0.946 | 0.744 | 0.722 | 0.883 |
| Lights @Diningroom | 0.876 | 0.879 | 0.877 | 0.639 | 0.844 | 0.863 |
| Lights @Kitchen | 0.819 | 0.808 | 0.813 | 0.456 | 0.787 | 0.826 |
| Lights @Bathroom | 0.887 | 0.889 | 0.888 | 0.674 | 0.878 | 0.893 |
| Extractor @Bathroom | 0.99 | 0.99 | 0.99 | 0.978 | 0.986 | 0.977 |
| TV @Bedroom1 | 0.806 | 0.818 | 0.81 | 0.394 | 0.674 | 0.77 |
| Lights @Bedroom1 | 0.847 | 0.828 | 0.835 | 0.502 | 0.706 | 0.794 |
| Lamps @Bedroom1 | 0.818 | 0.818 | 0.818 | 0.329 | 0.616 | 0.767 |
| AC @Bedroom1 | 0.879 | 0.909 | 0.89 | 0.164 | 0.65 | 0.88 |
| TV @Bedroom2 | 0.871 | 0.869 | 0.859 | 0.652 | 0.791 | 0.833 |
| Lights @Bedroom2 | 0.911 | 0.909 | 0.91 | 0.733 | 0.933 | 0.921 |
| Lamps@Bedroom2 | 0.835 | 0.838 | 0.837 | 0.594 | 0.789 | 0.789 |
| Class Attribute | Algorithm | Precision | Recall | F-Measure | MCC | ROC Area | PRC Area |
|---|---|---|---|---|---|---|---|
| TV @Livingroom | C4.5 | 0.742 | 0.747 | 0.743 | 0.44 | 0.785 | 0.78 |
| CART | 0.829 | 0.828 | 0.829 | 0.631 | 0.776 | 0.765 | |
| Adaboost | 0.848 | 0.848 | 0.848 | 0.671 | 0.883 | 0.854 | |
| Random Forest | 0.838 | 0.838 | 0.835 | 0.644 | 0.902 | 0.899 | |
| Stereo @Livingroom | C4.5 | 0.791 | 0.788 | 0.79 | 0.396 | 0.82 | 0.837 |
| CART | 0.758 | 0.778 | 0.764 | 0.293 | 0.777 | 0.813 | |
| Adaboost | 0.71 | 0.747 | 0.722 | 0.152 | 0.811 | 0.853 | |
| Random Forest | 0.802 | 0.818 | 0.791 | 0.385 | 0.859 | 0.874 | |
| Lights @Livingroom | C4.5 | 0.833 | 0.848 | 0.838 | 0.405 | 0.604 | 0.782 |
| CART | 0.722 | 0.798 | 0.75 | 0.017 | 0.486 | 0.705 | |
| Adaboost | 0.768 | 0.798 | 0.78 | 0.18 | 0.747 | 0.845 | |
| Random Forest | 0.865 | 0.869 | 0.841 | 0.446 | 0.764 | 0.852 | |
| AC @Livingroom | C4.5 | 0.947 | 0.949 | 0.946 | 0.744 | 0.722 | 0.883 |
| CART | 0.912 | 0.919 | 0.912 | 0.571 | 0.733 | 0.874 | |
| Adaboost | 0.907 | 0.899 | 0.902 | 0.56 | 0.819 | 0.914 | |
| Random Forest | 0.854 | 0.879 | 0.861 | 0.295 | 0.855 | 0.914 | |
| Lights @Diningroom | C4.5 | 0.876 | 0.879 | 0.877 | 0.639 | 0.844 | 0.863 |
| CART | 0.874 | 0.879 | 0.874 | 0.63 | 0.744 | 0.795 | |
| Adaboost | 0.862 | 0.869 | 0.862 | 0.594 | 0.894 | 0.919 | |
| Random Forest | 0.862 | 0.869 | 0.862 | 0.594 | 0.94 | 0.944 | |
| Lights @Kitchen | C4.5 | 0.819 | 0.808 | 0.813 | 0.456 | 0.787 | 0.826 |
| CART | 0.891 | 0.889 | 0.89 | 0.674 | 0.744 | 0.796 | |
| Adaboost | 0.875 | 0.879 | 0.877 | 0.626 | 0.921 | 0.926 | |
| Random Forest | 0.793 | 0.808 | 0.798 | 0.376 | 0.897 | 0.891 | |
| Lights @Bathroom | C4.5 | 0.887 | 0.889 | 0.888 | 0.674 | 0.878 | 0.893 |
| CART | 0.864 | 0.869 | 0.865 | 0.603 | 0.907 | 0.91 | |
| Adaboost | 0.821 | 0.828 | 0.824 | 0.48 | 0.876 | 0.902 | |
| Random Forest | 0.927 | 0.919 | 0.912 | 0.759 | 0.904 | 0.938 | |
| Extractor @Bathroom | C4.5 | 0.99 | 0.99 | 0.99 | 0.978 | 0.986 | 0.977 |
| CART | 0.96 | 0.96 | 0.959 | 0.909 | 0.981 | 0.969 | |
| Adaboost | 0.99 | 0.99 | 0.99 | 0.978 | 0.986 | 0.969 | |
| Random Forest | 0.98 | 0.98 | 0.98 | 0.955 | 0.99 | 0.988 | |
| TV @Bedroom1 | C4.5 | 0.806 | 0.818 | 0.81 | 0.394 | 0.674 | 0.77 |
| CART | 0.764 | 0.798 | 0.77 | 0.249 | 0.615 | 0.73 | |
| Adaboost | 0.786 | 0.778 | 0.782 | 0.336 | 0.778 | 0.836 | |
| Random Forest | 0.852 | 0.859 | 0.839 | 0.499 | 0.857 | 0.904 | |
| Lights @Bedroom1 | C4.5 | 0.847 | 0.828 | 0.835 | 0.502 | 0.706 | 0.794 |
| CART | 0.811 | 0.818 | 0.814 | 0.39 | 0.675 | 0.792 | |
| Adaboost | 0.884 | 0.889 | 0.885 | 0.622 | 0.875 | 0.886 | |
| Random Forest | 0.883 | 0.889 | 0.882 | 0.612 | 0.913 | 0.936 | |
| Lamps @Bedroom1 | C4.5 | 0.818 | 0.818 | 0.818 | 0.329 | 0.616 | 0.767 |
| CART | 0.793 | 0.808 | 0.8 | 0.236 | 0.703 | 0.8 | |
| Adaboost | 0.852 | 0.859 | 0.855 | 0.452 | 0.906 | 0.914 | |
| Random Forest | 0.892 | 0.899 | 0.889 | 0.581 | 0.919 | 0.943 | |
| AC @Bedroom1 | C4.5 | 0.879 | 0.909 | 0.89 | 0.164 | 0.65 | 0.88 |
| CART | ? | 0.919 | ? | ? | 0.396 | 0.837 | |
| Adaboost | 0.879 | 0.909 | 0.89 | 0.164 | 0.674 | 0.894 | |
| Random Forest | 0.934 | 0.929 | 0.903 | 0.341 | 0.821 | 0.937 | |
| TV @Bedroom2 | C4.5 | 0.871 | 0.869 | 0.859 | 0.652 | 0.791 | 0.833 |
| CART | 0.877 | 0.879 | 0.874 | 0.681 | 0.755 | 0.78 | |
| Adaboost | 0.833 | 0.838 | 0.832 | 0.57 | 0.841 | 0.86 | |
| Random Forest | 0.833 | 0.838 | 0.634 | 0.576 | 0.911 | 0.906 | |
| Lights @Bedroom2 | C4.5 | 0.911 | 0.909 | 0.91 | 0.733 | 0.933 | 0.921 |
| CART | 0.854 | 0.859 | 0.856 | 0.563 | 0.793 | 0.846 | |
| Adaboost | 0.867 | 0.869 | 0.868 | 0.6 | 0.955 | 0.956 | |
| Random Forest | 0.906 | 0.909 | 0.906 | 0.716 | 0.931 | 0.94 | |
| Lamps @Bedroom2 | C4.5 | 0.835 | 0.838 | 0.837 | 0.594 | 0.789 | 0.789 |
| CART | 0.803 | 0.808 | 0.805 | 0.513 | 0.752 | 0.768 | |
| Adaboost | 0.818 | 0.818 | 0.818 | 0.552 | 0.875 | 0.898 | |
| Random Forest | 0.822 | 0.828 | 0.823 | 0.557 | 0.908 | 0.924 |
| Algorithm | Precision | Recall | F-Measure | MCC | ROC Area | PRC Area |
|---|---|---|---|---|---|---|
| C4.5 | 33% | 33% | 27% | 40% | 0% | 0% |
| CART | 13% | 13% | 20% | 13% | 7% | 0% |
| Adaboost | 13% | 13% | 13% | 13% | 13% | 13% |
| Random Forest | 40% | 40% | 40% | 33% | 80% | 87% |
Publisher’s Note: MDPI stays neutral with regard to jurisdictional claims in published maps and institutional affiliations. |
© 2021 by the authors. Licensee MDPI, Basel, Switzerland. This article is an open access article distributed under the terms and conditions of the Creative Commons Attribution (CC BY) license (http://creativecommons.org/licenses/by/4.0/).
Share and Cite
Reyes-Campos, J.; Alor-Hernández, G.; Machorro-Cano, I.; Olmedo-Aguirre, J.O.; Sánchez-Cervantes, J.L.; Rodríguez-Mazahua, L. Discovery of Resident Behavior Patterns Using Machine Learning Techniques and IoT Paradigm. Mathematics 2021, 9, 219. https://doi.org/10.3390/math9030219
Reyes-Campos J, Alor-Hernández G, Machorro-Cano I, Olmedo-Aguirre JO, Sánchez-Cervantes JL, Rodríguez-Mazahua L. Discovery of Resident Behavior Patterns Using Machine Learning Techniques and IoT Paradigm. Mathematics. 2021; 9(3):219. https://doi.org/10.3390/math9030219
Chicago/Turabian StyleReyes-Campos, Josimar, Giner Alor-Hernández, Isaac Machorro-Cano, José Oscar Olmedo-Aguirre, José Luis Sánchez-Cervantes, and Lisbeth Rodríguez-Mazahua. 2021. "Discovery of Resident Behavior Patterns Using Machine Learning Techniques and IoT Paradigm" Mathematics 9, no. 3: 219. https://doi.org/10.3390/math9030219
APA StyleReyes-Campos, J., Alor-Hernández, G., Machorro-Cano, I., Olmedo-Aguirre, J. O., Sánchez-Cervantes, J. L., & Rodríguez-Mazahua, L. (2021). Discovery of Resident Behavior Patterns Using Machine Learning Techniques and IoT Paradigm. Mathematics, 9(3), 219. https://doi.org/10.3390/math9030219