Abstract
With the advent of science and technology, smart devices have become ubiquitous; since the display unit is a vital component in many smart devices, the Thin-Film Transistor Liquid-Crystal Displays (TFT-LCD) industry has been one of the most rapidly growing industries. Taiwanese manufacturers play a critical role in this industry. This study investigates key factors for supplier selection in Taiwan’s TFT-LCD industry. TFT-LCD is a technology-intensive industry. However, few studies in the past considered the technological abilities dimension in supplier selection. Therefore, this study discusses the factors related to the technological abilities dimension in supplier selection. Most research considered supplier selection based on the traditional criteria such as cost and quality. This study discusses the importance of the resilience criteria such as agility and flexibility. A method combining DEMATEL (Decision Making Trial and Evaluation Laboratory) and ANP (Analytic Network Process) is applied to analyze key factors for supplier selection in Taiwan’s TFT-LCD industry. The analytical results indicate that the technological abilities dimension and resilience criteria are at the forefront of the ranking in prominence. The influential weights of criteria and the causal diagram among all criteria derived from this study can offer guidance for suppliers on improving various factors to become desirable partners in the TFT-LCD industry supply chain.
1. Introduction
The global display industry has integrated the Internet of Things (IoT) in product development in the household, industrial, agricultural, medical, consumer, and financial fields. In 2019, world-renowned economic prediction institute IHS Markit [1] forecasted that overall panel demand in 2020 will increase by 9% compared with 2019. Despite competition from Organic Light-Emitting Diode (OLED) panels in 2017, the sale of small- and medium-sized Thin-Film Transistor Liquid-Crystal Displays (TFT-LCD) panels has continued to increase. Global shipments of small- to medium-sized TFT-LCD panels will be steady in a five-year forecast period to reach 1.82 billion units in 2025 [2].
The display industry has a clearly delineated upstream and downstream, and each field exhibits a clear professional division. The upstream supply chain involves six major components: glass base boards, plastic base boards, liquid crystals, backlight modules, polarizers, and photomasks; each component has its representative suppliers. The midstream panel factories mainly generate twisted nematic or super twisted nematic TFT-LCD and OLED panels. The downstream consists of various applications such as household electrical appliances, consumer electronics, vehicle instruments, and industrial products. The TFT-LCD supply chain has a one-way, top–down structure. Although simple, it has some hidden problems. For instance, if some problem occurs in any link of the supply chain, resulting in the inability to make deliveries on time to midstream and downstream vendors, the entire industry chain may become disordered. Due to the unique characteristics, the display industry is marked by short product lifespans, constantly changing market trends, and high barriers for entering and exiting the market. According to the Zeng [3] report, Taiwan’s production of small- to large-sized TFT-LCD panels accounts for 98% of the global market. Therefore, this study investigates the appropriate selections of upstream suppliers to ensure that the midstream TFT-LCD manufacturers can successfully provide panels for the downstream parties. The display industry supply chain is illustrated in Figure 1, referring to [4].
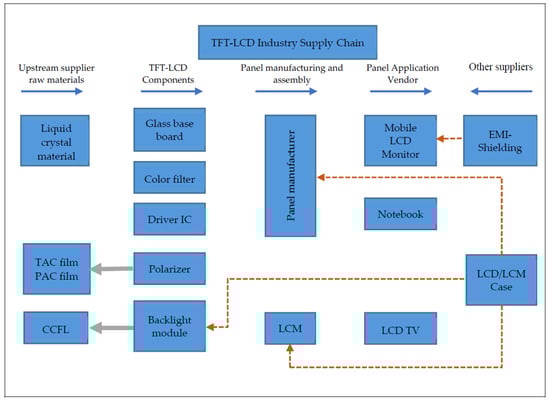
Figure 1.
The Thin-Film Transistor Liquid-Crystal Displays (TFT-LCD) industry supply chain [4].
Selecting a supplier is typically a complicated multiple criteria decision-making (MCDM) process that concentrates on Traditional Criteria (TC) such as cost and quality but ignores Resilience Criteria (RC) such as agility and flexibility [5]. In addition to confirming the TC, this research considers the RC—for instance, the ability to analyze and process abnormal raw materials, the supplier flexibility to deal with unexpected events, the ability to optimize production in a short time, and the speed in responding to customer complaints. This study integrates both the TC and RC and investigates the interdependence among the criteria and the influential weights of the criteria in selecting suppliers.
Many studies on the selection of display industry suppliers ignored in-depth discussions on technological abilities. Some research only mentioned that technological abilities might affect the factor of delivery date. However, TFT-LCD is a technology-intensive industry. In addition, the dimension of technological abilities is vital when selecting display industry suppliers from a literature review. Consequently, this study considers the dimension of technological abilities, including the ability to optimize production in a short time, the ability to develop new product designs, the production and manufacturing expertise, and the development process for building new products, in the analytical framework of selecting TFT-LCD industry suppliers.
In this study, a hybrid approach proposed by Ou Yang et al. [6] that combines the DEMATEL (Decision Making Trial and Evaluation Laboratory) with the ANP (Analytic Network Process) is adopted to analyze the key factors for supplier selection in the TFT-LCD industry. First, the DEMATEL is used to identify the criteria for supplier selection based on expert opinions; then, the ANP method is used to calculate the weights of the criteria. The major drawback of the DEMATEL is in lack of a self-feedback mechanism [7]. ANP can deal with the dependence and feedback between criteria. The overall ranking of critical factors for supplier selection is generated through the Borda count [8] to combine inconsistent results from different evaluation models. After determining the ranking of critical factors, it can be provided to the TFT-LCD panel suppliers as guidance on improving various factors. The ranking results can provide guidance for midstream panel vendors to select upstream suppliers. Gaining an industry advantage through the appropriate selection of suppliers is an important issue in the TFT-LCD industry.
The rest of this paper is organized as follows. Section 2 provides a literature review and constructs a preliminary research framework. In Section 3, we describe the research method including the DEMATEL, the DEMATEL based on ANP, and Borda count. In Section 4, the empirical results are analyzed to identify key factors for supplier selection in the TFT-LCD industry. Finally, Section 5 concludes the paper and gives suggestions for future improvements in the TFT-LCD industry as well as research directions for further work.
2. Literature Review
2.1. Research on Supplier Selection
In today’s constantly changing business environments, it is increasingly important for companies to interact with their suppliers [9]. Conventional closed and one-way communication with suppliers is unable to meet the uncertain demands of customers, because the rigidity of conventional models prevents them from flexibly adapting to emergencies. Therefore, selecting a suitable supplier to create long-term partnerships of mutual trust, in which both parties share information and respond to each other’s needs and market changes in a timely fashion, has become a major trend. Only in such situations can companies improve their market competitiveness and have more stable and long-term partnerships with suppliers. Mutual benefits between companies and suppliers from more interactions create greater competitive advantages [10].
Hybrid MCDM approaches have been widely used in academic research for supplier selection. Barak and Javanmard [11] integrated an interval valued fuzzy (IVF) version of the strength–weakness–opportunity–threats (SWOT) technique and the quantitative strategic planning matrix (QSPM) with gap analysis to find the most effective strategies for the alliance evaluation. Four IVF–MCDMs are developed to evaluate the strategic partners. Kumar and Dixit [12], in regard to recycling waste electrical and electronic equipment in India, investigated the key criteria for partner selection by using a hybrid MCDM approach including the Fuzzy Analytic Hierarchy Processes (FAHP) and VlseKriterijumska Optimizacija I Kompromisno Resenje (VIKOR). They found that resource and environmental management capabilities were considered as the most important criteria, and green core capabilities were ranked second for the selection of green recycling partners.
Aggarwal et al. [13] used the non-pre-emptive goal programming (GP) and weighted sum aggregate objective function (AOF) technique to solve the vendor selection and order allocation problem with multiple products. Mohammed et al. [5] used the DEMATEL method to determine the relative importance of each trasilient criterion for vendor selection. The ELimination Et Choix Traduisant la REalité (ELECTRE) method was used to evaluate and rank the vendors by their trasilience performance. Technique for Order of Preference by Similarity to Ideal Solution (TOPSIS) was also applied to evaluate the performance of vendors. The Spearman’s rank correlation coefficient (SRCC) approach was adopted to obtain the statistical difference between the ranking orders obtained from the ELECTRE and TOPSIS algorithms. Mohammed et al. [14] proposed an integrated Fuzzy AHP-Fuzzy TOPSIS to assess and rank suppliers based on conventional, green, and social standards.
Ang et al. [15] combined the Stochastic Multicriteria Acceptability Analysis (SMAA) technologies and Data Envelopment Analysis (DEA) to develop a two-stage SMAA-DEA research model. Their model resolves the DEA uncertainty and randomness measurements. In a competitive market environment, supplier selection is a crucial task that typically focuses on the accuracy of the delivery date, the reasonability of costs, and the level of quality. However, decision makers must increasingly consider sustainable economic, social, and environmental criteria. Sen et al. [16] used three intuitionist fuzzy sets including the Intuitionistic Fuzzy-TOPSIS (IF-TOPSIS), the Intuitionistic Fuzzy-Multi-Objective Optimization on the basis of Ratio Analysis (IF-MOORA), and the Intuitionistic Fuzzy-Grey Relational Analysis (IF-GRA) to obtain separate rankings of supplier candidates and substantiate the consistency of these approaches.
Since the adoption of the Kyoto Protocol by the United Nations Framework Convention on Climate Change (UNFCCC) in December 1997, some research has drawn attention to the issue of choosing green suppliers. By using the FAHP, Yadav et al. [17] determined four evaluation criteria for small- and medium-sized enterprises when selecting green suppliers: external environment effectiveness, environmental efficiency, green image, and environmental flexibility. In their study, an intelligent system was developed to deal with the supplier selection problem in small and medium-sized enterprises using an extent fuzzy TOPSIS method. Fan et al. [18] also released their quantitative and qualitative criteria for evaluating green suppliers. They used the Pythagorean fuzzy numbers to describe the qualitative criteria and then built a DEA model with unsatisfactory outputs under the Pythagorean fuzzy environment. Finally, a formula example was provided to illustrate the selection of green suppliers and verify the validity of the proposed method.
Fei [19] found that MCDM-based research methods were widely applied to deal with supplier selection issues. Typically, obtaining expert evaluations is the foundation of the decision-making process and affects the results of studies. However, uncertain information inevitably might be collected. These uncertainties refer to imprecisions and ambiguities resulting from human subjective judgments. Fei [19] stated that the D Number outperformed other methods as an effective tool for representing uncertain messages. Furthermore, the ANP methods were more widely used than AHPs because of their flexibility, rationality, and credibility. Therefore, the extension of the traditional ANP method using D numbers was adopted in Fei [19]. The summary of the hybrid MCDM approaches referenced in this study is listed in Table 1.

Table 1.
Summary of available hybrid multiple criteria decision-making (MCDM) approaches for supplier selection.
Most past research has some limitations. For instance, the criteria are not mutually exclusive when using the AHP method. This situation leads to irrational phenomena, such as the reversal of evaluation results [24]. The ANP method overcomes the inter-independence problem of the AHP factors [25]. Although the ANP method has been widely used in various applications, the following two problems still exist. The first is the question of comparison. Second, the key to the ANP method is to determine the relationship structure between features in advance [26]. Another way to deal with the interdependence among the criteria is using the DEMATEL method. The major disadvantage of the DEMATEL method is to assume that the criteria-iteration states may be interactive linearly, and no feedback loops are allowed in relationship maps [27]. This study combines the DEMATEL with the ANP to solve the above shortcomings.
2.2. Selection Criteria for Supplier Selection
Selecting suppliers is a complicated and critical decision process involving multiple criteria. The ranking of key criteria for supplier selection assists in making the optimal decision. As the business competition models transform and the production strategies change, the criteria for selecting appropriate suppliers also shift. Many studies have discussed the factors for supplier selection since the 1960s; one of the crucial studies has been conducted by Dickson [28]. Dickson [28] identified 23 different criteria in supplier selection and sent questionnaires to 273 purchasing agents and managers from the United States and Canada. The survey showed that quality, delivery, performance history, and warranties and claim policies are four major supplier evaluation criteria. Subsequently, several scholars conducted supplier selection and comparison research on the dimensions of quality, price, delivery date, and service. Weber et al. [29] analyzed 74 articles from 1966 to 1991 and found that net price is the most crucial factor in supplier selection, followed by delivery and quality.
As a result of the pressure from rapid changes in globalization over the past 20 years and the arrival of the information technology era, information interactions and flow between upstream and downstream agents in the supply chain have evolved. Suppliers must consider how to coordinate with midstream panel vendors to respond to emergencies and adapt to market needs and changes [30]. Mohammed et al. [5] found that suppliers were typically selected using the TC such as cost and quality, whereas the RC such as agility and flexibility were ignored. In addition, Chan and Chan [31] pointed out that due to the pressure of rapid changes in globalization, outsourcing activities have become increasingly prevalent. Therefore, the supplier selection has become more and more important and is part of the active efforts of various companies to incorporate business strategies. They summarized six major dimensions, including cost, logistics, flexibility, innovation, quality, and service capability and listed 20 evaluation criteria.
Combining with the selection criteria proposed by the aforementioned research, this study selects 19 factors as the selection criteria for Taiwan’s TFT-LCD suppliers. Table 2 lists 19 supplier selection criteria considered in this study.
Table 2.
Supplier selection criteria considered in this study.
2.3. Prototype Framework for Supplier Selection
From the 19 supplier selection criteria listed in Table 2, this study builds a prototype framework for supplier selection. Figure 2 indicates that the prototype framework for supplier selection consists of five dimensions: quality, cost, delivery date factors, technical abilities, and customer service.
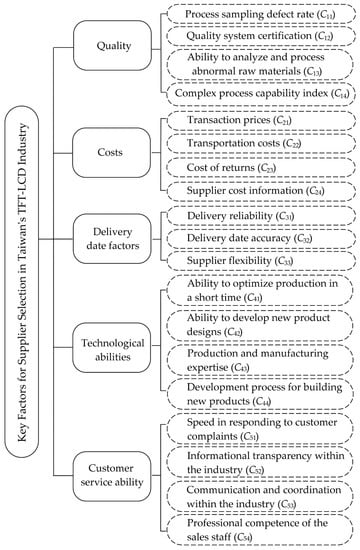
Figure 2.
The prototype framework for supplier selection.
3. Research Method
The aforementioned exploration of supplier selection criteria demonstrates that enterprises have shown increasing caution in and have attached greater value to supplier evaluations. This study uses the D-ANP (DEMATEL based on ANP) approach proposed by Ou Yang et al. [6] to identify the key factors for selecting TFT-LCD industry suppliers and analyze the interrelationships among the factors. The influential weights between criteria are also calculated to determine rankings of the key factors. This section discusses the D-ANP method utilized in this study.
3.1. The DEMATEL Method
The DEMATEL method was developed by the Battelle Memorial Institute of Geneva as part of their Science and Human Affairs Program from 1972 to 1976 to solve complex and intertwined problems [70,71]. The DEMATEL method is a comprehensive approach for constructing and analyzing structure models involving causal relationships among complex factors [72].
By using the DEMATEL method, researchers can improve understanding of specific problems or problem groups, and they also can provide and identify feasible solutions through hierarchical structures [69]. Scholars around the world have covered many aspects concerning the application of the DEMATEL, such as exploring the use of the DEMATEL as an analysis tool, applying the DEMATEL to the discussion of more complex corporate problems, finding primary and secondary problems through quantitative methods, highlighting direct and indirect correlation between problems, and lastly, identifying effective criteria for companies to solve problems in coordination with quantitative and qualitative multi evaluation index models.
3.2. The DEMATEL Procedure
The DEMATEL procedure is described as follows.
Step 1: Define the degrees of the dimension’s influence: A 5-point Likert scale is used as the evaluation metric, and the values denote the degree of the dimension’s influence. The semantic values are defined as 0, 1, 2, 3, and 4, which represent “no influence”, “low influence”, “moderate influence”, “high influence”, and “extremely high influence”, respectively.
Step 2: Establish a direct relationship matrix (A): The scores between factors in the returned questionnaires are averaged to build a direct correlation matrix (A); each value in the matrix represents the degree of influence between each pair of elements.
Step 3: Calculate the normalized relationship matrix (X): The direct relationship matrix (A) obtained from Step 1 is normalized using normalization coefficients to derive the normalized relationship matrix (X).
Step 4: Obtain the total influence matrix (T): After the equation T = X (I − X)−1 is used to obtain the total influence matrix (T), the value of each row is summed up to obtain the value of d, and the value of each column is summed up to obtain the value of r.
Step 5: Analyze causal relationships among criteria: From the total influence matrix, the sum of each row plus the sum of each column (i.e., d + r) is called prominence, which shows the relational intensity of the element. The greater the prominence becomes, the higher the degree of influential relationship is among the factors. The sum of each row minus the sum of every column (i.e., d − r) is called relation. If the relation is positive, then the element is referred to as a cause that actively affects other elements. If the relation is negative, then the element is referred to as an effect that is affected by other elements. Subsequently, the relationship of causes and effects can be depicted in a casual diagram with the prominence (d + r) in the horizontal axis and the relation (d − r) in the vertical axis. The casual diagram can reflect the complex causal relationship among the dimensions and criteria.
3.3. The DEMATEL Based on ANP (D-ANP)
The D-ANP is a hybrid MCDM that combines the DEMATEL and the ANP [73] methods. Although using the conventional average method (equal cluster-weighted) to obtain the weighted supermatrix in the ANP procedure is simple, it is likely to ignore the different degrees of influence among the dimensions [6]. Therefore, the D-ANP method was proposed to solve this problem. Furthermore, the super matrix that must be calculated in the ANP procedure can be transposed and normalized in the DEMATEL-derived total influence matrix (T); then, the weighted matrix is obtained and multiplied by itself until its value reaches a convergent fixed value. Thus, the weighted value of each dimension is obtained.
This study uses the D-ANP method proposed by Ou Yang et al. [6] to investigate the key factors for supplier selection by combining the DEMATEL and ANP. First, the DEMATEL is used to identify the criteria for supplier selection based on expert opinions; then, the ANP method is applied to calculate the weights of these key factors and determine which key factors are the most crucial. The calculation steps of the D-ANP method are indicated in Figure 3. Steps 1–4 are identical to steps 1–4 presented in Section 3.2. The total influence matrix derived from DEMATEL is used as an ANP unweighted supermatrix to generate the limiting supermatrix in steps 6 and 7. Finally, the overall ranking of selection criteria is calculated by Borda count based on the DEMATEL prominence and the final weight values from the D-ANP limiting supermatrix.
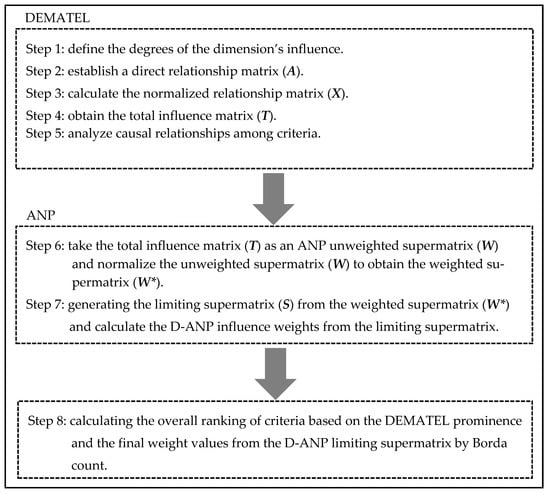
Figure 3.
Calculation steps of the D-ANP (DEMATEL (Decision Making Trial and Evaluation Laboratory) based on ANP (Analytic Network Process)) method.
Since both the DEMATEL and ANP provide the importance of each factor, this study utilizes the Borda count method to combine them instead of just relying on the importance of single method. The Borda count is a scoring method that produces a unique ranking way. For example, if the importance of a factor ranks second in the DEMATEL and fourth in the ANP, the Borda score will be six for this case. Therefore, a smaller Borda score means higher importance that can be used to rank key factors [74,75].
4. Data Analysis and Results
4.1. Formal Framework for Supplier Selection and Collecting Data
From reviewing the relevant literature, a prototype framework for supplier selection is designed, including five dimensions and 19 criteria as indicated in Figure 2. The criteria in the prototype framework are revised and confirmed by a selected panel of experts in the display industry. Based on the experts’ opinions, the fourth criterion “complex process capability index” is integrated into the first criterion “process sampling defect rate”.
Three experts are invited to evaluate the necessity of the criteria for supplier selection in the TFT-LCD industry. The Consensus Deviation Index (CDI) is used to validate the consistency of experts’ consensus on each criterion. The smaller the CDI value, the higher the degree of experts’ consensus. This study adopts the maximum average rating method proposed by Teng [76] to set the threshold for the consistency of experts’ consensus as 0.1 in the first round of necessity rating. The first round of necessity rating finds that five out of 18 criteria exhibited CDI values greater than 0.1. That is, the experts do not reach consensus on some of criteria. The experts are asked to provide reasons for their choices inconsistent with others and then performed the second necessity rating. In the second round of necessity rating, 18 criteria all exhibit CDI values below than 0.1. The experts have consensus to maintain 18 criteria for supplier selection in the TFT-LCD industry. By integrating the fourth criterion “complex process capability index” into the first criterion “process sampling defect rate”, the formal framework for supplier selection includes five dimensions and 18 criteria.
The D-ANP questionnaires are designed using the formal research framework. The questionnaires are distributed to ten experts who still work in the display industry on 21 January 2019, and all questionnaires are returned. The average age of the experts is over 40 years old, and the average working experience is over 15 years. Seven and three of the experts had master and doctoral degrees, respectively. The experts in private corporations are all in management level. Others in research organizations are senior researchers or management-level employees. One expert is employed in a small- and medium-sized panel manufacturer, four experts are employed in large-sized panel manufacturers, and five experts are employed in research organizations. Every expert has extensive practical and research experiences in the display industry. The evaluation rubric designed for this study uses scores between 0 and 10 as listed in Table 3.
Table 3.
Rubric for evaluating degree of influence.
4.2. Constructing the Casual Diagram of Selection Criteria
4.2.1. Establishing the Direct Influence Matrix
The questionnaires are filled in by experts to evaluate the degree of influence among criteria. Table 4 displays the direct relation matrix (A) generated based on the results from the various experts.
Table 4.
Direct influence matrix.
4.2.2. Establishing the Normalized Relationship Matrix
Each factor in the direct relation matrix is multiplied by , where is the components of matrix A, to obtain the normalized influence matrix (X) listed in Table 5.
Table 5.
Normalized relationship matrix.
4.2.3. Establishing the Total Influence Matrix
The total influence matrix (T) is generated by , where I is the identity matrix. Table 6 displays the total influence matrix (T).
Table 6.
Total influence matrix.
4.2.4. Finding the Prominence and Relation Among the Criteria
From the total influence matrix, the sum of rows plus the sum of columns is called prominence. The sum of rows minus the sum of columns is called relation. The results are summarized in Table 7. The criterion with a higher prominence is a more important factor for supplier selection. Figure 4 depicts a causal diagram to express the relationship among significant criteria that have prominence values higher than the average prominence (8.89594).
Table 7.
Prominence and relation among the criteria.
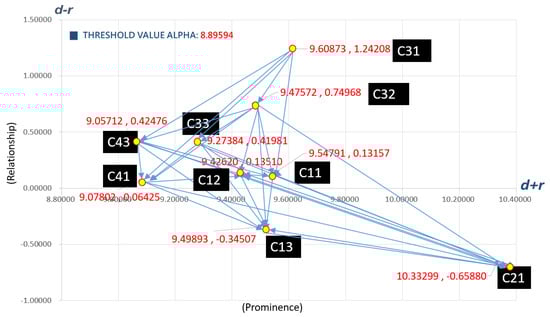
Figure 4.
A causal diagram of key factors for supplier selection in the TFT-LCD industry.
Figure 4 indicates that the factor of transaction prices has the highest prominence value. Furthermore, a positive relation value indicates that the criterion is a cause and will affect the performance of other criteria. Conversely, a negative value indicates that the criterion is an effect and will be influenced by other criteria. Mohammed et al. [5] revealed that in past studies, suppliers were typically selected according to the TC such as cost and quality, ignoring the RC such as agility and flexibility. In this study, the RCs have high rankings in the prominence, particularly the ability to analyze and process abnormal raw materials (C13) with a prominence value of 9.49893, the supplier flexibility (C33) with a prominence value of 9.27384, and the ability to optimize production in a short time (C41) with a prominence value of 9.07802. Section 1 has mentioned that many studies on the criteria of supplier selection in the display industry neglected the factor of technological abilities. However, TFT-LCD is a technology-intensive industry, and the literature review indicated that technological abilities is a significant dimension in the selection of suppliers in the display industry. The analytical results in Table 8 demonstrate that technological abilities (D4) ranks first in prominence among five dimensions.
Table 8.
Ranking of prominence among dimensions in this research.
4.2.5. Generating the Weighted Super Matrix
The total influence matrix (T), , where is the identity matrix, calculated using the DEMATEL, is regarded as the unweighted matrix in the D-ANP. Each value in the unweighted matrix is divided by the total of its row to obtain the D-ANP weighted supermatrix as listed in Table 9.
Table 9.
D-ANP weighted supermatrix.
4.2.6. Generating the Limiting Super Matrix
After multiplying the weighted super matrix by itself until it becomes convergent and the value reaches a fixed number, we obtain the limiting supermatrix as displayed in Table 10.
Table 10.
The limiting supermatrix.
4.3. Calculating and Ranking the Key Factors
The main drawback in the DEMATEL method is that no feedback loops are allowed in relationship maps. This study applies the ANP to overcome the problem of dependence and feedback among criteria [7]. Since both DEMATEL prominence and D-ANP weights provide the importance of each factor, this study integrates them using the Borda count [77] to avoid the shortcomings of each single evaluation ranking method and to combine the inconsistent results from different ranking models. The ranking of DEMATEL prominence and the ranking of the final weight values from the D-ANP limiting super matrix are summed up to a single Borda score, which is used to generate the overall ranking. Table 11 lists the overall ranking of selection criteria. A smaller Borda score implies a more critical criterion with greater importance. Table 11 demonstrates that among the 18 criteria, display panel vendors rate delivery reliability (C31), transaction prices (C21), process sampling defect rate (C11), delivery date accuracy (C32), and supplier flexibility (C33) as the most important factors when selecting the upstream parts suppliers.
Table 11.
Overall ranking of criteria for supplier selection.
5. Conclusions and Suggestions
This study constructs a research framework to analyze the key factors for supplier selection in Taiwan’s TFT-LCD industry by a literature review and expert interviews. This section summarizes the analytical results of the key factors and provides appropriate suggestions to the upstream parts suppliers. The results can also be a reference for academic research and practical operations.
Many past studies on the selection of suppliers in the display industry have lacked in-depth discussions on technological abilities. Some papers only discussed technological abilities by embedding it under the dimension of delivery factors. Through a literature review, this study finds that technology ability is a crucial evaluation dimension for selecting suppliers in the display industry. Consequently, technological abilities (D4) is regard as a main dimension in the research framework. Analytical results also indicate that the overall ranking of prominence among dimensions is determined in descending order as follows: technological abilities (D4), customer service abilities (D5), quality (D1), delivery factors (D3), and costs (D2). The top five key criteria are delivery reliability (C31), transaction prices (C21), process sampling defect rate (C11), delivery date accuracy (C32), and supplier flexibility (C33).
Past studies found that supplier selection is a complex multicriteria decision-making process based on the TC such as cost and quality, and ignoring the RC such as agility and flexibility. In addition to confirming traditional supplier selection criteria such as delivery accuracy (C32), transaction prices (C21), and quality system certification (C12), this study further considered the RC: ability to analyze and process abnormal raw materials (C13), supplier flexibility (C33), ability to optimize production in a short time (C41), and speed in responding to customer complaints (C51).
In the DEMATEL causal diagram, there are seven core factors in the first quadrant and two major influenced factors in the fourth quadrant. Delivery reliability is defined as the supplier’s ability to provide a steady supply under specific conditions. Steady delivery increases advantages in price negotiations between suppliers and midstream panel vendors, and establishes transactions between both parties on a foundation of mutual trust and confidence. This also leads to more desirable transaction prices. Delivery date accuracy refers to whether the supplier can deliver stock by the specified time. Delivery date accuracy increases the customers’ confidence in the vendor and encourages customers to maintain a constant partnership with the vendor. This indirectly affects the transaction prices and enhances flexibility in price negotiation. Supplier flexibility refers to the supplier’s ability to react and set goals under uncertainty. Flexible suppliers can quickly adapt to changes in the external environments or within the organizations. The flexible ability is vital to the company’s future growth prospects.
Although the current framework is constructed and reviewed by experts in the display industry, some suggestions are provided for future research. As a result of the limitations on time and resource in this study, the survey was distributed only to key persons in the supply chain. Future researchers could collect more diverse opinions and feedback to strengthen the analysis of key factors for supplier selection. Additionally, the survey respondents were mostly concentrated among mid- and high-level management or senior engineers with five or more years of work experience. Since these respondents have accumulated a certain amount of work qualifications and experience, they may have completed the survey from the perspective of a decision-maker or manager. The responses may lack the perspective of suppliers that provide services on the front lines. Future researchers should increase more respondents to get more viewpoints dimensionally.
Author Contributions
Conceptualization, J.-F.T. and S.-W.H.; methodology, J.-F.T. and S.-W.H.; software, C.-P.W. and S.-W.H.; validation, J.-F.T. and M.-H.L.; formal analysis, J.-F.T. and M.-H.L.; investigation, C.-P.W. and S.-W.H.; resources, C.-P.W. and S.-W.H.; data curation, C.-P.W. and S.-W.H.; writing—original draft preparation, C.-P.W. and S.-W.H.; writing—review and editing, M.-H.L.; visualization, C.-P.W.; supervision, J.-F.T. and M.-H.L.; project administration, J.-F.T.; funding acquisition, J.-F.T. and M.-H.L. All authors have read and agreed to the published version of the manuscript.
Funding
This research was supported in part by the Ministry of Science and Technology in Taiwan under Grants MOST 108-2410-H-027-018, MOST 109-2410-H-027-012-MY2 and MOST 108-2410-H-845-028.
Institutional Review Board Statement
Not applicable.
Informed Consent Statement
Not applicable.
Data Availability Statement
Not applicable.
Conflicts of Interest
The authors declare no conflict of interest.
References
- IHS Markit Limited. IHS Markit Report Fourth Quarter 2019 Results; IHS Markit Ltd.: London, UK, 2020. [Google Scholar]
- Global Small- to Mid-Size LCD Panel Shipments to Stay Steady in 2020–2025. Available online: https://www.daystar-display.com.tw/news/main_detail.php?id=96 (accessed on 20 December 2020).
- Zeng, J. 2018 Taiwan’s Display Panel Manufacturing Industry Analysis; Taiwan Economic Research Institute: Taipei, Taiwan, 2018. [Google Scholar]
- Amber. Science Policy Research and Information Center of Taiwan National Applied Research Laboratories, 2006. Available online: https://iknow.stpi.narl.org.tw/post/read.aspx?postid=2972 (accessed on 20 December 2020).
- Mohammed, A.; Harris, I.; Dukyil, A. A trasilient decision making tool for vendor selection: A hybrid-MCDM algorithm. Manag. Decis. 2019, 57, 372–395. [Google Scholar] [CrossRef]
- Ou Yang, Y.P.; Leu, J.D.; Tzeng, G.-H. A novel hybrid MCDM model combined with DEMATEL and ANP with applications. Int. J. Oper. Res. 2008, 5, 160–168. [Google Scholar]
- Yu, R. MCDM Combined with Fuzzy Decision Maps for the Structural Modeling Problem; National Taiwan University: Taipei, Taiwan, 2008. [Google Scholar] [CrossRef]
- Borda, J.C. Mémoire sur les élections par scrutin. Mém. Acad. R. Sci. Ann. 1784, 1781, 657–665. [Google Scholar]
- Ecer, F.; Pamucar, D. Sustainable supplier selection: A novel integrated fuzzy best worst method (F-BWM) and fuzzy CoCoSo with Bonferroni (CoCoSo’B) multi-criteria model. J. Clean. Prod. 2020, 266, 121981. [Google Scholar] [CrossRef]
- Jedynak, M. Systematic review of the literature on supplier code of conduct. Int. J. Contemp. Manag. 2018, 17, 153–171. [Google Scholar] [CrossRef]
- Barak, S.; Javanmard, S. Outsourcing modelling using a novel interval-valued fuzzy quantitative strategic planning matrix (QSPM) and multiple criteria decision-making (MCDMs). Int. J. Prod. Econ. 2020, 222, 107494. [Google Scholar] [CrossRef]
- Kumar, A.; Dixit, G. A novel hybrid MCDM framework for WEEE recycling partner evaluation on the basis of green competencies. J. Clean. Prod. 2019, 241, 118017. [Google Scholar] [CrossRef]
- Aggarwal, R.; Singh Surya, P.; Kapur, P.K. Integrated dynamic vendor selection and order allocation problem for the time dependent and stochastic data. Benchmark. Int. J. 2018, 25, 777–796. [Google Scholar] [CrossRef]
- Mohammed, A.; Harris, I.; Govindan, K. A hybrid MCDM-FMOO approach for sustainable supplier selection and order allocation. Int. J. Prod. Econ. 2019, 217, 171–184. [Google Scholar] [CrossRef]
- Ang, S.; Zhu, Y.; Yang, F. Efficiency evaluation and ranking of supply chains based on stochastic multicriteria acceptability analysis and data envelopment analysis. Int. Trans. Oper. Res. 2019, 1–30. [Google Scholar] [CrossRef]
- Sen, D.K.; Datta, S.; Mahapatra, S.S. Sustainable supplier selection in intuitionistic fuzzy environment: A decision-making perspective. Benchmark. Int. J. 2018, 25, 545–574. [Google Scholar] [CrossRef]
- Yadav, V.; Sharma, M.K.; Singh, S. Intelligent evaluation of suppliers using extent fuzzy TOPSIS method. Benchmark. Int. J. 2018, 25, 259–279. [Google Scholar] [CrossRef]
- Fan, J.; Liu, X.; Wu, M.; Wang, Z. Green supplier selection with undesirable outputs DEA under Pythagorean fuzzy environment. J. Intell. Fuzzy Syst. 2019, 37, 2443–2452. [Google Scholar] [CrossRef]
- Fei, L. D-ANP: A multiple criteria decision making method for supplier selection. Appl. Intell. Int. J. Res. Intell. Syst. Real Life Complex Probl. 2020, 2537–2554. [Google Scholar] [CrossRef]
- Adetunji, O.; Bischoff, J.; Willy, C.J. Managing system obsolescence via multicriteria decision making. Syst. Eng. 2018, 21, 307–321. [Google Scholar] [CrossRef]
- Bai, C.; Sarkis, J. Integrating sustainability into supplier selection: A grey-based TOPSIS analysis. Technol. Econ. Dev. Econ. 2018, 24, 2202–2224. [Google Scholar] [CrossRef]
- Liu, T.; Deng, Y.; Chan, F. Evidential Supplier Selection Based on DEMATEL and Game Theory. Int. J. Fuzzy Syst. 2018, 20, 1321–1333. [Google Scholar] [CrossRef]
- Singh, R.K.; Kansara, S.; Vishwakarma, N.K. Vendor rating system for an Indian start-up: A combined AHP & TOPSIS approach. Meas. Bus. Excell. 2018, 22, 220–241. [Google Scholar] [CrossRef]
- Meade, L.; Sarkis, J. Analyzing organizational project alternatives for agile manufacturing processes: An analytical network approach. Int. J. Prod. Res. 1999, 37, 241–261. [Google Scholar] [CrossRef]
- Cheng, E.W.L.; Li, H. Application of ANP in process models: An example of strategic partnering. Build. Environ. 2007, 42, 278–287. [Google Scholar] [CrossRef]
- Asadabadi, M.R.; Chang, E.; Saberi, M.; Zhou, Z. Are MCDM methods useful? A critical review of Analytic Hierarchy Process (AHP) and Analytic Network Process (ANP). Cogent Eng. 2019, 6, 1–12. [Google Scholar] [CrossRef]
- Lee, H.-S.; Tzeng, G.-H.; Yeih, W.; Wang, Y.-J.; Yang, S.-C. Revised DEMATEL: Resolving the Infeasibility of DEMATEL. Appl. Math. Model. 2013, 37, 6746–6757. [Google Scholar] [CrossRef]
- Dickson, G.W. An analysis of vendor selection systems and decisions. J. Purch. 1966, 2, 5–17. [Google Scholar] [CrossRef]
- Weber, C.A.; Current, J.R.; Benton, W. Vendor selection criteria and methods. Eur. J. Oper. Res. 1991, 50, 2–18. [Google Scholar] [CrossRef]
- Cutting-Decelle, A.-F.; Young, B.; Das, B.P.; Case, K.; Rahimifard, S.; Anumba, C.J.; Bouchlaghem, D. A review of approaches to supply chain communications: From manufacturing to construction. ITcon 2007, 12, 73–102. [Google Scholar]
- Chan Albert, P.C.; Chan Ada, P.L. Key performance indicators for measuring construction success. Benchmark. Int. J. 2004, 11, 203–221. [Google Scholar] [CrossRef]
- Li, C.; Tong, S.; Wang, K. Optimal Scheme for Process Quality and Cost Control by Integrating a Continuous Sampling Plan and the Process Yield Index. Discret. Dyn. Nat. Soc. 2018, 1–14. [Google Scholar] [CrossRef]
- Wang, C.-H.; Chen, K.-S. New process yield index of asymmetric tolerances for bootstrap method and six sigma approach. Int. J. Prod. Econ. 2020, 219, 216–223. [Google Scholar] [CrossRef]
- Ball, O.; Zylberberg, C. Towards a common framework for defining ancillary material quality across the development spectrum. Cytotherapy 2019, 21, 1234–1245. [Google Scholar] [CrossRef]
- Sunil Kumar, C.V.; Routroy, S. Measuring interdependencies of preferred supplier enablers. Benchmark. Int. J. 2018, 25, 2344–2369. [Google Scholar] [CrossRef]
- Gatto, A.; Drago, C. Measuring and modeling energy resilience. Ecol. Econ. 2020, 172, 106527. [Google Scholar] [CrossRef]
- Jain, N.; Singh, A.R. Sustainable supplier selection under must-be criteria through Fuzzy inference system. J. Clean. Prod. 2020, 248, 119275. [Google Scholar] [CrossRef]
- Chen, J.; Zhu, F.; Li, G.Y.; Ma, Y.Z.; Tu, Y.L. Capability index of a complex-product machining process. Int. J. Prod. Res. 2012, 50, 3382–3394. [Google Scholar] [CrossRef]
- Kane, V. Process Capability Indices. J. Qual. Technol. 1986, 18, 41–52. [Google Scholar] [CrossRef]
- Mizuno, T.; Takauchi, K. Optimal export policy with upstream price competition. Manch. Sch. 2018, 88, 324–348. [Google Scholar] [CrossRef]
- Pang, Q.; Li, M.; Yang, T.; Shen, Y. Supply Chain Coordination with Carbon Trading Price and Consumers’ Environmental Awareness Dependent Demand. Math. Probl. Eng. 2018, 2018, 8749251. [Google Scholar] [CrossRef]
- Burda, A. Components and influencing factors of transport costs in logistics. Knowl. Horiz. Econ. 2018, 10, 56–60. [Google Scholar]
- Karimi, B.; Ghare Hassanlu, M.; Niknamfar, A.H. An integrated production-distribution planning with a routing problem and transportation cost discount in a supply chain. Assem. Autom. 2019, 39, 783–802. [Google Scholar] [CrossRef]
- Milewski, D. Impact of e-commerce on external transport costs. Sci. J. Marit. Univ. Szczec. 2019, 130, 147–153. [Google Scholar] [CrossRef]
- Mosca, A.; Vidyarthi, N.; Satir, A. Integrated transportation—Inventory models: A review. Oper. Res. Perspect. 2019, 6, 100101. [Google Scholar] [CrossRef]
- Kros, J.F.; Kirchoff, J.F.; Falasca, M. The impact of buyer-supplier relationship quality and information management on industrial vending machine benefits in the healthcare industry. J. Purch. Supply Manag. 2019, 25, 100506. [Google Scholar] [CrossRef]
- Shi, Y.; Zhou, L.; Qu, T.; Qi, Q. Strategic introduction of the marketplace channel considering logistics costs and product information. Proc. CIRP 2019, 83, 728–732. [Google Scholar] [CrossRef]
- Paul, S.K.; Asian, S.; Goh, M.; Torabi, S.A. Managing sudden transportation disruptions in supply chains under delivery delay and quantity loss. Ann. Oper. Res. 2019, 273, 783–814. [Google Scholar] [CrossRef]
- Qamar, A.; Hall, M.A.; Collinson, S. Lean versus agile production: Flexibility trade-offs within the automotive supply chain. Int. J. Prod. Res. 2018, 56, 3974–3993. [Google Scholar] [CrossRef]
- Camejo, A.B.; Moignier, A.; Delpon, G.; Chiavassa, S. 5 VMAT modulation indexes for predicting plan delivery accuracy: The ICO experience. Phys. Med. 2019, 68, 4. [Google Scholar] [CrossRef]
- Kogan, K.; Chernonog, T.; Avinadav, T. The effect of delivery deviations on the choice of a supplier and the supply-chain equilibrium. Appl. Math. Model. 2018, 62, 368–382. [Google Scholar] [CrossRef]
- Lee, N.C.-A.; Wang, E.T.G.; Grover, V. IOS drivers of manufacturer-supplier flexibility and manufacturer agility. J. Strateg. Inf. Syst. 2020, 29, 101594. [Google Scholar] [CrossRef]
- Song, J.M.; Chen, W.; Lei, L. Supply chain flexibility and operations optimisation under demand uncertainty: A case in disaster relief. Int. J. Prod. Res. 2018, 56, 3699–3713. [Google Scholar] [CrossRef]
- Nguyen, H.; Sharkey, T.C.; Wheeler, S.; Mitchell, J.E.; Wallace, W.A. Towards the development of quantitative resilience indices for Multi-Echelon Assembly Supply Chains. Omega 2020, 89, 102199. [Google Scholar] [CrossRef]
- Polater, A. Airports’ role as logistics centers in humanitarian supply chains: A surge capacity management perspective. J. Air Transp. Manag. 2020, 83, 101765. [Google Scholar] [CrossRef]
- Leber, M.; Selinšek, A. The influence of the supplier on the successful new product development. Ann. DAAAM Proc. 2019, 30, 38–45. [Google Scholar] [CrossRef]
- Wuttke, D.A.; Donohue, K.; Siemsen, E. Initiating Supplier New Product Development Projects: A Behavioral Investigation. Prod. Oper. Manag. 2018, 27, 80–99. [Google Scholar] [CrossRef]
- Sallati, C.; Bertazzi, J.d.A.; Schützer, K. Professional skills in the Product Development Process: The contribution of learning environments to professional skills in the Industry 4.0 scenario. Proc. CIRP 2019, 84, 203–208. [Google Scholar] [CrossRef]
- Spinardi, G. Performance-based design, expertise asymmetry, and professionalism: Fire safety regulation in the neoliberal era. Regul. Gov. 2019, 13, 520–539. [Google Scholar] [CrossRef]
- Nikoofal, M.E.; Gümüş, M. Supply Diagnostic Incentives under Endogenous Information Asymmetry. Prod. Oper. Manag. 2019, 28, 588–609. [Google Scholar] [CrossRef]
- Smolnik, T.; Bergmann, T. Structuring and managing the new product development process—Review on the evolution of the Stage-Gate® process. J. Bus. Chem. 2020, 17, 41–57. [Google Scholar] [CrossRef]
- Piehler, R.; Schade, M.; Hanisch, I.; Burmann, C. Reacting to negative online customer reviews: Effects of accommodative management responses on potential customers. J. Serv. Theory Pract. 2019, 29, 401–414. [Google Scholar] [CrossRef]
- DeTienne, K.B.; Westwood, J. An Empirical Study of Service Recovery Quality and Customer Retention. J. Manag. Res. 2019, 19, 235–249. [Google Scholar] [CrossRef]
- Abunadi, I. Enterprise Architecture Best Practices in Large Corporations. Information 2019, 10, 293. [Google Scholar] [CrossRef]
- Hakim, L. An empirical investigation of how information sharing affects cash flow performance through competitive capability. Supply Chain Manag. Int. J. 2019, 24, 710–728. [Google Scholar] [CrossRef]
- Han, W.; Huang, Y.; Macbeth, D. Performance measurement of cross-culture supply chain partnership: A case study in the Chinese automotive industry. Int. J. Prod. Res. 2018, 56, 2437–2451. [Google Scholar] [CrossRef]
- Moza Tahnoon Al, N.; Amrik, S.; Yaser, H.; Brian, F. Communication, coordination, decision-making and knowledge-sharing: A case study in construction management. J. Knowl. Manag. 2019, 23, 1764–1781. [Google Scholar] [CrossRef]
- McFarland, R.G.; Dixon, A.L. An updated taxonomy of salesperson influence tactics. J. Pers. Sell. Sales Manag. 2019, 39, 238–253. [Google Scholar] [CrossRef]
- Singh, J.; Flaherty, K.; Sohi, R.S.; Deeter-Schmelz, D.; Habel, J.; Le Meunier-FitzHugh, K.; Malshe, A.; Mullins, R.; Onyemah, V. Sales profession and professionals in the age of digitization and artificial intelligence technologies: Concepts, priorities, and questions. J. Pers. Sell. Sales Manag. 2019, 39, 2–22. [Google Scholar] [CrossRef]
- Fontela, E.; Gabus, A. The DEMATEL Observer; Battelle Institute, Geneva Research Center: Geneva, Switzerland, 1976. [Google Scholar]
- Fontela, E.; Gabus, A. DEMATEL, Innovative Methods, Report No. 2 Structural Analysis of the World Problematique; Battelle Geneva Research Institute: Geneva, Switzerland, 1974. [Google Scholar]
- Li, C.-W.; Tzeng, G.-H. Identification of a threshold value for the DEMATEL method using the maximum mean de-entropy algorithm to find critical services provided by a semiconductor intellectual property mall. Expert Syst. Appl. 2009, 36, 9891–9898. [Google Scholar] [CrossRef]
- Saaty, T.L. Decision Making with Dependence and Feedback: The Analytic Network Process; RWS Publications: Pittsburgh, PA, USA, 1996; ISBN 0-9620317-9-8. [Google Scholar]
- Hu, Y.-C.; Chiu, Y.-J.; Hsu, C.-S.; Chang, Y.-Y. Identifying key factors for introducing GPS-based fleet management systems to the logistics industry. Math. Probl. Eng. 2015, 2015, 413203. [Google Scholar] [CrossRef]
- Truchon, M. Borda and the maximum likelihood approach to vote aggregation. Math. Soc. Sci. 2008, 55, 96–102. [Google Scholar] [CrossRef]
- Teng, J.Y. Multi-Criteria Decision Analysis Method and Application, 1st ed.; Din Mao Book Publishing Co., Ltd.: Taipei, Taiwan, 2012; ISBN 9789862268346. [Google Scholar]
- Saari, D.G. Mathematic structure of voting paradoxes. Econ. Theory 2000, 15, 1–53. [Google Scholar] [CrossRef]


Publisher’s Note: MDPI stays neutral with regard to jurisdictional claims in published maps and institutional affiliations. |
© 2021 by the authors. Licensee MDPI, Basel, Switzerland. This article is an open access article distributed under the terms and conditions of the Creative Commons Attribution (CC BY) license (http://creativecommons.org/licenses/by/4.0/).