Article

A Mathematical Analysis of RNA Structural Motifs in Viruses

1
Department of Software Engineering, Sami Shamoon College of Engineering, Beer-Sheva 8410501, Israel
2
Department of Bioinformatics, Wissenschaftszentrum Weihenstephan, Technische Universität München, Maximus-von-Imhof-Forum 3, D-85354 Freising, Germany
3
Department of Computer Science, Ben-Gurion University, Beer-Sheva 8410501, Israel
4
Department of Biomedical Engineering, Tel-Aviv University, Tel-Aviv 6997801, Israel
*
Authors to whom correspondence should be addressed.
Equal contribution.
Mathematics 2021, 9(6), 585; https://doi.org/10.3390/math9060585
Submission received: 26 January 2021 / Revised: 2 March 2021 / Accepted: 5 March 2021 / Published: 10 March 2021

Abstract

:
RNA stem-loop structures play an important role in almost every step of the viral replication cycle. In this contribution, a mathematical analysis is performed on a large dataset of RNA secondary structure elements in the coding regions of viruses by using topological indices that capture the Laplacian eigenvalues of the associated RNA graph representations and thereby enable structural classification, supplemented by folding energy and mutational robustness. The application of such an analysis for viral RNA structural motifs is described, being able to extract structural categories such as stem-loop structures of different sizes according to the tree-graph representation of the RNA structure, in our attempt to find novel functional motifs. While the analysis is carried on a large dataset of viral RNA structures, it can be applied more generally to other data that involve RNA secondary structures in biological agents.

1. Introduction

RNA secondary structures perform vital functions during the viral life cycle and are therefore a topic of intense interest [1,2]. Over the years specific functional RNA structure motifs have been identified in many viruses (e.g., in the hepatitis C virus (HCV) [3,4,5]) by a combination of computational and experimental approaches. More recently, the advent of high-throughput structure-probing techniques has opened up exciting possibilities in elucidating the RNA structure repertoire of viruses at large scale [6]. The majority of viral RNA motifs tend to have linear secondary structures such as the ones depicted in [7], which are often stem-loop structures that are designated by SL and their identification. Stem-loop structures can be found in the aforementioned references on HCV and also in other viruses [7,8] in both coding and non-coding regions [9].
A significant issue in modelling and analyzing RNAs is in how to represent their secondary structure in a simplified and yet useful manner. Several approaches have been formulated, among which three major pioneering ones are the full graph representation in which each nucleotide is a node [10], a coarse grain tree-graph representation in which each motif is a node [11], and a full tree forming a homomorphically irreducible tree [12]. All of these representations have been implemented in the Vienna RNA package [13]. The full graph representation in which each nucleotide is a node is equivalent to the dot-bracket representation in the Vienna RNA package [13,14,15] and the ct file in mfold/UNAFold [16,17,18].
In the context of RNA secondary structure analysis, coarse grain tree graphs have found a variety of uses [11,19,20,21,22,23]. It is also possible to generalize the coarse grain representations to abstract shapes [24]. In [11,19], a coarse grain representation of the RNA secondary structure was proposed, which was later named Shapiro’s representation in the Vienna RNA package. In [20], topological indices were first suggested to be used for analyzing coarse grain tree graphs. In [21,22], it was found that the second smallest eigenvalue of the Laplacian matrix is able to provide a similarity measure for differentiating between various RNA tree-graph topologies. The smallest eigenvalue of the Laplacian matrix is identically zero and then the second smallest eigenvalue, which is called algebraic connectivity, provides a measure of how much the tree graph is linear (a path) or compact (a star), as illustrated in Figure 2 in [21]. This concept can be applied when filtering candidates in the process of RNA deleterious mutation prediction, which was used in the relevant prediction software RNAmute and its extension [23,25,26]. On the same topic, the RDMAS webserver [27] was developed by describing some topological indices for estimating the amount of mutational deleteriousness. Subsequently, in [28], a detailed study of some topological indices was presented where the graphs from which the topological indices were extracted were so-called element-contact graphs. Reverting to [21,22], theorems by Fiedler and Merris [29,30] were shown to be applicable for the examination of how the coarse grain tree graph, showing how the secondary structure of an RNA, is shaped. However, the coarse grain tree graphs are not sufficiently informative when applied to small RNAs. For those, and also in general for RNA graphs, it was suggested by Merris in a personal communication to Barash to examine and apply the Wiener topological index [31] that considers more of the spectrum of the Laplacian matrix and not only its second smallest eigenvalue. Interestingly, Merris has shown [32,33] that the Wiener topological index can be computed by the complete spectrum of the Laplacian matrix. This idea was implemented for small RNA graphs in [34] and herein, viral RNA structures are analyzed at large scale in this manner. The Wiener number, by its seminal definition in [31], does not deal with cyclic graphs like a full RNA graph representation in which each node represents a nucleotide. Only later was it redefined for any kind of graph [35]. A topological index called the Szeged index [36], being closely related to the definition of the Wiener index in [31] and able to be applied to cyclic graphs, was proposed in [34] instead for analyzing small RNAs.
Herein, we apply the Szeged index to analyze a large dataset of conserved RNA structures in the coding regions of viruses available in the RNASIV database [37]. We calculate the Szeged number for small RNAs in our large dataset and along with the algebraic connectivity of their coarse-grain tree graph representations, we extract knowledge on the RNA structures available in the dataset. The knowledge we extract relates to the shapes of the structures and their distribution within the dataset. We also examine the mutational robustness and thermodynamic stability of these sequences/structures. We demonstrate that these sequences are mutationally robust and thermodynamically stable in comparison to their corresponding shuffled sequences and their predicted structures.

2. Materials and Methods

The mathematical analysis that is carried out on viral RNA structures relies on topological indices and additionally, on mutational robustness and thermodynamic stability. Section 2.1 presents an overview of how the Laplacian eigenvalues and in particular the second smallest eigenvalue of the Laplacian matrix which is associated with the coarse-grain tree-graph representation, the algebraic connectivity, can assist in the topological analysis of RNA secondary structures in viruses. Section 2.2 reverts to the full graph representation of RNA secondary structure and describes how the Wiener and the associated Szeged indices can contribute to the analysis of viral RNA motifs. Section 2.3 supplements the topological analysis by defining the mutational robustness and thermodynamic stability measures being used.

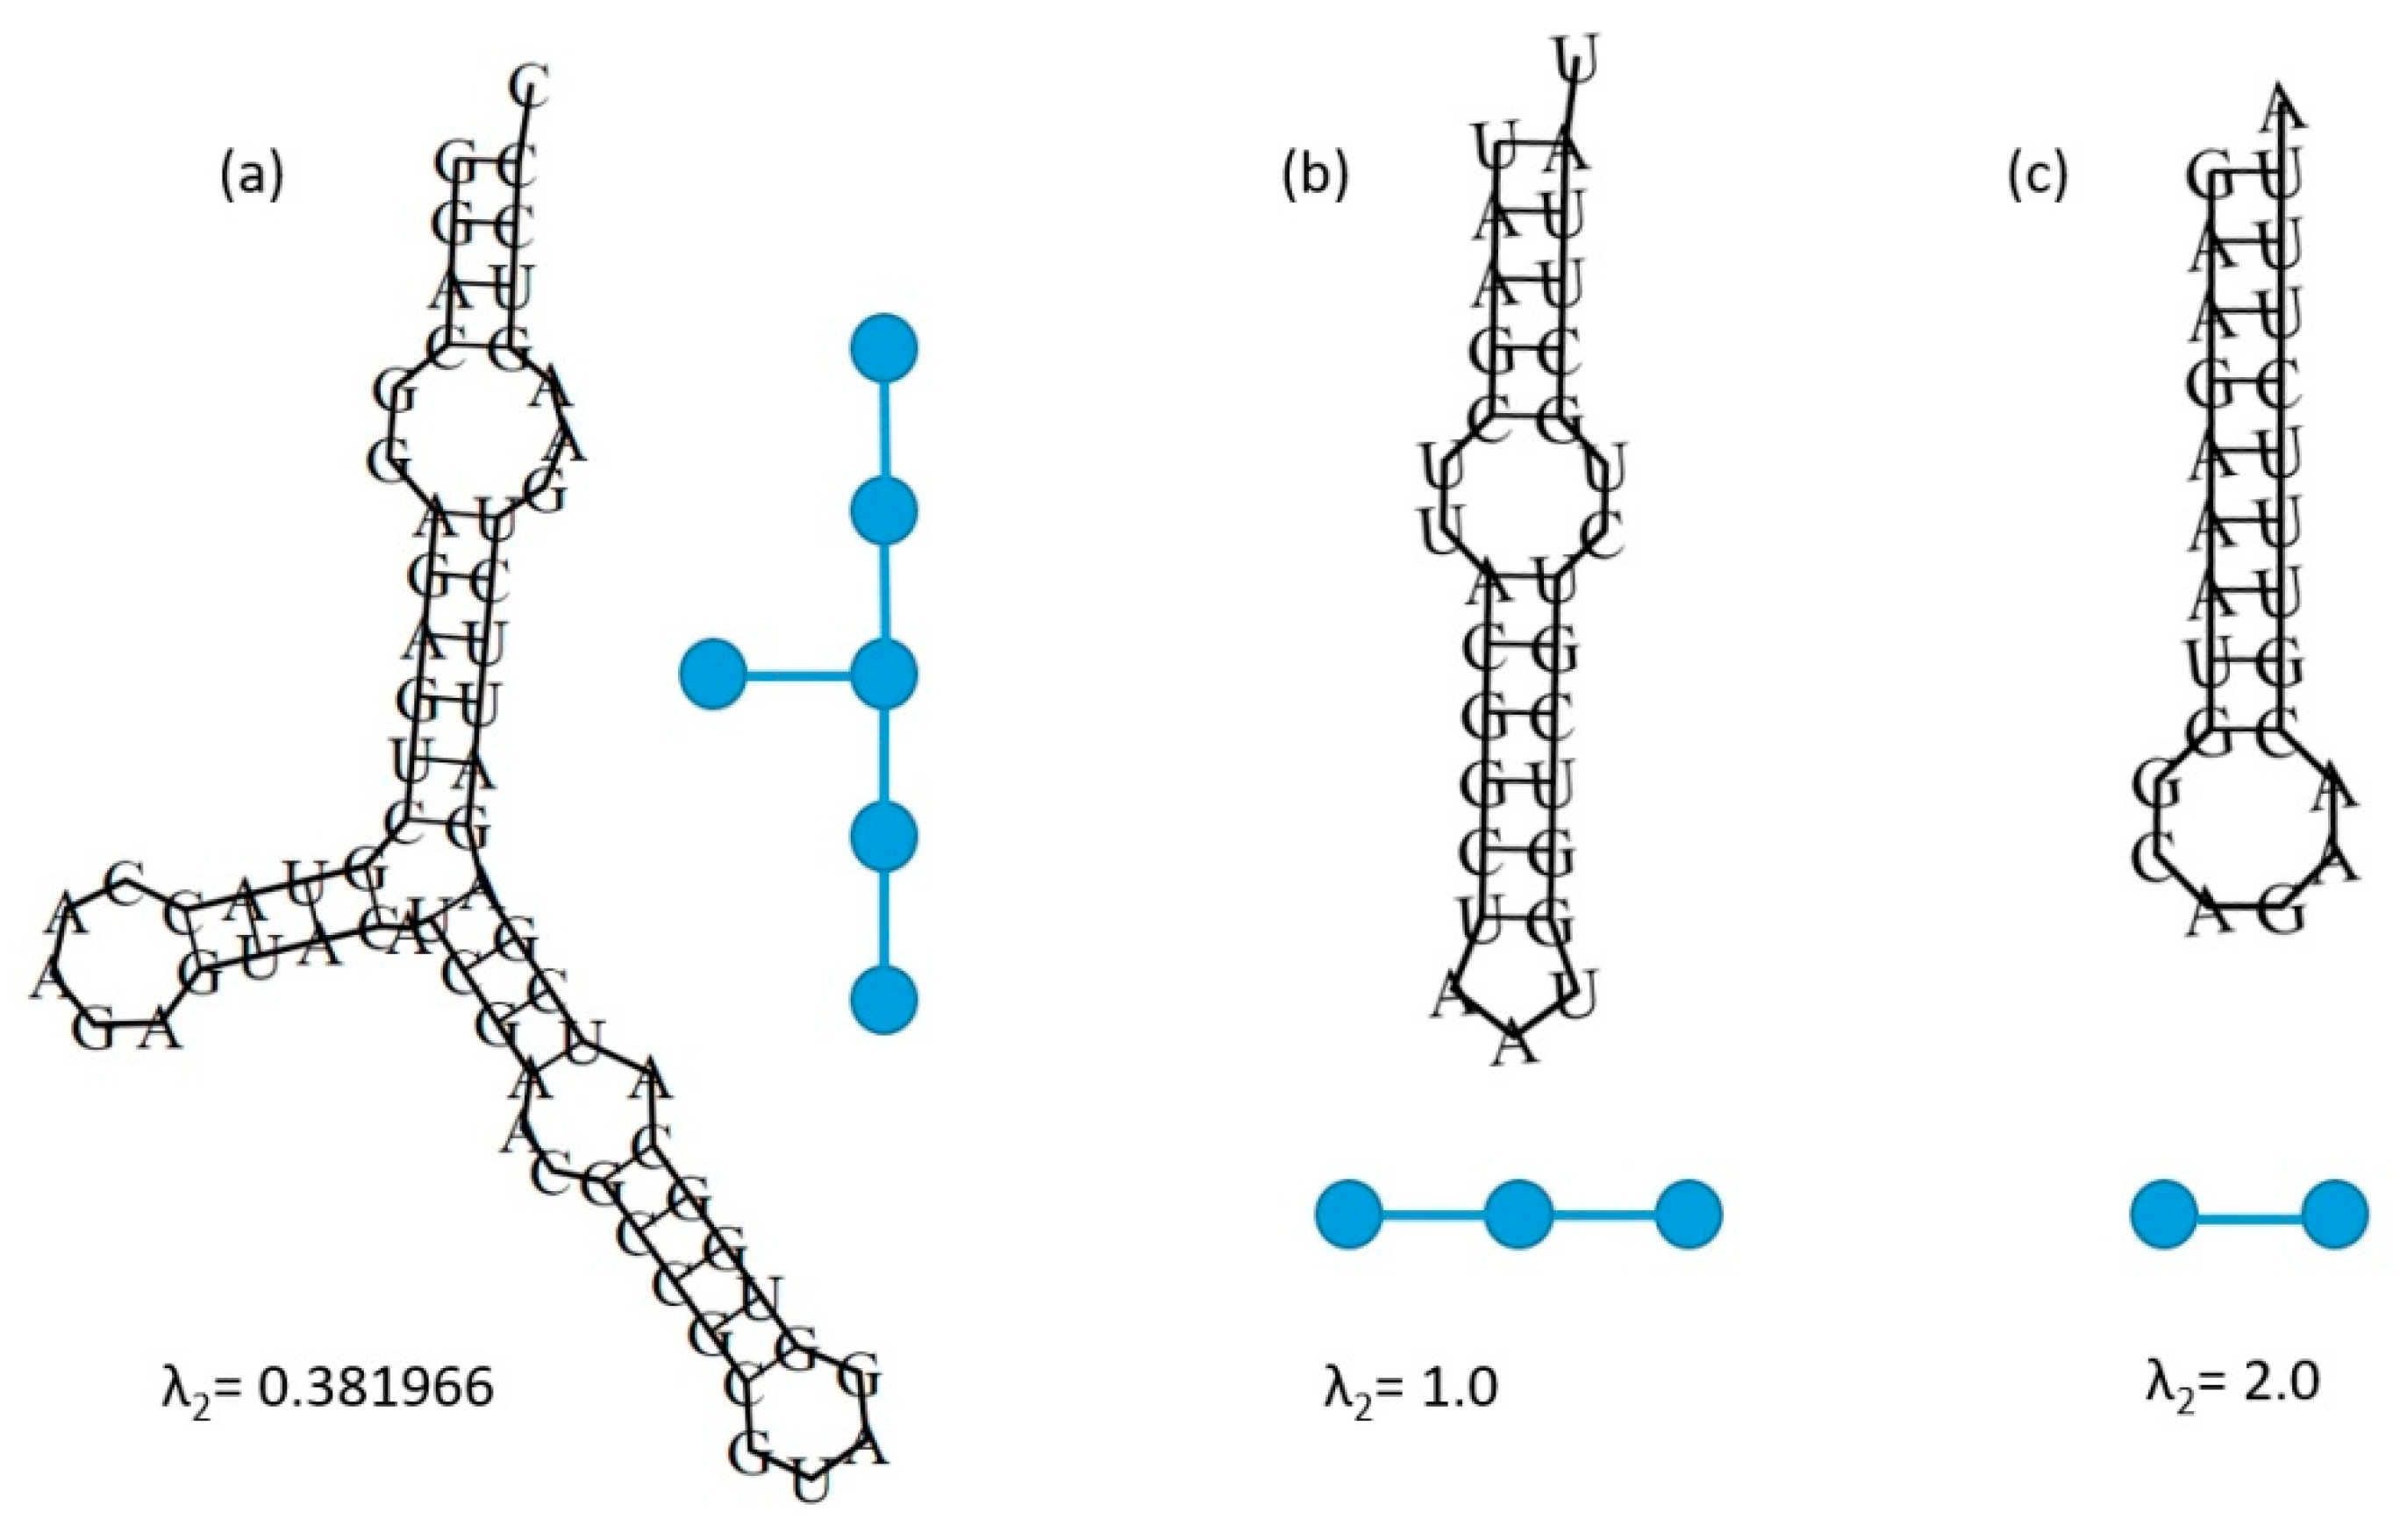
2.1. The Definitions of the Laplacian Matrix of a Tree Graph and the Algebraic Connectivity

The coarse-grain tree-graph representation of an RNA secondary structure, also known as the Shapiro representation, enables an initial analysis of the RNA structures based on their constituent motifs and their compactness. Let T = (V,E) be a tree with vertex set V = { v 1 , v 2 …, v n } and edge set E. Let us denote by d(v) the degree of v, where vV is a vertex of T. Then the Laplacian matrix of T is L(T) = ( l i j ), where
l i j = {   d ( v i ) , i f   i = j ,   1 ,    i f   v i , v j E   0 ,     o t h e r w i s e .
L(T) is a symmetric, positive semidefinite and a singular matrix. The lowest eigenvalue of L(T) is always zero, because all rows and columns sum up to zero. Let us denote by λ 1 λ 2 ≥ … ≥ λ n = 0 the eigenvalues of L(T). Then the second smallest eigenvalue of the Laplacian matrix, λ n 1 is called the algebraic connectivity [29] of T and labeled as a(T). Some of the properties of a(T) that concern the application presented here are mentioned in Appendix A, in addition to the illustrative calculation of a(T) for the RNA secondary structure example shown in Figure 1.

2.2. An Illustrative Example for the Algebraic Connectivity of an RNA Structure Coarse Grain Tree Graph Represented by a Laplacian Matrix

The eigenvalues of the Laplacian are independent of the choice of labeling for the nodes in the tree graph T, which only amounts to interchanges of the rows and columns. For the orderly labeling of the linear tree graph example illustrated in Figure 1 and containing three nodes as explained in the continuation, the Laplacian matrix L(T) becomes:
L = ( 1 1 0 1 2 1 0 1 1 )
which is analogous, by the above definition of the matrix elements l i j , to the Laplacian operator. Let us examine its eigenvalues λ and corresponding eigenvectors ũ:
L ũ = λ ũ
Recalling that the small eigenvalue λ n is zero, the second smallest eigenvalue of the Laplacian matrix in (2), λ n 1 = a(T) = 1.0, is the algebraic connectivity that corresponds to the tree T of the wild-type structure as illustrated in Figure 1. It is the lower bound (neglecting zero) for the case of three vertices since the tree is linear, hence it can also be calculated by:
a ( T )   =   2 ( 1 cos ( π / n ) )
where n = 3 is the number of vertices, as outlined in Appendix A for a path on n vertices.
Note that by convention of the choice of tree-graph representation, those loops with single isolated nucleotides are not accounted for as nodes, but the 5′–3′ ends are counted as a node. In the case of a star of four vertices, for example, a(T) = 1.0, which is the upper bound for the algebraic connectivity. A star applies for a tree graph possessing three vertices or more (n ≥ 3) and the algebraic connectivity of a star is always unity [30]. The algebraic connectivity a(T) is characterized by some special properties described in Appendix A that are advantageous for the RNA secondary structure application that is presented here.

2.3. The Definitions of the Wiener and Szeged Topological Indices

In molecular graph theory, the Wiener index [31] is a structural descriptor that has been thoroughly studied. By its introductory definition, it is equal to the summing the distances between all pairs of vertices of the corresponding molecular graph. Let T = (V,E) be a tree on n vertices with vertex set V = { v 1 , v 2 , , v n }   and   edge   set   E = { e 1 , e 2 , , e m } .   Then   the   Wiener   index   of   T   is :
W ( T ) = i = 1 n 1 j = i + 1 n d ( v i , v j )
where d ( v i , v j ) is a count of all the edges in the unique path from vertex v i   to   v j . There are various ways to express the Wiener index, one of which is as explained in [32]:
W ( T ) = e ϵ E w ( e )
where w(e) is the product of the numbers of all vertices in the components of a forest F e , where upon choosing e ϵ E the edge subgraph F e = ( V , E \ e )   is   a   forest   with   two   components . In the summation of Equation (6) above, a particular edge e is counted just once for each pair of the vertices that can be chosen from “opposite sides” of e (from different components of the Forest F e with two components) and therefore edge e is counted exactly w(e) times. This leads to the interesting finding [32,33] that the Wiener index of a tree T with n vertices can also be expressed by the means of the sum of reciprocals of the Laplacian graph eigenvalues λ 1 λ 2 λ n 1 > 0 = λ n :
W ( T ) = i = 1 n 1 n λ i
where in [33] a generalization of this concept for a general graph was also examined. Thus, the Wiener index can capture the complete spectrum of the Laplacian matrix that corresponds to the molecular graph. For acyclic molecular graphs (trees), Wiener outlined a simple method for calculating W [31]. Let e be an edge of the acyclic molecular graph G. Let n 1 ( e | G ) and n 2 ( e | G ) be the numbers of vertices of G lying on two sides of edge e. Then,
W ( G ) = e E ( G ) n 1 ( e | G ) n 2 ( e | G )   ( for   an   acyclic   molecular   graph   G )
where E(G) denotes the set of edges of graph G. In [36], this way of calculating W has been extended to encompass cyclic graphs by generalizing the interpretation of n 1 ( e | G ) and n 2 ( e | G ) , introducing a new structural descriptor related to the Wiener index called Szeged (Sz):
S z ( G ) = e E ( G ) n 1 ( e | G ) n 2 ( e | G )   ( for   a   cyclic   molecular   graph   G )
Since then, in various studies it was shown how to calculate this index for a variety of chemical systems. For example, for benzenoid systems, a method of calculating the Szeged index has been developed in [38]:
S z ( B ) = C r ( C ) n ( B ( C ) ) n ( B ( C ) )   ( for   a   benzenoid   molecular   graph   B )
where C is an elementary cut, which divides a benzenoid system B into two subgraph components B′(C) and B″(C), and C intersects r(C) distinct edges of B. The summation in equation (11) goes over the complete set of elementary cuts. The integers n(B′) and n(B″) are the number of vertices of fragments B′ and B″, respectively, where n(B′) + n(B″) = n(B). If e is an edge intersected by C, a lemma outlined in [38] stating that n 1 ( e | B ) = n ( B ) and n 2 ( e | B ) = n ( B ) was developed, showing that the above formula provides a straightforward way for calculating the Szeged index of benzenoid systems. Recently, a new topological index intended for benzenoids called convexity deficit was put forth in [39].

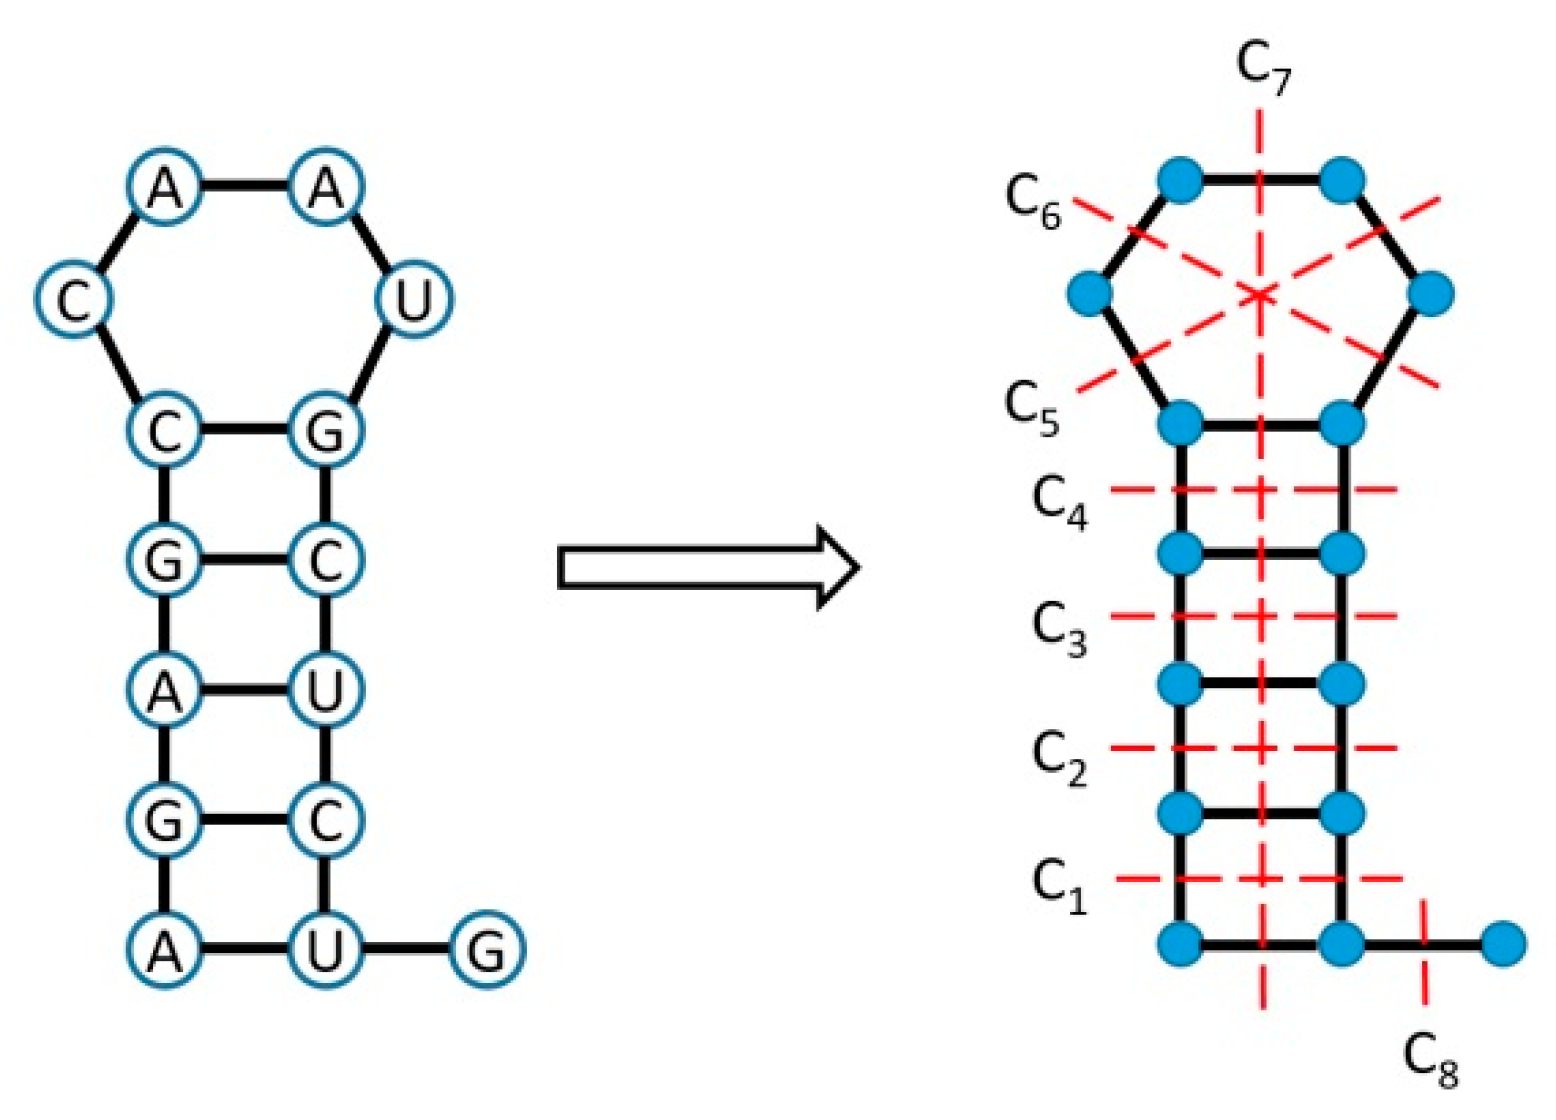
2.4. Calculation of the Szeged Index of RNA Secondary Structure Graphs from Elementary Cuts

By using the analogy of benzenoid molecular graphs, one can now describe a simple method to calculate this index for small RNA full graphs that comprise most of the large-scale dataset we will analyze. The method relies on laying out an RNA in a secondary structure drawing in which each node in the graph represents a nucleotide. The edges represent backbone connectivity and base pair interactions [10]. Because there are many possible ways to draw an RNA secondary structure, we choose a particular way for simplicity that adheres to symmetry in the drawing. Our way consists of single- and double-stranded RNA elements with the following features: single-stranded ends (the 5′ and 3′ ends) appear as horizontal and linear RNA tails; double-stranded areas of the RNA molecule appear as vertical helices, starting from the bottom and at the level of the horizontal linear RNA tails as mentioned above; single-stranded areas not at the 5′ or 3′ ends, which are bulges and loops, appear as equiangular shapes.
A simple RNA secondary structure drawn as described above and its graph representation are shown in Figure 2. An elementary cut, similar to its introduction for benzenoid hydrocarbons, is defined as follows. Select an edge e of the RNA graph representation, drawing a straight line through the center of e and orthogonal on e. The line will intersect the perimeter in two points P 1 and P 2 . The straight-line segment C whose end points are P 1 and P 2 is the elementary cut, intersecting the edge e. This line C intersects all edges that lie between P 1 and P 2 , including the two edges on the perimeter to which P 1 and P 2 belong. Elementary cuts for an RNA graph are depicted in Figure 2. The interested reader is referred to [34] for additional information.
The algorithm for calculating the Szeged index of an RNA secondary structure graph can now be formulated in the following way:
S z ( R ) = C r ( C ) n ( R ( C ) ) n ( R ( C ) )   ( for   an   RNA   molecular   graph   R )
where C is an elementary cut, dividing the RNA graph into two components R′(C) and R″(C). C intersects r(C), the distinct edges of R, and summation goes over the complete set of elementary cuts.
As an illustration, Sz(R) is calculated in Section 3 for a simple RNA structure. We can then carry out the procedure for small RNA graphs that contain stem-loops and bulges, discarding more complicated secondary structure motifs like multi-branch loops that rarely appear when analyzing a dataset containing small RNAs, such as the one we will use. For larger RNAs and multi-branch loops, one is advised to work with coarse-grain tree graphs as noted in Section 2.2. In the case where a loop has an odd number of nucleotides, a straight line orthogonal to an edge constituting an elementary cut only corresponds to that edge. It is counted only once for its edge, regardless of whether this line intersects a vertex in the furtherance or is continued outside the loop.

2.5. Mutational Robustness and Thermodynamic Stability

For a quantitative measure of mutational robustness, neutrality η is calculated. For an RNA sequence of length N, the neutrality is defined as:
η = (N-d)/N
where d is the base-pair distance between the secondary structure of the original sequence and secondary structure of the mutant, averaged over all 3N one-mutant neighbors. The base-pair distance available in the Vienna RNA package is used to calculate the distance between two RNA secondary structures. The RNA secondary structures in this study were predicted by the energy minimization approach [13,16] using RNAfold available in the Vienna RNA package [13,14,15], noting that similar predictions can be done with mfold/UNAFold [16,17,18].

3. Results

3.1. Eigenvalue Statistics: Algebraic Connectivity Distribution

As a testbed to our proposed methodology, we used a large dataset of RNA secondary structures in viruses that is available in [37]. We start from the Laplacian second smallest eigenvalue distribution, where the Laplacian matrix corresponds to the coarse grain tree-graph representation of the RNA secondary structures [22]. For illustration, Figure 1 depicts three possibilities for tree-graph topologies and their second smallest eigenvalue. According to Appendix A, this is for the special case of n = 3, a( T l i n e a r ) = 1, as in Figure 1b, and for the special case of n = 2, a( T l i n e a r ) = 2, as in Figure 1c.
The whole dataset that amounts to 677,501 RNA structures can be divided into two categories: one-hairpin structures (designated 1H) and two-hairpin structures (designated 2H). In Table 1, each of these two categories is divided into three topologies: Eig = 2.0 corresponds to topologies depicted in Figure 1c, Eig = 1.0 corresponds to topologies depicted in Figure 1b, Eig < 1.0 corresponds to topologies as illustrated in Figure 1a. One can notice that the majority of the structures possess Eig = 2.0, which are structures with only the 5′-3′ end and one hairpin. Next appear structures with Eig = 1.0, which are either the 5′-3′ end and an internal loop (optionally a bulge) and one hairpin for the 1H category, or the 5′-3′ end and two hairpins for the 2H category. The rest are Eig < 1.0, but they only comprise a small amount of the dataset.
It is also worthwhile examining the largest of the two categories, that of 1H structures, separately and by specifying all Eig < 1.0 in it. We obtain Table 2:
This will further be analyzed in Section 4 with respect to the formula a(T) = 2 ( 1 cos ( π / n ) ) in Equation (4) for a linear tree-graph representation of the RNA secondary structure to show the tendency of viruses to possess stem-loop structures represented by a path on n vertices.

3.2. Wiener/Szeged Topological Index Distribtuion

Having observed that our dataset contains mostly small RNAs (Eig = 2.0 and Eig = 1.0), at a finer resolution one can use the Szeged topological index (which is intimately related to the Wiener index as observed in Equations (8) and (9)) to further analyze topologies, as was outlined in [34]. For illustration, the way to calculate the Szeged index for one of the structures in the dataset is depicted in Figure 2 and Table 3.
Table 3 lists the elementary cuts and their corresponding terms in the righthand side of Equation (11). In summing for all elementary cuts, Sz(R) = 72 + 100 + 112 + 108 + 72 + 72 + 336 + 14 = 886 is obtained. Notice that the largest contribution, 336, appears for the elementary cut C7 that traverses six edges.
The distribution of the Szeged numbers in our dataset is presented in Figure 3 and Figure 4, where for each native sequence a shuffled sequence is generated, and for both the Szeged index is calculated without considering multi-branch loops (multi-branch loops are discarded, as noted in [34], because such RNA structural motifs are too complicated to be analyzed by their Szeged index and it is sufficient to analyze them by their algebraic connectivity to examine their topology). The comparison between native and shuffled sequences will be discussed in Section 4. Shuffling is simply done without additional constraints such as maintaining dinucleotides or codons. The separation into the first 50 bins corresponding to the lowest Szeged numbers (Figure 3) and the last 50 bins corresponding to the highest Szeged numbers (Figure 4) is purposely done for convenience in the examination of the distribution that is obtained. The reported p-values in the captions were calculated from a T-test to check that the average Szeged values of the structures of native sequences were significantly larger than the Szeged values of the structures of shuffled sequences.

3.3. Mutational Robustness and Thermodynamic Stability

Finally, to conclude the analysis, it is worthwhile verifying that the native sequences are more mutationally robust and more thermodynamically stable than their corresponding shuffled sequences, as expected given that our dataset contains natural RNAs. Equation (12) is used to calculate the neutrality and in all of the calculations, RNAfold of the ViennaRNA Package 2.0 [15] is used for RNA structure prediction by energy minimization. Figure 5 depicts the neutrality distribution of native and shuffled sequences for all structures in the dataset, having used Python’s multiprocessing module (“process” class) to speed up the calculation. Figure 6 and Figure 7 depict the mean free energy (MFE) distribution for all one-hairpin (1H) structures and for all two-hairpin (2H) structures, respectively, covering the entire dataset. The reported p-values in the captions were calculated from a T-test to check that the average neutrality values of the structures of native sequences were significantly larger than the average neutrality values of the structures of shuffled sequences and the average MFE values of the structures of native sequences were significantly smaller than the average MFE values of the structures of shuffled sequences, respectively.

4. Discussion and Conclusions

We will now analyze the results of our proposed methodology, which were obtained on a large-scale dataset of viral RNA structures, and discuss our analysis. Starting from the eigenvalue analysis performed at the beginning of Section 3, we will first examine the tables obtained from analyzing the second smallest eigenvalue of the Laplacian matrix corresponding to the coarse grain tree-graph representation of the RNA secondary structure. We will then examine the Szeged index result that is related to all Laplacian eigenvalues extracted from the full-graph representation of the RNA secondary structure. Subsequently, we will analyze the mutational robustness and thermodynamic stability results and draw conclusions.
Visualization of the tree graphs (Figure 1) in the whole dataset can be most elegantly done with a single number by examining their Laplacian second smallest eigenvalue. The eigenvalue statistics shown in Table 1 reveal that most of the RNA structures in our dataset, comprised of either one-hairpin (1H) structures or two-hairpin (2H) structures, are small 2-node structures that are represented in Figure 1c. Next come three nodes structures that are illustrated in Figure 1b, and then only a smaller portion of structures with more than three nodes. Because the category of one-hairpin (1H) structures constitute the majority of our dataset, we further analyze this category in Table 2 by specifying all second smallest Laplacian eigenvalues. Notably, all of the eigenvalues abide by the formula a(T) = 2 ( 1 cos ( π / n ) ) in Equation (4) where n is the number of nodes, which can also be derived by analogy to the eigenvalue formula of a tridiagonal Toeplitz matrix [40]. The first row corresponds to n = 2, the second row corresponds to n = 3, and each one of the rows therein corresponds to a consecutive n, respectively, until the final (seventh) row corresponds to n = 8 and reports on just one occurrence of a linear structure with a high number of eight nodes (corresponding to the linear tree graph that was drawn in Figure 2 in [21] for illustration). These are all stem-loop structures, restricted by the constraint of one-hairpin (1H) that is imposed on the category examined in Table 2; as expected from a large-scale dataset of RNA secondary structures in viruses, the stem-loop structures are highly abundant even though there are two-hairpin (2H) structures in the dataset as well. The peculiar stem-loops at the bottom of the table with high number of nodes can now be examined in detail to check their candidacies for possessing a functional role because of their similarity in concept to Figure 1 in [7], for example. Reverting back to Table 1, the vast majority of structures in the dataset (1H and 2H combined) are small RNA structures.
Having noticed that small RNA structures in the dataset are dominant, we performed a further analysis using the Wiener/Szeged topological index, and the distributions of the Szeged numbers over the complete dataset when comparing between native and shuffled sequences are available in Figure 3 and Figure 4. Shuffled sequences contain randomness, but they preserve the GC content of the native sequences and are therefore preferable for our comparison over fully random sequences. For convenience in inspection, Figure 3 displays the lowest Szeged numbers while Figure 4 reports the highest ones. It can be noticed that the Szeged numbers of native sequences are spread more evenly from low to high values when compared to shuffled sequences, which was also seen in Figure 4 of [30] for a collection of microRNAs. It is even more pronounced in viral structures as compared to microRNA structures. We speculate that billions of years of evolution produced viral mutations that enabled native structures to assume a variety of structures rather than being confined to a more limited set of structures as in the shuffled sequences. The ability of native sequences to occupy high Szeged numbers with respect to the shuffled sequences, as shown in Figure 4, is therefore likely a manifestation that our dataset contains natural RNAs with a biological content.
For completion of the comparison between native and shuffled sequences in our dataset, it was found in Figure 5 that native sequences are more mutationally robust than shuffled sequences. Figure 6 and Figure 7 show that native sequences are more thermodynamically stable than shuffled sequences. This is a further verification that indeed the RNA structures in our dataset have characteristics of natural RNAs. Furthermore, once a new version of the dataset [37] is available, we could check if the consensus structures have improved by the following procedure related to mutational robustness. We could evaluate neutrality with both the consensus structures and biological structures in the dataset and compare their difference for both the current and new versions of the dataset. If the difference becomes smaller, it signals that consensus structures have improved in the new version.
To summarize, the search for functional RNA structures in viruses is gradually advancing using both computational and experimental approaches, as can be viewed in [1,2,3,4,5,6,7,8,9]. The methodology presented here for the analysis of RNA structures is useful for finding categories in the dataset, such as stem-loop structures of different sizes, that could turn out to be functionally important. It can be used to study properties of the dataset based on topological indices that utilize Laplacian eigenvalues, supplemented by histograms of mutational robustness and thermodynamic stability. Furthermore, a similar analysis can be applied more generally to other data that involve RNA secondary structures, although the structural properties of viral RNA motifs that tend to be linear, i.e., closer in their coarse grain tree-graph representation to a path on n vertices, make them especially amenable to an eigenvalue analysis that extracts the algebraic connectivity according to Equation (4) specifically for a path on n vertices.

Author Contributions

Conceptualization, D.B.; methodology, A.C., F.T., R.Z., M.P., T.T., D.F., D.B.; software, A.C., F.T., R.Z.; investigation, A.C., F.T., R.Z., M.P., T.T., D.F., D.B.; data curation, F.T.; writing—original draft preparation, A.C., F.T., M.P., T.T., D.F., D.B.; writing—review and editing, A.C., F.T., R.Z., M.P., T.T., D.F., D.B.; supervision, D.F., D.B.; funding acquisition, T.T., D.F., D.B. All authors have read and agreed to the published version of the manuscript.

Funding

This research was funded by the DFG, grant FR 1411/17-1.

Acknowledgments

We acknowledge the help of Michael Kiening in the early stages of this work.

Conflicts of Interest

The authors declare no conflict of interest. The funders had no role in the design of the study; in the collection, analyses, or interpretation of data; in the writing of the manuscript, or in the decision to publish the results.

Appendix A. Details of the Algebraic Connectivity

A list of properties and two relevant examples are provided to clarify the geometrical meaning behind the algebraic connectivity.
Properties (algebraic connectivity): Let T = (V,E) be a tree on n vertices with the algebraic connectivity denoted by a(T). Then:
(A).
0 ≤ a(T) ≤ 1 [30].
(B).
a(T) = 0 iff T is not connected [30].
(C).
a(T) = 2 ( 1 cos ( π / n ) ) iff T = P n is a path on n vertices [29].
(D).
a(T) = 1 iff T = K 1 , n 1 is a star on n vertices [29,30].
Example 1: Because a tree T is a special case of graph G, it follows that a(T) is positive if T is connected [30]. Thus, in all RNA secondary structure test cases reported herein for each tree configuration that represents the secondary structure, a(T) is positive because loops, bulges and hairpins are connected through RNA stems.
Example 2: Let T = K 1 , n 1 be a star on n vertices, which implies that tree T has n vertices: one vertex of degree n − 1 along with n − 1 pendant (of degree 1) vertices. Then the characteristic polynomial p(x) of T becomes: p(x) = x(xn)(x − 1)n−2. This can be verified [30] by observing that (1, 1, …, 1) is an eigenvector of L(T) corresponding to the eigenvalue 0; (n − 1, −1, …, −1) is an eigenvector that corresponds to the eigenvalue n and {(0, 1, −1, 0, …, 0), (0, 0, 1, −1, 0, …, 0) …, (0, 0, …, 0, 1, −1)} is a set of n − 2 linearly independent eigenvectors that correspond to the eigenvalue 1. An RNA secondary structure classical example for the case of n = 5 when exhibiting a star shape is in the yeast phenylalanine tRNA. In this example, for n = 5 the spectrum of L is {0, 1, 1, 1, 5}, resulting from the characteristic polynomial above. Thus, the second smallest eigenvalue of L(T) is smallest but positive when the RNA secondary structure has a linear shape, and it becomes identical to 1.0 when the RNA secondary structure has a star shape.
Example 3: Let T l i n e a r be a linear tree on n vertices, n > 2, and T l i n e a r be a linear tree on n − 1 vertices. Then a( T l i n e a r ) > a( T l i n e a r ), since a linear tree that is shortened becomes more compact. Thus, the range of possible algebraic connectivity values for a tree T on n − 1 vertices, between the lowest value a( T l i n e a r ) and the highest value of one, is smaller than the range of algebraic connectivity values for a tree T on n vertices, with the lowest value a( T l i n e a r ) and the same highest value of the upper bound one. Various virusoid sequences that are linear in their secondary structure, as in Figure 3 of [22], illustrate this point because their tree graph is linear but associated with a different number of vertices. Their algebraic connectivity can be calculated using the formula a(T) = 2 ( 1 cos ( π / n ) ) , mentioned in property (C) above. It is worthwhile noting that for the special case of n = 3, a( T l i n e a r ) = 1 because the tree can only assume a single shape that is a star, and a( T l i n e a r ) = 2 corresponds to two vertices because of the properties of the Laplacian operator when the grid is reduced to only two points. In addition, there is a noticeable similarity between property (C) and the eigenvalues of a tridiagonal Toeplitz matrix (40) because the Laplacian of an open path is tridiagonal Toeplitz except the first and last row, corresponding to the start and end vertices.

References

  1. Hofacker, I.L.; Stadler, P.F.; Stocsits, R.R. Conserved RNA secondary structure in viral genomes: A survey. Bioinformatics 2004, 20, 1495–1499. [Google Scholar] [CrossRef] [PubMed] [Green Version]
  2. Marz, M.; Beerenwinkel, N.; Droste, C.; Fricke, M.; Frishman, D.; Hofacker, I.L.; Hoffmann, D.; Middendorf, M.; Rattei, T.; Stadler, P.F.; et al. Challenges in RNA virus bioinformatics. Bioinformatics 2014, 30, 1793–1799. [Google Scholar] [CrossRef] [Green Version]
  3. You, S.; Stump, D.D.; Branch, A.D.; Rice, C.M. A cis-acting replication element in the sequence encoding the NS5B RNA-dependent polymerase is required for hepatitis C virus RNA replication. J. Virol. 2004, 78, 1352–1356. [Google Scholar] [CrossRef] [Green Version]
  4. Tuplin, A.; Evans, D.J.; Simmonds, P. Detailed mapping of RNA secondary structures in core and NS5B-encoding region sequences of hepatitis C virus by RNase cleavage and novel bioinformatic prediction methods. J. Gen. Virol. 2004, 85, 3037–3047. [Google Scholar] [CrossRef]
  5. Vassilaki, N.; Friebe, P.; Meuleman, P.; Kallis, S.; Kaul, A.; Paranhos-Baccalà, G.; Leroux-Roels, G.; Mavromara, P.; Bartenschlager, R. Role of the hepatitis C virus core +1 open reading frame and core cis-acting RNA elements in viral RNA translation and replication. J. Virol. 2008, 82, 11503–11515. [Google Scholar] [CrossRef] [PubMed] [Green Version]
  6. Bevilacqua, P.C.; Ritchey, L.E.; Su, Z.; Assmann, S.M. Genome-wide analysis of RNA secondary structures. Annu. Rev. Genet. 2016, 50, 235–266. [Google Scholar] [CrossRef] [PubMed] [Green Version]
  7. Lakshman, D.K.; Tavantzis, S.M. Primary and secondary structure of a 360-nucleotide isolate of potato spindle tuber viroid. Arch. Virol. 1993, 128, 319–331. [Google Scholar] [CrossRef]
  8. Ochsenreiter, R.; Hofacker, I.L.; Wolfinger, M.T. Functional RNA structures in the 3′UTR of tick-borne, insect-specific and no-known-vector Flaviviruses. Viruses 2019, 11, 298. [Google Scholar] [CrossRef] [Green Version]
  9. Cuceanu, N.M.; Tuplin, A.; Simmonds, P. Evolutionary conserved RNA secondary structures in coding and non-coding sequences at the 3’ end of the hepatitis G virus/GB-virus C genome. J. Gen. Virol. 2001, 82, 713–722. [Google Scholar] [CrossRef] [Green Version]
  10. Waterman, M.S. Secondary structure of single stranded nucleic acids. Adv. Math. Suppl. Stud. 1978, 1, 167–212. [Google Scholar]
  11. Shapiro, B.A. An algorithm for comparing multiple RNA secondary structures. Comput. Appl. Biosci. 1988, 4, 387–393. [Google Scholar] [CrossRef]
  12. Fontana, W.; Konings, D.A.M.; Stadler, P.F.; Schuster, P. Statistics of RNA secondary structures. Biopolymers 1993, 33, 1389–1404. [Google Scholar] [CrossRef]
  13. Hofacker, I.L.; Fontana, W.; Stadler, P.F.; Bonhoeffer, S.; Tacker, M.; Schuster, P. Fast folding and comparison of RNA secondary structures. Mon. Chem. Chem. Mon. 1994, 124, 167–188. [Google Scholar] [CrossRef]
  14. Hofacker, I.L. Vienna RNA secondary structure server. Nucleic Acids Res. 2003, 31, 3429–3431. [Google Scholar] [CrossRef] [PubMed] [Green Version]
  15. Lorenz, R.; Bernhart, S.H.F.; Zu Siederdissen, C.H.; Tafer, H.; Flamm, C.; Stadler, P.F.; Hofacker, I.L. ViennaRNA Package 2.0. Algorithms Mol. Biol. 2011, 6, 26. [Google Scholar] [CrossRef] [PubMed]
  16. Zuker, M. Computer prediction of RNA secondary structure. Methods Enzymol. 1989, 180, 262–288. [Google Scholar]
  17. Zuker, M. Mfold webserver for nucleic acid folding and hybridization prediction. Nucleic Acids Res. 2003, 31, 3406–3415. [Google Scholar] [CrossRef]
  18. Markham, N.R.; Zuker, M. UNAFold: Software for nucleic acid folding and hybridization. Methods Mol. Biol. 2008, 453, 3–31. [Google Scholar]
  19. Le, S.Y.; Nussinov, R.; Maizel, J.V. Tree graphs of RNA secondary structures and their comparison. Comput. Appl. Biosci. 1989, 22, 461–473. [Google Scholar] [CrossRef]
  20. Benedetti, G.; Morosetti, S. A graph-topological approach to recognition of pattern and similarity in RNA secondary structures. Biophys. Chem. 1996, 59, 179–184. [Google Scholar] [CrossRef]
  21. Barash, D. Deleterious mutation prediction in the secondary structure of RNAs. Nucleic Acids Res. 2003, 31, 6578–6584. [Google Scholar] [CrossRef] [Green Version]
  22. Barash, D. Second eigenvalue of the Laplacian matrix for predicting RNA conformational switch by mutation. Bioinformatics 2004, 20, 1861–1869. [Google Scholar] [CrossRef]
  23. Churkin, A.; Barash, D. RNAmute: RNA secondary structure mutation analysis tool. BMC Bioinform. 2006, 7, 221. [Google Scholar] [CrossRef] [Green Version]
  24. Giegerich, R.; Voss, B.; Rehmsmeier, M. Abstract shapes of RNA. Nucleic Acids Res. 2004, 32, 4843–4851. [Google Scholar] [CrossRef]
  25. Churkin, A.; Barash, D. An efficient method for the prediction of deleterious multiple-point mutations in the secondary structure of RNAs using suboptimal folding solutions. BMC Bioinform. 2008, 9, 222. [Google Scholar] [CrossRef] [PubMed] [Green Version]
  26. Barash, D.; Churkin, A. Mutational analysis in RNAs: Comparing programs for RNA deleterious mutation prediction. Brief. Bioinform. 2011, 12, 104–114. [Google Scholar] [CrossRef] [Green Version]
  27. Shu, W.; Bo, X.; Liu, R.; Zhao, D.; Zheng, Z.; Wang, S. RDMAS: A webserver for RNA deleterious mutation analysis. BMC Bioinform. 2006, 7, 404. [Google Scholar] [CrossRef] [PubMed] [Green Version]
  28. Shu, W.; Bo, X.; Zheng, Z.; Wang, S. A novel representation of RNA secondary structure based on element-contact graphs. BMC Bioinform. 2008, 8, 188. [Google Scholar] [CrossRef] [Green Version]
  29. Fiedler, M. Algebraic connectivity of graphs. Czechoslov. Math. J. 1973, 23, 298–305. [Google Scholar] [CrossRef]
  30. Merris, R. Characteristic vertices of trees. Linear Multilinear Algebra 1987, 22, 115–131. [Google Scholar] [CrossRef]
  31. Wiener, H. Structural determination of paraffin boiling points. J. Am. Chem. Soc. 1947, 69, 17–20. [Google Scholar] [CrossRef]
  32. Merris, R. An edge-version of the matrix-tree theorem and the Wiener index. Linear Multilinear Algebra 1989, 25, 291–296. [Google Scholar] [CrossRef]
  33. Merris, R. Laplacian matrices of graphs: A survey. Linear Algebra Appl. 1994, 197, 143–176. [Google Scholar] [CrossRef] [Green Version]
  34. Churkin, A.; Gabdank, I.; Barash, D. On topological indices for small RNA graphs. Comput. Biol. Chem. 2012, 41, 35–40. [Google Scholar] [CrossRef]
  35. Hosoya, H. Topological index. A newly proposed quantity characterizing the topological nature of structural isomers of saturated hydrocarbons. Bull. Chem. Soc. Jpn. 1971, 44, 2332–2339. [Google Scholar] [CrossRef] [Green Version]
  36. Gutman, I. A formula for the Wiener number of trees and its extension to graphs containing cycles. Graph Theory Notes N. Y. 1994, 27, 9–15. [Google Scholar]
  37. Kiening, M.; Ochsenreiter, R.; Hellinger, H.J.; Rattei, T.; Hofacker, I.L.; Frishman, D. Conserved secondary structures in viral mRNAs. Viruses 2019, 11, 401. [Google Scholar] [CrossRef] [Green Version]
  38. Gutman, I.; Klavžar, S. An algorithm for the calculation of the Szeged index of benzenoid hydrocarbons. J. Chem. Inf. Comput. Sci. 1995, 35, 1011–1114. [Google Scholar] [CrossRef]
  39. Bašić, N.; Berkemer, S.J.; Fallmann, J.; Fowler, P.W.; Gatter, T.; Pisanski, T.; Retzlaff, N.; Stadler, P.F.; Zemljič, S.S. Convexity deficit of benzenoids. Croat. Chem. Acta 2020, 92, 457–466. [Google Scholar] [CrossRef]
  40. Strang, G.; Macnamara, S. Functions of difference matrices are Toeplitz plus Hankel. SIAM Rev. 2014, 56, 525–546. [Google Scholar] [CrossRef] [Green Version]
Figure 1. Three possible tree-graph topologies and their Laplacian second smallest eigenvalue (algebraic connectivity). (a) A case of six nodes with an algebraic connectivity of 0.381966. (b) A case of three nodes with an algebraic connectivity of 1.0. (c) A case of two nodes with an algebraic connectivity of 2.0.
Mathematics 09 00585 g001
Figure 2. RNA secondary structure of a bacteriophage (Virus Orthologuous Group VOG03380, subVOG 8) and its full graph representation. The elementary cuts that are used in Table 3 for calculating the Szeged index are drawn for illustration.
Mathematics 09 00585 g002
Figure 3. A histogram of the first 50 bins corresponding to the lowest Szeged numbers of all RNA structures in our dataset (with the exception of multi-branch loops), which are native sequences, compared to their shuffled sequences obtained using shuffleseq from EMBOSS. Reported p-value (see text) is less than 0.0001.
Mathematics 09 00585 g003
Figure 4. A histogram of the last 50 bins corresponding to the highest Szeged numbers of all RNA structures in our dataset (with the exception of multi-branch loops), which are native sequences, compared to their shuffled sequences obtained using shuffleseq from EMBOSS. Reported p-value (see text) is less than 0.0001.
Mathematics 09 00585 g004
Figure 5. The neutrality distribution of all structures from our dataset comparing native and shuffled sequences. Reported p-value (see text) is less than 0.0001.
Mathematics 09 00585 g005
Figure 6. The mean free energy (MFE) distribution of all one-hairpin (1H) structures in our dataset comparing native and shuffled sequences. Reported p-value (see text) is less than 0.0001.
Mathematics 09 00585 g006
Figure 7. The MFE distribution of all two-hairpin (2H) structures in our dataset comparing native and shuffled sequences. Reported p-value (see text) is less than 0.0001.
Mathematics 09 00585 g007
Table 1. Eigenvalue statistics: distribution of our dataset according to the second smallest Laplacian eigenvalue.
Eigenvalue1H Structures: Total = 594,9372H Structures:Total = 82,564
2.0361,043None
1.0137,61641,858
<1.096,27840,706
Table 2. Eigenvalue statistics: distribution of the one-hairpin structures (1H) structures according to the second smallest Laplacian eigenvalue.
Eigenvalue1H Structures: Total = 594,937
2.0361,043
1.0137,616
0.58578667,504
0.38196624,744
0.2679493843
0.198062186
0.1522411
Table 3. Steps taken for calculating the Szeged index Sz(R) for the RNA structure depicted in Figure 2. The sequence and secondary structure representation in dot-bracket notation appear below the table.
CrnR′(0)nR″(0)r × nR′(0) × nR″(0)
C 1 231272
C 2 2510100
C 3 278112
C 4 296108
C 5 212372
C 6 212372
C 7 678336
C 8 114114
Sequence: AGAGCCAAUGCUCUG; Structure: (((((…))))); Sz(R) = 886.
Publisher’s Note: MDPI stays neutral with regard to jurisdictional claims in published maps and institutional affiliations.

