Abstract
Background: The impact of leaks has mainly been assessed in bench models using continuous leak patterns which did not reflect real-life leakage. We aimed to assess the impact of the pattern and intensity of unintentional leakage (UL) using several respiratory models. Methods: An active artificial lung (ASL 5000) was connected to three bilevel-ventilators set in pressure mode; the experiments were carried out with three lung mechanics (COPD, OHS and NMD) with and without upper airway obstruction. Triggering delay, work of breathing, pressure rise time, inspiratory pressure, tidal volume, cycling delay and the asynchrony index were measured at 0, 6, 24 and 36 L/min of UL. We generated continuous and inspiratory UL. Results: Compared to 0 L/min of UL, triggering delays were significantly higher with 36 L/min of UL (+27 ms) and pressure rise times were longer (+71 ms). Cycling delays increased from −4 [−250–169] ms to 150 [−173–207] ms at, respectively 0 L/min and 36 L/min of UL and work of breathing increased from 0.15 [0.12–0.29] J/L to 0.19 [0.16–0.36] J/L. Inspiratory leakage pattern significantly increased triggering delays (+35 ms) and cycling delays (+263 ms) but decreased delivered pressure (−0.94 cmH2O) compared to continuous leakage pattern. Simulated upper airway obstruction significantly increased triggering delay (+199 ms), cycling delays (+371 ms), and decreased tidal volume (−407 mL) and pressure rise times (−56 ms). Conclusions: The pattern of leakage impacted more the device performances than the magnitude of the leakage per se. Flow limitation negatively reduced all ventilator performances.
1. Introduction
Non-invasive positive-pressure ventilation (NIV) is the first choice of long-term, home treatment for chronic hypercapnic respiratory failure (CH-RF) [1]. The use of long-term NIV has tremendously increased over the last 2 decades in most countries, in particular for the treatment of Chronic Obstructive Pulmonary Disease (COPD), Obesity Hypoventilation Syndrome (OHS) and Neuromuscular Diseases (NMD) [2,3]. Data have shown that NIV improves both physiological and clinical outcomes in all precited diseases [4,5,6].
Unintentional leaks can occur during long-term NIV. Unintentional Leaks can alter NIV clinical efficacy and decrease NIV tolerance [7,8]. Leaks can also impair devices performances [9,10,11]. Hence, nowadays, clinicians monitor unintentional leaks while initiating NIV or during follow-up [11,12,13].
Monitoring NIV has become easier thanks to the development of remote monitoring [14,15]. Apart from daily use of the ventilator, all monitored data (triggered breaths, residual apnea hypopnea index, estimated volume…) are derived from the flow delivered by the ventilator. As leaks lead to an increase of the ventilator flow, the reliability of monitored data may be reduced in the presence of leaks [16]. However, to date, the impact of leaks has mainly been assessed in bench models that did not reflect leaks as they occur in real-life or only in ventilators used for patients requiring life-support ventilator. Indeed, in real-life most leaks are unintentional and not predictable [17,18,19]. Hence, they may have variable intensity and different patterns: inspiratory or continuous leakage, mouth leak, leaks created by sleep position change or device pressure change, transient leakage owing to mask displacement, etc. [20].
Our hypothesis was that non-continuous leakage had more detrimental impact on ventilator performances than continuous leakage, particularly regarding triggering and cycling delays. Therefore, our aim was to assess the impact of the level and pattern of unintentional leakage as well as the influence of different respiratory models on home bilevel ventilators performances and synchrony in the most used ventilators currently available.
2. Materials and Methods
Our bench model consisted of an active artificial lung model (ASL-5000, Ingmar Medical, Pittsburgh, PA, USA) connected to three bilevel ventilators: Vendom 40 (Air Liquide Medical Systems, Antony, France), Lumis 150 VPAP ST (Resmed, San Diego, CA, USA) and DreamStation BIPAP S/T (Philips Respironics, Murrysville, PA, USA); respectively named V40, L150 and DS thereafter. We used a 22 mm single limb circuit of 1.8 m long for all experiments. Respiratory efforts were simulated with a muscular pressure curve model depending on two parameters which are the airway pressure drop at 100 ms (P0.1) and the respiratory rate (RR); see Fresnel et al. [21] work for detailed respiratory effort settings used in this bench study. This effort was combined with three different lung mechanics conditions, reflecting the pulmonary function of the simulated patients by modulating resistance (R) and compliance (C) parameters; 20 respiratory cycles were simulated for each condition.
2.1. Simulated Airway Obstruction
For each respiratory model we simulated upper airway obstruction by increasing the resistance parameter in the ASL 5000 settings. This created a flow limitation in addition to the initial parameters of each model, mimicking situations seen when obstructive respiratory events appear during sleep. All the simulation parameters are reported Table 1.

Table 1.
Parameters used to simulate pulmonary mechanics and respiratory dynamics with the mechanical lung.
2.2. Intentional and Unintentional Leaks
We placed a T-piece between the ASL 5000 and the ventilator circuit. T-piece was connected to a calibrated intentional leak port fixed at 34 l/min at 10 cmH2O (corresponding to the median intentional leak of the principal facial masks available on the market nowadays).
We generated two types of unintentional leaks: continuous and inspiratory leaks. To simulate various rates of unintentional leakage we used a variable opening valve downstream to the calibrated intentional leak port. In case of inspiratory leaks, we added a Threshold PEP device set at 6 cmH2O (Philips Respironics, Murrysville, PA, USA) allowing leaks to only occur during insufflation when the pressure in the circuit was higher than the end positive expiratory pressure set. Leak patterns are likely to affect device trigger regulations, yet the influence of leakage on device performances is usually assessed using continuous (linear) models of leakage [22] which is not representative of that occurs in real life owing to several reasons such as: mouth breathing, patient position, phase of the respiratory cycle or respiratory events [20].
Total leak was continuously monitored using a pneumotachograph (SFM3000, Sensirion, Stäfa, Switzerland). Each level of unintentional leakage was systematically titrated at 10 cmH2O before each experiment. Figure 1 depicts the experimental model.
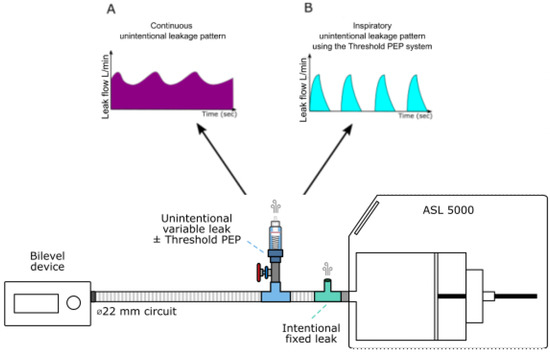
Figure 1.
Experimental setup used to generate intentional and unintentional leakages. ASL 5000: artificial lung. (A) represents a schematization of the continuous leakage pattern observed when the Threshold PEP system is not activated. (B) represents a schematization of the inspiratory unintentional leakage (intermittent) pattern observed when the Threshold PEP is activated: in that condition, leakage occurs only when the pressure is higher or equal to 6 cmH20, therefore only during the inspiratory phase.
2.3. Ventilator Settings
The devices were set in pressure support mode and all experiments were run without humidifiers. Because expiratory trigger sensitivity and pressure rise time are graduated in different units in each device, these settings were comparatively evaluated using the ASL-5000 to establish equivalent sensitivities and rise time among devices. Detailed settings regarding expiratory trigger and pressure rise time for each device is presented in Table S1. Ventilators were set as follows: inspiratory pressure: 15 cmH2O, expiratory pressure: 5 cmH2O, inspiratory time window: 0.5–1.5 s (when available), backup rate: 7 cycles per minute (or turned off when possible). At the onset of each experiment, the inspiratory trigger sensitivity was set at the intermediate value for L150 and V40 (and in Autotrak mode for DS) as previously described by Zhu et al. [19].
2.4. Ventilator Performance and Synchrony Indicators
To evaluate our outcomes, we computed the following performance indicators of ventilators:
- (1)
- Triggering delay (or Time to trigger) in ms, by measuring the time lag between the onset of the simulated effort and the onset of the pressure support;
- (2)
- Work of breathing (or WOB) in J/s, computed as the integral of the product of the muscular pressure and the flow during the inspiratory phase and reported to the tidal volume;
- (3)
- Pressure rise time in ms, defined as the time required to reach the set pressure during the inspiratory phase;
- (4)
- Delivered inspiratory pressure in cmH2O, defined as the peak pressure reached during the inspiratory pressurization phase;
- (5)
- Tidal volume in ml, defined as the difference between the maximal volume delivered within the current cycle to the mechanical lung and its residual volume;
- (6)
- Cycling delay in ms, by measuring the time lag between the expiratory pressure release and the end of the patient’s neural inspiration.
Description of how ventilator performance was assessed is depicted in Figure S1.
Patient-ventilator asynchrony is defined as the mismatching between neural and mechanical inspiratory time [23,24] and can be assessed using the asynchrony index. According to the framework proposed by the SomnoNIV group, the following “simulated patient” ventilator asynchrony (sPVA) events were assessed [13]:
- Ineffective efforts (IE) characterized by an inspiratory effort not assisted by the ventilator. It can be identified as a drop of airway pressure associated with an increase or decrease of airflow (if occurring during expiratory or inspiratory phase, respectively).
- Auto-triggering (Auto), characterized by the presence of mechanical cycles unrelated to the patient’s spontaneous breathing.
The asynchrony index (AI) provided as a percentage (%), was calculated as the total number of asynchronous cycles (ineffectively triggered breaths plus auto-triggered breaths) divided by the number of simulated respiratory cycles for each experiment.
2.5. Experimental Protocol
Experiments started with 0 l/min of unintentional leak and lasted 20 respiratory cycles. At the end of these 20 cycles, if the simulated patient-ventilator asynchrony (sPVA) rate was inferior to 25% [19], the unintentional leak would be manually increased in a stepwise manner as follows: 6, 24 and 36 l/min. If sPVA were equal of superior to 25%, then the last level of unintentional leak was maintained while the inspiratory trigger was adjusted in a stepwise manner to decrease the sPVA rate as follows: increase the inspiratory trigger sensitivity if predominant sPVA were ineffective efforts or decrease of the inspiratory trigger sensitivity if predominant sPVA were auto-triggered cycles. This procedure was repeated until the critical leak was reached or until 36 l/min, the maximum leak level initially planned in our experimental protocol. An “effective” adjustment was defined as a manual adjustment of trigger sensitivity that decreased sPVA below 25%. The sPVA threshold of 25% was based on a previous work published by Zhu et al. [19]. This procedure was repeated for each ventilator crossed with the three respiratory conditions (COPD, OHS and NMD), with continuous and inspiratory unintentional leak and last with and without simulated upper airway obstruction.
2.6. Statistical Analysis
Results are expressed as median and interquartile intervals. Mann–Whitney or Kruskal–Wallis tests were used to compare independent continuous variables. Wilcoxon or Friedman tests were used to compare continuous dependent variables. In that case, we used the setup without unintentional leakage as reference and applied Dunn’s correction for multiple comparisons. All tests were two-sided. For all tests, significance level was set at 0.05. Statistical analysis was performed using Prism 9.0.0 (GraphPad Software, La Jolla, CA, USA).
3. Results
- Influence of leakage rate
Triggering delays were preserved until 24 l/min of unintentional leakage but were significantly higher with 36 l/min of unintentional leakage (+27 ms with 36 l/min of unintentional leak compared to the absence of unintentional leakage, p < 0.01). Pressure rise times were longer at 36 l/min (+71 ms, p > 0.001 compared to the absence of unintentional leakage). Cycling delays were affected by leakage greater or equal to 24 l/min: they increased from −4 [−250–169] ms without unintentional leak to 150 [−173–207] ms with 36 l/min of unintentional leak (p < 0.002). Work of breathing significantly increased with higher unintentional leak: from 0.15 [0.12–0.29] J/l without unintentional leak to 0.19 [0.16–0.36] J/l with 36 l/min of unintentional leak (p < 0.001). Delivered pressure was maintained for all leak flow rates above the set IPAP and no significant difference was observed for delivered volume (Figure 2).
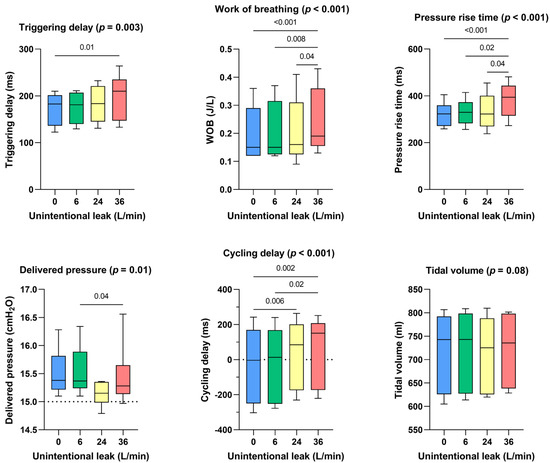
Figure 2.
Consolidated data integrating the 3 respiratory models/devices without flow limitation, for the dose response effect between the level of continuous unintentional leakage (0, 6, 24 and 36 L/min) and the following indicators: triggering delays, work of breathing, pressure rise time, delivered pressure, cycling delay and tidal volume.
- Influence of leak pattern
Continuous leakage pattern had a similar impact on triggering delay, delivered pressure, and cycling delay than the control situation (ie. no leakage) (Figure 3). Inspiratory leakage pattern increased triggering delays (+35 ms, p = 0.002), delivered pressure was lower (−0.94 cmH2O, p < 0.001) and cycling delays were longer (+263 ms, p < 0.001) compared to continuous leakage pattern. Works of breathing, pressure rise times and delivered volumes were not significantly affected.
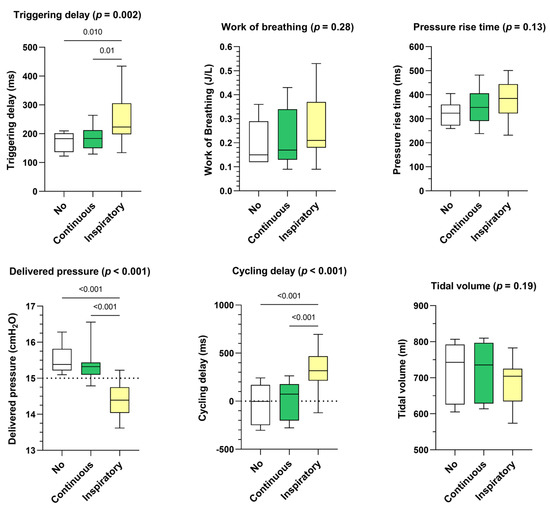
Figure 3.
Consolidated data integrating the 3 respiratory models/devices without flow limitation according to the pattern of unintentional leak (continuous versus inspiratory) on triggering delays, work of breathing, pressure rise time, delivered pressure, cycling delay and tidal volume. Box plots «No» represent the control situation, i.e., without unintentional leakage.
- Influence of simulated upper airway obstruction
Triggering delay significantly increased for all devices in the case of a simulated upper airway obstruction (+199 ms, p < 0.001) while tidal volume was significantly decreased (−407 mL, p < 0.001). The simulation of upper airway obstruction moderately shortened pressure rise times (−56 ms, p < 0.001) but significantly increased cycling delays (+371 ms, p < 0.001). Work of breathing was not significantly impacted (p = 0.34) (Figure 4).
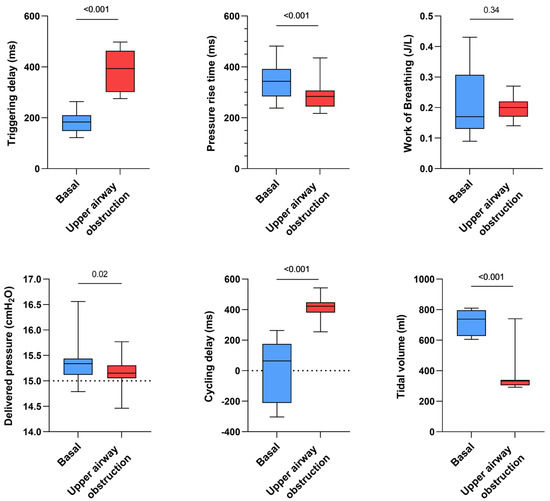
Figure 4.
Consolidated data integrating the 3 respiratory models/devices and the 3 ventilators with continuous and inspiratory leakage according to airway patency status (upper airway obstruction versus absence of upper airway obstruction, both simulated by increasing or not the resistance settings on the ALS 5000) on triggering delays, work of breathing, pressure rise time, delivered pressure, cycling delay and tidal volume.
- Influence of respiratory models
In COPD model triggering and cycling delays were increased with respect to OHS model (respectively +52 ms, p < 0.009 and +264 ms, p < 0.02), cycling delay was also augmented with COPD model compared to NMD model (+256 ms, p < 0.0001). Work of breathing was significantly higher in OHS model (+0.07 J/L vs. COPD model, p < 0.0002 and +0.12 J/L vs. NMD model, p < 0.0001). Rise time was higher in NMD compared to OHS and COPD model (respectively +63 ms, p < 0.009 and +76 ms, p < 0.014). Last, tidal volume was highly augmented with NMD (+285 mL vs. COPD, p < 0.0001 model and +323 mL vs. OHS model, p < 0.0001) (Figure S2).
- Impact of leak patterns on asynchrony index
As shown in Figure 5, the gradual increase in unintentional leak rate did not significantly affect the occurrence of patient-ventilator asynchronies when the leak pattern was continuous. Conversely, inspiratory leak pattern significantly increased PVA rate at 36 L/min (p = 0.04) compared with lower leak flow rates.
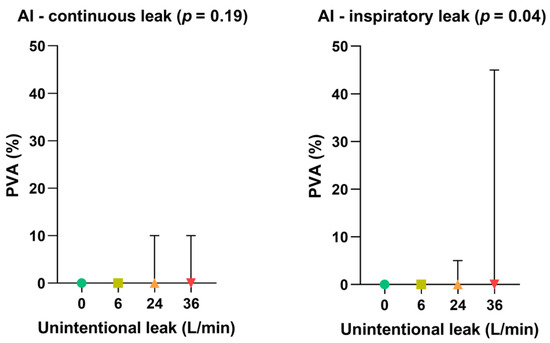
Figure 5.
Consolidated data integrating the 3 respiratory models/devices without flow limitation according to the pattern of unintentional leak (continuous versus inspiratory) on patient-ventilator asynchrony (PVA) rates. Symbols and associated bars represent the median values and interquartile ranges. Liter per minute (L/min): Asynchrony Index (AI).
- Difference between ventilators
Regarding the device used, no significant difference was observed between the devices for triggering delays, cycling delays, or delivered volume (p = 0.35, p = 0.9 and p = 0.7, respectively). Work of breathing was significantly increased with DS (p = 0.05) and IPAP was always maintained for all devices above the set IPAP, with higher pressures observed with L150 (p = 0.012) (Figure S3).
4. Discussion
In this bench study, we demonstrated that the pattern of leakage (intermittent leaks) had more impact on the device performances and the patient-ventilator asynchronies than the magnitude of the leak flow rate itself. We also evidenced that flow limitation negatively impacted all performance indicators.
Unintentional leakage is the main adverse effect encountered in the setting of long-term ventilation [9,11,12,25]. Several strategies can be proposed to reduce leakage such as mask size change, a careful choice of the type of interface, switching from a nasal to an oronasal mask when mouth leaks are suspected [26,27], or carefully reducing the pressure [26,28]. Unfortunately, such interventions are not always sufficient to tackle recalcitrant unintentional leakage since several determinants of unintentional leak exist and may be involved [26]. If leakages can reduce patients’ comfort and observance over the long term [29,30], our results demonstrate that bilevel ventilators can nevertheless support high unintentional leak rate without degrading their performances nor creating PVA until a certain level of leak flow rate is reached. To date, no clear cut-off for the acceptable level of unintentional leakages has been determined. A leak threshold of 24 l/min [31] is often considered as the acceptable limit beyond which a clinical intervention is required, although this limit is not based upon evidence [27,30]. This threshold is probably clinically irrelevant since our results demonstrated that ventilator performances and synchronization were not only determined by leakage rate, but also linked to (i) the leak pattern and (ii) the presence of flow limitation. This is of great importance while adjusting NIV parameters, since special attention should be paid to the nature of leakage, e.g., sawtooth leaks created by recurrent mouth openings, even at low leak flow rates, which could strongly impact the performance of the device and its synchronization. Hence, clinicians (physicians, physiotherapists, nurses, etc.) should aim at reducing unintentional leakage as much as possible, even at low leakage rate, in order to tackle potential NIV-related side effects that are particularly common [32]. In addition, the clinical consequences of leakage should not be forgotten. That is why it is important to ask the patient directly about the potential adverse effects of leakage, even if the leakage reported by the telemonitoring system seems low.
Interestingly, performances indicators did not differ when comparing consolidated continuous leakages (Figure 2) to the control situation (absence of unintentional leak) suggesting that device algorithms can cope with leaks when they are constant but have difficulties as soon as the leak is polymorphic or not homogeneous.
Although the algorithms of the ventilators differ from each other, some general hypothesis may explain why the intermittent leakages may have a more detrimental impact than continuous leakages on device synchronization.
- (i)
- Leak compensation algorithms probably calculate the mean unintentional leakage rate. if the leakage appears only during the inspiratory phase, thus the mean leakage rate is likely to be underestimated assuming a situation of continuous leakage (expiratory and inspiratory leak). In these conditions, the device may interpret the unintentional leak as patient flow, which leads to cycling delays since the patient flow drop is not correctly distinguished from the leak flow;
- (ii)
- On the other hand, during exhalation, the unintentional leak is probably overestimated since the averaging considers the inspiration additional leak. This may lead to a decreased sensitivity of the inspiratory trigger thresholds.
- (iii)
- Last, during the conception phase, ventilator devices are designed and tested using calibrated leak port only, providing continuous and rather stable leakage rates.
In our study, the type of ventilator had little influence on the occurrence of PVA. To a certain extent they all failed to maintain PVA rate under 25% in the same conditions. We naturally observed some discrepancy between devices, but the main drivers were still the pattern of the leak, the presence of an upper airway flow limitation (simulated by the bench) and the mechanical property of the models.
Contal et al. demonstrated that the algorithms of the different devices differ when it comes to leakage estimation [16]. Nevertheless, the purpose of our study was not to assess the performance of the devices in estimating leakage; Zhu et al. already showed the great difference between actual level of leak and what is estimated by the devices [19]. As with CPAP devices, bilevel ventilators do not report leak rate the same way among manufacturers, which is detrimental when monitoring NIV. For example, some manufacturers report global leaks while others report only estimated unintentional leaks. Some report mean or median leaks, 90th percentile or 95th percentile. This makes it difficult for medical staff to read the devices reports, creates confusion and makes it difficult to change ventilators for the same patient, when necessary, since the leaks data cannot be compared. We suggest, as many other authors, that leakage (unintentional and intentional) should be reported in a standardized manner by all the manufacturers, which would greatly facilitate patient’s monitoring, as well as research regarding leakage influence on clinical outcomes and technical performance of the devices.
The main limit of our work was that we simulated the upper airway flow limitation using the ASL 5000, whereas one can argue that using a starling resistance system to mimic upper airway closure is more realistic. We nevertheless obtained similar results than Zhu et al. when flow limitation was applied, which makes us think that our flow limitation model was acceptable. Second, we only tested two type of leak patterns, one continuous and one inspiratory only. It would have been relevant to evaluate a random anarchic pattern of unintentional leakage or expiratory leak only, as made by Sogo, Luján et al. [33,34,35,36]. It is likely that the presence of unintentional random anarchic leakage patterns can impact the functioning of the machines even more, since the irregular character of the leakage flow is not well corrected by the algorithms. We are currently working on the simulation of random patterns of anarchic leakage, which could allow in the future to evaluate more accurately the behavior of the devices.
5. Conclusions
In summary, this bench highlighted the good performance of bilevel ventilators in the presence of high-level unintentional leakage. These results also suggest that home bilevel ventilators are as effective in managing leakage than life supports [19]. We also contributed to demonstrate that there is no generic threshold of “critical leak” and that the intermittent, or polymorphic nature of unintentional leakage has a more deleterious impact on device performance and synchronization, than the leak flow rate of continuous leakage. Bench studies evaluating noninvasive ventilation devices should include not only an unintentional leak port, but also allows for creating polymorphic or dynamic leak patterns. Last, in a context of democratization of remote monitoring, it is thus advisable to be particularly attentive in case of high unintentional leakage, heterogeneous leakage or important respiratory flow limitation. Indeed, it is very likely that this can degrade the quality of the ventilation, but also the quality of the data estimated/measured by the devices and transmitted to the physician and the home care provider.
Supplementary Materials
The following supporting information can be downloaded at: https://www.mdpi.com/article/10.3390/healthcare10122416/s1, Table S1: Expiratory trigger sensitivities (corresponding %Qflow) and pressure rise time (corresponding measured rise time) for each device and respiratory model. %Qflow: percentage of the peak flow during the inspiratory phase; Figure S1: Description of how ventilator performance was assessed. The onset of pressure support allows measurement of the triggering delay and the flow to trigger, while the return to expiratory pressure allows measurement of the cycling delay. The maximal delivered pressure, the pressure rise time and the tidal volume were measured from the ASL-5000 airway pressure and piston volume. Pmus: muscular pressure; Figure S2: Consolidated data integrating the 3 ventilators with continuous leakage according to the 3 respiratory models with and without flow limitation on triggering delays, work of breathing, pressure rise time, delivered pressure, cycling delay and tidal volume; Figure S3: Consolidated data integrating the 3 respiratory models with continuous leakage according to the 3 respiratory ventilators with and without flow limmitation on triggering delays, work of breathing, pressure rise time, delivered pressure, cycling delay and tidal volume.
Author Contributions
Conceptualization, M.L., M.P., N.P. and E.F.; methodology, M.L., A.K. and E.F.; validation, K.Z., A.K. and J.-C.R.; writing—original draft preparation, M.L and E.F.; writing—review and editing, M.P and J.-C.R.; supervision, M.P. and J.-C.R.; project administration, M.L.; funding acquisition, M.L. All authors have read and agreed to the published version of the manuscript.
Funding
This research was funded by AIR LIQUIDE MEDICAL SYSTEMS, there is no grant number.
Institutional Review Board Statement
Not applicable.
Informed Consent Statement
Not applicable.
Data Availability Statement
Data are available upon request to the corresponding author.
Acknowledgments
We thank Arnaud Lesimple (PhD student in Med2 Lab, Air Liquide Medical Systems) for his careful proofreading.
Conflicts of Interest
Nathan Prouvez and Kaixian Zhu are full-time employees of Air Liquide Medical Systems. Marius Lebret and Jean-Christophe Richard are part-time employees of Air Liquide Medical Systems.
References
- Simonds, A.K. Home Mechanical Ventilation: An Overview. Ann. Am. Thorac. Soc. 2016, 13, 2035–2044. [Google Scholar] [CrossRef] [PubMed]
- Cantero, C.; Adler, D.; Pasquina, P.; Uldry, C.; Egger, B.; Prella, M.; Janssens, J.P. Long Term Noninvasive Ventilation in the Geneva Lake Area: Indications, Prevalence and Modalities. Available online: http://www.sciencedirect.com/science/article/pii/S0012369220305511 (accessed on 1 September 2022).
- Sancho, J.; Servera, E.; Morelot-Panzini, C.; Salachas, F.; Similowski, T.; Gonzalez-Bermejo, J. Non-invasive ventilation effectiveness and the effect of ventilatory mode on survival in ALS patients. Amyotroph. Lateral Scler. Front. Degener. 2013, 15, 55–61. [Google Scholar] [CrossRef] [PubMed]
- Masa, J.F.; Mokhlesi, B.; Benítez, I.; de Terreros, F.J.G.; Sánchez-Quiroga, M.Á.; Romero, A.; Bengoa, M. Long-term clinical effectiveness of continuous positive airway pressure therapy versus non-invasive ventilation therapy in patients with obesity hypoventila-tion syndrome: A multicentre, open-label, randomised controlled trial. Lancet 2019, 393, 1721–1732. [Google Scholar] [CrossRef] [PubMed]
- Murphy, P.B.; Rehal, S.; Arbane, G.; Bourke, S.; Calverley, P.M.; Crook, A.M.; Hart, N. Effect of Home Noninvasive Ventilation with Oxygen Therapy vs Oxygen Therapy Alone on Hospital Readmission or Death After an Acute COPD Exacerbation: A Ran-domized Clinical Trial. JAMA 2017, 317, 2177–2186. [Google Scholar] [CrossRef] [PubMed]
- Köhnlein, T.; Windisch, W.; Köhler, D.; Drabik, A.; Geiseler, J.; Hartl, S.; Karg, O.; Laier-Groeneveld, G.; Nava, S.; Schönhofer, B.; et al. Non-invasive positive pressure ventilation for the treatment of severe stable chronic obstructive pulmonary disease: A prospective, multicentre, randomised, controlled clinical trial. Lancet Respir. Med. 2014, 2, 698–705. [Google Scholar] [CrossRef]
- Fanfulla, F.; Taurino, A.E.; Lupo, N.D.; Trentin, R.; D’Ambrosio, C.; Nava, S. Effect of sleep on patient/ventilator asynchrony in patients undergoing chronic non-invasive mechanical ventilation. Respir. Med. 2007, 101, 1702–1707. [Google Scholar] [CrossRef]
- Crescimanno, G.; Canino, M.; Marrone, O. Asynchronies and sleep disruption in neuromuscular patients under home noninva-sive ventilation. Respir. Med. 2012, 106, 1478–1485. [Google Scholar] [CrossRef]
- Teschler, H.; Stampa, J.; Ragette, R.; Konietzko, N.; Berthon-Jones, M. Effect of mouth leak on effectiveness of nasal bilevel venti-latory assistance and sleep architecture. Eur. Respir. J. 1999, 14, 1251–1257. [Google Scholar] [CrossRef]
- Rabec, C.; Rodenstein, D.; Leger, P.; Rouault, S.; Perrin, C.; Gonzalez-Bermejo, J. Ventilator modes and settings during non-invasive ventilation: Effects on respiratory events and implications for their identification. Thorax 2010, 66, 170–178. [Google Scholar] [CrossRef]
- Meyer, T.J.; Pressman, M.R.; Benditt, J.; McCool, F.D.; Millman, R.P.; Natarajan, R.; Hill, N.S. Air leaking through the mouth during noc-turnal nasal ventilation: Effect on sleep quality. Sleep 1997, 20, 561–569. [Google Scholar] [CrossRef][Green Version]
- Gonzalez-Bermejo, J.; Janssens, J.-P.; Rabec, C.; Perrin, C.; Lofaso, F.; Langevin, B.; Carlucci, A.; Luján, M. Framework for patient-ventilator asynchrony during long-term non-invasive ventilation. Thorax 2019, 74, 715–717. [Google Scholar] [CrossRef]
- Gonzalez, J.; Sharshar, T.; Hart, N.; Chadda, K.; Raphaël, J.C.; Lofaso, F. Air leaks during mechanical ventilation as a cause of per-sistent hypercapnia in neuromuscular disorders. Intensive Care Med. 2003, 29, 596–602. [Google Scholar] [CrossRef]
- Mansell, S.K.; Cutts, S.; Hackney, I.; Wood, M.J.; Hawksworth, K.; Creer, D.D.; Kilbride, C.; Mandal, S. Using domiciliary non-invasive ventilator data downloads to inform clinical decision-making to optimise ventilation delivery and patient compliance. BMJ Open Respir. Res. 2018, 5, e000238. [Google Scholar] [CrossRef]
- Borel, J.; Palot, A.; Patout, M. Technological advances in home non-invasive ventilation monitoring: Reliability of data and effect on patient outcomes. Respirology 2019, 24, 1143–1151. [Google Scholar] [CrossRef]
- Contal, O.; Vignaux, L.; Combescure, C.; Pepin, J.L.; Jolliet, P.; Janssens, J.P. Monitoring of noninvasive ventilation by built-in soft-ware of home bilevel ventilators: A bench study. Chest 2012, 141, 469–476. [Google Scholar] [CrossRef]
- Ueno, Y.; Nakanishi, N.; Oto, J.; Imanaka, H.; Nishimura, M. A Bench Study of the Effects of Leak on Ventilator Performance During Noninvasive Ventilation. Respir. Care 2011, 56, 1758–1764. [Google Scholar] [CrossRef]
- Rabec, C.; Georges, M.; Kabeya, N.K.; Baudouin, N.; Massin, F.; Reybet-Degat, O.; Camus, P. Evaluating noninvasive ventilation using a monitoring system coupled to a ventilator: A bench-to-bedside study. Eur. Respir. J. 2009, 34, 902–913. [Google Scholar] [CrossRef]
- Zhu, K.; Rabec, C.; Gonzalez-Bermejo, J.; Hardy, S.; Aouf, S.; Escourrou, P.; Roisman, G. Combined effects of leaks, respiratory system properties and upper airway patency on the performance of home ventilators: A bench study. BMC Pulm. Med. 2017, 17, 145. [Google Scholar] [CrossRef]
- Lebret, M.; Arnol, N.; Martinot, J.-B.; Lambert, L.; Tamisier, R.; Pepin, J.-L.; Borel, J.-C. Determinants of Unintentional Leaks During CPAP Treatment in OSA. Chest 2018, 153, 834–842. [Google Scholar] [CrossRef]
- Fresnel, E.; Muir, J.-F.; Letellier, C. Realistic human muscle pressure for driving a mechanical lung. EPJ Nonlinear Biomed. Phys. 2014, 2, 7. [Google Scholar] [CrossRef]
- Olivieri, C.; Costa, R.; Conti, G.; Navalesi, P. Bench studies evaluating devices for non-invasive ventilation: Critical analysis and future perspectives. Intensiv. Care Med. 2011, 38, 160–167. [Google Scholar] [CrossRef] [PubMed]
- Carteaux, G.; Lyazidi, A.; Cordoba-Izquierdo, A.; Vignaux, L.; Jolliet, P.; Thille, A.W.; Brochard, L. Patient-ventilator asynchrony during noninvasive ventilation: A bench and clinical study. Chest 2012, 142, 367–376. [Google Scholar] [CrossRef] [PubMed]
- Guo, Y.F.; Sforza, E.; Janssens, J.P. Respiratory patterns during sleep in obesity-hypoventilation patients treated with nocturnal pressure support: A preliminary report. Chest 2007, 131, 1090–1099. [Google Scholar] [CrossRef] [PubMed]
- Goutorbe, P.; Daranda, E.; Asencio, Y.; Esnault, P.; Prunet, B.; Bordes, J.; Meaudre, E. Leaks can dramatically decrease FiO2 on home venti-lators: A bench study. BMC Res Notes 2013, 6, 282. [Google Scholar] [CrossRef] [PubMed]
- Lebret, M.; Martinot, J.B.; Arnol, N.; Zerillo, D.; Tamisier, R.; Pepin, J.L.; Borel, J.C. Factors Contributing to Unintentional Leak During CPAP Treatment: A Systematic Review. Chest 2017, 151, 707–719. [Google Scholar] [CrossRef]
- Genta, P.R.; Kaminska, M.; Edwards, B.A.; Ebben, M.R.; Krieger, A.C.; Tamisier, R.; Strollo, P. The Importance of Mask Selection on Con-tinuous Positive Airway Pressure Outcomes for Obstructive Sleep Apnea. An Official American Thoracic Society Workshop Report. Ann. ATS 2020, 17, 1177–1185. [Google Scholar] [CrossRef]
- Pierucci, P.; Portacci, A.; Carpagnano, G.E.; Banfi, P.; Crimi, C.; Misseri, G.; Gregoretti, C. The right interface for the right patient in noninva-sive ventilation: A systematic review. Expert Rev. Respir. Med. 2022, 16, 931–944. [Google Scholar] [CrossRef]
- Lebret, M.; Jaffuel, D.; Suehs, C.M.; Mallet, J.P.; Lambert, L.; Rotty, M.C.; Borel, J.C. Feasibility of Type 3 Polygraphy for Evaluating Leak Determinants in CPAP-Treated OSA Patients: A Step Toward Personalized Leak Management. Chest 2020, 158, 2165–2171. [Google Scholar] [CrossRef]
- Rowland, S.; Aiyappan, V.; Hennessy, C.; Catcheside, P.; Chai-Coezter, C.L.; McEvoy, D.; Antic, N.A. Comparing the Efficacy, Mask Leak, Patient Adherence, and Patient Preference of Three Different CPAP Interfaces to Treat Moderate-Severe Obstructive Sleep Apnea. J. Clin. Sleep Med. 2018, 14, 101–108. [Google Scholar] [CrossRef]
- Valentin, A.; Subramanian, S.; Quan, S.F.; Berry, R.B.; Parthasarathy, S. Air Leak is Associated with Poor Adherence to Autopap Therapy. Sleep 2011, 34, 801–806. [Google Scholar] [CrossRef]
- Schwab, R.J.; Badr, S.M.; Epstein, L.J.; Gay, P.C.; Gozal, D.; Kohler, M.; Weaver, T.E. An Official American Thoracic Society Statement: Con-tinuous Positive Airway Pressure Adherence Tracking Systems. The Optimal Monitoring Strategies and Outcome Measures in Adults. Am. J. Respir. Crit. Care Med. 2013, 188, 613–620. [Google Scholar] [CrossRef]
- Jolly, G.; Razakamanantsoa, L.; Fresnel, E.; Gharsallaoui, Z.; Cuvelier, A.; Patout, M. Defining successful non-invasive ventilation initiation: Data from a real-life cohort. Respirology 2021, 26, 1067–1075. [Google Scholar] [CrossRef]
- Luján, M.; Sogo, A.; Pomares, X.; Monsó, E.; Sales, B.; Blanch, L. Effect of leak and breathing pattern on the accuracy of tidal vol-ume estimation by commercial home ventilators: A bench study. Respir Care 2013, 58, 770–777. [Google Scholar] [CrossRef]
- Sogo, A.; Montanyà, J.; Monsó, E.; Blanch, L.; Pomares, X.; Lujàn, M. Effect of dynamic random leaks on the monitoring accuracy of home mechanical ventilators: A bench study. BMC Pulm. Med. 2013, 13, 75. [Google Scholar] [CrossRef]
- Lujàn, M.; Sogo, A.; Grimau, C.; Pomares, X.; Blanch, L.; Monso, E. Influence of Dynamic Leaks in Volume-Targeted Pressure Support Noninvasive Ventilation: A Bench Study. Respir. Care 2014, 60, 191–200. [Google Scholar] [CrossRef]


Publisher’s Note: MDPI stays neutral with regard to jurisdictional claims in published maps and institutional affiliations. |
© 2022 by the authors. Licensee MDPI, Basel, Switzerland. This article is an open access article distributed under the terms and conditions of the Creative Commons Attribution (CC BY) license (https://creativecommons.org/licenses/by/4.0/).