
Risk of Hypertension and Use of Antihypertensive Drugs in the Physically Active Population under-70 Years Old—Spanish Health Survey

 , , , ,
  and
and
Abstract
:1. Introduction
2. Materials and Methods
2.1. Design
2.2. Subjects
2.3. Procedures
2.4. Statistical Analysis
3. Results
4. Discussion
4.1. Practical Applications
4.2. Limitations
5. Conclusions
Author Contributions
Funding
Institutional Review Board Statement
Informed Consent Statement
Data Availability Statement
Conflicts of Interest
References
- Mähler, A.; Wilck, N.; Rauch, G.; Dechend, R.; Müller, D.N. Effect of a Probiotic on Blood Pressure in Grade 1 Hypertension (HYPRO): Protocol of a Randomized Controlled Study. Trials 2020, 21, 1032. [Google Scholar] [CrossRef] [PubMed]
- Arima, H.; Barzi, F.; Chalmers, J. Mortality Patterns in Hypertension. J. Hypertens. 2011, 29, S3–S7. [Google Scholar] [CrossRef] [PubMed]
- Vasan, R.S.; Beiser, A.; Seshadri, S.; Larson, M.G.; Kannel, W.B.; D’Agostino, R.B.; Levy, D. Residual Lifetime Risk for Developing Hypertension in Middle-Aged Women and Men: The Framingham Heart Study. JAMA 2002, 287, 1003–1010. [Google Scholar] [CrossRef] [PubMed]
- Gopar-Nieto, R.; Ezquerra-Osorio, A.; Chávez-Gómez, N.L.; Manzur-Sandoval, D.; Raymundo-Martínez, G.I.M. ¿Cómo Tratar La Hipertensión Arterial Sistémica? Estrategias de Tratamiento Actuales. Arch. Cardiol. México 2021, 91, 493. [Google Scholar] [CrossRef]
- Lugo-Mata, Á.R.; Urich-Landeta, A.S.; Andrades-Pérez, A.L.; León-Dugarte, M.J.; Marcano-Acevedo, L.A.; Jofreed López Guillen, M.H. Factors Associated with the Level of Knowledge about Hypertension in Primary Care Patients. Med. Univ. 2017, 19, 184–188. [Google Scholar] [CrossRef]
- Zhou, B.; Carrillo-Larco, R.M.; Danaei, G.; Riley, L.M.; Paciorek, C.J.; Stevens, G.A.; Gregg, E.W.; Bennett, J.E.; Solomon, B.; Singleton, R.K.; et al. Worldwide Trends in Hypertension Prevalence and Progress in Treatment and Control from 1990 to 2019: A Pooled Analysis of 1201 Population-Representative Studies with 104 Million Participants. Lancet 2021, 398, 957–980. [Google Scholar] [CrossRef]
- Tagle, R. Diagnóstico De Hipertensión Arterial. Rev. Médica Clínica Las Condes 2018, 29, 12–20. [Google Scholar] [CrossRef]
- Menéndez, E.; Delgado, E.; Fernández-Vega, F.; Prieto, M.A.; Bordiú, E.; Calle, A.; Carmena, R.; Castaño, L.; Catalá, M.; Franch, J.; et al. Prevalence, Diagnosis, Treatment, and Control of Hypertension in Spain. Results of the [email protected] Study. Rev. Española Cardiol. Engl. Ed. 2016, 69, 572–578. [Google Scholar] [CrossRef]
- Lawes, C.M.; Vander Hoorn, S.; Rodgers, A. Global Burden of Blood-Pressure-Related Disease, 2001. Lancet 2008, 371, 1513–1518. [Google Scholar] [CrossRef]
- Groves, T. Pandemic Obesity in Europe. BMJ 2006, 333, 1081. [Google Scholar] [CrossRef] [Green Version]
- Pérez-Rodrigo, C.; Hervás Bárbara, G.; Gianzo Citores, M.; Aranceta-Bartrina, J. Prevalence of Obesity and Associated Cardiovascular Risk Factors in the Spanish Population: The ENPE Study. Rev. Española Cardiol. Engl. Ed. 2022, 75, 232–241. [Google Scholar] [CrossRef]
- Redon, J.; Cifkova, R.; Laurent, S.; Nilsson, P.; Narkiewicz, K.; Erdine, S.; Mancia, G. Mechanisms of Hypertension in the Cardiometabolic Syndrome. J. Hypertens. 2009, 27, 441–451. [Google Scholar] [CrossRef]
- Pereira, M.; Lunet, N.; Azevedo, A.; Barros, H. Differences in Prevalence, Awareness, Treatment and Control of Hypertension between Developing and Developed Countries. J. Hypertens. 2009, 27, 963–975. [Google Scholar] [CrossRef]
- Scholze, J.; Alegria, E.; Ferri, C.; Langham, S.; Stevens, W.; Jeffries, D.; Uhl-Hochgraeber, K. Epidemiological and Economic Burden of Metabolic Syndrome and Its Consequences in Patients with Hypertension in Germany, Spain and Italy; A Prevalence-Based Model. BMC Public Health 2010, 10, 529–12. [Google Scholar] [CrossRef] [Green Version]
- Princewel, F.; Cumber, S.N.; Kimbi, J.A.; Nkfusai, C.N.; Keka, E.I.; Viyoff, V.Z.; Beteck, T.E.; Bede, F.; Tsoka-Gwegweni, J.M.; Akum, E.A. Prevalence and Risk Factors Associated with Hypertension among Adults in a Rural Setting: The Case of Ombe, Cameroon. Pan Afr. Med. J. 2019, 34, 147. [Google Scholar] [CrossRef]
- Livingstone, K.M.; McNaughton, S.A. Diet Quality Is Associated with Obesity and Hypertension in Australian Adults: A Cross Sectional Study. BMC Public Health 2016, 16, 1037. [Google Scholar] [CrossRef] [Green Version]
- Bernabe-Ortiz, A.; Carrillo-Larco, R.M. Second-Hand Smoking, Hypertension and Cardiovascular Risk: Findings from Peru. BMC Cardiovasc. Disord. 2021, 21, 576. [Google Scholar] [CrossRef]
- Djoussé, L.; Mukamal, K.J. Alcohol Consumption and Risk of Hypertension: Does the Type of Beverage or Drinking Pattern Matter? Rev. Española Cardiol. Engl. Ed. 2009, 62, 603–605. [Google Scholar] [CrossRef]
- Appel, L.J. Lifestyle Modification as a Means to Prevent and Treat High Blood Pressure. J. Am. Soc. Nephrol. 2003, 14, S99–S102. [Google Scholar] [CrossRef] [Green Version]
- Khan, N.A.; Hemmelgarn, B.; Herman, R.J.; Bell, C.M.; Mahon, J.L.; Leiter, L.A.; Rabkin, S.W.; Hill, M.D.; Padwal, R.; Touyz, R.M.; et al. The 2009 Canadian Hypertension Education Program Recommendations for the Management of Hypertension: Part 2—Therapy. Can. J. Cardiol. 2009, 25, 287–298. [Google Scholar] [CrossRef] [Green Version]
- Whelton, P.K.; Carey, R.M.; Aronow, W.S.; Casey, D.E.; Collins, K.J.; Dennison Himmelfarb, C.; DePalma, S.M.; Gidding, S.; Jamerson, K.A.; Jones, D.W.; et al. 2017 ACC/AHA/AAPA/ABC/ACPM/AGS/APhA/ASH/ASPC/NMA/PCNA Guideline for the Prevention, Detection, Evaluation, and Management of High Blood Pressure in Adults: A Report of the American College of Cardiology/American Heart Association Task Force on Clinical Practice Guidelines. J. Am. Coll. Cardiol. 2018, 71, e127–e248. [Google Scholar] [CrossRef]
- Chobanian, A.V.; Bakris, G.L.; Black, H.R.; Cushman, W.C.; Green, L.A.; Izzo, J.L.; Jones, D.W.; Materson, B.J.; Oparil, S.; Wright, J.T.; et al. Seventh Report of the Joint National Committee on Prevention, Detection, Evaluation, and Treatment of High Blood Pressure. Hypertension 2003, 42, 1206–1252. [Google Scholar] [CrossRef] [Green Version]
- Mills, K.T.; Stefanescu, A.; He, J. The Global Epidemiology of Hypertension. Nat. Rev. Nephrol. 2020, 16, 223. [Google Scholar] [CrossRef]
- Unger, T.; Borghi, C.; Charchar, F.; Khan, N.A.; Poulter, N.R.; Prabhakaran, D.; Ramirez, A.; Schlaich, M.; Stergiou, G.S.; Tomaszewski, M.; et al. 2020 International Society of Hypertension Global Hypertension Practice Guidelines. Hypertension 2020, 75, 1334–1357. [Google Scholar] [CrossRef]
- Ott, C.; Schmieder, R.E. Diagnosis and Treatment of Arterial Hypertension 2021. Kidney Int. 2022, 101, 36–46. [Google Scholar] [CrossRef]
- Laurent, S. Antihypertensive Drugs. Pharmacol. Res. 2017, 124, 116–125. [Google Scholar] [CrossRef]
- Millogo, G.R.C.; Zongo, R.F.E.; Benao, A.; Youl, E.N.H.; Bassoleth, B.A.B.; Ouédraogo, M.; Zabsonré, P.; Guissou, I.P. Prevalence and Adverse Effects of Antihypertensive Agents in Patients Followed up on an Ambulatory Basis at the University Hospital Yalgado Ouédraogo. Pan Afr. Med. J. 2018, 29, 84. [Google Scholar] [CrossRef]
- Baccino, D.; Merlo, G.; Cozzani, E.; Cozzani, E.; Rosa, G.M.; Rosa, G.M.; Tini, G.; Burlando, M.; Parodi, A. Cutaneous Effects of Antihypertensive Drugs. G. Ital. Dermatol. Venereol. 2020, 155, 202–211. [Google Scholar] [CrossRef]
- Park, C.; Wang, G.; Ng, B.P.; Fang, J.; Durthaler, J.M.; Ayala, C. The Uses and Expenses of Antihypertensive Medications among Hypertensive Adults. Res. Soc. Adm. Pharm. 2020, 16, 183–189. [Google Scholar] [CrossRef]
- Pescatello, L.S.; Buchner, D.M.; Jakicic, J.M.; Powell, K.E.; Kraus, W.E.; Bloodgood, B.; Campbell, W.W.; Dietz, S.; Dipietro, L.; George, S.M.; et al. Physical Activity to Prevent and Treat Hypertension: A Systematic Review. Med. Sci. Sports Exerc. 2019, 51, 1314–1323. [Google Scholar] [CrossRef]
- Singh, S.; Shankar, R.; Singh, G.P. Prevalence and Associated Risk Factors of Hypertension: A Cross-Sectional Study in Urban Varanasi. Int. J. Hypertens. 2017, 2017, 5491838. [Google Scholar] [CrossRef] [PubMed] [Green Version]
- Neutel, C.I.; Campbell, N.R.C. Changes in Lifestyle after Hypertension Diagnosis in Canada. Can. J. Cardiol. 2008, 24, 199–204. [Google Scholar] [CrossRef] [Green Version]
- Orozco-Beltrán, D.; Brotons Cuixart, C.; Alemán Sánchez, J.J.; Banegas Banegas, J.R.; Cebrián-Cuenca, A.M.; Gil Guillen, V.F.; Martín Rioboó, E.; Navarro Pérez, J. Recomendaciones Preventivas Cardiovasculares. Actualización PAPPS 2020. Aten. Primaria 2020, 52, 5. [Google Scholar] [CrossRef] [PubMed]
- Ministerio de Sanidad, Consumo y Bienestar Social. Portal Estadístico Del SNS. Available online: https://www.sanidad.gob.es/estadEstudios/sanidadDatos/home.htm (accessed on 28 December 2021).
- Ministerio De Sanidad Consumo Y Bienestar Social. Encuesta Nacional de Salud 2017 ENSE 2017 Metodología; Ministerio de Sanidad: Madrid, Spain, 2017; 64p.
- Ministerio-Sanidad. Encuesta Nacional de Salud 2017, Cuestionario Del Adulto. In Encuesta Nacional de Salud 2017 Cuestionario De Adultos; Instituto Nacional de Estadística: Madrid, Spain, 2017; pp. 1–61. [Google Scholar]
- Nes, B.M.; Janszky, I.; Vatten, L.J.; Nilsen, T.I.L.; Aspenes, S.T.; WislØff, U. Estimating V·O2peak from a Nonexercise Prediction Model: The HUNT Study, Norway. Med. Sci. Sports Exerc. 2011, 43, 2024–2030. [Google Scholar] [CrossRef]
- Denche-Zamorano, Á.; Franco-García, J.M.; Carlos-Vivas, J.; Mendoza-Muñoz, M.; Pereira-Payo, D.; Pastor-Cisneros, R.; Merellano-Navarro, E.; Adsuar, J.C. Increased Risks of Mental Disorders: Youth with Inactive Physical Activity. Healthcare 2022, 10, 237. [Google Scholar] [CrossRef]
- Lee, D.K. Alternatives to P Value: Confidence Interval and Effect Size. Korean J. Anesthesiol. 2016, 69, 555–562. [Google Scholar] [CrossRef] [Green Version]
- Moreira, J.P.D.L.; de Moraes, J.R.; Luiz, R.R. Prevalencia de Hipertensión Arterial Sistémica Autorreferida En Los Ambientes Urbano y Rural de Brasil: Un Estudio de Base Poblacional. Cad. Saude Publica 2013, 29, 62–72. [Google Scholar] [CrossRef] [Green Version]
- Malo, S.; Rabanaque, M.J.; Orlando, V.; Limongelli, G.; Feja, C.; Aguilar-Palacio, I.; Lallana, M.J.; Russo, V.; Menditto, E. Prescribing Pattern of Antihypertensive Drugs in Two European Cohorts: A Population-Based Database Study. Expert Rev. Pharmacoecon. Outcomes Res. 2019, 19, 463–471. [Google Scholar] [CrossRef] [Green Version]
- Thoenes, M.; Neuberger, H.R.; Volpe, M.; Khan, B.V.; Kirch, W.; Böhm, M. Antihypertensive Drug Therapy and Blood Pressure Control in Men and Women: An International Perspective. J. Hum. Hypertens. 2010, 24, 336–344. [Google Scholar] [CrossRef] [Green Version]
- Abuful, A.; Gidron, Y.; Henkin, Y. Physicians’ Attitudes toward Preventive Therapy for Coronary Artery Disease: Is There a Gender Bias? Clin. Cardiol. 2005, 28, 389–393. [Google Scholar] [CrossRef]
- Holroyd-Leduc, J.M.; Kapral, M.K.; Austin, P.C.; Tu, J.V. Sex Differences and Similarities in the Management and Outcome of Stroke Patients. Stroke 2000, 31, 1833–1837. [Google Scholar] [CrossRef] [Green Version]
- Lloyd-Jones, D.M.; Evans, J.C.; Levy, D. Hypertension in Adults across the Age Spectrum: Current Outcomes and Control in the Community. JAMA 2005, 294, 466–472. [Google Scholar] [CrossRef] [Green Version]
- Kjeldsen, S.E.; Naditch-Brule, L.; Perlini, S.; Zidek, W.; Farsang, C. Increased Prevalence of Metabolic Syndrome in Uncontrolled Hypertension across Europe: The Global Cardiometabolic Risk Profile in Patients with Hypertension Disease Survey. J. Hypertens. 2008, 26, 2064–2070. [Google Scholar] [CrossRef]
- Noone, C.; Dwyer, C.P.; Murphy, J.; Newell, J.; Molloy, G.J. Comparative Effectiveness of Physical Activity Interventions and Anti-Hypertensive Pharmacological Interventions in Reducing Blood Pressure in People with Hypertension: Protocol for a Systematic Review and Network Meta-Analysis. Syst. Rev. 2018, 7, 128. [Google Scholar] [CrossRef]
- Cornelissen, V.A.; Smart, N.A. Exercise Training for Blood Pressure: A Systematic Review and Meta-Analysis. J. Am. Heart Assoc. 2013, 2, e004473. [Google Scholar] [CrossRef] [Green Version]
- Bakker, E.A.; Sui, X.; Brellenthin, A.G.; Lee, D.C. Physical Activity and Fitness for the Prevention of Hypertension. Curr. Opin. Cardiol. 2018, 33, 394–401. [Google Scholar] [CrossRef]
- Carlson, D.J.; Dieberg, G.; Hess, N.C.; Millar, P.J.; Smart, N.A. Isometric Exercise Training for Blood Pressure Management: A Systematic Review and Meta-Analysis. Mayo Clin. Proc. 2014, 89, 327–334. [Google Scholar] [CrossRef]
- Wen, H.; Wang, L. Reducing Effect of Aerobic Exercise on Blood Pressure of Essential Hypertensive Patients: A Meta-Analysis. Medicine 2017, 96, e6150. [Google Scholar] [CrossRef]
- Xiong, X.; Wang, P.; Li, S.; Zhang, Y.; Li, X. Effect of Baduanjin Exercise for Hypertension: A Systematic Review and Meta-Analysis of Randomized Controlled Trials. Maturitas 2015, 80, 370–378. [Google Scholar] [CrossRef]
- Corso, L.M.L.; Macdonald, H.V.; Johnson, B.T.; Farinatti, P.; Livingston, J.; Zaleski, A.L.; Blanchard, A.; Pescatello, L.S. Is Concurrent Training Efficacious Antihypertensive Therapy? A Meta-Analysis. Med. Sci. Sports Exerc. 2016, 48, 2398–2406. [Google Scholar] [CrossRef]
- Fagard, R.H.; Cornelissen, V.A. Effect of Exercise on Blood Pressure Control in Hypertensive Patients. Eur. J. Cardiovasc. Prev. Rehabil. 2007, 14, 12–17. [Google Scholar] [CrossRef] [PubMed]
- Casonatto, J.; Goessler, K.F.; Cornelissen, V.A.; Cardoso, J.R.; Polito, M.D. The Blood Pressure-Lowering Effect of a Single Bout of Resistance Exercise: A Systematic Review and Meta-Analysis of Randomised Controlled Trials. Eur. J. Prev. Cardiol. 2016, 23, 1700–1714. [Google Scholar] [CrossRef] [PubMed]
- Conceição, L.S.R.; Neto, M.G.; do Amaral, M.A.S.; Martins-Filho, P.R.S.; Carvalho, V.O. Effect of Dance Therapy on Blood Pressure and Exercise Capacity of Individuals with Hypertension: A Systematic Review and Meta-Analysis. Int. J. Cardiol. 2016, 220, 553–557. [Google Scholar] [CrossRef] [PubMed]
- Cornelissen, V.A.; Fagard, R.H.; Coeckelberghs, E.; Vanhees, L. Impact of Resistance Training on Blood Pressure and Other Cardiovascular Risk Factors: A Meta-Analysis of Randomized, Controlled Trials. Hypertension 2011, 58, 950–958. [Google Scholar] [CrossRef]
- Dickinson, H.O.; Mason, J.M.; Nicolson, D.J.; Campbell, F.; Beyer, F.R.; Cook, J.V.; Williams, B.; Ford, G.A. Lifestyle Interventions to Reduce Raised Blood Pressure: A Systematic Review of Randomized Controlled Trials. J. Hypertens. 2006, 24, 215–223. [Google Scholar] [CrossRef]
- MacDonald, H.V.; Johnson, B.T.; Huedo-Medina, T.B.; Livingston, J.; Forsyth, K.C.; Kraemer, W.J.; Farinatti, P.T.V.; Pescatello, L.S. Dynamic Resistance Training as Stand-Alone Antihypertensive Lifestyle Therapy: A Meta-Analysis. J. Am. Heart Assoc. 2016, 5, e003231. [Google Scholar] [CrossRef] [Green Version]
- Murtagh, E.M.; Nichols, L.; Mohammed, M.A.; Holder, R.; Nevill, A.M.; Murphy, M.H. The Effect of Walking on Risk Factors for Cardiovascular Disease: An Updated Systematic Review and Meta-Analysis of Randomised Control Trials. Prev. Med. 2015, 72, 34–43. [Google Scholar] [CrossRef] [Green Version]
- Park, S.H.; Han, K.S. Blood Pressure Response to Meditation and Yoga: A Systematic Review and Meta-Analysis. J. Altern. Complement. Med. 2017, 23, 685–695. [Google Scholar] [CrossRef]
- Huai, P.; Xun, H.; Reilly, K.H.; Wang, Y.; Ma, W.; Xi, B. Physical Activity and Risk of Hypertension: A Meta-Analysis of Prospective Cohort Studies. Hypertension 2013, 62, 1021–1026. [Google Scholar] [CrossRef]
- Liu, X.; Zhang, D.; Liu, Y.; Sun, X.; Han, C.; Wang, B.; Ren, Y.; Zhou, J.; Zhao, Y.; Shi, Y.; et al. Dose-Response Association Between Physical Activity and Incident Hypertension: A Systematic Review and Meta-Analysis of Cohort Studies. Hypertension 2017, 69, 813–820. [Google Scholar] [CrossRef]
- Williams, P.T.; Thompson, P.D. Walking versus Running for Hypertension, Cholesterol, and Diabetes Mellitus Risk Reduction. Arterioscler. Thromb. Vasc. Biol. 2013, 33, 1085–1091. [Google Scholar] [CrossRef] [Green Version]
- Wang, Y.; Wang, Q.J. The Prevalence of Prehypertension and Hypertension among US Adults According to the New Joint National Committee Guidelines: New Challenges of the Old Problem. Arch. Intern. Med. 2004, 164, 2126–2134. [Google Scholar] [CrossRef] [Green Version]
- Thompson, P.D.; Crouse, S.F.; Goodpaster, B.; Kelley, D.; Moyna, N.; Pescatello, L. The Acute versus the Chronic Response to Exercise. Med. Sci. Sports Exerc. 2001, 33, 438–445. [Google Scholar] [CrossRef]
- Padilla, J.; Wallace, J.P.; Park, S. Accumulation of Physical Activity Reduces Blood Pressure in Pre- and Hypertension. Med. Sci. Sports Exerc. 2005, 37, 1264–1275. [Google Scholar] [CrossRef]
- Kokkinos, P. Cardiorespiratory Fitness, Exercise, and Blood Pressure. Hypertension 2014, 64, 1160–1164. [Google Scholar] [CrossRef]
- Chase, N.L.; Sui, X.; Lee, D.C.; Blair, S.N. The Association of Cardiorespiratory Fitness and Physical Activity with Incidence of Hypertension in Men. Am. J. Hypertens. 2009, 22, 417–424. [Google Scholar] [CrossRef]
- Sui, X.; Sarzynski, M.A.; Lee, D.C.; Kokkinos, P.F. Impact of Changes in Cardiorespiratory Fitness on Hypertension, Dyslipidemia and Survival: An Overview of the Epidemiological Evidence. Prog. Cardiovasc. Dis. 2017, 60, 56–66. [Google Scholar] [CrossRef]
- Kokkinos, P.F.; Andreas, P.E.; Coutoulakis, E.; Colleran, J.A.; Narayan, P.; Dotson, C.O.; Choucair, W.; Farmer, C.; Fernhall, B. Determinants of Exercise Blood Pressure Response in Normotensive and Hypertensive Women: Role of Cardiorespiratory Fitness. J. Cardiopulm. Rehabil. 2002, 22, 178–183. [Google Scholar] [CrossRef]
- Carnethon, M.R.; Gidding, S.S.; Nehgme, R.; Sidney, S.; Jacobs, D.R.; Liu, K. Cardiorespiratory Fitness in Young Adulthood and the Development of Cardiovascular Disease Risk Factors. JAMA 2003, 290, 3092–3100. [Google Scholar] [CrossRef] [Green Version]
- De Moraes, A.C.F.; Carvalho, H.B.; Siani, A.; Barba, G.; Veidebaum, T.; Tornaritis, M.; Molnar, D.; Ahrens, W.; Wirsik, N.; De Henauw, S.; et al. Incidence of high blood pressure in children—Effects of physical activity and sedentary behaviors: The IDEFICS study: High blood pressure, lifestyle and children. Int. J. Cardiol. 2015, 180, 165–170. [Google Scholar] [CrossRef]
- Köchli, S.; Endes, K.; Steiner, R.; Engler, L.; Infanger, D.; Schmidt-Trucksäss, A.; Zahner, L.; Hanssen, H. Obesity, High Blood Pressure, and Physical Activity Determine Vascular Phenotype in Young Children: The EXAMIN YOUTH Study. Hypertension 2019, 73, 153–161. [Google Scholar] [CrossRef] [PubMed]
- NICEH Overview|Hypertension in Adults: Diagnosis and Management|Guidance|NICE. Available online: https://www.nice.org.uk/guidance/ng136 (accessed on 14 May 2022).
- Williams, B.; Mancia, G.; Spiering, W.; Rosei, E.A.; Azizi, M.; Burnier, M.; Clement, D.L.; Coca, A.; De Simone, G.; Dominiczak, A.; et al. 2018 ESC/ESH Guidelines for the Management of Arterial Hypertension. Eur. Heart J. 2018, 39, 3021–3104. [Google Scholar] [CrossRef] [PubMed]
- Rahimi, K.; Bidel, Z.; Nazarzadeh, M.; Copland, E.; Canoy, D.; Wamil, M.; Majert, J.; McManus, R.; Adler, A.; Agodoa, L.; et al. Age-Stratified and Blood-Pressure-Stratified Effects of Blood-Pressure-Lowering Pharmacotherapy for the Prevention of Cardiovascular Disease and Death: An Individual Participant-Level Data Meta-Analysis. Lancet 2021, 398, 1053–1064. [Google Scholar] [CrossRef]


| Variables | Description |
|---|---|
| Sex | Male or female |
| Body mass index (BMI) groups | Grouped as underweight (<18.5 kg/m2), normal weight (18.5 to 24.9 kg/m2), overweight (25 to 29.9 kg/m2), obese (≥30 kg/m2). |
| Hypertension status | Extracted item Q.25a.1 “Do you suffer, or have you ever suffered from hypertension?”. Answer: “Yes”, “No”, “I don’t know” or “Don’t answer”. |
| Age groups | The participants were grouped in the following age ranges: Young (15–34 years), Young adults (35–49 years), Older adults (50–64 years) and Older (65–69 years). |
| Use of antihypertensive drugs | Obtained from answers to items Q.85 “During the past 2 weeks, have you taken any drugs prescribed to you by a doctor?” Answer: “Yes” or “No”; and Q.87a.12 “In the following, I will read you a list of types of drugs, please tell which one(s) you have taken in the last 2 weeks, and which ones have been prescribed to you by the doctor: Blood pressure medicines?” Answers: “Yes”, “No”, “I don’t know” or “Don’t answer”. Participants were grouped into: Yes (who answered “yes” to items Q.85 and Q.85a.12) or No (who answered “no” to item Q.85, and who answered “yes” to item Q.85 and “no” to item Q.87a.12. |
| Physical activity level (PAL) | This variable grouped the participants according to the PA reported in the SNHS2017. For this purpose, a PA index (PAI) was created with the answers given to items Q.113–Q.117 (Q.113 “First of all, think about the intense activities you have done in the last 7 days. Intense activities are those that require a lot of physical exertion and make you breathe much harder than normal, such as heavy lifting, digging, aerobic exercise or fast cycling. Think only of those that you did for at least 10 min at a time.”—“Days per week of Vigorous PA”; Q.114 “Average duration of Vigorous PA performed in a week”; Q.115 “Now please think of all those moderate activities you have done in the last 7 days. Moderate activities are those that require moderate physical exertion that makes you breathe a little harder than normal, such as carrying light weights, cycling at regular speed or playing doubles tennis. Think only of those you did for at least 10 min at a time.”—“Days per week of Moderate PA”; Q.116 “Average duration of Moderate PA performed in a week” and Q.117 “Days in a week that they walk, less than 10 min in a row”), this PAI was described by previous studies [37,38]. The PAI could take values between 0 and 67.5, the groups were as follows: Inactive (PAI = 0 and Q.117 = 0); Walkers (PAI = 0 and Q.117 > 0); Active (PAI between 1 and 30) and Very Active (PAI > 30). |
| Characteristic | Hypertension | No Hypertension | χ2 | df | p | ES | ||
|---|---|---|---|---|---|---|---|---|
| Overall | 3228 | (18.2%) | 14,468 | (81.8%) | n.a. | n.a. | n.a. | n.a. |
| Sex | φ | |||||||
| Men | 1713 | (20.2%) a | 6762 | (79.8%) | 42.4 | 1 | <0.001 | 0.049 |
| Women | 1515 | (16.4%) b | 7706 | (83.6%) | ||||
| Age (years) | χ2 | df | p | V | ||||
| 15–34 | 103 | (2.7%) a | 3764 | (97.3%) | 2436.0 | 3 | <0.001 | 0.371 |
| 35–49 | 569 | (9.2%) b | 5600 | (90.8%) | ||||
| 50–64 | 1744 | (29.3%) c | 4207 | (70.7%) | ||||
| 65–69 | 812 | (47.5%) d | 897 | (52.5%) | ||||
| BMI (kg/m2) | χ2 | df | p | V | ||||
| <18.5 | 13 | (3.1%) a | 401 | (96.9%) | 1390.8 | 3 | <0.001 | 0.284 |
| [18.5–25) | 664 | (8.6%) b | 7092 | (91.4%) | ||||
| [25–30) | 1340 | (21.6%) c | 4850 | (78.4%) | ||||
| ≥30 | 1094 | (38.5%) d | 1746 | (61.5%) | ||||
| PAL | χ2 | df | p | V | ||||
| Inactive | 538 | (21.2%) a | 1994 | (78.8%) | 285.4 | 3 | <0.001 | 0.127 |
| Walkers | 1808 | (22.4%) a | 6250 | (77.6%) | ||||
| Active | 661 | (13.5%) b | 4226 | (86.5%) | ||||
| Very Active | 221 | (10.0%) c | 1998 | (90.0%) | ||||
| Characteristic | Antihypertensives | No-Antihypertensives | χ2 | df | p | ES | ||
|---|---|---|---|---|---|---|---|---|
| Overall | 2591 | (14.6%) | 15,104 | (85.4%) | n.a. | n.a. | n.a. | n.a. |
| Sex | φ | |||||||
| Men | 1400 a | (16.5%) | 7074 | (83.5%) | 45.9 | 1 | <0.001 | 0.051 |
| Women | 1191 b | (12.9%) | 8030 | (87.1%) | ||||
| Age (years) | χ2 | df | p | V | ||||
| 15–34 | 18 a | (0.5%) | 3849 | (99.5%) | 2831.3 | 3 | <0.001 | 0.400 |
| 35–49 | 322 b | (5.2%) | 5847 | (94.8%) | ||||
| 50–64 | 1479 c | (24.9%) | 4471 | (75.1%) | ||||
| 65–69 | 772 d | (45.2%) | 937 | (54.8%) | ||||
| BMI (kg/m2) | χ2 | df | p | V | ||||
| <18.5 | 8 a | (1.9%) | 406 | (98.1%) | 1334.8 | 3 | <0.001 | 0.279 |
| [18.5–25) | 458 b | (5.9%) | 7297 | (94.1%) | ||||
| [25–30) | 1099 c | (17.8%) | 5091 | (82.2%) | ||||
| ≥30 | 932 d | (32.8%) | 1908 | (67.2%) | ||||
| PAL | χ2 | df | p | V | ||||
| Inactive | 454 a | (17.9%) | 2078 | (82.1%) | 287.2 | 3 | <0.001 | 0.127 |
| Walkers | 1474 a | (18.3%) | 6583 | (81.7%) | ||||
| Active | 516 b | (10.6%) | 4371 | (89.4%) | ||||
| Very Active | 147 c | (6.6%) | 2072 | (93.4%) | ||||
| Physical Activity Levels | ||||||||||||
|---|---|---|---|---|---|---|---|---|---|---|---|---|
| Variables | Inactive | Walkers | Active | Very Active | ES | |||||||
| Sex | n (%) | n (%) | n (%) | n (%) | χ2 | df | p | φ | ||||
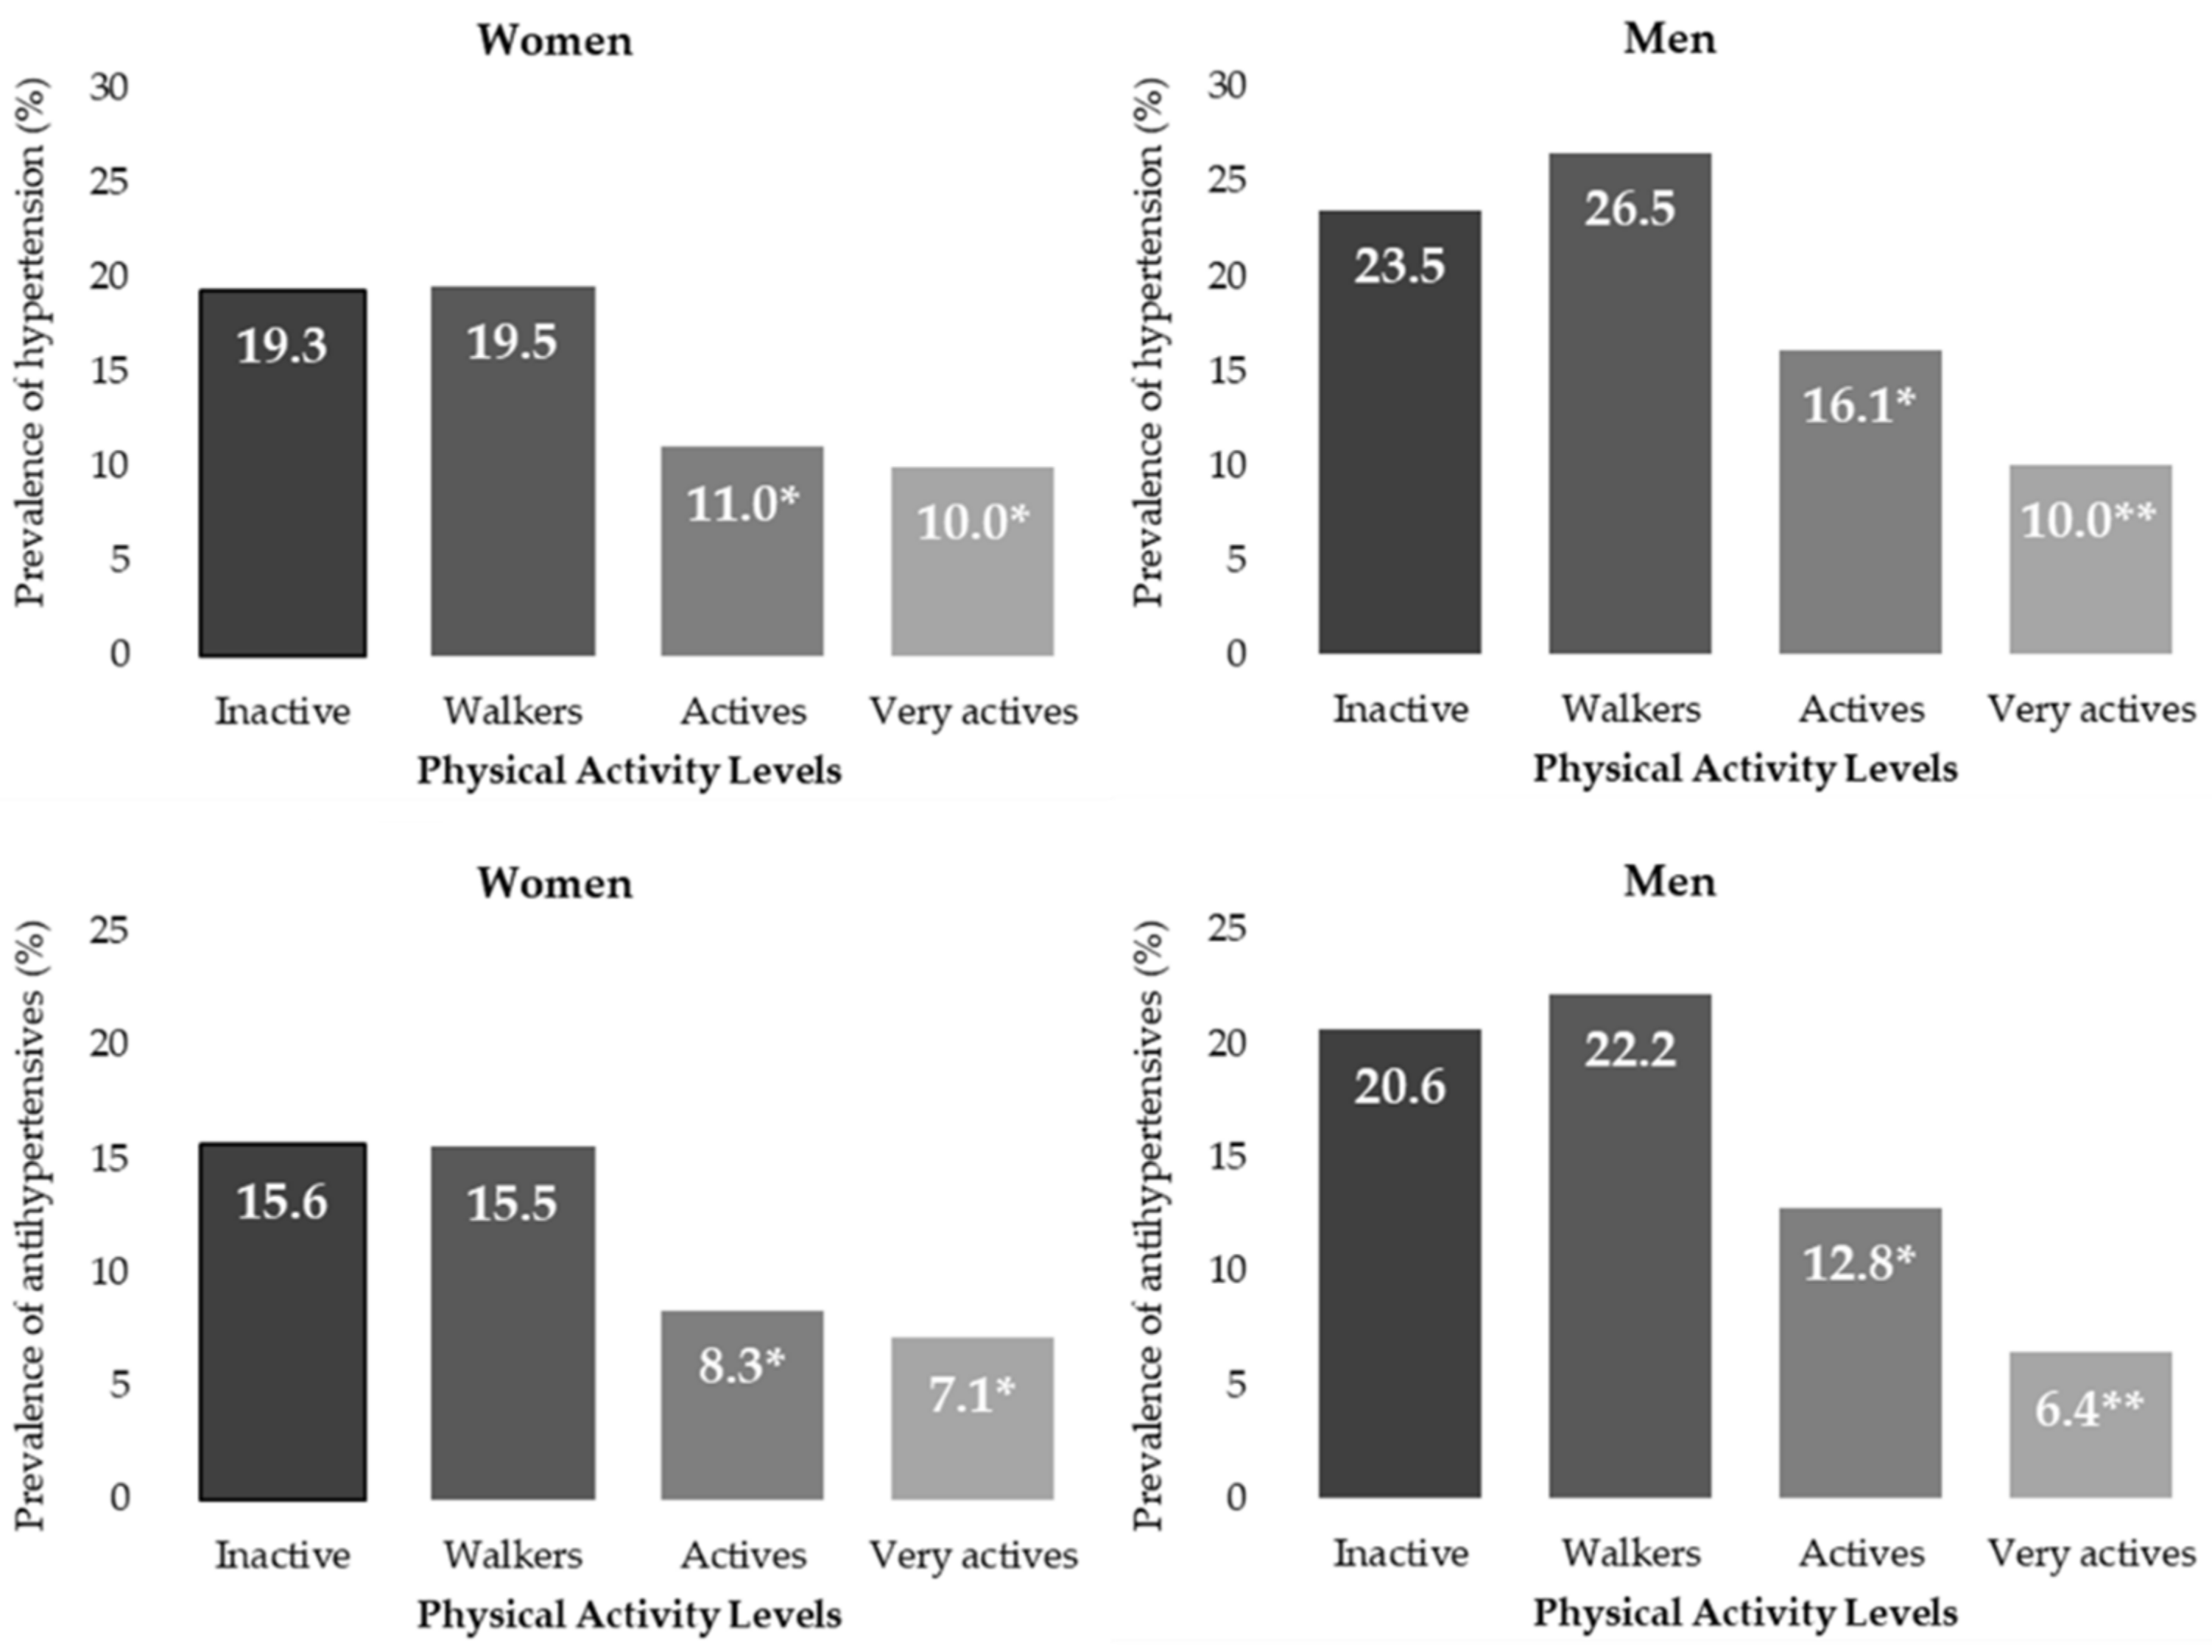
| Male | 276 a | 23.5% | 897 a | 26.5% | 395 b | 16.1% | 145 c | 10.0% | 212.2 | 3 | <0.001 | 0.158 |
| Female | 262 a | 19.3% | 911 a | 19.5% | 266 b | 11.0% | 76 b | 10.0% | 116.2 | 3 | <0.001 | 0.112 |
| Age (Years) | V | |||||||||||
| Young | 20 a | 4.2% | 42 a,b | 3.0% | 28 a,b | 2.3% | 13 b | 1.6% | 9.2 | 3 | 0.027 | 0.049 |
| Young adults | 97 a,b | 10.4% | 283 b | 11.1% | 139 a,c | 7.5% | 50 c | 6.1% | 27.9 | 3 | <0.001 | 0.067 |
| Older adults | 289 a | 33.0% | 996 a | 31.9% | 334 b | 23.2% | 125 b | 24.3% | 47.8 | 3 | <0.001 | 0.090 |
| Older | 132 a | 53.2% | 487 a | 49.1% | 160 b | 41.1% | 33 a,b | 41.3% | 11.9 | 3 | 0.008 | 0.083 |
| BMI (kg/m2) | V | |||||||||||
| <18.5 | 3 a | 5.1% | 4 a | 2.1% | 2 a | 1.7% | 4 a | 8.5% | 6.7 | 3 | 0.083 | 0.127 |
| [18.5–25) | 85 a | 9.4% | 367 a | 11.6% | 163 b | 6.5% | 49 c | 4.1% | 80.5 | 3 | <0.001 | 0.102 |
| [25–30) | 173 a | 20.4% | 750 b | 25.7% | 306 a,c | 18.3% | 111 c | 14.8% | 61.8 | 3 | <0.001 | 0.100 |
| ≥30 | 238 a,b | 39.9% | 625 b | 41.3% | 178 a,c | 33.5% | 53 c | 26.5% | 23.3 | 3 | <0.001 | 0.091 |
| Physical Activity Levels | ||||||||||||
|---|---|---|---|---|---|---|---|---|---|---|---|---|
| Variables | Inactive | Walkers | Active | Very Active | ES | |||||||
| Sex | n (%) | n (%) | n (%) | n (%) | χ2 | df | p | φ | ||||
| Male | 242 a | 20.6% | 751 a | 22.2% | 314 b | 12.8% | 93 c | 6.4% | 226.9 | 3 | <0.001 | 0.164 |
| Female | 212 a | 15.6% | 723 a | 15.5% | 202 b | 8.3% | 54 b | 7.1% | 104.5 | 3 | <0.001 | 0.106 |
| Age (Years) | V | |||||||||||
| Young | 6 a | 1.3% | 9 a,b | 0.7% | 1 b | 0.1% | 2 a,b | 0.2% | 12.3 | 3 | 0.007 | 0.056 |
| Young adults | 66 a | 7.1% | 158 a | 6.2% | 79 b | 4.3% | 19 b | 2.3% | 28.5 | 3 | <0.001 | 0.068 |
| Older adults | 259 a | 29.5% | 838 a | 26.9% | 288 b | 20.0% | 94 b | 18.3% | 46.9 | 3 | <0.001 | 0.089 |
| Older | 123 a | 49.6% | 469 a | 47.3% | 148 b | 38.0% | 32 a,b | 40.0% | 12.6 | 3 | 0.006 | 0.086 |
| BMI (kg/m2) | V | |||||||||||
| <18.5 | 2 a | 3.4% | 4 a | 2.1% | 0 a | 0.0% | 2 a | 4.3% | 4.3 | 3 | 0.228 | 0.102 |
| [18.5–25) | 75 a | 8.3% | 258 a | 8.1% | 106 b | 4.3% | 19 c | 1.6% | 89.7 | 3 | <0.001 | 0.108 |
| [25–30) | 142 a | 16.7% | 629 b | 21.6% | 251 a | 15.0% | 77 c | 10.2% | 67.7 | 3 | <0.001 | 0.105 |
| ≥30 | 201 a,b | 33.7% | 533 b | 35.3% | 152 a,c | 28.6% | 46 c | 23.0% | 17.2 | 3 | 0.001 | 0.078 |
| Physical Activity Levels | ||||||||||
|---|---|---|---|---|---|---|---|---|---|---|
| Inactive | Walkers | Active | Very Active | |||||||
| Variables | OR | CI95% | OR | CI95% | OR | CI95% | ||||
| Overall | Ref. | 1.07 | 0.96 | 1.20 | 0.58 * | 0.51 | 0.66 | 0.41 * | 0.35 | 0.49 |
| Sex | ||||||||||
| Male | Ref. | 1.17 * | 1.00 | 1.37 | 0.62 * | 0.52 | 0.74 | 0.36 * | 0.29 | 0.45 |
| Female | Ref. | 1.01 | 0.87 | 1.18 | 0.51 * | 0.43 | 0.62 | 0.46 * | 0.35 | 0.61 |
| Age Group | ||||||||||
| Young | Ref. | 0.71 | 0.41 | 1.22 | 0.54 * | 0.30 | 0.96 | 0.37 * | 0.18 | 0.76 |
| Young adults | Ref. | 1.07 | 0.84 | 1.37 | 0.70 * | 0.53 | 0.92 | 0.56 * | 0.39 | 0.80 |
| Older adults | Ref. | 0.95 | 0.81 | 1.12 | 0.61 * | 0.51 | 0.74 | 0.65 * | 0.51 | 0.84 |
| Older | Ref. | 0.85 | 0.64 | 1.12 | 0.61 * | 0.45 | 0.85 | 0.62 | 0.37 | 1.03 |
| BMI | ||||||||||
| <18.5 | Ref. | 0.40 | 0.09 | 1.84 | 0.32 | 0.05 | 2.00 | 1.74 | 0.37 | 8.17 |
| [18.5–25) | Ref. | 1.26 | 0.98 | 1.62 | 0.67 * | 0.51 | 0.89 | 0.41 * | 0.29 | 0.59 |
| [25–30) | Ref. | 1.36 * | 1.13 | 1.63 | 0.88 | 0.71 | 1.08 | 0.68 * | 0.52 | 0.88 |
| ≥30 | Ref. | 1.06 | 0.88 | 1.29 | 0.76 * | 0.60 | 0.97 | 0.54 * | 0.38 | 0.78 |
| Physical Activity Levels | ||||||||||
|---|---|---|---|---|---|---|---|---|---|---|
| Inactive | Walkers | Active | Very Active | |||||||
| Variables | OR | CI95% | OR | CI95% | OR | CI95% | ||||
| Overall | Ref. | 1.02 | 0.91 | 1.15 | 0.54 * | 0.47 | 0.62 | 0.32 * | 0.27 | 0.39 |
| Sex | ||||||||||
| Male | Ref. | 1.10 | 0.93 | 1.29 | 0.56 * | 0.47 | 0.68 | 0.26 * | 0.20 | 0.34 |
| Female | Ref. | 0.99 | 0.84 | 1.17 | 0.49 * | 0.40 | 0.60 | 0.41 * | 0.30 | 0.56 |
| Age Group | ||||||||||
| Young | Ref. | 0.51 | 0.18 | 1.44 | 0.06 * | 0.01 | 0.54 | 0.19 * | 0.04 | 0.97 |
| Young adults | Ref. | 0.87 | 0.64 | 1.17 | 0.59 * | 0.42 | 0.82 | 0.31 * | 0.19 | 0.52 |
| Older adults | Ref. | 0.88 | 0.74 | 1.03 | 0.60 * | 0.49 | 0.73 | 0.53 * | 0.41 | 0.70 |
| Older | Ref. | 0.91 | 0.69 | 1.20 | 0.62 * | 0.45 | 0.86 | 0.68 | 0.41 | 1.13 |
| BMI | ||||||||||
| <18.5 | Ref. | 0.61 | 0.11 | 3.42 | 0.00 | n.a. | n.a. | 1.27 | 0.17 | 9.35 |
| [18.5–25) | Ref. | 0.98 | 0.75 | 1.28 | 0.49 * | 0.36 | 0.67 | 0.18 * | 0.11 | 0.30 |
| [25–30) | Ref. | 1.37 | 1.12 | 1.68 | 0.88 | 0.70 | 1.10 | 0.57 * | 0.42 | 0.77 |
| ≥30 | Ref. | 1.07 | 0.88 | 1.31 | 0.79 | 0.61 | 1.02 | 0.59 * | 0.41 | 0.85 |
| Hypertension | ||||||||
|---|---|---|---|---|---|---|---|---|
| B | S.E. | Wald | df | Sig. | Exp(B) | 95% C.I. for EXP(B) | ||
| Lower | Upper | |||||||
| Inactive | 33.997 | 3 | 0.000 | |||||
| Walker | 0.053 | 0.065 | 0.683 | 1 | 0.408 | 1.055 | 0.929 | 1.198 |
| Active | −0.225 | 0.074 | 9.291 | 1 | 0.002 | 0.799 | 0.691 | 0.923 |
| Very Active | −0.278 | 0.097 | 8.170 | 1 | 0.004 | 0.757 | 0.626 | 0.916 |
| Sex (Men) | 0.214 | 0.046 | 21.901 | 1 | 0.000 | 1.238 | 1.132 | 1.354 |
| Obesity | 645.762 | 3 | 0.000 | |||||
| Underweight | −2.203 | 0.295 | 55.726 | 1 | 0.000 | 0.110 | 0.062 | 0.197 |
| Normal | −1.526 | 0.061 | 620.344 | 1 | 0.000 | 0.217 | 0.193 | 0.245 |
| Overweight | −0.836 | 0.055 | 234.338 | 1 | 0.000 | 0.433 | 0.389 | 0.482 |
| Age | 0.084 | 0.002 | 1500.781 | 1 | 0.000 | 1.088 | 1.083 | 1.093 |
| Constant | −4.945 | 0.135 | 1332.626 | 1 | 0.000 | 0.007 | ||
| Use of antihypertensives | ||||||||
| B | S.E. | Wald | df | Sig. | Exp(B) | 95% C.I. for EXP(B) | ||
| Lower | Upper | |||||||
| Inactive | 31.586 | 3 | 0.000 | |||||
| Walker | −0.040 | 0.072 | 0.310 | 1 | 0.578 | 0.961 | 0.835 | 1.106 |
| Active | −0.284 | 0.083 | 11.864 | 1 | 0.001 | 0.752 | 0.640 | 0.885 |
| Very Active | −0.469 | 0.115 | 16.672 | 1 | 0.000 | 0.626 | 0.500 | 0.784 |
| Sex (Men) | 0.283 | 0.051 | 30.671 | 1 | 0.000 | 1.327 | 1.201 | 1.467 |
| Obesity | 585.659 | 3 | 0.000 | |||||
| Underweight | −2.396 | 0.374 | 41.065 | 1 | 0.000 | 0.091 | 0.044 | 0.189 |
| Normal | −1.657 | 0.070 | 562.107 | 1 | 0.000 | 0.191 | 0.166 | 0.219 |
| Overweight | −0.862 | 0.060 | 208.648 | 1 | 0.000 | 0.422 | 0.376 | 0.475 |
| Age | 0.114 | 0.003 | 1645.744 | 1 | 0.000 | 1.120 | 1.114 | 1.126 |
| Constant | −6.830 | 0.173 | 1559.094 | 1 | 0.000 | 0.001 | ||
Publisher’s Note: MDPI stays neutral with regard to jurisdictional claims in published maps and institutional affiliations. |
© 2022 by the authors. Licensee MDPI, Basel, Switzerland. This article is an open access article distributed under the terms and conditions of the Creative Commons Attribution (CC BY) license (https://creativecommons.org/licenses/by/4.0/).
Share and Cite
Denche-Zamorano, Á.; Pérez-Gómez, J.; Mendoza-Muñoz, M.; Carlos-Vivas, J.; Oliveira, R.; Brito, J.P. Risk of Hypertension and Use of Antihypertensive Drugs in the Physically Active Population under-70 Years Old—Spanish Health Survey. Healthcare 2022, 10, 1283. https://doi.org/10.3390/healthcare10071283
Denche-Zamorano Á, Pérez-Gómez J, Mendoza-Muñoz M, Carlos-Vivas J, Oliveira R, Brito JP. Risk of Hypertension and Use of Antihypertensive Drugs in the Physically Active Population under-70 Years Old—Spanish Health Survey. Healthcare. 2022; 10(7):1283. https://doi.org/10.3390/healthcare10071283
Chicago/Turabian StyleDenche-Zamorano, Ángel, Jorge Pérez-Gómez, Maria Mendoza-Muñoz, Jorge Carlos-Vivas, Rafael Oliveira, and João Paulo Brito. 2022. "Risk of Hypertension and Use of Antihypertensive Drugs in the Physically Active Population under-70 Years Old—Spanish Health Survey" Healthcare 10, no. 7: 1283. https://doi.org/10.3390/healthcare10071283