Abstract
The objectives of this review were to identify the population groups most frequently studied, to determine the methods and techniques most commonly used to show health inequities, and to identify the most frequent socioeconomic and health indicators used in the studies on health inequities due to socioeconomic inequalities that have been carried out on the Spanish healthcare system. A scoping review was carried out of the studies conducted in the Spanish State and published in literature since 2004, after the publication of the Law of Cohesion and Quality of the National Health System. The PRISMA extension for scoping reviews was followed. The methodological quality of the studies was assessed using the critical reading guides of the Joanna Briggs Institute and an adaptation of the STROBE guide for ecological studies. A total of 58 articles out of 811 articles were included. Most of the articles were (77.59%, n = 45) cross-sectional studies, followed by ecological studies (13.8%, n = 8). The population group used was uneven, while the main geographical area under investigation was the whole state (51.7%, n = 30) compared to other territorial distributions (48.3%, n = 28). The studies used a multitude of health and socioeconomic indicators, highlighting self-perception of health (31.03%, n = 19) and social class (50%, n = 29). The relationship between better health and better socioeconomic status is evident. However, there is variability in the populations, methods, and indicators used to study health equity in Spain. Future health research and policies require greater systematization by public institutions and greater cooperation among researchers from disciplines such as sociology, economics, and health.
1. Introduction
Inequality in health is a reality throughout the world, which has reached alarming gradients in certain parts of the globe. However, in Europe, where most countries have health systems that, in general, can be considered to be universal, there are also health inequities perpetuated over time despite increased quality of life [1,2]. In such national health systems, financing comes from the general budgets of the States and the States supervise the provision of services, so that all citizens have access without distinction to all the services offered, without added payments.
In this situation, social class is one of the most important social distribution systems since its multiple aspects comprehensively affect all aspects of society. With regard to Marxist origins, Marx himself did not create a systematic definition of the term social class, originating multiple debates throughout history. However, Marx identified social class depending on the place occupied with respect to the means of production, divided between the bourgeoisie and the proletariat, although he also included the petty bourgeoisie or the lumpenproletariat (a group of socially marginalized people, sometimes performing illegal work or not contributing anything socially) [3]. Other authors have developed exhaustive studies and definitions of social class, and have attemped to update this concept from a relational perspective, incorporating differentiators such as control over monetary capital, the physical means of production, or the labor force based on supervision and discipline. Thus, Wright proposed a map with twelve class positions, with their contradictions and complex exploitations, and differentiated the twelve types based on those who own and those who are salaried, and then among the different levels of existing hierarchies, which made the map more operational [4]. For his part, Bordieu [5] explained that social class could be defined by the structure of the relationships among different properties, with each property granted its own value according to the effects it exerts on the others.
In this labyrinth of definitions, the British Register General has attempted to synthesize the concept to give it practicality by drawing up a social classification of six steps according to occupation, as follows: (I) professionals and managers; (II) intermediate charges; (IIIa) non-manual workers; (IIIb) skilled manual workers; (IV) semi-skilled manual workers; (V) unskilled manual workers. Likewise, this classification has been used in previous studies on social inequalities and health inequities [6,7] and presents sufficient validity for the present study.
At the end of the 20th century, researchers became interested in social inequalities and the consolidation of the different universal health systems in Europe. In 1980, a group of English researchers published the book Health Inequalities, later known as the “Black Report” due to the name of its main researcher [8]. As McIntosh [8] related, in this study, an attempt was made to make visible, among many other things, that even in health systems with universal coverage, clear health inequalities have been observed and, as they argued, have been due to class inequities. This research has initiated interest in health inequalities among modern researchers, serving as the basis for the design of new studies on health inequities. Other international actors have joined in and have periodically conducted their own research on this subject, including the World Bank and the World Health Organization [9].
Over the years, different types of health inequality studies have emerged, each focused on a cause and consequences, or the relationship between them, and various analytical methods have been used, leading to the development of disparate theories. Thus, Mackenbach [10] synthesized these investigations into nine theories according to the possible causes and consequences. The author based part of his analysis on the paradox that with clear improvements in the different states of well-being there is an increase in health inequities in countries with high incomes. Some of these theories include those described by Marmot [11] and Wilkinson (cited by [8]) in which they relate inequality to psychosocial stress derived from deprivation for socioeconomic reasons, arguing with data the different exposures to this stress. Likewise, Batty [12] and Mackenbach [13] related socioeconomic position to personality and cognitive development, considering that they also affect health largely reducing the external factors to the individual in the inequities, quite contrary to the other theories. In contrast, Lynch and Davey Smith, cited by Mackenbach [10], focused on health inequality due to material deprivation of people, which results in unequal exposure to different life experiences.
Specifically, Spain has had a national health system since 1986, which is characterized by universal coverage, public financing, and quality benefits in a decentralized system in autonomous communities [14]. In 2003, the Law on Cohesion and Quality of the National Health System [15] was promulgated to guarantee citizen participation, as well as quality and equity of care in the national territory. In 2008, the Commission for the Reduction of Social Inequalities in Health was established. This Commission proposed 166 recommendations, divided into 14 areas, and declared the need for a commitment to promote health and equity in all policies and to move towards a fairer society [16]. The Spanish national health system is considered to be one of the best health systems in the world based on analyses of global data [17,18], but differences in outcome indicators have been observed when data from autonomous communities are compared [19,20]. In addition, some studies have tried to synthesize the literature on health inequities [21], but from broader perspectives and considering, in addition to social class, determinants such as gender, age, or the type of territory, as they can have a multiplying effect on health inequities [16]. Therefore, the objectives of this review were to identify the population groups most frequently studied, to determine the most commonly used methods and techniques to show health inequities, and to identify the most frequent socioeconomic and health indicators used in studies on health inequities due to socioeconomic inequalities that have been carried out in the Spanish State since the publication of the Law of Cohesion and Quality of the National Health System.
2. Materials and Methods
2.1. Design
A scoping review was carried out following the methodological framework proposed by Arksey and O’Malley [22] and Levac et al. [23], in which a review process was carried out divided into the following five stages: (i) identifying the research question; (ii) identifying relevant studies; (iii) selecting studies; (iv) charting the data; (v) collating, summarizing, and reporting the results. Likewise, we followed the recommendations of the “Preferred Reporting Items for Systematic Reviews and Meta-analysis extension for Scoping Review (PRISMA-ScR)” [24].
2.2. Phase I: Identifying the Research Question
One of the purposes of a scoping review is to explore the variety of material available on a specific research topic [22]. Therefore, it was considered to be an adequate method to address the following research question: What types of inequity, populations, methods, and indicators have been used in the research on health inequalities due to socioeconomic causes, which has been carried out in Spain since the publication of the Law on Health Cohesion and Quality of the National Health System?
2.3. Phase II: Identifying Relevant Studies
The bibliographic search was carried out in pairs in the electronic databases PubMed, Web Of Science (WOS), and Scopus. Similarly, the investigation was completed in the following three virtual libraries: Cochrane Library, Scientific Electronic Library Online (SciELO), and the Virtual Health Library (BVSalud). The databases and virtual libraries were chosen for their international recognition and broad multidisciplinary coverage, with the intention of recovering articles relevant to the topic of the review. A search strategy was established by combining keywords extracted from the structured vocabularies Descriptors in Health Sciences (DeCS) and Medical Subject Headings (MeSH), as well as natural language. Table 1 shows the general strategy used for the different bibliographic databases, with the necessary adaptations.

Table 1.
General outline of the search strategy.
Two reviewers (G.B.P. and J.P.S.) were confirmed to have the same results after searching each database. The search strategy was applied to each database chosen according to the possibilities they offered, trying to maintain homogeneity. In addition, the snowball technique was used in the bibliographic reference lists of the articles included in the review to identify articles that had escaped the search strategy.
2.4. Phase III: Study Selection
All studies with data collected from 2004 and up to the time of the bibliographic search (14 March 2023), whose field of research was Spain and which were written in Spanish, Catalan, and English, were included. The design types included were descriptive observational studies, including ecological and cross-sectional studies, and analytical observational studies, such as case-control and cohort studies. The publication of the Law on Cohesion and Quality of the National Health System [15] was considered to be a starting point, which tried to modernize, expand, and consolidate the health rights already developed in the General Health Law [14], establishing social participation, quality, and equity as common rights to all citizens. Articles that did not fall within the objectives set out in the review and those that did not have a research article format, such as letters to the editor, editorials, thematic updates, or similar, were excluded.
The studies to be included in the review were selected in pairs following the selection criteria previously described. First, each reviewer (G.B.P. and J.P.S.) independently read the title and abstract of each article to make a first selection. Second, each reviewer independently performed a full reading of the selected papers to confirm if they met the selection criteria and to perform a critical appraisal of the methodological quality of the studies. For this, the critical reading guide for cross-sectional studies was used, as well as cohorts and control cases, proposed by the Joanna Briggs Institute [25]; the STROBE checklist adapted to ecological studies by Dufault and Klar [26] was also used. Two reviewers (G.B.P. and J.P.S.) classified the articles according to their methodological quality into three levels, i.e., good, average, or poor. Thus, it was necessary for the two reviewers (G.B.P. and J.P.S.) to assign, at least, the average category to the same article. The results of both reviewers were compared, and the research group discussed discrepancies until a consensus was reached. This procedure was established since the instruments used to assess methodological quality did not establish cut-off points to determine the level of methodological quality.
2.5. Phase IV: Charting the Data
Data extraction was performed by preparing a table that included information on the researchers involved in the study, the year, period, type of study, target population, health and socioeconomic indicators, main results, and methodological quality. Data extraction was carried out separately by the two researchers (G.B.P. and J.P.S.), who later compared the results and discussed them to ensure the uniformity and consistency of the data.
2.6. Phase V: Collating, Summarizing, and Reporting the Results
First, a descriptive analysis (frequencies and percentages) of the search results was carried out according to the year and type of publication, as well as the methodological quality. Then, the articles were descriptively analyzed according to the specific objectives of the review to determine the target populations and the most commonly used health and socioeconomic indicators. Specifically, health and socioeconomic indicators were grouped into 14 and 11 categories, respectively, due to the great variability among the articles included in the review.
3. Results
A total of 811 articles were retrieved and, among them, 278 articles were removed since they were duplicates. Figure 1 presents the review flowchart. A total of 1.5% (n = 12) of the articles were retrieved from the Virtual Health Library, 2.6% (n = 21) of the articles were retrieved from the Web Of Science, 8.4% (n = 68) of the articles were retrieved from the SciELO (Scientific Electronic Library Online), and 38.7% (n = 314) of the articles were retrieved from Pubmed; Scopus was the largest database, with 48.5% (n = 393) of the articles. Next, two researchers (G.B.P. and J.P.S.) collated the reports and excluded 34.3% of the articles (n = 278). Subsequently, the selection criteria were applied to the remaining 65.7% (n = 533) of the articles. Among these 533 articles, 20.3% (n = 108) of the articles were excluded for exceeding the proposed time limits. Another 23.6% (n = 126) of the articles were excluded for exceeding the Spanish geographic location, 1.3% (n = 7) of the articles were excluded for not using indicators, 1.9% (n = 10) of the articles were excluded due to the size of the population, 8.4% (n = 45) of the articles were excluded for having a format that was not relevant for their inclusion, and 44% (n = 235) of the articles were excluded for not being focused on the subject of study. Finally, after the exclusion process, there were a total of 64 (12%) articles that respected the proposed selection criteria. It is necessary to clarify that the gap produced between the percentages is because the same article could fail to meet different criteria simultaneously.
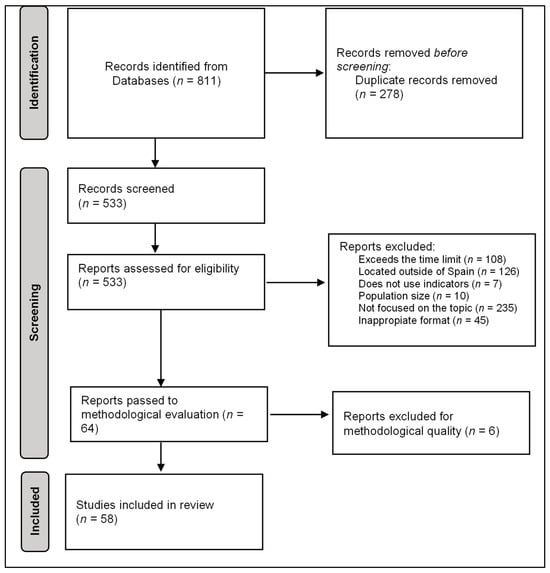
Figure 1.
Review flowchart.
In the last stage of the selection process, an evaluation of the methodological quality was carried out. For example, concerning the article by Abellán et al. [27], the scales used and the levels of studies evaluated were not standardized, regularly used, or comparable, including their income distribution, limiting the study to only dichotomous variables. In the case of Fernández-Martínez et al. [28], despite being an interesting article in some aspects, it was not adapted to the purpose of this review, and, among other reasons, we rejected it for using economic self-perception since it is too subjective an indicator. Following the corresponding checklists, 9.4% (n = 6) of the 64 articles included were excluded because they did not meet the minimum quality standards. Finally, 67.2% (n = 43) of the articles were assessed as having good methodological quality, and the remaining 23.4% (n = 15) of the articles as acceptable. Thus, a total of 58 studies were included in this scoping review.
A total of 77.6% (n = 45) of the included articles were cross-sectional studies, followed by ecological studies (13.8%, n = 8), cohort studies (5.2%, n = 3), case-control studies (1.7%, n = 1), and longitudinal studies (1.7%, n = 1). The time period was variable, including studies in which only a single moment, an annuity, or even up to four years of data were analyzed. In addition, variability was observed in the target population. Some studies focused on a specific population with certain diseases and on how some socioeconomic variables (education, social class, or place of residence) affected the course of the ailments (10.34%, n = 6). In other studies, specific population segments were used, such as children, the elderly, or young people (44.83%, n = 26), while the rest (n = 26, 44.83%) included the general population. Likewise, the geographical area was also not homogeneous, with 51.7% (n = 30) of the articles focusing on the entire Spanish State, while the remaining 48.3% (n = 28) of the articles used different geographical distributions, such as autonomous communities, provinces, cities, or even neighborhoods.
Table 2 shows information on the health and socioeconomic indicators. On the one hand, the health indicators related to chronic diseases or comorbidities (31.03%, n = 18), self-perception of health (32.76%, n = 19), behavioral factors or lifestyles (24.14%, n = 14), and mental health (24.14%, n = 14) were the most used categories. Health indicators related to unsatisfied health needs (3.45%, n = 2), life expectancy (3.45%, n = 2), and environmental pollutants (1.72%, n = 1) were the least used. On the other hand, socioeconomic indicators related to educational level (58.62%, n = 34), social class (50%, n = 29), income and purchasing power (36.21%, n = 21), and area of residence and urban planning (24.14%; n = 14) were the most used, while poverty was only present in one article (1.72%, n = 1).
Table 2.
List of health and socioeconomic indicators.
Table S1 in Supplementary Materials offers a complete list of references included in the review and the extraction of the information from the articles can be found in Table 3, including information on the authors, objective, design, study population, study period, health and socioeconomic indicators, results, and assessment of the methodological quality. Regarding the population, not previously mentioned, it was observed that the different researchers used data from primary sources, not having been collected by themselves. In addition, 36.2% (n = 21) of the articles used complete samples since they were obtained from official bodies that had all this information, while the remaining articles, i.e., 63.8% (n = 37), used projections from surveys or other sources of population data. Regarding the years used to extract the data, we identified three situations. A total of 20.69% (n = 12) of the studies were carried out prior to 2008, while 29.31% (n = 17) of the studies were carried out during the economic crisis, comparing before and after the recession. Finally, 50% (n = 27) of the studies considered the information after the crisis, due to the interest it aroused. In addition, all the articles’ analyses corroborated the existence of health inequalities, although with greater or lesser intensity and focusing on different aspects. Moreover, a complete list of references included in this review is available in the Supplementary Materials, Table S1.
Table 3.
Extraction of information.
4. Discussion
As we proposed in the objectives, we found that cross-sectional studies are the most frequent design for analyses of health inequities. Furthermore, we observed that there was variability in the populations studied, although, importantly, the studies were carried out on the general population and the availability of data may have influenced this aspect. Finally, the multiple indicators used at the socioeconomic and health levels were grouped, showing a clear picture of the most frequent indicators, i.e., self-perception in health and educational level as the most frequent indicators, respectively.
We found that there are abundant studies in the literature on health inequalities, although very heterogeneous and disintegrated, without forming a body of their own. In this sense, the studies carried out in the Spanish State affirmed the presence of inequities in health due to different factors related to social stratification and also showed that the existence of a national health system is not a sufficient condition for eliminating these inequalities, which are very present throughout Spain.
There has been an increase in research on social inequalities and their effects on health inequities, coming from various perspectives. Likewise, the involvement of different organizations not specific to the study of these data, such as the International Monetary Fund [86] and La Caixa Foundation [87], confirms the increased interest in studying equity in health. In addition, the deep economic crisis experienced since 2008, the creation of the Commission on the Reduction of Social Inequalities in Health in 2010, and the recent SARS-CoV-2 pandemic have given rise to many new investigations on health inequities.
However, although there has been an increase in the number of studies on health inequities, there is a lack of standardization in terms of methodology or indicators, despite the efforts of some authors such as Ruiz-Alvarez et al. [21]. Thus, the authors’ experiences or interests within their respective disciplines have seemed to guide the research process on inequalities and inequities in health, but not so much that the research has been approached as a subject in which to specialize [88]. This implies that many researchers have studied health inequalities sporadically without developing a broad literature on the matter. In addition, this isolated interest means that the use of different indicators, depending on the appeal at the specific moment, have hindered the methodological standardization required to rigorously address the study of health inequity.
The majority of the studies have been cross-sectional studies. After reading the studies, it was possible to infer some of the possible reasons, such as the use of secondary data from the National Health Survey [89] or other sources at the state or regional level such as the Catalan Institute of Statistics (IDESCAT) [90]. To use these data, researchers have resorted to the microdata provided by surveys to relate them as they wish, analyzing specific people at an exact moment. With few exceptions, the general trend of data recovery and subsequent analysis has seemed to follow this method. Precisely, the source of the data used has determined the indicators used. Thus, both socioeconomic and health indicators have depended on the organism, limiting creativity. Likewise, the availability of data from different institutions has not always been sufficient; sometimes, data have not been comparable, or their disaggregation has not allowed the development of synthetic indicators. In this regard, the studies analyzed showed unfavorable results. In general, there is a relationship between a lower disposition of economic or intellectual capital and a greater inequality in health. At this point, therefore, the question arises as to why this occurs in a country like Spain, where health coverage is universal and free. There are different explanations for this and the studies analyzed present some possible hypotheses. For example, in a survey of the use of health services by patients with HIV [54], it is stated that some barriers have prevented the poorest people from equitably demanding these services, even when they are free. Taking into consideration that, in most cases, these are self-reported data, Álvarez-Gálvez et al. [42] argued, in one of their points, the importance of the mediating effect of perceived discrimination and happiness on health. The use of these subjective indicators by the majority could suggest the impact that collective psychology, hope for the future, and territory could have on self-perceptions, and therefore on their results. However, practically all the studies have shown that a lower socioeconomic status was associated with worse health, whatever the approach and indicators used.
As discussed, there are multiple approaches to inequality in health. Although collective approaches that emphasize social causes are traditionally dominate, studies that put the individual and their different characteristics at the center of their research are increasing. Following the trend in other fields of study where the decisions, capacities, or more immediate contexts determine the results in health, relating personality or cognitive ability to socioeconomic inequality leads to health inequities [13]. Thus, on the one hand, the social dynamics that relegate large pockets of the population to exclusion are left in the background, ignoring the importance of marked socioeconomic differences. On the other hand, we found that the Black Report, as argued in a subsequent analysis, emphasized the importance of social over individual indicators and reduced the explanatory magnitude of individual lifestyles in these health inequities [91]. In this regard, there is a point of friction between the different researchers that should be considered.
Despite not being the main objective of the study, other racial or gender inequalities should be discussed since they increase inequities in health, acting in some cases as inequality multipliers. Ruiz Álvarez et al. [21] addressed this aspect in another review from an intersectionality perspective, while this study aimed to present a class approach, understanding that even within race or gender, class oppression operates in a very pronounced way. In other words, it is understood that even internally, these categories are not homogeneous and present divergences for socioeconomic reasons; therefore, although most of the studies considered them due to their multiplier effect, an attempt was made to separate those in which they were the main object of study. Nevertheless, both reviews use similar methodologies, which allows them to reach similar conclusions regarding the type of articles and indicators used, although both works can largely complement each other.
This scoping review has some limitations in its implementation, such as the spatial limitation of the article, as it focuses exclusively on Spain and may have left out multiple studies with a great contribution to the field in question. There may also be an evaluation bias that can always be found, despite trying to minimize it by performing a peer review. In addition, selection bias may have left out relevant studies or, finally, may have been incurred publication bias by considering the published studies, tending to positive results in the proposed hypotheses. The establishment of the descriptors and the choice of the databases could have also caused a bias when obtaining the studies. Despite these limitations, the results of this study are of interest to decision makers and researchers interested in social inequalities and inequities in health since they show the need to standardize the methods and indicators to rigorously approach their study.
5. Conclusions
The results of this literature review show that, in the literature, there has been an increase in studies carried out in Spain related to socioeconomic inequalities and a lack of equity in health, especially during the deepest years of the crisis. In general, the research has been focused on cross-sectional studies that correlate socioeconomic inequalities and health inequity in the general population, although we also observed ecological, cohort, or case-control studies. Meanwhile, the most widely used health and socio-sanitary indicators are self-perceptions of health and educational level, respectively. Other indicators are less prevalent, although with a rather notable presence in the different studies, such as chronic diseases, lifestyle, or mental health on the health side and social class or income as socioeconomic indicators.
The results of the analyzed studies should alert public officials to the importance of addressing socioeconomic inequalities in order to reduce existing health inequities and not only focus on partial measures or increasing health spending as the only solution. However, the methodological characteristics described surely limit the impact that these investigations can have on political decision making. Future studies are needed that focus on methodological consensus to address the study of this problem and to develop and monitor composite indices that allow an objective and adequate assessment of the impact of policies aimed at reducing social inequalities and inequity in health.
Supplementary Materials
The following supporting information can be downloaded at: https://www.mdpi.com/article/10.3390/healthcare11233035/s1, Table S1: Complete list of references included in the review.
Author Contributions
Conceptualization, methodology, G.B.-P. and V.M.G.-C.; formal analysis, data curation, writing—original draft preparation, J.P.-S. and G.B.-P.; writing—review and editing, supervision, V.M.G.-C. All authors have read and agreed to the published version of the manuscript.
Funding
This research received no external funding.
Institutional Review Board Statement
Not applicable.
Informed Consent Statement
Not applicable.
Data Availability Statement
All necessary data are supplied and available in the manuscript; however, the corresponding author will provide the dataset upon request.
Conflicts of Interest
The authors declare no conflict of interest.
References
- Eurohealthnet. Health Inequalities in Europe. Available online: https://eurohealthnet.eu/publication/health-inequalities-in-the-eu/ (accessed on 6 October 2023).
- Scholz, N. Addressing Health Inequalities in the European Union: Concepts, Action, State of Play; European Parliament, Directorate-General for Parliamentary Research Services: Brussels, Switzerland, 2020. [Google Scholar] [CrossRef]
- Marx, K.; Engels, F. Manifiesto del Partido Comunista; Centro de Estudios Socialistas Carlos Marx: Mexico City, Mexico, 2011; Available online: https://centromarx.org/images/stories/PDF/manifiesto%20comunista.pdf (accessed on 6 October 2023).
- Wright, E.O. Clases; Siglo XXI España Editores: Madrid, Spain, 1994. [Google Scholar]
- Bordieu, P. La Distinción; Criterio y Bases Sociales del Gusto; Taurus: Madrid, Spain, 1998. [Google Scholar]
- Álvarez-Dardet, C.; Alonso, J.; Domingo, A.; Regidor, E. La Medición de la Clase Social en Ciencias de la Salud; SG Editores: Barcelona, Spain, 1995. [Google Scholar]
- Alonso, J.; Pérez, P.; Sáez, M.; Murillo, C. Validez de la ocupación como indicador de la clase social, según la clasificación del British Registrar General. Gac. Sanit. 1997, 11, 205–213. [Google Scholar] [CrossRef] [PubMed]
- McIntosh Gray, A. Inequalities in health. The black report: A summary and comment. Int. J. Health Serv. 1982, 12, 349–380. [Google Scholar] [CrossRef] [PubMed]
- Walters, S.; Suhrcke, M. Socioeconomic Inequalities in Health and Health Care Access in Central and Eastern Europe and the CIS: A Review of the Recent Literature; World Health Organization, Regional Office for Europe: Geneva, Switzerland, 2005; Available online: https://iris.who.int/handle/10665/350352 (accessed on 6 October 2023).
- Mackenbach, J.P. The persistence of health inequalities in modern welfare states: The explanation of a paradox. Soc. Sci. Med. 2012, 75, 761–769. [Google Scholar] [CrossRef]
- Marmot, M. Status syndrome. Significance 2004, 1, 150–154. [Google Scholar] [CrossRef]
- Batty, G.D.; Der, G.; Macintyre, S.; Deary, I.J. Does IQ explain socioeconomic inequalities in health? Evidence from a population based cohort study in the west of Scotland. BMJ 2006, 332, 580–584. [Google Scholar] [CrossRef] [PubMed]
- MacKenbach, J.P. New trends in health inequalities research: Now it’s personal. Lancet 2010, 376, 854–855. [Google Scholar] [CrossRef]
- Jefatura del Estado. Ley 14/1986, de 25 de Abril, General de Sanidad; Boletín Oficial del Estado: Madrid, Spain, 1986; Available online: https://www.boe.es/eli/es/l/1986/04/25/14/con (accessed on 7 October 2023).
- Jefatura del Estado. Ley 6/2003, de 28 Mayo de 2003, de Cohesión y Calidad del Sistema Nacional de Salud; Boletín Oficial del Estado: Madrid, Spain, 2003; Available online: https://www.boe.es/buscar/act.php?id=BOE-A2003-10715 (accessed on 30 July 2020).
- Commission on the Reduction of Social Inequalities in Health in Spain. A proposal of policies and interventions to reduce social inequalities in health in Spain. Gac. Sanit. 2012, 26, 182–189. [Google Scholar] [CrossRef]
- Tandon, A.; Murray, C.J.; Lauer, J.A.; Evans, D.B. Measuring Health System Performance for 191 Countries. GPE Discussion Paper Series No. 30; World Health Organization: Geneva, Switzerland, 2000; Available online: https://f.hubspotusercontent20.net/hubfs/2325471/Inspectorio_Dec2021/pdf/paper30.pdf (accessed on 6 October 2023).
- World Health Organization. World Health Organization Assesses the World’s Health Systems. Available online: https://www.who.int/news/item/07-02-2000-world-health-organization-assesses-the-world’s-health-systems (accessed on 6 October 2023).
- Nombela-Monterroso, K.; González-Chordá, V.M.; Roman, P. Descriptive study of the Specialized Care of the Spanish Health System. Rev. Saúde Pública 2018, 52, 5. [Google Scholar] [CrossRef]
- Pérez-Cantó, V.; Maciá-Soler, L.; González-Chordá, V.M. User satisfaction in the spanish health system: Trend analysis. Rev. Saúde Pública 2019, 53, 87. [Google Scholar] [CrossRef]
- Ruiz Álvarez, M.; Aginagalde Llorente, A.H.; Del Llano Señarís, J.E. Los determinantes sociales de la salud en España (2010–2021): Una revisión exploratoria de la literatura. Rev. Esp. Salud Pública 2022, 96, e202205041. Available online: https://www.sanidad.gob.es/biblioPublic/publicaciones/recursos_propios/resp/revista_cdrom/VOL96/REVISIONES/RS96C_202205041.pdf (accessed on 7 October 2023).
- Arksey, H.; O’Malley, L. Scoping studies: Towards a methodological framework. Int. J. Soc. Res. Methodol. 2005, 8, 19–32. [Google Scholar] [CrossRef]
- Levac, D.; Colquhoun, H.; O’Brien, K.K. Scoping studies: Advancing the methodology. Implement. Sci. 2010, 5, 69. [Google Scholar] [CrossRef] [PubMed]
- Tricco, A.C.; Lillie, E.; Zarin, W.; O’Brien, K.K.; Colquhoun, H.; Levac, D.; Moher, D.; Peters, M.D.J.; Horsley, T.; Weeks, L.; et al. PRISMA Extension for Scoping Reviews (PRISMA-ScR): Checklist and Explanation. Ann. Intern. Med. 2018, 169, 467–473. [Google Scholar] [CrossRef]
- Joanna Briggs Institute. Critical Appraisal Tools. Available online: https://jbi.global/critical-appraisal-tools (accessed on 7 October 2023).
- Dufault, B.; Klar, N. The quality of modern cross-sectional ecologic studies: A bibliometric review. Am. J. Epidemiol. 2011, 174, 1101–1107. [Google Scholar] [CrossRef]
- Abellán, A.; Rodríguez-Laso, Á.; Pujol, R.; Barrios, L. A higher level of education amplifies the inverse association between income and disability in the Spanish elderly. Aging Clin. Exp. Res. 2015, 27, 903–909. [Google Scholar] [CrossRef] [PubMed]
- Fernández-Martínez, B.; Prieto-Flores, M.E.; Forjaz, M.J.; Fernández-Mayoralas, G.; Rojo-Pérez, F.; Martínez-Martín, P. Self-perceived health status in older adults: Regional and sociodemographic inequalities in Spain. Rev. Saúde Pública 2012, 46, 310–319. [Google Scholar] [CrossRef]
- Compés Dea, M.L.; Olivan Bellido, E.; Feja Solana, C.; Aguilar Palacio, I.; García-Carpintero Romero Del Hombrebueno, G.; Adiego Sancho, B. Construcción de un índice de privación por zona básica de salud en Aragón a partir de datos de censo de 2011 [Construction of a deprivation index by Basic Healthcare Area in Aragon using Population and Housing Census 2011]. Rev. Española de Salud Pública 2018, 10, e201812087. [Google Scholar]
- Esteban y Peña, M.M.; Fernández Velasco, E.; Jiménez García, R.; Hernández Barrera, V.; Fernandez del Pozo, I. Salud e Incidencia y Diferencias En Vulnerabilidad Territorial de La Ciudad de Madrid. Rev. Esp. Salud Publica 2020, 94, 202004020. [Google Scholar] [CrossRef]
- Aguilar-Palacio, I.; Carrera-Lasfuentes, P.; Solsona, S.; Sartolo, M.T.; Rabanaque, M.J. Utilización de Servicios Sanitarios En Ancianos (España 2006-2012): Influencia Del Nivel de Salud y de La Clase Social. Aten. Primaria 2016, 48, 235–243. [Google Scholar] [CrossRef][Green Version]
- Tornero Patricio, S.; Charris-Castro, L.; Granero Asencio, M.; Daponte Codina, A. Influence of Postcode on Paediatric Admissions in Seville. An. Pediatr. 2017, 87, 320–329. [Google Scholar] [CrossRef]
- Rajmil, L.; López-Aguilà, S.; Penina, A.M.; Bustos, A.M.; Sanz, M.R.; Guiteras, P.B. Desigualdades Sociales En La Salud Mental Infantil En Cataluña. An. Pediatr. 2010, 73, 233–240. [Google Scholar] [CrossRef] [PubMed]
- Saez, M.; López-Casasnovas, G. Assessing the Effects on Health Inequalities of Differential Exposure and Differential Susceptibility of Air Pollution and Environmental Noise in Barcelona, 2007–2014. Int. J. Environ. Res. Public Health 2019, 16, 3470. [Google Scholar] [CrossRef] [PubMed]
- Bilal, U.; Hill-Briggs, F.; Sánchez-Perruca, L.; Del Cura-González, I.; Franco, M. Association of Neighbourhood Socioeconomic Status and Diabetes Burden Using Electronic Health Records in Madrid (Spain): The Heart Healthy Hoods Study. BMJ Open 2018, 8, e021143. [Google Scholar] [CrossRef] [PubMed]
- Merino-Ventosa, M.; Urbanos-Garrido, R.M. Changes in Income-Related Inequalities in Cervical Cancer Screening during the Spanish Economic Crisis: A Decomposition Analysis. Int. J. Equity Health 2018, 17, 184. [Google Scholar] [CrossRef] [PubMed]
- Tamayofonseca, N.; Nolasco, A.; Moncho, J.; Barona, C.; Irles, M.Á.; Más, R.; Girón, M.; Gómezbeneyto, M.; Pereyrazamora, P. Contribution of the Economic Crisis to the Risk Increase of Poor Mental Health in a Region of Spain. Int. J. Environ. Res. Public Health 2018, 15, 2517. [Google Scholar] [CrossRef] [PubMed]
- Nuñez, O.; Barranco, M.R.; Fernández-Navarro, P.; Sanchez, D.R.; Fernández, M.Á.L.; Santamaría, M.P.; Sánchez, M.-J. Deprivation Gap in Colorectal Cancer Survival Attributable to Stage at Diagnosis: A Population-Based Study in Spain. Cancer Epidemiol. 2020, 68, 101794. [Google Scholar] [CrossRef]
- Solé-Auró, A.; Martín, U.; Rodríguez, A.D. Educational Inequalities in Life and Healthy Life Expectancies among the 50-plus in Spain. Int. J. Environ. Res. Public Health 2020, 17, 3558. [Google Scholar] [CrossRef] [PubMed]
- Vives, A.; Vanroelen, C.; Amable, M.; Ferrer, M.; Moncada, S.; Llorens, C.; Muntaner, C.; Benavides, F.; Benach, J. Employment Precariousness in Spain: Prevalence, Social Distribution, and Population-Attributable Risk Percent of Poor Mental Health. Int. J. Health Serv. 2011, 41, 625–646. [Google Scholar] [CrossRef]
- Crespo-Cebada, E.; Urbanos-Garrido, R.M. Equity and Equality in the Use of GP Services for Elderly People: The Spanish Case. Health Policy 2012, 104, 193–199. [Google Scholar] [CrossRef]
- Álvarez-Gálvez, J.; Rodero-Cosano, M.L.; Salinas-Pérez, J.A.; Gómez-Baya, D. Exploring the Complex Associations Among Social Determinants of Health in Andalusia after the 2008 Financial Crisis. Soc. Indic. Res. 2019, 141, 873–893. [Google Scholar] [CrossRef]
- Abásolo, I.; Saez, M.; López-Casasnovas, G. Financial Crisis and Income-Related Inequalities in the Universal Provision of a Public Service: The Case of Healthcare in Spain. Int. J. Equity Health 2017, 16, 134. [Google Scholar] [CrossRef] [PubMed]
- Cebrecos, A.; Domínguez-Berjón, M.F.; Duque, I.; Franco, M.; Escobar, F. Geographic and Statistic Stability of Deprivation Aggregated Measures at Different Spatial Units in Health Research. Appl. Geogr. 2018, 95, 9–18. [Google Scholar] [CrossRef]
- Maynou, L.; Saez, M.; Lopez-Casasnovas, G. Has the Economic Crisis Widened the Intraurban Socioeconomic Inequalities in Mortality? The Case of Barcelona, Spain. J. Epidemiol. Community Health 2014, 70, 114–124. [Google Scholar] [CrossRef] [PubMed]
- Rueda, S. Health Inequalities among Older Adults in Spain: The Importance of Gender, the Socioeconomic Development of the Region of Residence, and Social Support. Women’s Health Issues 2012, 22, e483–e490. [Google Scholar] [CrossRef] [PubMed]
- Barroso, C.; Abásolo, I.; Cáceres, J.J. Health Inequalities by Socioeconomic Characteristics in Spain: The Economic Crisis Effect. Int. J. Equity Health 2016, 15, 1–12. [Google Scholar] [CrossRef]
- Cainzos-Achirica, M.; Capdevila, C.; Vela, E.; Cleries, M.; Bilal, U.; Garcia-Altes, A.; Enjuanes, C.; Garay, A.; Yun, S.; Farre, N.; et al. Individual Income, Mortality and Healthcare Resource Use in Patients with Chronic Heart Failure Living in a Universal Healthcare System: A Population-Based Study in Catalonia, Spain. Int. J. Cardiol. 2019, 277, 250–257. [Google Scholar] [CrossRef] [PubMed]
- Morteruel, M.; Rodriguez-Alvarez, E.; Martin, U.; Bacigalupe, A. Inequalities in Health Services Usage in a National Health System Scheme: The Case of a Southern Social European Region. Nurs. Res. 2018, 67, 26–34. [Google Scholar] [CrossRef] [PubMed]
- Arrospide, A.; Machón, M.; Ramos-Goñi, J.M.; Ibarrondo, O.; Mar, J. Inequalities in Health-Related Quality of Life According to Age, Gender, Educational Level, Social Class, Body Mass Index and Chronic Diseases Using the Spanish Value Set for Euroquol 5D-5L Questionnaire. Health Qual. Life Outcomes 2019, 17, 69. [Google Scholar] [CrossRef]
- Rocha, K.B.; Perez, K.; Rodriguez-Sanz, M.; Muntaner, C.; Alonso, J.; Borrell, C. Inequalities in Mental Health in the Spanish Autonomous Communities: A Multilevel Study. Span. J. Psychol. 2015, 18, E27. [Google Scholar] [CrossRef]
- Arias-de la Torre, J.; Artazcoz, L.; Molina, A.J.; Fernández-Villa, T.; Martín, V. Desigualdades En Salud Mental En Población Trabajadora de España: Un Estudio Basado En La Encuesta Nacional de Salud. Gac. Sanit. 2016, 30, 339–344. [Google Scholar] [CrossRef]
- Martín, U.; Malmusi, D.; Bacigalupe, A.; Esnaola, S. Migraciones Internas En Espana Durante El Siglo Xx: Un Nuevo Eje Para El Estudio de Las Desigualdades Sociales En Salud. Gac. Sanit. 2012, 26, 9–15. [Google Scholar] [CrossRef] [PubMed]
- García-Goñi, M.; Nuño-Solinís, R.; Orueta, J.F.; Paolucci, F. Is utilization of health services for HIV patients equal by socioeconomic status? Evidence from the Basque country. Int. J. Equity Health 2015, 14, 110. [Google Scholar] [CrossRef] [PubMed]
- Moreno-Maldonado, C.; Rivera, F.; Ramos, P.; Moreno, C. Measuring the Socioeconomic Position of Adolescents: A Proposal for a Composite Index. Soc. Indic. Res. 2018, 136, 517–538. [Google Scholar] [CrossRef]
- Arias-de la Torre, J.; Molina, A.J.; Fernández-Villa, T.; Artazcoz, L.; Martín, V. Mental Health, Family Roles and Employment Status inside and Outside the Household in Spain. Gac. Sanit. 2019, 33, 235–241. [Google Scholar] [CrossRef] [PubMed]
- Puig-Barrachina, V.; Malmusi, D.; Martínez, J.; Benach, J. Monitoring Social Determinants of Health Inequalities: The Impact of Unemployment among Vulnerable Groups. Int. J. Health Serv. 2011, 41, 459–482. [Google Scholar] [CrossRef]
- López, J.C.; Castrillo, P.G.; González-Álvarez, M.A. Mortalidad y Estatus Socioeconómico En La España de Principios Del Siglo XXI. Investig. Reg. J. Reg. Res. 2019, 3, 227–240. [Google Scholar]
- Bilal, U.; Glass, T.A.; del Cura-Gonzalez, I.; Sanchez-Perruca, L.; Celentano, D.D.; Franco, M. Neighborhood Social and Economic Change and Diabetes Incidence: The HeartHealthyHoods Study. Health Place 2019, 58, 102149. [Google Scholar] [CrossRef]
- Orueta, J.F.; García-Álvarez, A.; Alonso-Morán, E.; Vallejo-Torres, L.; Nuño-Solinis, R. Socioeconomic Variation in the Burden of Chronic Conditions and Health Care Provision—Analyzing Administrative Individual Level Data from the Basque Country, Spain. BMC Public Health 2013, 13, 870. [Google Scholar] [CrossRef]
- Belzunegui-Eraso, A.; Pastor-Gosálbez, I.; Puig-Andreu, X.; Valls-Fonayet, F. Risk of Exclusion in People with Disabilities in Spain: Determinants of Health and Poverty. Int. J. Environ. Res. Public Health 2018, 15, 2129. [Google Scholar] [CrossRef]
- Pedrós Barnils, N.; Eurenius, E.; Gustafsson, P.E. Self-Rated Health Inequalities in the Intersection of Gender, Social Class and Regional Development in Spain: Exploring Contributions of Material and Psychosocial Factors. Int. J. Equity Health 2020, 19, 85. [Google Scholar] [CrossRef]
- Garrido-Cumbrera, M.; Borrell, C.; Palència, L.; Espelt, A.; Rodríguez-Sanz, M.; Pasarín, M.; Kunst, A. Social Class Inequalities in the Utilization of Health Care and Preventive Services in Spain, a Country with a National Health System. Int. J. Health Serv. 2010, 40, 525–542. [Google Scholar] [CrossRef]
- Amengual-Moreno, M.; Calafat-Caules, M.; Carot, A.; Correia, A.R.R.; Río-Bergé, C.; Plujà, J.R.; Pascual, C.V.; Ventura-Gabarró, C. Social Determinants of the Incidence of COVID-19 in Barcelona: A Preliminary Ecological Study Using Public Data. Rev. Esp. Salud Publica 2020, 94, e202009101. [Google Scholar]
- Terán, J.M.; Varea, C.; Juárez, S.; Bernis, C.; Bogin, B. Social Disparities in Low Birth Weight among Spanish Mothers during the Economic Crisis (2007–2015). Nutr. Hosp. 2018, 35, 129–141. [Google Scholar] [CrossRef] [PubMed]
- Hurtado, J.L.; Bacigalupe, A.; Calvo, M.; Esnaola, S.; Mendizabal, N.; Portillo, I.; Idigoras, I.; Millán, E.; Arana-Arri, E. Social Inequalities in a Population Based Colorectal Cancer Screening Programme in the Basque Country. BMC Public Health 2015, 15, 1021. [Google Scholar] [CrossRef]
- Haeberer, M.; León-Gómez, I.; Pérez-Gómez, B.; Tellez-Plaza, M.; Rodríguez-Artalejo, F.; Galán, I. Social Inequalities in Cardiovascular Mortality in Spain from an Intersectional Perspective. Rev. Española Cardiol. (Engl. Ed.) 2020, 73, 282–289. [Google Scholar] [CrossRef]
- Pérez-Hernández, B.; García-Esquinas, E.; Graciani, A.; Guallar-Castillón, P.; López-García, E.; León-Muñoz, L.M.; Banegas, J.R.; Rodríguez-Artalejo, F. Social Inequalities in Cardiovascular Risk Factors Among Older Adults in Spain: The Seniors-ENRICA Study. Rev. Española Cardiol. (Engl. Ed.) 2017, 70, 145–154. [Google Scholar] [CrossRef]
- Forcadell-Díez, L.; Gotsens, M.; Leon-Gomez, B.B.; Pérez, G. Social Inequalities in Fertility in Women Residing in Urban Neighbourhoods in Spain: A Multilevel Approach. Matern. Child Health J. 2020, 24, 267–274. [Google Scholar] [CrossRef]
- Duarte-Salles, T.; Pasarín, M.I.; Borrell, C.; Rodríguez-Sanz, M.; Rajmil, L.; Ferrer, M.; Pellise, F.; Balague, F. Social Inequalities in Health among Adolescents in a Large Southern European City. J. Epidemiol. Community Health 2011, 65, 166–173. [Google Scholar] [CrossRef][Green Version]
- Urbanos-Garrido, R.M. Social Inequalities in Health: Measuring the Contribution of Housing Deprivation and Social Interactions for Spain. Int. J. Equity Health 2012, 11, 77. [Google Scholar] [CrossRef]
- Barriuso-Lapres, L.; Hernando-Arizaleta, L.; Rajmil, L. Social Inequalities in Mental Health and Health-Related Quality of Life in Children in Spain. Pediatrics 2012, 130, e528–e535. [Google Scholar] [CrossRef]
- Hernández-Yumar, A.; Wemrell, M.; Alessón, I.A.; López-Valcárcel, B.G.; Leckie, G.; Merlo, J. Socioeconomic Differences in Body Mass Index in Spain: An Intersectional Multilevel Analysis of Individual Heterogeneity and Discriminatory Accuracy. PLoS ONE 2018, 13, e0208624. [Google Scholar] [CrossRef]
- Ibáñez, B.; Galbete, A.; Goñi, M.J.; Forga, L.; Arnedo, L.; Aizpuru, F.; Librero, J.; Lecea, O.; Cambra, K. Socioeconomic Inequalities in Cardiometabolic Control in Patients with Type 2 Diabetes. BMC Public Health 2018, 18, 1–9. [Google Scholar] [CrossRef]
- Marí-Dell’olmo, M.; Gotsens, M.; Pasarín, M.I.; Rodríguez-Sanz, M.; Artazcoz, L.; de Olalla, P.G.; Rius, C.; Borrell, C. Socioeconomic Inequalities in COVID-19 in a European Urban Area: Two Waves, Two Patterns. Int. J. Environ. Res. Public Health 2021, 18, 1256. [Google Scholar] [CrossRef]
- Capurro, D.A.; Davidsen, M. Socioeconomic Inequalities in Dental Health among Middle-Aged Adults and the Role of Behavioral and Psychosocial Factors: Evidence from the Spanish National Health Survey. Int. J. Equity Health 2017, 16, 34. [Google Scholar] [CrossRef] [PubMed]
- Larrañaga, I.; Santa-Marina, L.; Begiristain, H.; Machón, M.; Vrijheid, M.; Casas, M.; Tardón, A.; Fernández-Somoano, A.; Llop, S.; Rodriguez-Bernal, C.L.; et al. Socio-Economic Inequalities in Health, Habits and Self-Care during Pregnancy in Spain. Matern. Child Health J. 2013, 17, 1315–1324. [Google Scholar] [CrossRef] [PubMed]
- Zoni, A.C.; Domínguez-Berjón, M.F.; Esteban-Vasallo, M.D.; Velázquez-Buendía, L.M.; Blaya-Nováková, V.; Regidor, E. Socioeconomic Inequalities in Injuries Treated in Primary Care in Madrid, Spain. J. Public Health 2017, 39, 45–51. [Google Scholar] [CrossRef] [PubMed]
- Bilal, U.; Cainzos-Achirica, M.; Cleries, M.; Santaeugènia, S.; Corbella, X.; Comin-Colet, J.; Vela, E. Socioeconomic Status, Life Expectancy and Mortality in a Universal Healthcare Setting: An Individual-Level Analysis of >6 Million Catalan Residents. Prev. Med. 2019, 123, 91–94. [Google Scholar] [CrossRef]
- Orueta, J.F.; Nuño-Solinís, R.; García-Alvarez, A.; Alonso-Morán, E. Prevalence of Multimorbidity According to the Deprivation Level among the Elderly in the Basque Country. BMC Public Health 2013, 13, 918. [Google Scholar] [CrossRef]
- Zapata-Moya, Á.R.; Willems, B.; Bracke, P. The (Re)Production of Health Inequalities through the Process of Disseminating Preventive Innovations: The Dynamic Influence of Socioeconomic Status. Health Sociol. Rev. 2019, 28, 177–193. [Google Scholar] [CrossRef]
- Pascual-Sáez, M.; Cantarero-Prieto, D.; Lanza-León, P. The Dynamics of Health Poverty in Spain during the Economic Crisis (2008–2016). Health Policy 2019, 123, 1011–1018. [Google Scholar] [CrossRef]
- Bartoll, X.; Palència, L.; Malmusi, D.; Suhrcke, M.; Borrell, C. The Evolution of Mental Health in Spain during the Economic Crisis. Eur. J. Public Health 2014, 24, 415–418. [Google Scholar] [CrossRef] [PubMed]
- Fernández, S.C.; Ajuria, A.F.; Martín, J.J.; Murphy, M.J. The Impact of the Economic Crisis on Unmet Dental Care Needs in Spain. J. Epidemiol. Community Health 2015, 69, 880–885. [Google Scholar] [CrossRef]
- De Bont, J.; Diáz, Y.; Casas, M.; Garciá-Gil, M.; Vrijheid, M.; Duarte-Salles, T. Time Trends and Sociodemographic Factors Associated with Overweight and Obesity in Children and Adolescents in Spain. JAMA Netw. Open 2020, 3, e201171. [Google Scholar] [CrossRef] [PubMed]
- García-Escribano, M.; Shang, B.; Kitsios, E. Chart of the Week: Inequality, Your Health, and Fiscal Policy. IMF Blog. 5 February 2018. Available online: https://www.imf.org/en/Blogs/Articles/2018/02/05/chart-of-the-week-inequality-your-health-and-fiscal-policy (accessed on 7 October 2023).
- La Caixa. Desigualdad Social, Crisis Económica y Salud en España. El ObservatorioSocial. September 2016. Available online: https://elobservatoriosocial.fundacionlacaixa.org/-/desigualdad-social-crisis-economica-y-salud-en-espana (accessed on 7 October 2023).
- Graham, H. Building an inter-disciplinary science of health inequalities: The example of life course research. Soc. Sci. Med. 2002, 55, 2005–2016. [Google Scholar] [CrossRef]
- National Institute of Statistics. National Health Survey. Available online: https://www.ine.es/dyngs/INEbase/es/operacion.htm?c=Estadistica_C&cid=1254736176783&menu=resultados&idp=1254735573175 (accessed on 7 October 2023).
- Catalan Institute of Statistics (IDESCAT). Available online: https://www.idescat.cat/?lang=en (accessed on 7 October 2023).
- Smith, G.D.; Bartley, M.; Blane, D. The Black report on socioeconomic inequalities in health 10 years on. BMJ 1990, 301, 373–377. [Google Scholar] [CrossRef]

Disclaimer/Publisher’s Note: The statements, opinions and data contained in all publications are solely those of the individual author(s) and contributor(s) and not of MDPI and/or the editor(s). MDPI and/or the editor(s) disclaim responsibility for any injury to people or property resulting from any ideas, methods, instructions or products referred to in the content. |
© 2023 by the authors. Licensee MDPI, Basel, Switzerland. This article is an open access article distributed under the terms and conditions of the Creative Commons Attribution (CC BY) license (https://creativecommons.org/licenses/by/4.0/).