
Linking Affect Dynamics and Well-Being: A Novel Methodological Approach for Mental Health


Abstract
:1. Introduction
2. Materials and Methods
2.1. Participants
2.2. Inclusion Criteria
2.3. Procedure
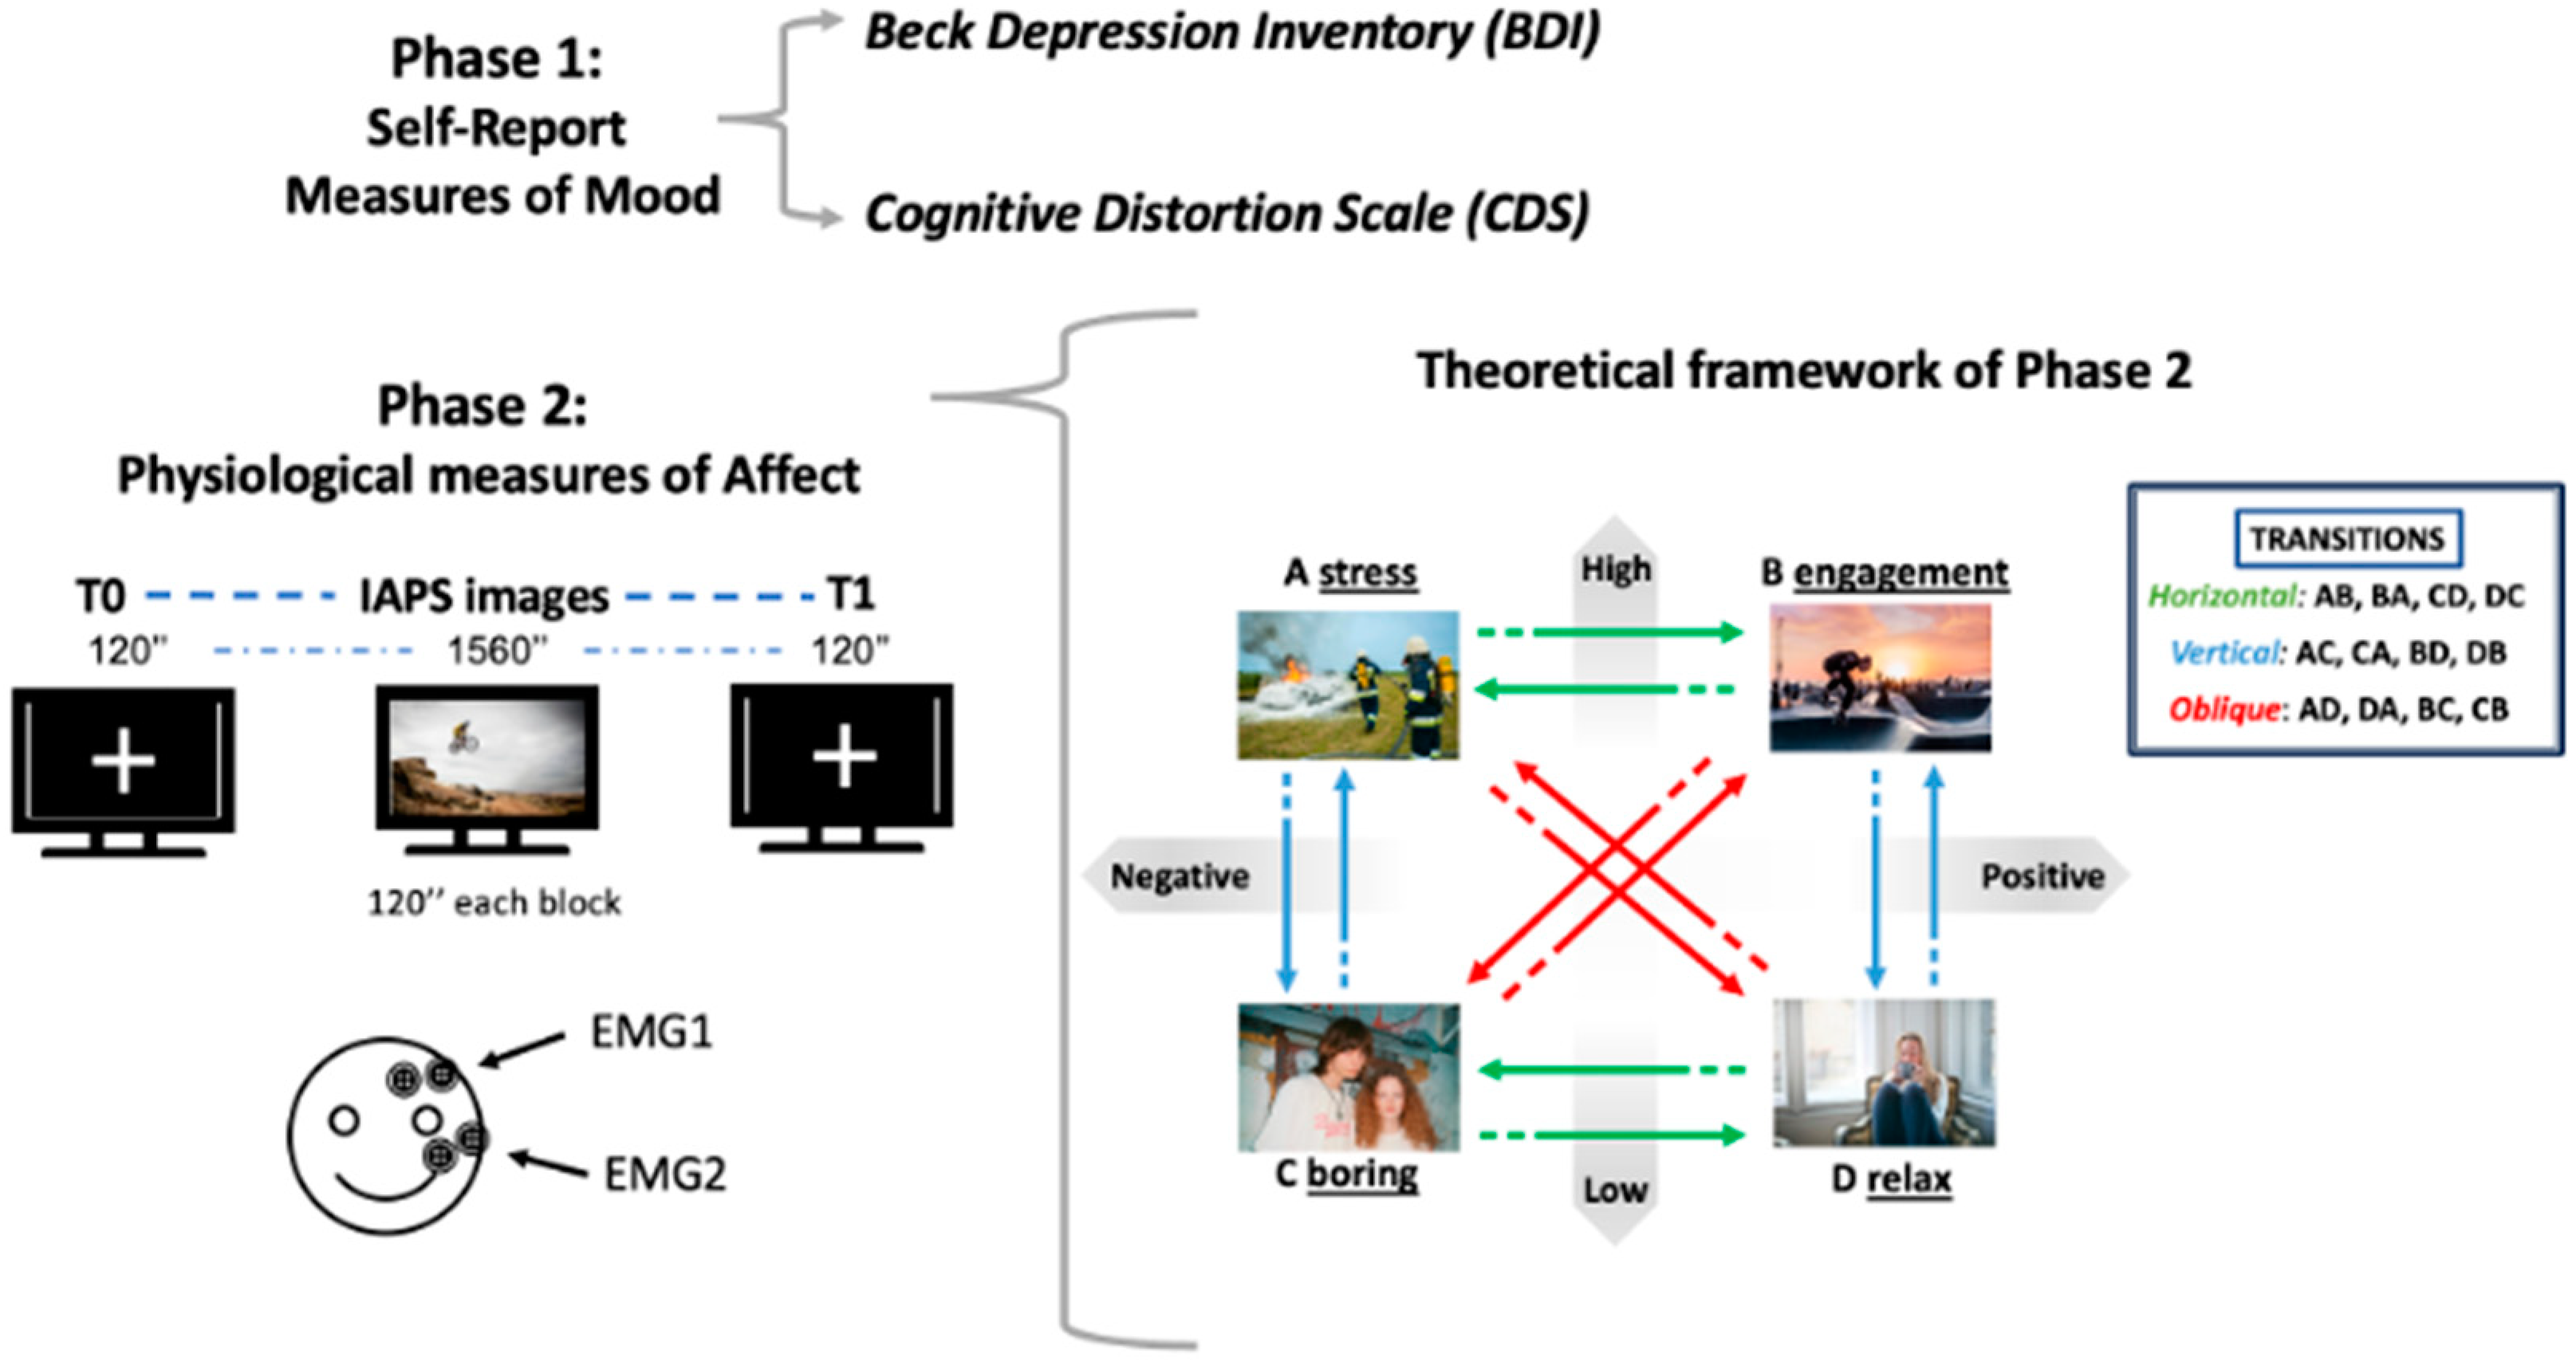
2.3.1. Self-Report Measures
- The Beck Depression Inventory (BDI) [35] is a widely used instrument for assessing the severity of depressive symptoms and it has been adapted for use as a screening tool in the general population. It consists of 21 items (scored on a scale from 0 to 3); each item on the BDI consists of four statements, ranked in order of increasing severity, describing common symptoms of depression. The minimum obtainable score equals 0, while the maximum corresponds to 63. Respondents choose the statement that best describes how they have been feeling over the past week.
- The Cognitive Distortion Scale (CDS) [36] is designed to assess cognitive distortions, which are biased ways of thinking that are believed to contribute to psychological distress. This scale measures the frequency of cognitive distortions across two domains: interpersonal and achievement-related situations. The CDS consists of 20 items, divided into 10 categories and rated on a 7-point Likert scale (1 = Never, 7 = Always). Each category consists of 2 items, resulting in a minimum observable score of 2 and a maximum score of 14 for each category. Regarding the total scale (CDS), scores between 20 and 140 can be observed.
2.3.2. Psychophysiological Evaluation
2.3.3. EMG Recording and Signal Processing
2.3.4. Statistical Analyses
3. Results
4. Discussion
5. Conclusions
6. Limitations
Supplementary Materials
Author Contributions
Funding
Institutional Review Board Statement
Informed Consent Statement
Data Availability Statement
Conflicts of Interest
References
- Koval, P.; Pe, M.L.; Meers, K.; Kuppens, P. Affect dynamics in relation to depressive symptoms: Variable, unstable or inert? Emotion 2013, 13, 1132–1141. [Google Scholar] [CrossRef]
- Rottenberg, J.; Johnson, S.L. Emotion and Psychopathology. 2007. Available online: www.apa.org (accessed on 29 July 2024).
- Dejonckheere, E.; Mestdagh, M.; Houben, M.; Rutten, I.; Sels, L.; Kuppens, P.; Tuerlinckx, F. Complex affect dynamics add limited information to the prediction of psychological well-being. Nat. Human. Behav. 2019, 3, 478–491. [Google Scholar] [CrossRef] [PubMed]
- Waugh, C.E.; Kuppens, P. Affect Dynamics; Springer Nature: Berlin/Heidelberg, Germany, 2021; pp. 1–332. [Google Scholar] [CrossRef]
- Pirla, S.; Taquet, M.; Quoidbach, J. Measuring affect dynamics: An empirical framework. Behav. Res. Methods 2023, 55, 285–300. [Google Scholar] [CrossRef] [PubMed]
- Colombo, D.; Fernández-Álvarez, J.; Patané, A.; Semonella, M.; Kwiatkowska, M.; García-Palacios, A.; Cipresso, P.; Riva, G.; Botella, C. Current state and future directions of technology-based ecological momentary assessment and intervention for major depressive disorder: A systematic review. J. Clin. Med. 2019, 8, 465. [Google Scholar] [CrossRef] [PubMed]
- Kuppens, P.; Allen, N.B.; Sheeber, L.B. Emotional Inertia and Psychological Maladjustment. Psychol. Sci. 2010, 21, 984–991. [Google Scholar] [CrossRef]
- Hou, W.K.; Bonanno, G.A. Emotions in everyday life during social movements: Prospective predictions of mental health. J. Couns. Psychol. 2018, 65, 120–131. [Google Scholar] [CrossRef]
- Wichers, M.; Peeters, F.; Geschwind, N.; Jacobs, N.; Simons, C.; Derom, C.; Thiery, E.; Delespaul, P.; van Os, J. Unveiling patterns of affective responses in daily life may improve outcome prediction in depression: A momentary assessment study. J. Affect. Disord. 2010, 124, 191–195. [Google Scholar] [CrossRef]
- Houben, M.; Van, W.; Noortgate, D.; Kuppens, P. The Relation Between Short-Term Emotion Dynamics and Psychological Well-Being: A Meta-Analysis. Association 2015, 141, 901–930. [Google Scholar] [CrossRef]
- Connolly, S.L.; Alloy, L.B. Rumination interacts with life stress to predict depressive symptoms: An ecological momentary assessment study. Behav. Res. Ther. 2017, 97, 86–95. [Google Scholar] [CrossRef]
- Panaite, V.; Rottenberg, J.; Bylsma, L.M. Daily Affective Dynamics Predict Depression Symptom Trajectories Among Adults with Major and Minor Depression. Affect. Sci. 2020, 1, 186–198. [Google Scholar] [CrossRef]
- Everaert, J.; Koster, E.H.W.; Derakshan, N. The combined cognitive bias hypothesis in depression. Clin. Psychol. Rev. 2012, 32, 413–424. [Google Scholar] [CrossRef] [PubMed]
- Joormann, J.; Stanton, C.H. Examining emotion regulation in depression: A review and future directions. Behav. Res. Ther. 2016, 86, 35–49. [Google Scholar] [CrossRef] [PubMed]
- Cuijpers, P.; De Graaf, R.; Van Dorsselaer, S. Minor depression: Risk profiles, functional disability, health care use and risk of developing major depression. J. Affect. Disord. 2004, 79, 71–79. [Google Scholar] [CrossRef]
- Benning, S.D.; Ait Oumeziane, B. Reduced positive emotion and underarousal are uniquely associated with subclinical depression symptoms: Evidence from psychophysiology, self-report, and symptom clusters. Psychophysiology 2017, 54, 1010–1030. [Google Scholar] [CrossRef] [PubMed]
- Wolf, K. Measuring facial expression of emotion. Dialogues Clin. Neurosci. 2015, 17, 457–462. [Google Scholar] [CrossRef]
- van der Veen, F.M.; van der Molen, M.J.W.; van der Molen, M.W.; Franken, I.H.A. Thumbs up or thumbs down? Effects of neuroticism and depressive symptoms on psychophysiological responses to social evaluation in healthy students. Cogn. Affect. Behav. Neurosci. 2016, 16, 836–847. [Google Scholar] [CrossRef]
- Salgado, S.; Kingo, O.S. How is physiological arousal related to self-reported measures of emotional intensity and valence of events and their autobiographical memories? Conscious. Cogn. 2019, 75, 102811. [Google Scholar] [CrossRef]
- Timmons, A.C.; Baucom, B.R.; Han, S.C.; Perrone, L.; Chaspari, T.; Narayanan, S.S.; Margolin, G. New Frontiers in Ambulatory Assessment: Big Data Methods for Capturing Couples’ Emotions, Vocalizations, and Physiology in Daily Life. Soc. Psychol. Personal. Sci. 2017, 8, 552–563. [Google Scholar] [CrossRef]
- Tan, J.-W.; Walter, S.; Scheck, A.; Hrabal, D.; Hoffmann, H.; Kessler, H.; Traue, H.C. Facial electromyography (fEMG) activities in response to affective visual stimulation. In Proceedings of the IEEE SSCI 2011—Symposium Series on Computational Intelligence—WACI 2011: 2011 Workshop on Affective Computational Intelligence, Paris, France, 11–15 April 2011; pp. 45–49. [Google Scholar] [CrossRef]
- Van Beek, Y.; Dubas, J.S. Decoding basic and non-basic facial expressions and depressive symptoms in late childhood and adolescence. J. Nonverbal Behav. 2008, 32, 53–64. [Google Scholar] [CrossRef]
- Gupta, T.; Osborne, K.J.; Nadig, A.; Haase, C.M.; Mittal, V.A. Alterations in facial expressions in individuals at risk for psychosis: A facial electromyography approach using emotionally evocative film clips. Psychol. Med. 2023, 53, 5829–5838. [Google Scholar] [CrossRef]
- Kim, H.; Zhang, D.; Kim, L.; Im, C.H. Classification of Individual’s discrete emotions reflected in facial microexpressions using electroencephalogram and facial electromyogram. Expert. Syst. Appl. 2022, 188, 116101. [Google Scholar] [CrossRef]
- Golland, Y.; Hakim, A.; Aloni, T.; Schaefer, S.; Levit-Binnun, N. Affect dynamics of facial EMG during continuous emotional experiences. Biol. Psychol. 2018, 139, 47–58. [Google Scholar] [CrossRef]
- Sato, W.; Kochiyama, T.; Yoshikawa, S. Physiological correlates of subjective emotional valence and arousal dynamics while viewing films. Biol. Psychol. 2020, 157, 107974. [Google Scholar] [CrossRef] [PubMed]
- Kreibig, S.D.; Gross, J.J. Temporal dynamics of positive emotion regulation: Insights from facial electromyography. Front. Hum. Neurosci. 2024, 18, 1387634. [Google Scholar] [CrossRef] [PubMed]
- Kobylińska, D.; Lewczuk, K.; Wizła, M.; Marcowski, P.; Blaison, C.; Kastendieck, T.; Hess, U. Effectiveness of emotion regulation strategies measured by self-report and EMG as a result of strategy used, negative emotion strength and participants’ baseline HRV. Sci. Rep. 2023, 13, 6226. [Google Scholar] [CrossRef]
- Kim, H.; Kwak, S.; Yoo, S.Y.; Lee, E.C.; Park, S.; Ko, H.; Bae, M.; Seo, M.; Nam, G.; Lee, J.-Y. Facial Expressions Track Depressive Symptoms in Old Age. Sensors 2023, 23, 7080. [Google Scholar] [CrossRef]
- Hill, K.E.; South, S.C.; Egan, R.P.; Foti, D. Abnormal emotional reactivity in depression: Contrasting theoretical models using neurophysiological data. Biol. Psychol. 2019, 141, 35–43. [Google Scholar] [CrossRef]
- Renna, M.E.; Quintero, J.M.; Fresco, D.M.; Mennin, D.S. Emotion regulation therapy: A mechanism-targeted treatment for disorders of distress. Front. Psychol. 2017, 8, 211118. [Google Scholar] [CrossRef] [PubMed]
- Russell, J.A. A circumplex model of affect. J. Pers. Soc. Psychol. 1980, 39, 1161–1178. [Google Scholar] [CrossRef]
- Russell, J.A. Core Affect and the Psychological Construction of Emotion. Psychol. Rev. 2003, 110, 145–172. [Google Scholar] [CrossRef]
- Bylsma, L.M.; Rottenberg, J. Emotional Reactivity to Daily Events in Major and Minor Depression. Artic. J. Abnorm. Psychol. 2011, 120, 155–167. [Google Scholar] [CrossRef] [PubMed]
- Wang, Y.P.; Gorenstein, C. Psychometric properties of the Beck Depression Inventory-II: A comprehensive review. Braz. J. Psychiatry 2013, 35, 416–431. [Google Scholar] [CrossRef]
- Aldi, G.A.; Svicher, A.; Cosci, F. Validation of the Italian Version of the Cognitive Distortion Scale as a Measure of Cognitive Bias in a Non-clinical Sample. J. Ration.-Emotive Cogn.-Behav. Ther. 2020, 38, 56–75. [Google Scholar] [CrossRef]
- Lang, P.; Bradley, M.; Cuthbert, B. International Affective Picture System (IAPS): Instruction Manual and Affective Ratings; Tech. Rep. No. A-4; The Center for Research in Psychophysiology, University of Florida: Gainesville, FL, USA, 1999. [Google Scholar]
- Bradley, M.M.; Lang, P.J. Measuring emotion: The self-assessment manikin and the semantic differential. J. Behav. Ther. Exp. Psychiatry 1994, 25, 49–59. [Google Scholar] [CrossRef] [PubMed]
- Borghesi, F.; Chirico, A.; Cipresso, P. Outlining a novel psychometric model of mental flexibility and affect dynamics. Front. Psychol. 2023, 14, 1183316. [Google Scholar] [CrossRef] [PubMed]
- Borghesi, F.; Mancuso, V.; Bruni, F.; Cremascoli, R.; Bianchi, L.; Mendolicchio, L.; Cattaldo, S.; Chirico, A.; Mauro, A.; Pedroli, E.; et al. Mental flexibility assessment: A research protocol for patients with Parkinson’s Disease and Anorexia Nervosa. PLoS ONE 2023, 18, e0293921. [Google Scholar] [CrossRef]
- Fridlund, A.J.; Cacioppo, J.T. Guidelines for human electromyographic research. Psychophysiology 1986, 23, 567–589. [Google Scholar] [CrossRef]
- MathWorks—Creatori di MATLAB e Simulink—MATLAB e Simulink—MATLAB & Simulink. Available online: https://it.mathworks.com/?s_tid=gn_logo (accessed on 19 July 2024).
- Larsen, J.T.; Norris, C.J.; Cacioppo, J.T. Effects of positive and negative affect on electromyographic activity over zygomaticus major and corrugator supercilii. Psychophysiology 2003, 40, 776–785. [Google Scholar] [CrossRef]
- Targum, S.D.; Sauder, C.; Evans, M.; Saber, J.N.; Harvey, P.D. Ecological momentary assessment as a measurement tool in depression trials. J. Psychiatr. Res. 2021, 136, 256–264. [Google Scholar] [CrossRef]
- Zhu, X.; Yang, Y.; Xiao, Z.; Pooley, A.; Ozdemir, E.; Speyer, L.G.; Leung, M.; Thurston, C.; Kwok, J.; Li, X.; et al. Daily life affective dynamics as transdiagnostic predictors of mental health symptoms: An ecological momentary assessment study. J. Affect. Disord. 2024, 351, 808–817. [Google Scholar] [CrossRef]
- Rnic, K.; Dozois, D.J.A.; Martin, R.A. Cognitive Distortions, Humor Styles, and Depression. Eur. J. Psychol. 2016, 12, 348. [Google Scholar] [CrossRef] [PubMed]
- Mercan, N.; Bulut, M.; Yüksel, Ç. Investigation of the relatedness of cognitive distortions with emotional expression, anxiety, and depression. Curr. Psychol. 2023, 42, 2176–2185. [Google Scholar] [CrossRef]
- Kraft-Feil, T.L.; Ingram, R.E.; Gorey, C.; Luu, J.H.; Cross, M.P.; Pressman, S.D. The association of negative mood with automatic and effortful facial expression mimicry. Front. Psychol. 2023, 14, 1056535. [Google Scholar] [CrossRef] [PubMed]
- Kuru, E.; Safak, Y.; Özdemir, I.; Tulacı, R.; Özdel, K.; Özkula, N.; Örsel, S. Cognitive distortions in patients with social anxiety disorder: Comparison of a clinical group and healthy controls. Eur. J. Psychiatry 2018, 32, 97–104. [Google Scholar] [CrossRef]
- Deperrois, R.; Combalbert, N. Links between cognitive distortions and cognitive emotion regulation strategies in non-clinical young adulthood. Cogn. Process. 2022, 23, 69–77. [Google Scholar] [CrossRef]
- Oshio, A.; Mieda, T.; Taku, K. Younger people, and stronger effects of all-or-nothing thoughts on aggression: Moderating effects of age on the relationships between dichotomous thinking and aggression. Cogent. Psychol. 2016, 3, 1244874. [Google Scholar] [CrossRef]
- Bruning, A.L.; Mallya, M.M.; Lewis-Peacock, J.A. Rumination burdens the updating of working memory. Atten. Percept. Psychophys. 2023, 85, 1452–1460. [Google Scholar] [CrossRef]
- Beckwé, M.; Deroost, N.; Koster, E.H.W.; De Lissnyder, E.; De Raedt, R. Worrying and rumination are both associated with reduced cognitive control. Psychol. Res. 2014, 78, 651–660. [Google Scholar] [CrossRef]
- Zaehringer, J.; Jennen-Steinmetz, C.; Schmahl, C.; Ende, G.; Paret, C. Psychophysiological effects of downregulating negative emotions: Insights from a meta-analysis of healthy adults. Front. Psychol. 2020, 11, 520402. [Google Scholar] [CrossRef]
- Lewis, J.A.; Fraga, K.J.; Erickson, T.M. Dichotomous Thinking. In Encyclopedia of Personality and Individual Differences; Springer: Cham, Switzerland, 2019; pp. 1–5. [Google Scholar] [CrossRef]
- Clancy, E.M.; Fiacconi, C.M.; Fenske, M.J. Response inhibition immediately elicits negative affect and devalues associated stimuli: Evidence from facial electromyography. Prog. Brain Res. 2019, 247, 169–191. [Google Scholar] [CrossRef]
- Davies, H.; Wolz, I.; Leppanen, J.; Fernandez-Aranda, F.; Schmidt, U.; Tchanturia, K. Facial expression to emotional stimuli in non-psychotic disorders: A systematic review and meta-analysis. Neurosci. Biobehav. Rev. 2016, 64, 252–271. [Google Scholar] [CrossRef] [PubMed]
- TLincoln, M.; Schulze, L.; Renneberg, B. The role of emotion regulation in the characterization, development and treatment of psychopathology. Nat. Rev. Psychol. 2022, 1, 272–286. [Google Scholar] [CrossRef]
- Gregory, A.J.P.; Dirks, M.A.; Nitschke, J.P.; Wong, J.M.; Human, L.J.; Bartz, J.A. Association Between Depression Symptoms and Emotional-Communication Dynamics. Clin. Psychol. Sci. 2023. [Google Scholar] [CrossRef]
- Gonzalez-Escamilla, G.; Dörfel, D.; Becke, M.; Trefz, J.; Bonanno, G.A.; Groppa, S. Associating Flexible Regulation of Emotional Expression With Psychopathological Symptoms. Front. Behav. Neurosci. 2022, 16, 924305. [Google Scholar] [CrossRef] [PubMed]
- Ciuk, D.; Troy, A.K.; Jones, M.C. Measuring Emotion: Self-Reports vs. Physiological Indicators. SSRN Electron. J. 2015. [Google Scholar] [CrossRef]
- Chirico, A.; Gaggioli, A. The Potential Role of Awe for Depression: Reassembling the Puzzle. Front. Psychol. 2021, 12, 617715. [Google Scholar] [CrossRef]
- Borghesi, F.; Murtas, V.; Mancuso, V.; Chirico, A. Continuous Time Elicitation through Virtual Reality to Model Affect Dynamics. In Computer-Human Interaction Research and Applications; Springer: Cham, Switzerland, 2023; pp. 258–276. [Google Scholar]
- Colombo, D.; Baños, R.M.; Desdentado, L.; Kleiboer, A.; Pavani, J.-B.; Wrzesien, M.; López, J.M.B. Daily Stress Encounters: Positive Emotion Upregulation and Depressive Symptoms. Emotion 2024, 24, 1403–1416. [Google Scholar] [CrossRef]
- Cipresso, P.; Serino, S.; Borghesi, F.; Tartarisco, G.; Riva, G.; Pioggia, G.; Gaggioli, A. Continuous measurement of stress levels in naturalistic settings using heart rate variability: An experience-sampling study driving a machine learning approach. Acta IMEKO 2021, 10, 239–248. [Google Scholar] [CrossRef]


| Construct | Type of Measurement | Questionnaires 1 | N | Mean | SD | Min | Max | Cronbach’s Alpha | Skewness | Kurtosis | ||
|---|---|---|---|---|---|---|---|---|---|---|---|---|
| Skewness | SE | Kurtosis | SE | |||||||||
| Depression and Cognitive Distortion | Self-Report | Mind Reading (CDS) | 44 | 9.45 | 2.80 | 3 | 14 | 0.81 | −0.42 | 0.36 | −0.58 | 0.70 |
| Catastrophizing (CDS) | 44 | 7.50 | 3.36 | 2 | 14 | 0.82 | 0.28 | 0.36 | −0.93 | 0.70 | ||
| All or nothing thinking (CDS) | 44 | 6.68 | 2.73 | 2 | 13 | 0.53 | −0.04 | 0.36 | −0.45 | 0.70 | ||
| Emotional reasoning (CDS) | 44 | 8.18 | 3.12 | 2 | 14 | 0.90 | −0.16 | 0.36 | −1.11 | 0.70 | ||
| Labeling (CDS) | 44 | 6.89 | 2.86 | 2 | 13 | 0.79 | 0.24 | 0.36 | −0.57 | 0.70 | ||
| Mental filter (CDS) | 44 | 7.30 | 3.08 | 2 | 14 | 0.86 | 0.32 | 0.36 | −0.81 | 0.70 | ||
| Hypergeneralization (CDS) | 44 | 6.75 | 3.27 | 2 | 14 | 0.74 | 0.19 | 0.36 | −1.12 | 0.70 | ||
| Personalization (CDS) | 44 | 7.27 | 2.57 | 2 | 13 | 0.72 | 0.49 | 0.36 | −0.25 | 0.70 | ||
| Doverization (CDS) | 44 | 8.95 | 2.79 | 2 | 14 | 0.58 | −0.51 | 0.36 | −0.44 | 0.70 | ||
| Minimization (CDS) | 44 | 7.30 | 2.82 | 2 | 13 | 0.78 | 0.15 | 0.36 | −0.76 | 0.70 | ||
| CDS | 44 | 76.27 | 20.84 | 29 | 117 | 0.92 | −0.24 | 0.36 | −0.30 | 0.70 | ||
| BDI | 44 | 9.02 | 7.74 | 0 | 31 | 0.89 | 1.38 | 0.36 | 1.69 | 0.70 | ||
| Type of Transition | Physiological Measures 1 | N | Missing | Mean | SE | 95% Confidence Interval | Min | Max | Skewness | Kurtosis | |||
|---|---|---|---|---|---|---|---|---|---|---|---|---|---|
| Lower | Upper | Skewness | SE | Kurtosis | SE | ||||||||
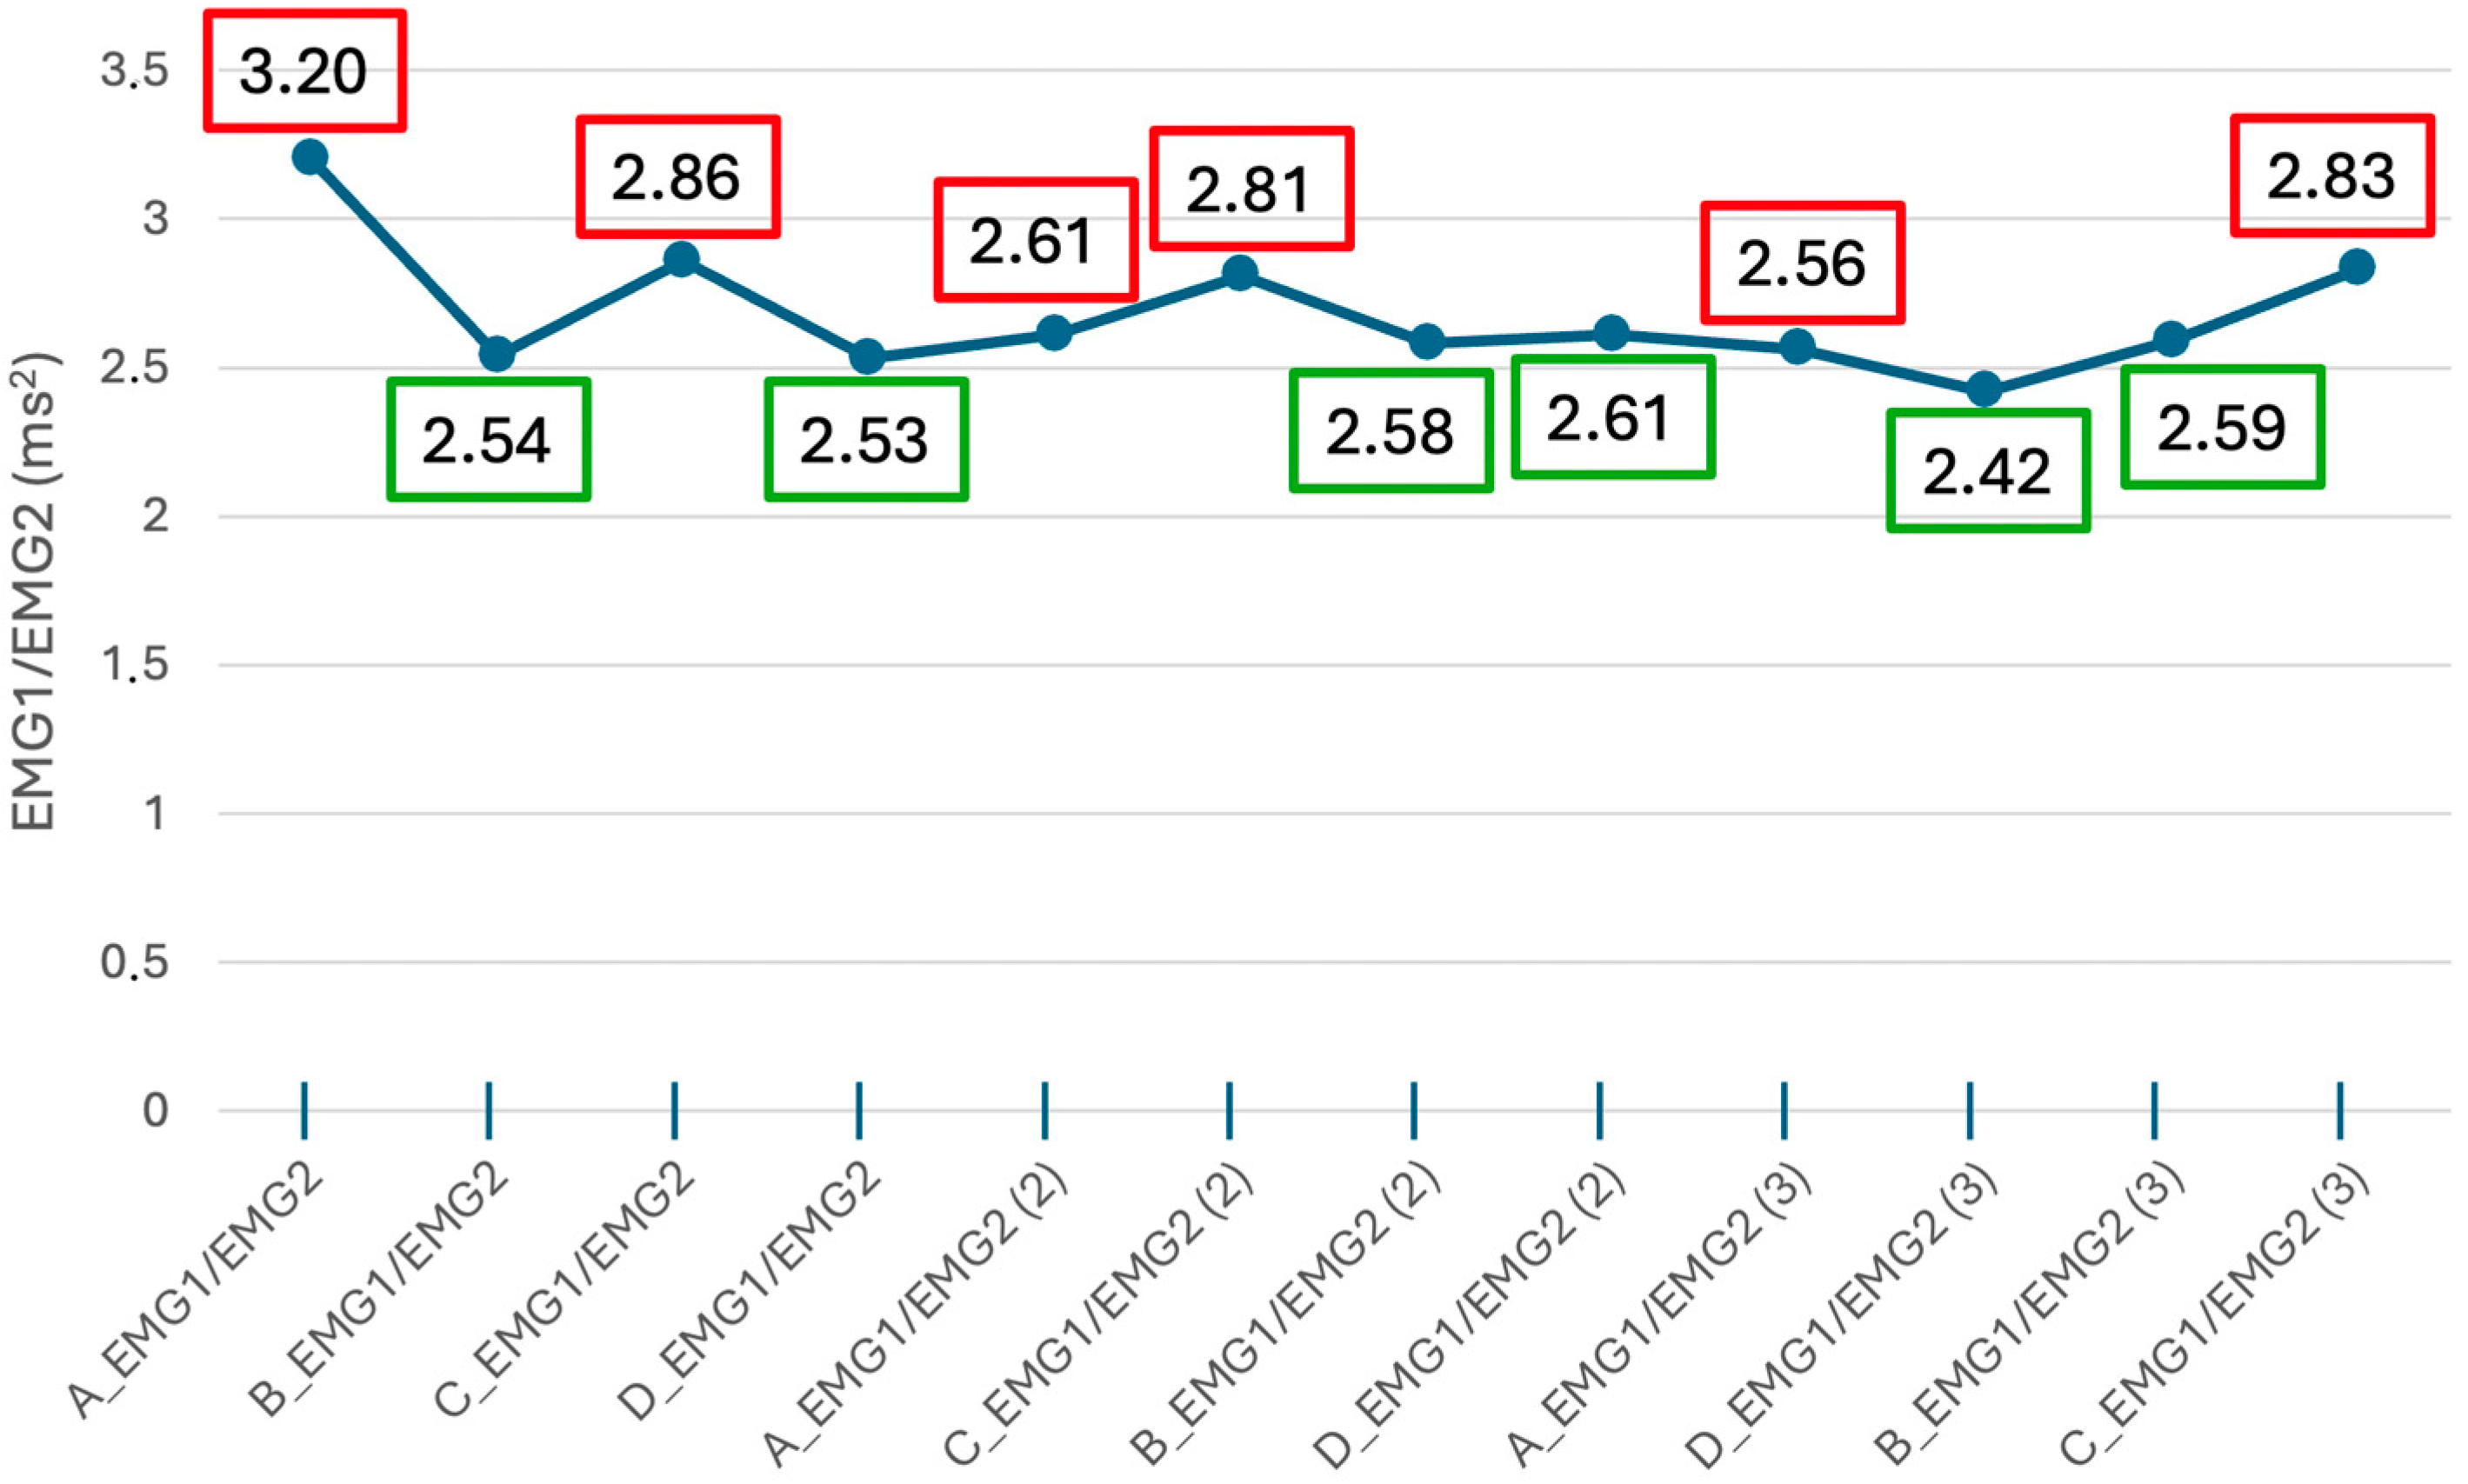
| Horizontal | AB_EMG1/EMG2 | 42 | 2 | 2.89 | 0.22 | 2.44 | 3.34 | 0.97 | 6.92 | 1.17 | 0.36 | 1.24 | 0.72 |
| BA_EMG1/EMG2 | 42 | 2 | 2.62 | 0.25 | 2.13 | 3.12 | 0.56 | 8.93 | 1.53 | 0.36 | 4.59 | 0.72 | |
| CD_EMG1/EMG2 | 42 | 2 | 2.73 | 0.24 | 2.25 | 3.21 | 0.21 | 8.09 | 1.15 | 0.36 | 2.46 | 0.72 | |
| DC_EMG1/EMG2 | 42 | 2 | 2.57 | 0.23 | 2.10 | 3.05 | 0.47 | 8.42 | 1.54 | 0.36 | 3.83 | 0.72 | |
| Vertical | AC_EMG1/EMG2 | 42 | 2 | 3.07 | 0.24 | 2.58 | 3.56 | 0.79 | 8.78 | 1.10 | 0.36 | 2.56 | 0.72 |
| CA_EMG1/EMG2 | 42 | 2 | 3.03 | 0.22 | 2.59 | 3.47 | 0.80 | 7.55 | 0.94 | 0.36 | 1.20 | 0.72 | |
| BD_EMG1/EMG2 | 42 | 2 | 2.37 | 0.23 | 1.90 | 2.84 | 0.19 | 7.21 | 1.23 | 0.36 | 1.81 | 0.72 | |
| DB_EMG1/EMG2 | 42 | 2 | 2.54 | 0.24 | 2.05 | 3.03 | 0.33 | 8.22 | 1.45 | 0.36 | 3.01 | 0.72 | |
| Oblique | AD_EMG1/EMG2 | 42 | 2 | 2.71 | 0.24 | 2.24 | 3.19 | 0.42 | 7.32 | 0.89 | 0.36 | 1.03 | 0.72 |
| DA_EMG1/EMG2 | 42 | 2 | 2.46 | 0.23 | 1.99 | 2.92 | 0.48 | 6.99 | 1.15 | 0.36 | 1.31 | 0.72 | |
| BC_EMG1/EMG2 | 42 | 2 | 2.51 | 0.24 | 2.03 | 2.99 | 0.59 | 7.90 | 1.40 | 0.36 | 2.59 | 0.72 | |
| CB_EMG1/EMG2 | 42 | 2 | 2.91 | 0.28 | 2.35 | 3.47 | 0.64 | 8.77 | 1.29 | 0.36 | 1.69 | 0.72 | |
| State–Trait | AA_EMG1/EMG2 | 42 | 2 | 2.54 | 0.21 | 2.12 | 2.96 | 0.80 | 6.46 | 1.04 | 0.36 | 1.28 | 0.72 |
| BB_EMG1/EMG2 | 42 | 2 | 2.24 | 0.24 | 1.75 | 2.74 | 0.22 | 7.21 | 1.35 | 0.36 | 1.95 | 0.72 | |
| CC_EMG1/EMG2 | 42 | 2 | 2.70 | 0.24 | 2.22 | 3.18 | 0.70 | 8.95 | 1.68 | 0.36 | 5.42 | 0.72 | |
| DD_EMG1/EMG2 | 42 | 2 | 2.21 | 0.23 | 1.74 | 2.68 | 0.32 | 6.49 | 1.17 | 0.36 | 1.02 | 0.72 | |
| Self-Report Measure 1 | EMG1/EMG2 Amplitude (ms2) Transition | Correlation Value | 95% CI |
|---|---|---|---|
| BDI | AB (from Stress to Engagement) | ρ = 0.317; p < 0.05 | [0.008, 0.564] |
| CD (from Boredom to Relax) | ρ = 0.314; p < 0.05 | [0.010, 0.579] | |
| DB (from Relax to Engagement) | ρ = 0.364; p < 0.05 | [0.061, 0.600] | |
| DA (from Relax to Stress) | ρ = 0.320; p < 0.05 | [−0.012, 0.583] | |
| BC (from Engagement to Boredom) | ρ = 0.319; p < 0.05 | [0.016, 0.575] | |
| CB (from Boredom to Engagement) | ρ = 0.383; p < 0.05 | [0.084, 0.624] | |
| Catastrophizing (CDS) | AB (from Stress to Engagement) | ρ = 0.349; p < 0.05 | [0.032, 0.594] |
| BD (from Engagement to Relax) | ρ = 0.383; p < 0.05 | [0.050, 0.656] | |
| DA (from Relax to Stress) | ρ = 0.333; p < 0.05 | [−0.058, 0.617] | |
| CB (from Boredom to Engagement) | ρ = 0.368; p < 0.05 | [0.063, 0.610] | |
| All-or-Nothing Thinking (CDS) | BD (from Engagement to Relax) | ρ = 0.347; p < 0.05 | [0.050, 0.608] |
| Should Statements (CDS) | CD (from Boredom to Relax) | ρ = 0.316; p < 0.05 | [−0.004, 0.538] |
| DC (from Relax to Boredom) | ρ = 0.332; p < 0.05 | [0.034, 0.601] | |
| CA (from Boredom to Stress) | ρ = 0.307; p < 0.05 | [−0.003, 0.580] | |
| DB (from Relax to Engagement) | ρ = 0.356; p < 0.05 | [0.008, 0.564] | |
| CB (from Boredom to Engagement) | ρ = 0.358; p < 0.05 | [0.033, 0.600] | |
| Minimization (CDS) | CD (from Boredom to Relax) | ρ = 0.364; p < 0.05 | [0.067, 0.627] |
| DB (from Relax to Engagement) | ρ = 0.407; p < 0.01 | [0.132, 0.646] | |
| DC (from Relax to Boredom) | ρ = 0.322; p < 0.05 | [0.016, 0.574] | |
| DA (from Relax to Stress) | ρ = 0.386; p < 0.05 | [0.110, 0.614] | |
| BC (from Engagement to Boredom) | ρ = 0.312; p < 0.05 | [0.052, 0.552] | |
| CB (from Boredom to Engagement) | ρ = 0.379; p < 0.05 | [0.131, 0.597] | |
| CDS | AB (from Stress to Engagement) | ρ = 0.318; p < 0.05 | [0.030, 0.551] |
| DB (from Relax to Engagement) | ρ = 0.314; p < 0.05 | [0.003, 0.572] | |
| CB (from Boredom to Engagement) | ρ = 0.318; p < 0.05 | [0.049, 0.562] |
| Self-Report Measure 1 | EMG1/EMG2 Amplitude (ms2) State–Trait | Correlation Value | 95% CI |
|---|---|---|---|
| BDI | BB (Engagement States) | ρ = 0.312; p < 0.05 | [−0.003, 0.394] |
| CDS | DD (Relaxation States) | ρ = 0.373; p < 0.05 | [0.075, 0.636] |
| Should Statements (CDS) | DD (Relaxation States) | ρ = 0.426; p < 0.01 | [0.109, 0.667] |
| All-or-Nothing Thinking (CDS) | DD (Relaxation States) | ρ = 0.437; p < 0.01 | [0.173, 0.642] |
| Minimization (CDS) | BB (Engagement States) | ρ = 0.383; p < 0.05 | [0.100, 0.616] |
| DD (Relaxation States) | ρ = 0.391; p < 0.05 | [0.119, 0.604] | |
| Catastrophizing (CDS) | BB (Engagement States) | ρ = 0.372; p < 0.05 | [0.074, 0.621] |
| DD (Relaxation States) | ρ = 0.352; p < 0.05 | [0.056, 0.599] |
Disclaimer/Publisher’s Note: The statements, opinions and data contained in all publications are solely those of the individual author(s) and contributor(s) and not of MDPI and/or the editor(s). MDPI and/or the editor(s) disclaim responsibility for any injury to people or property resulting from any ideas, methods, instructions or products referred to in the content. |
© 2024 by the authors. Licensee MDPI, Basel, Switzerland. This article is an open access article distributed under the terms and conditions of the Creative Commons Attribution (CC BY) license (https://creativecommons.org/licenses/by/4.0/).
Share and Cite
Simoncini, G.; Borghesi, F.; Cipresso, P. Linking Affect Dynamics and Well-Being: A Novel Methodological Approach for Mental Health. Healthcare 2024, 12, 1690. https://doi.org/10.3390/healthcare12171690
Simoncini G, Borghesi F, Cipresso P. Linking Affect Dynamics and Well-Being: A Novel Methodological Approach for Mental Health. Healthcare. 2024; 12(17):1690. https://doi.org/10.3390/healthcare12171690
Chicago/Turabian StyleSimoncini, Gloria, Francesca Borghesi, and Pietro Cipresso. 2024. "Linking Affect Dynamics and Well-Being: A Novel Methodological Approach for Mental Health" Healthcare 12, no. 17: 1690. https://doi.org/10.3390/healthcare12171690