


Blood Cell Ratios Unveiled: Predictive Markers of Myocardial Infarction Prognosis
 , and
, and 
Abstract
:1. Introduction
2. Materials and Methods
2.1. Study Design and Study Population
2.2. Statistical Analysis
3. Results
3.1. NRR and Its Predictive Value in NSTEMI Prognosis
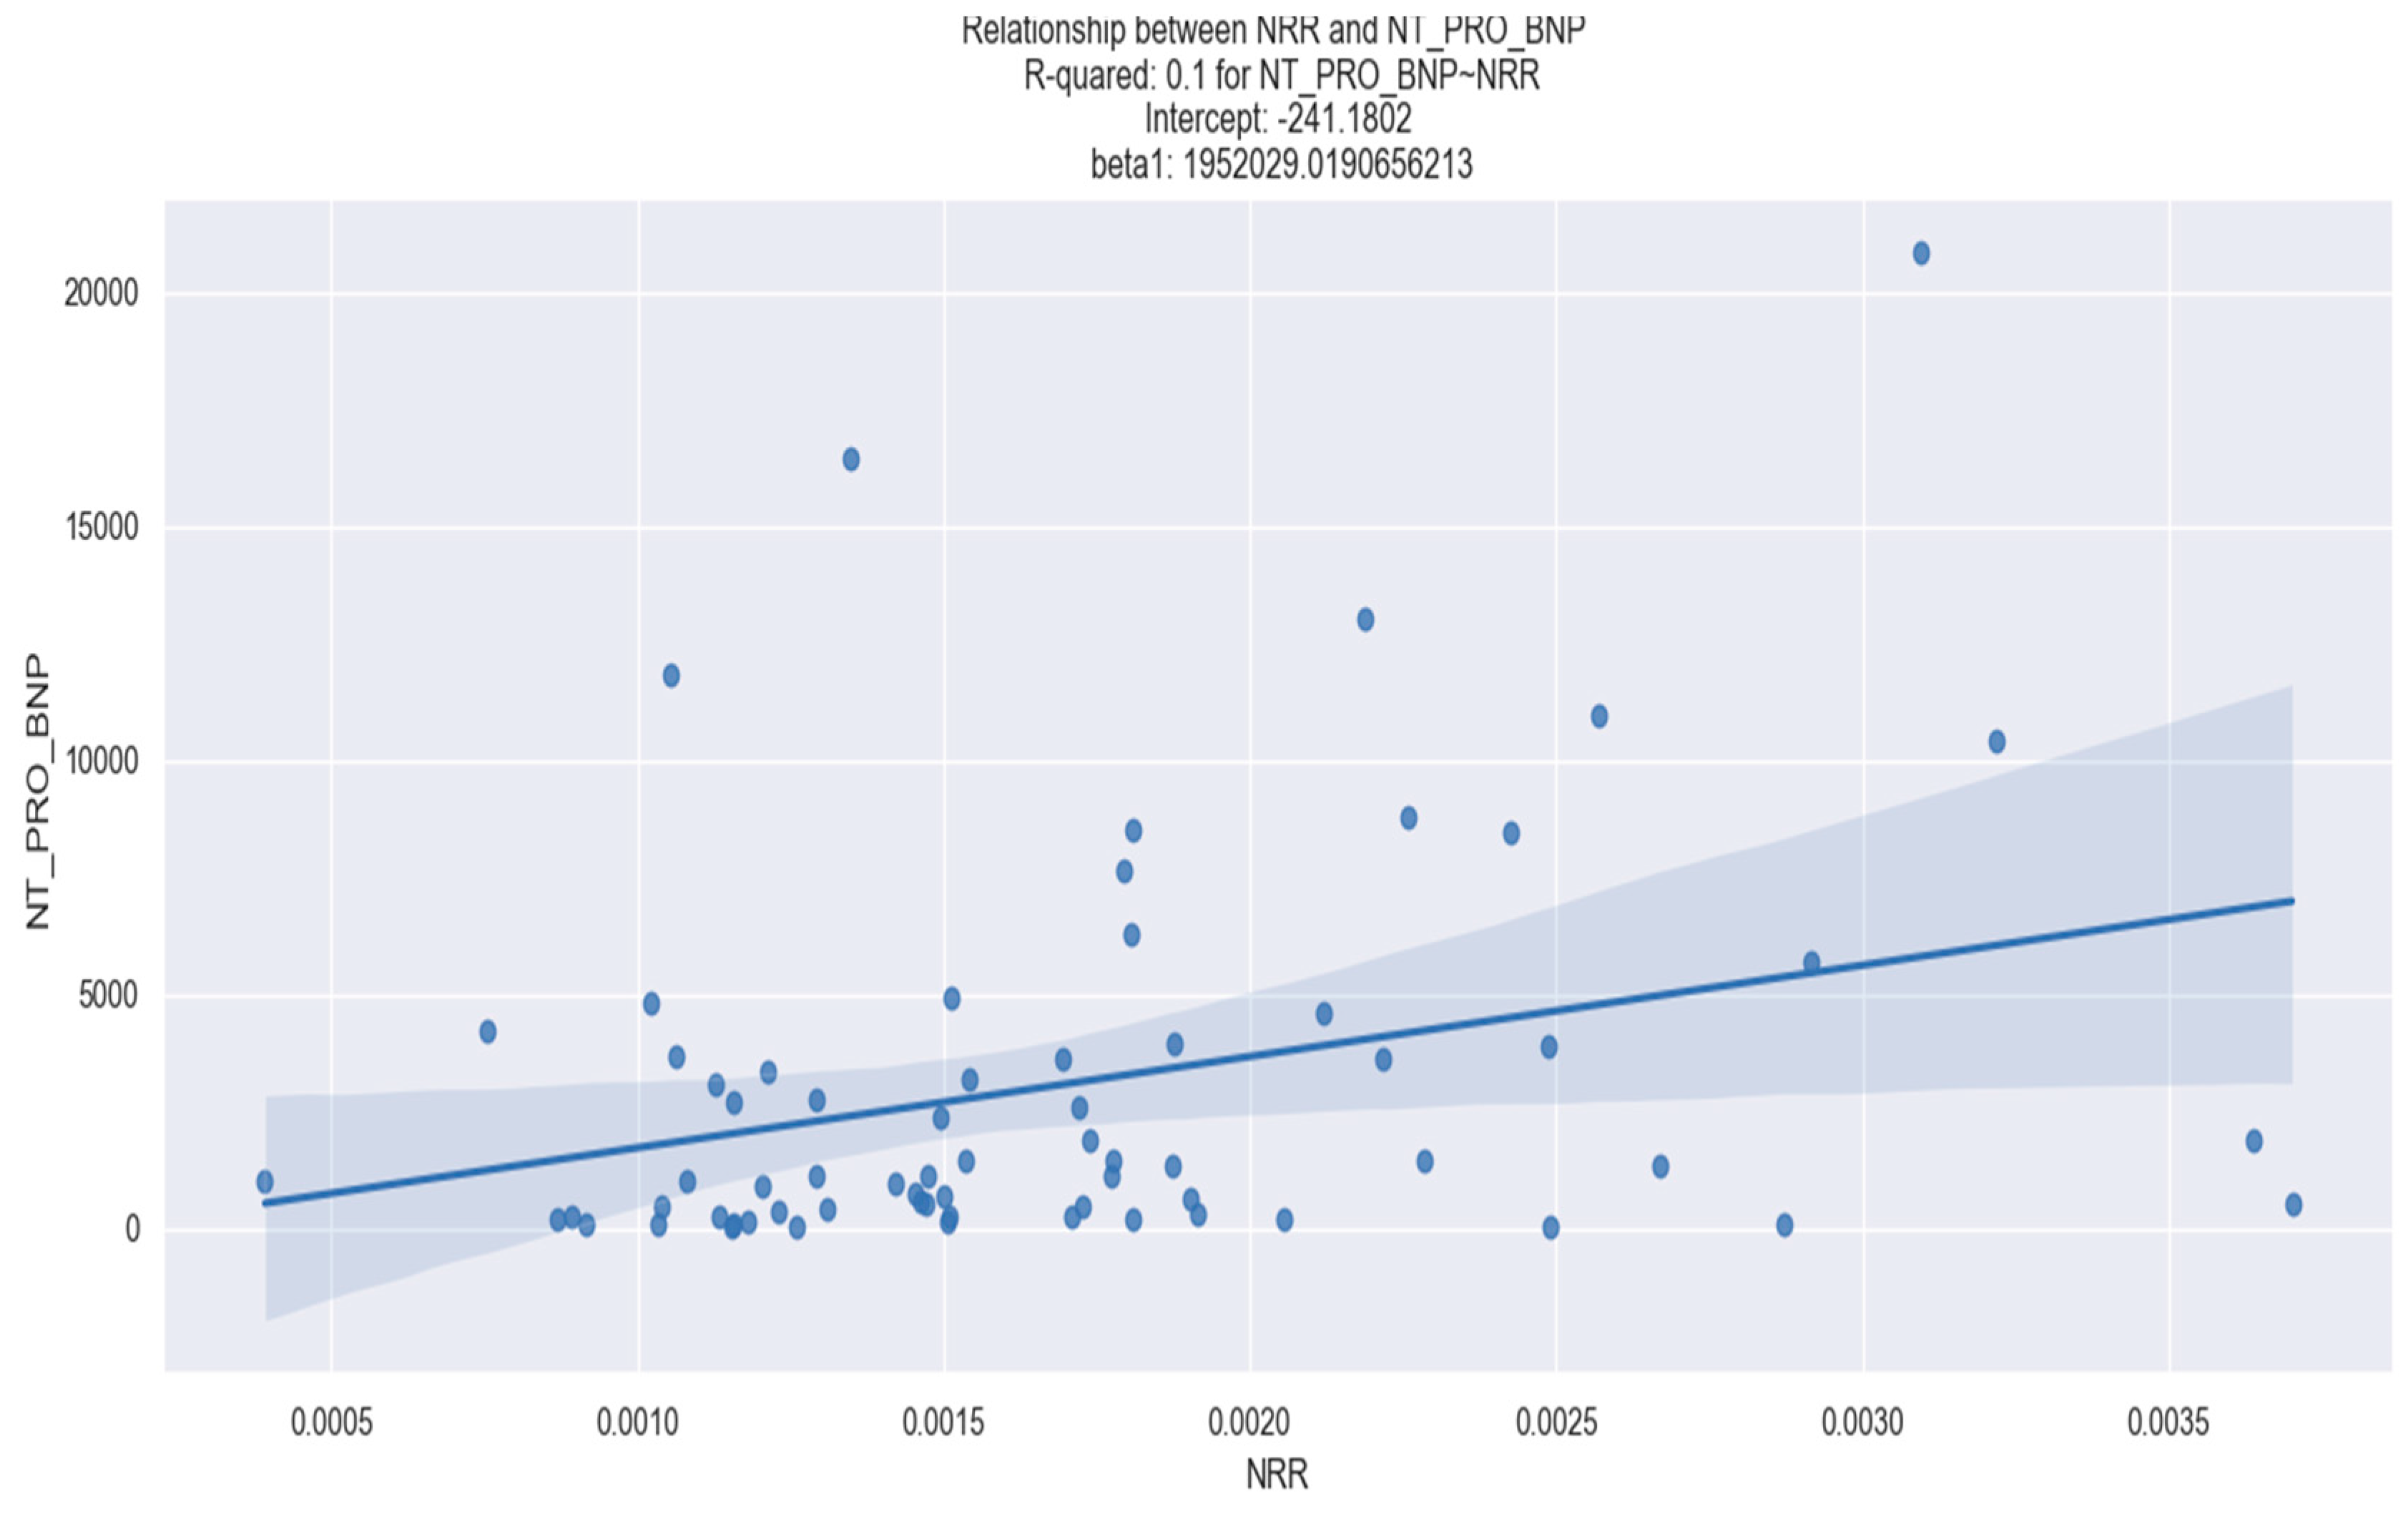
3.1.1. Correlation between NRR and Laboratory Parameters
3.1.2. Correlation between NRR and Clinical Outcomes
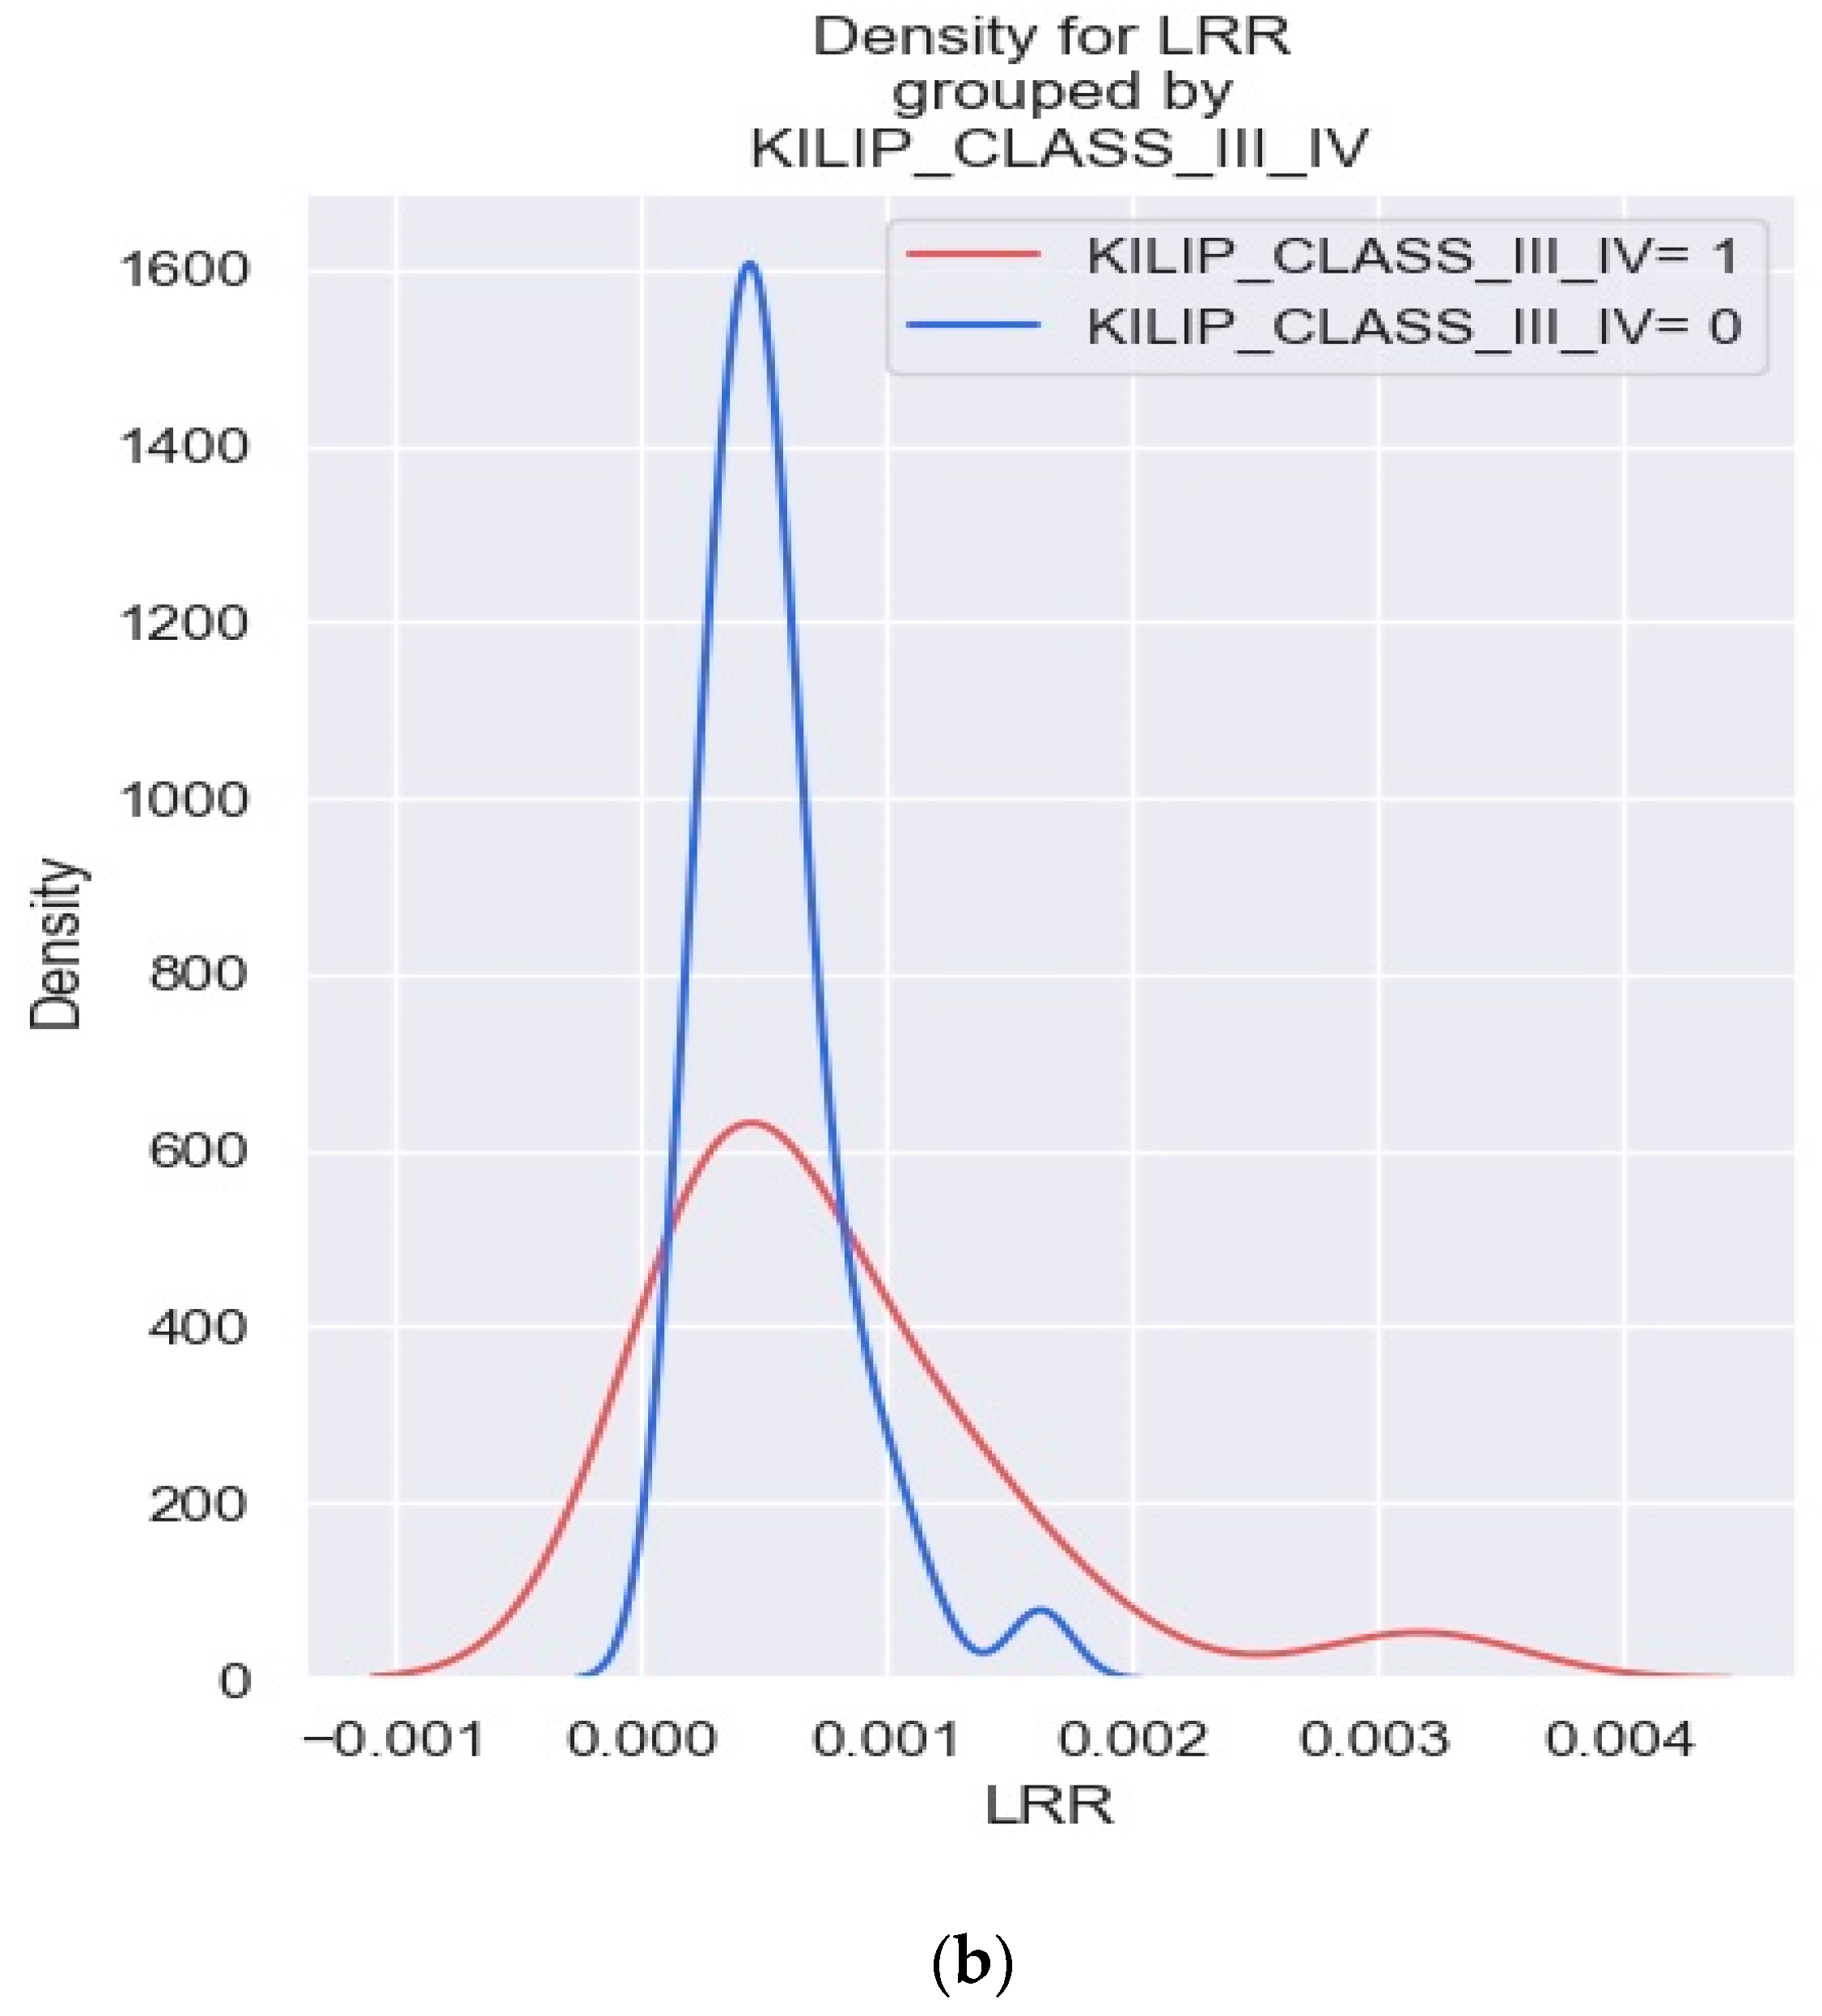
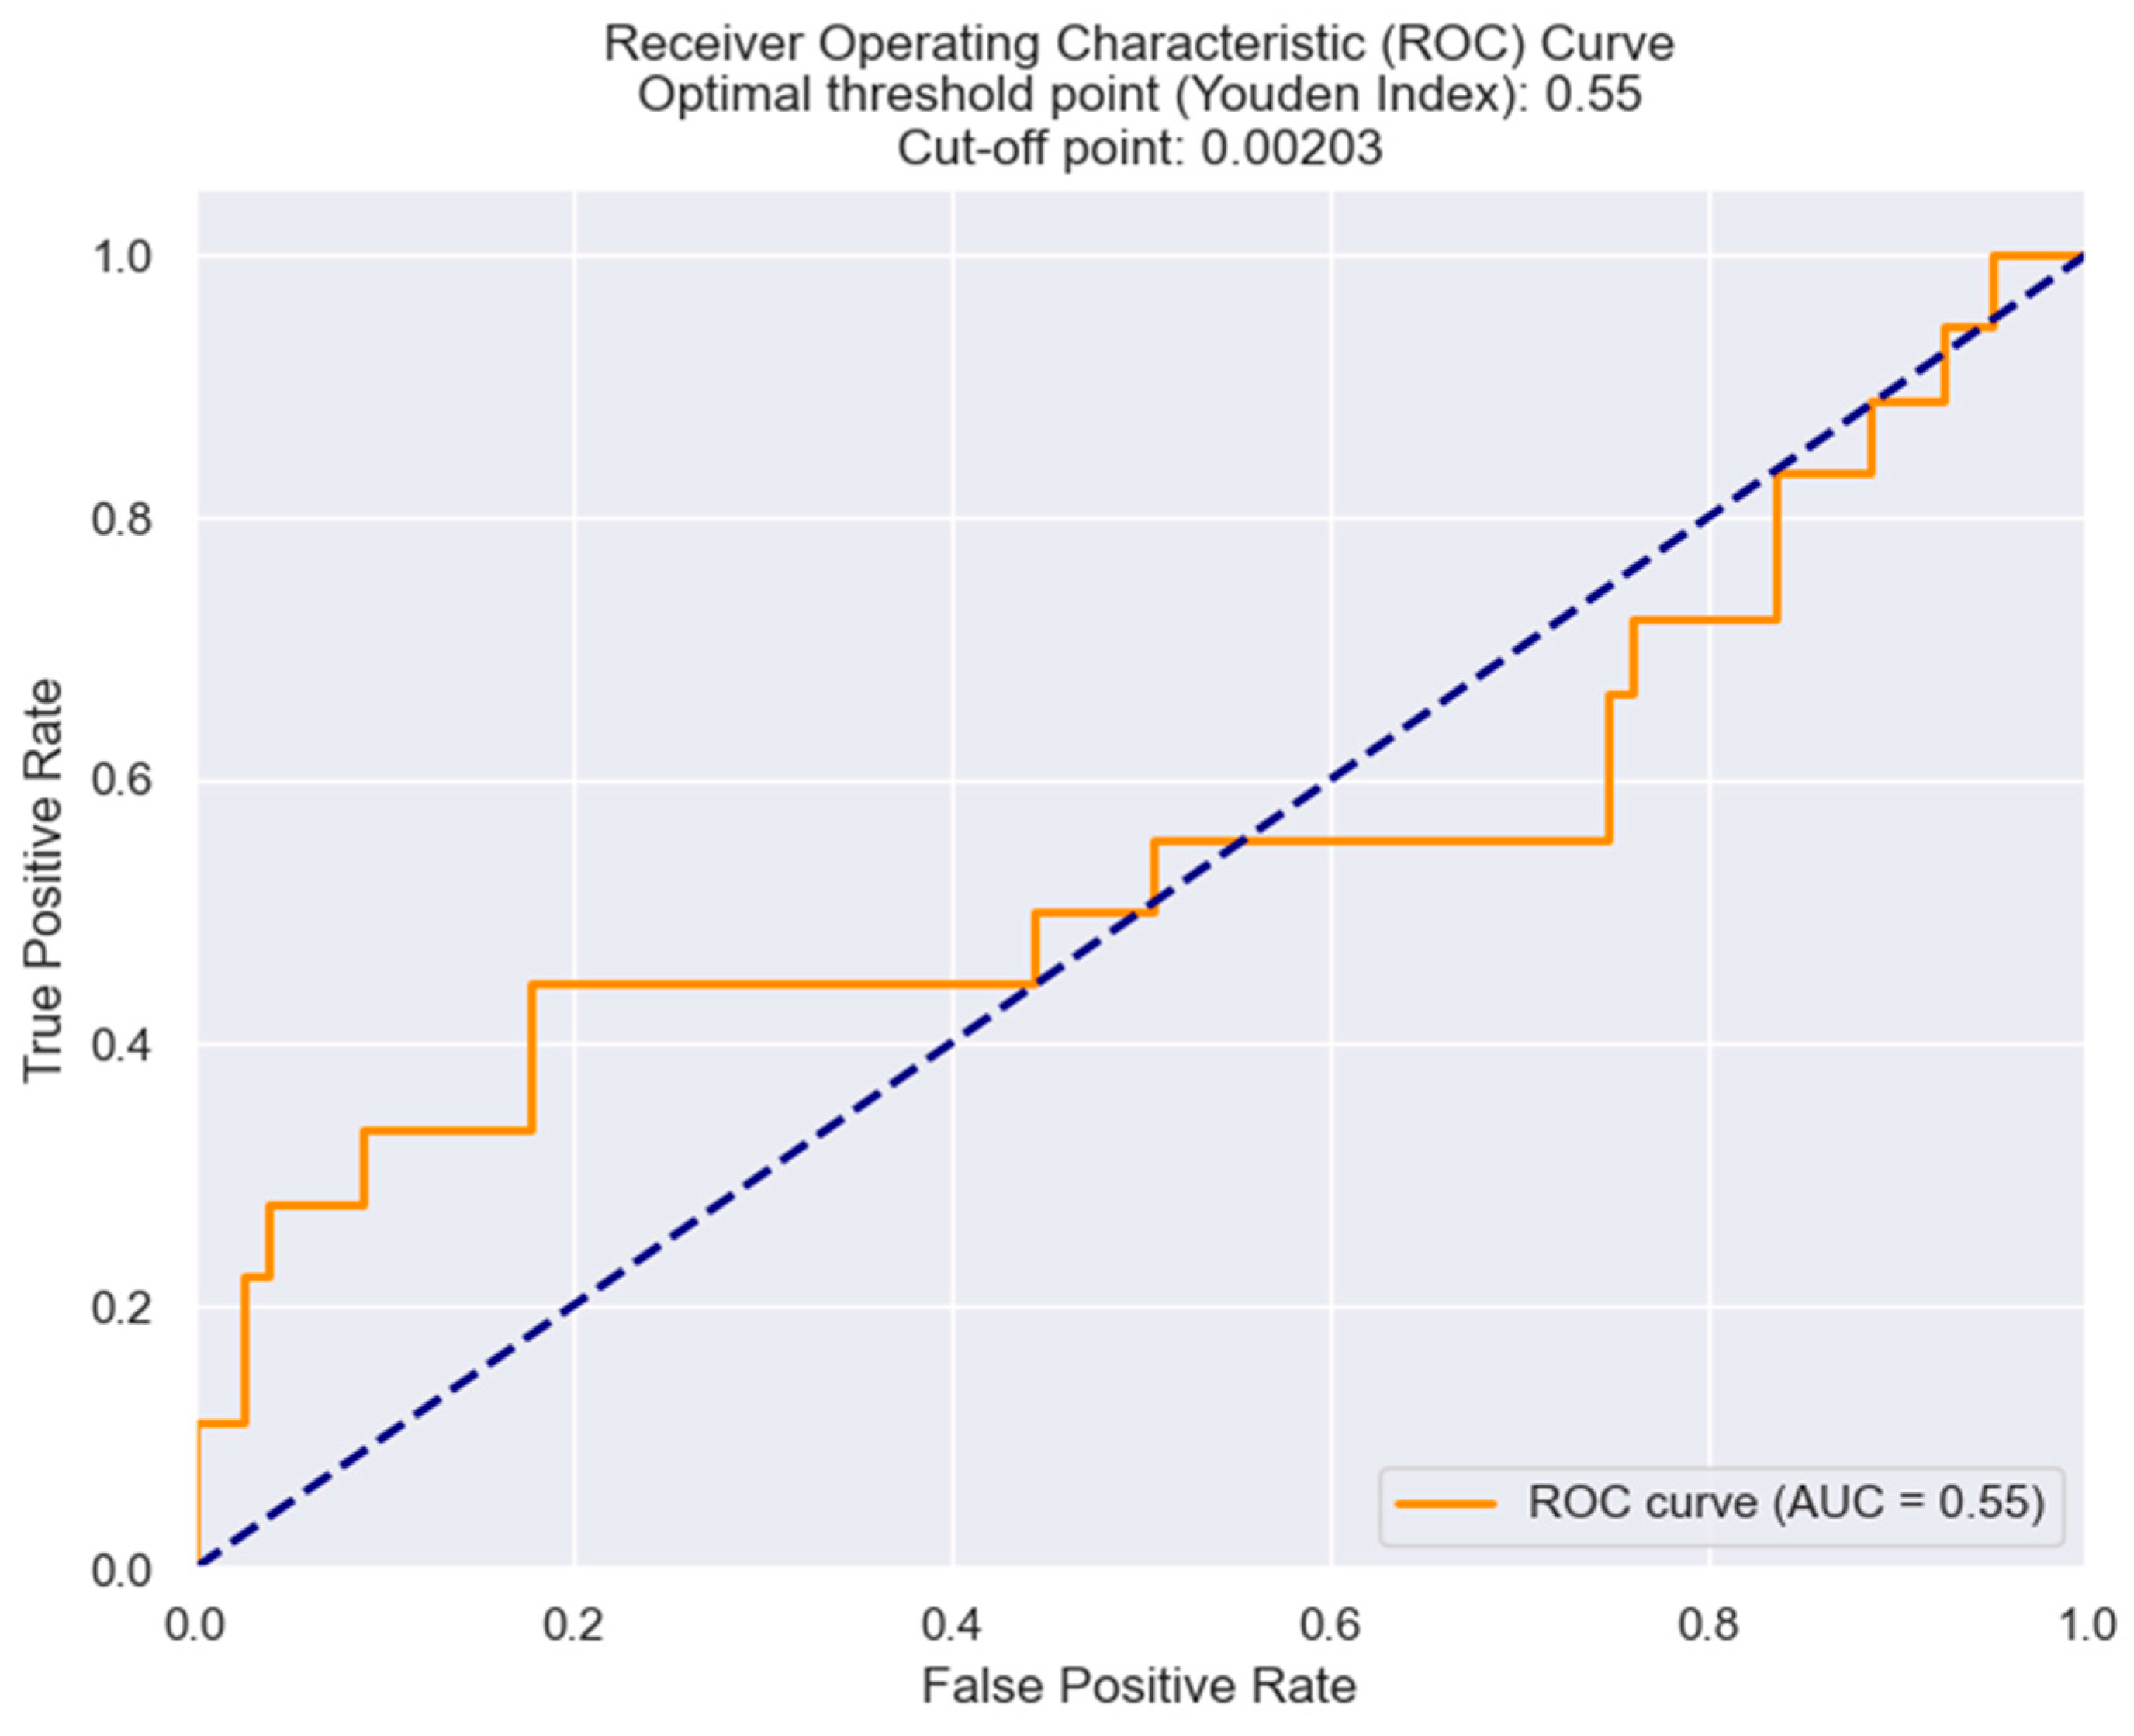
3.2. LRR and Its Predictive Value in NSTEMI Prognosis
3.2.1. Correlation between LRR and Laboratory Parameters
3.2.2. Correlation between NRR and Clinical Outcomes
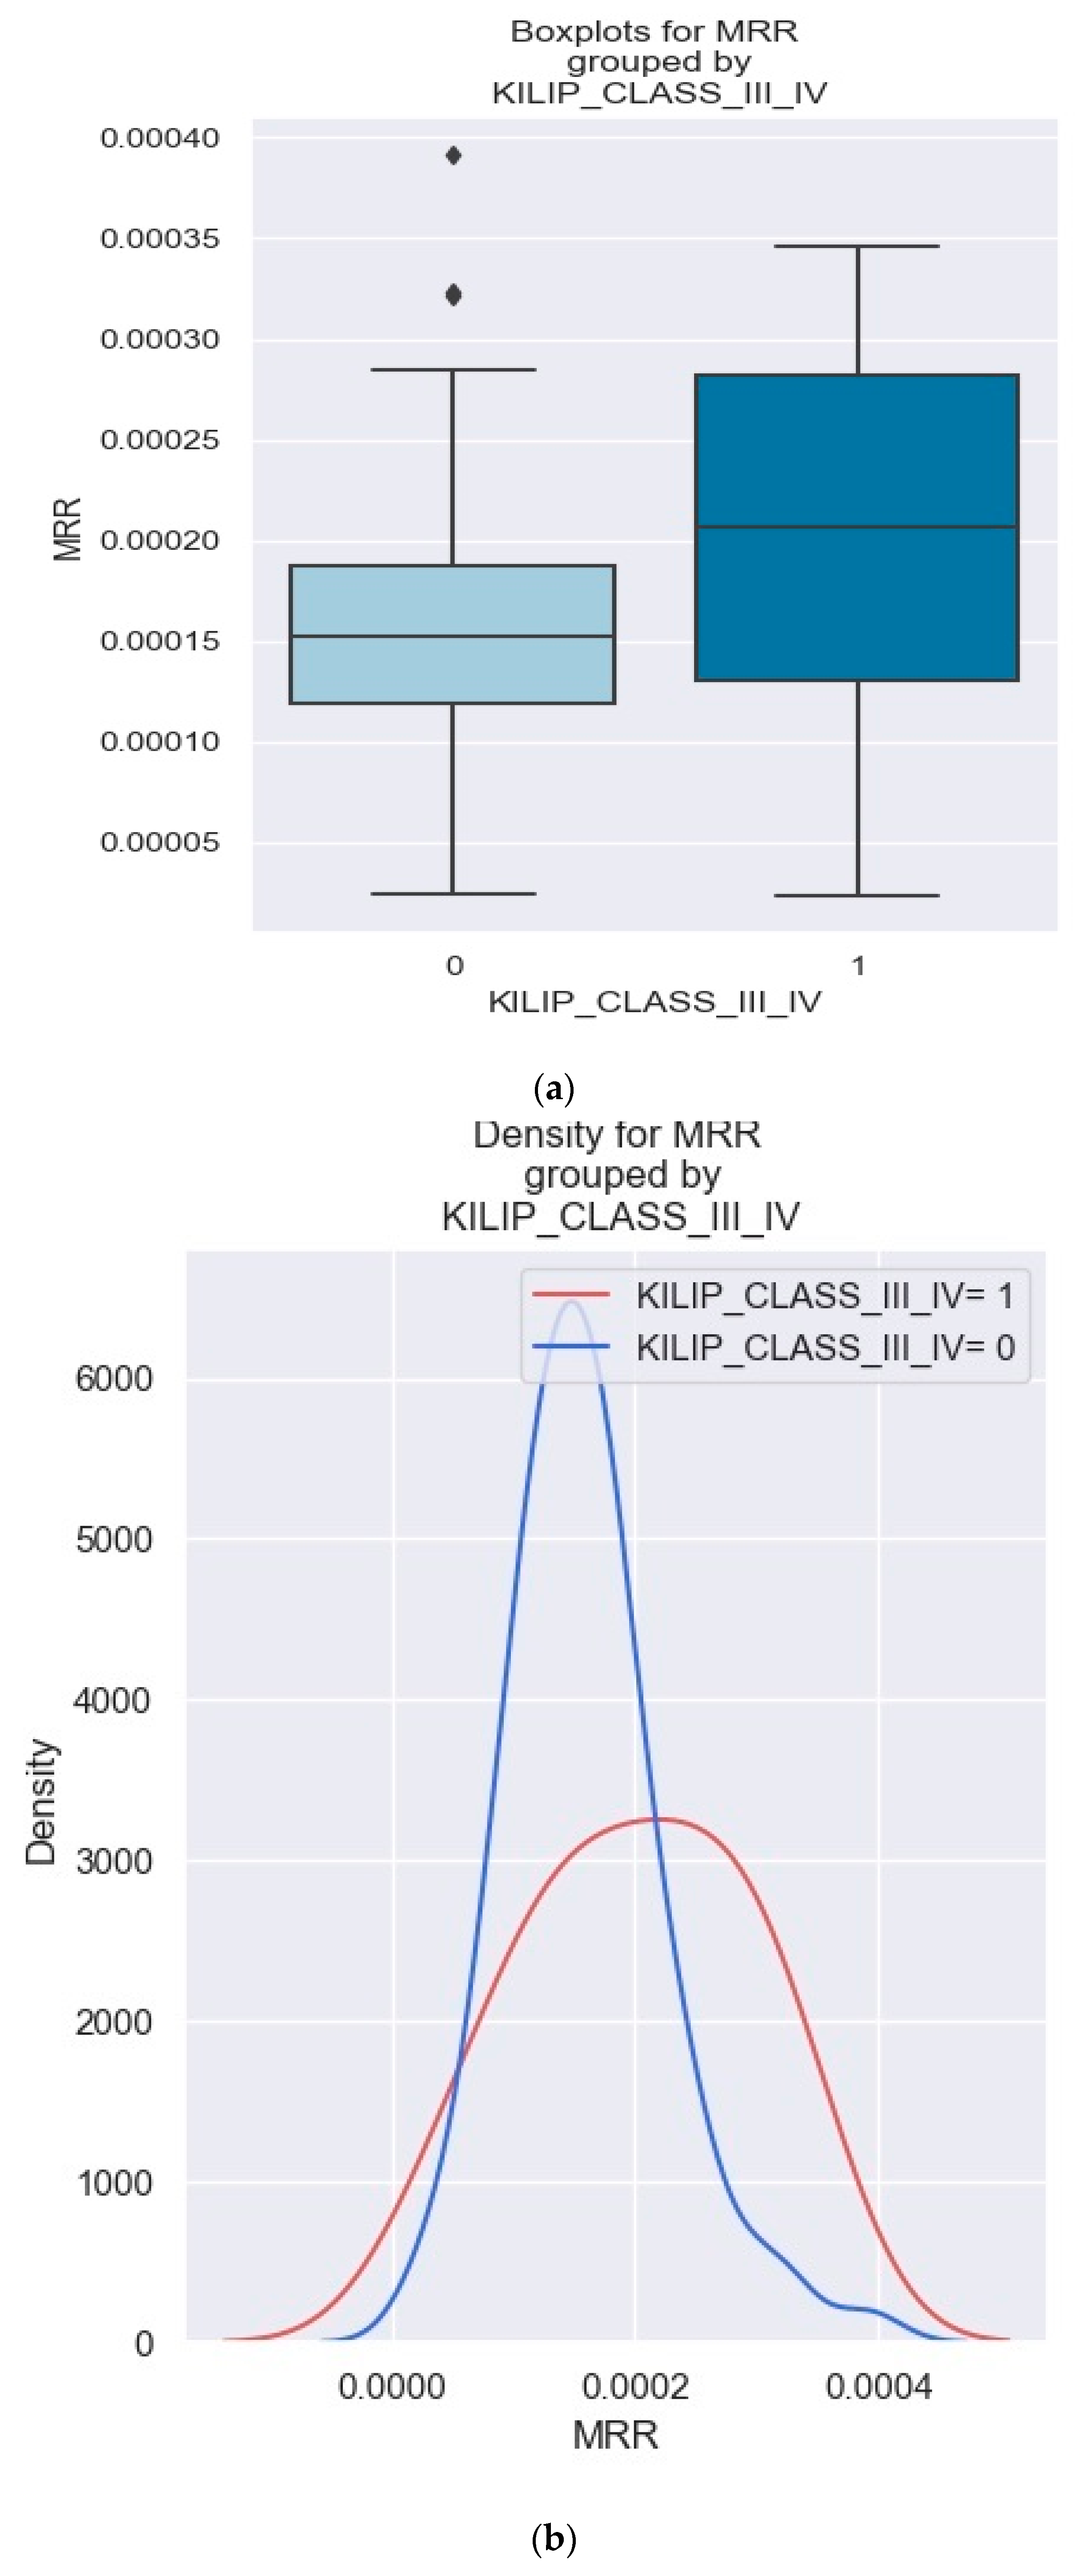
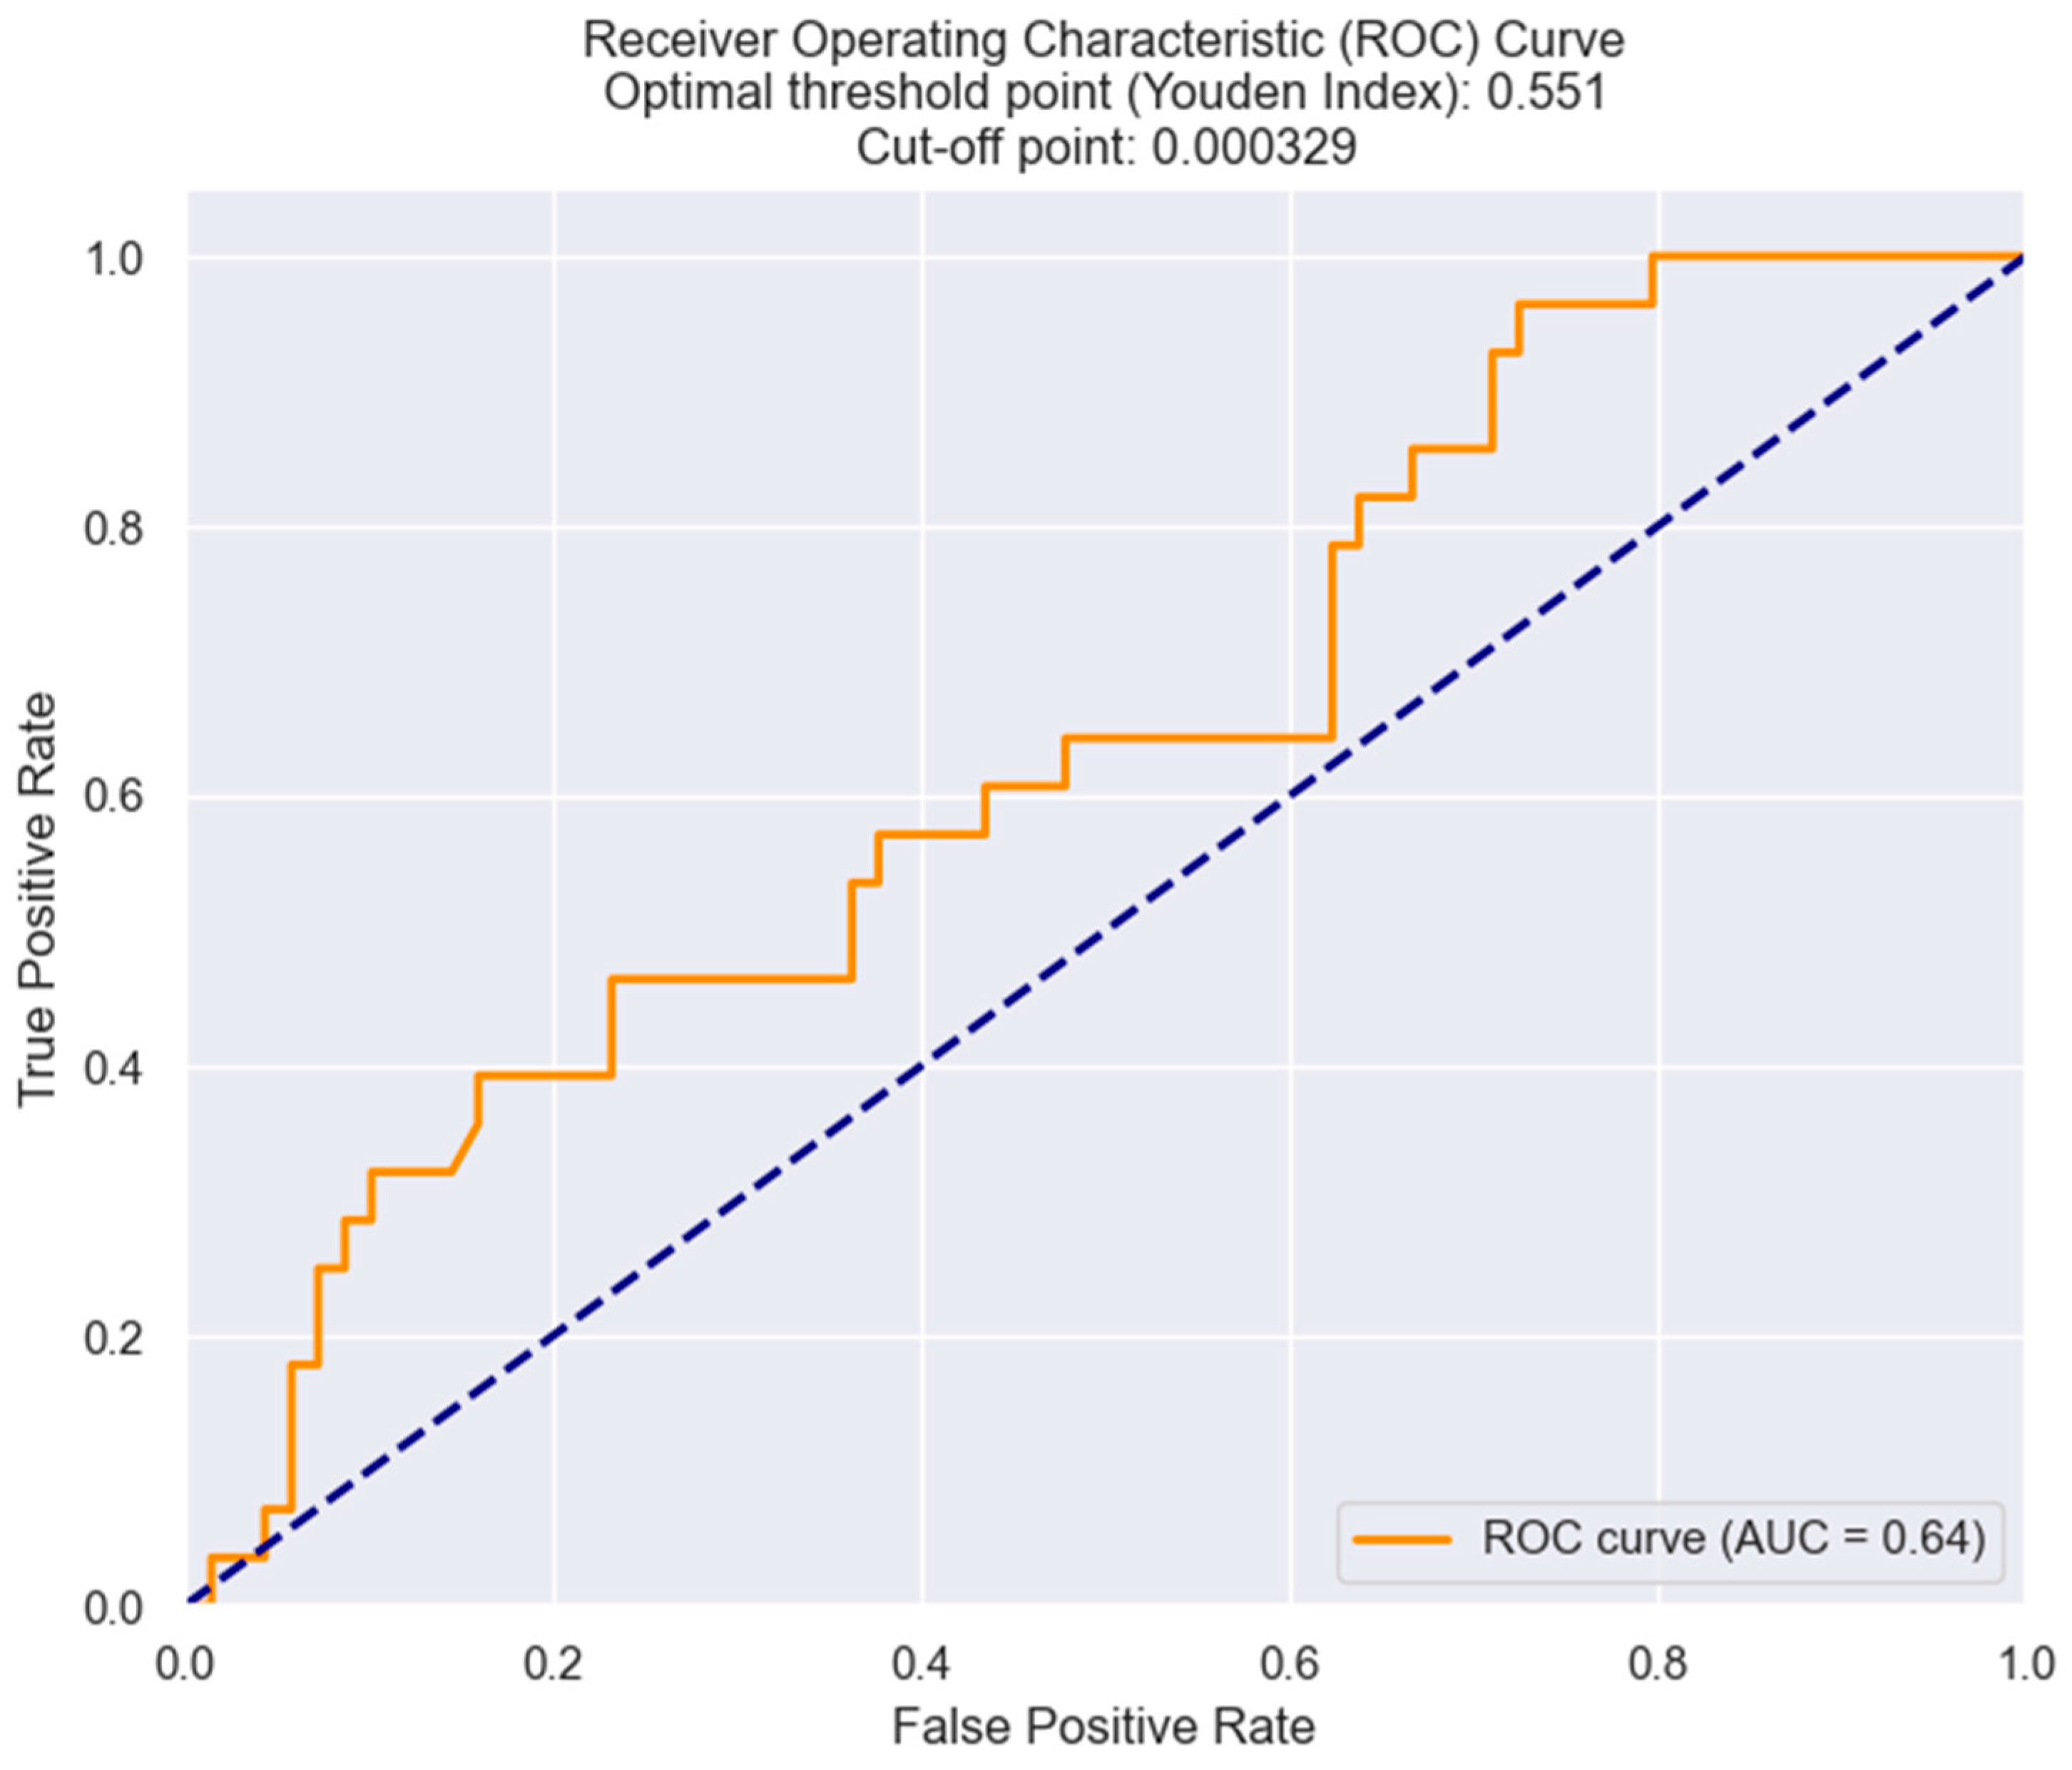
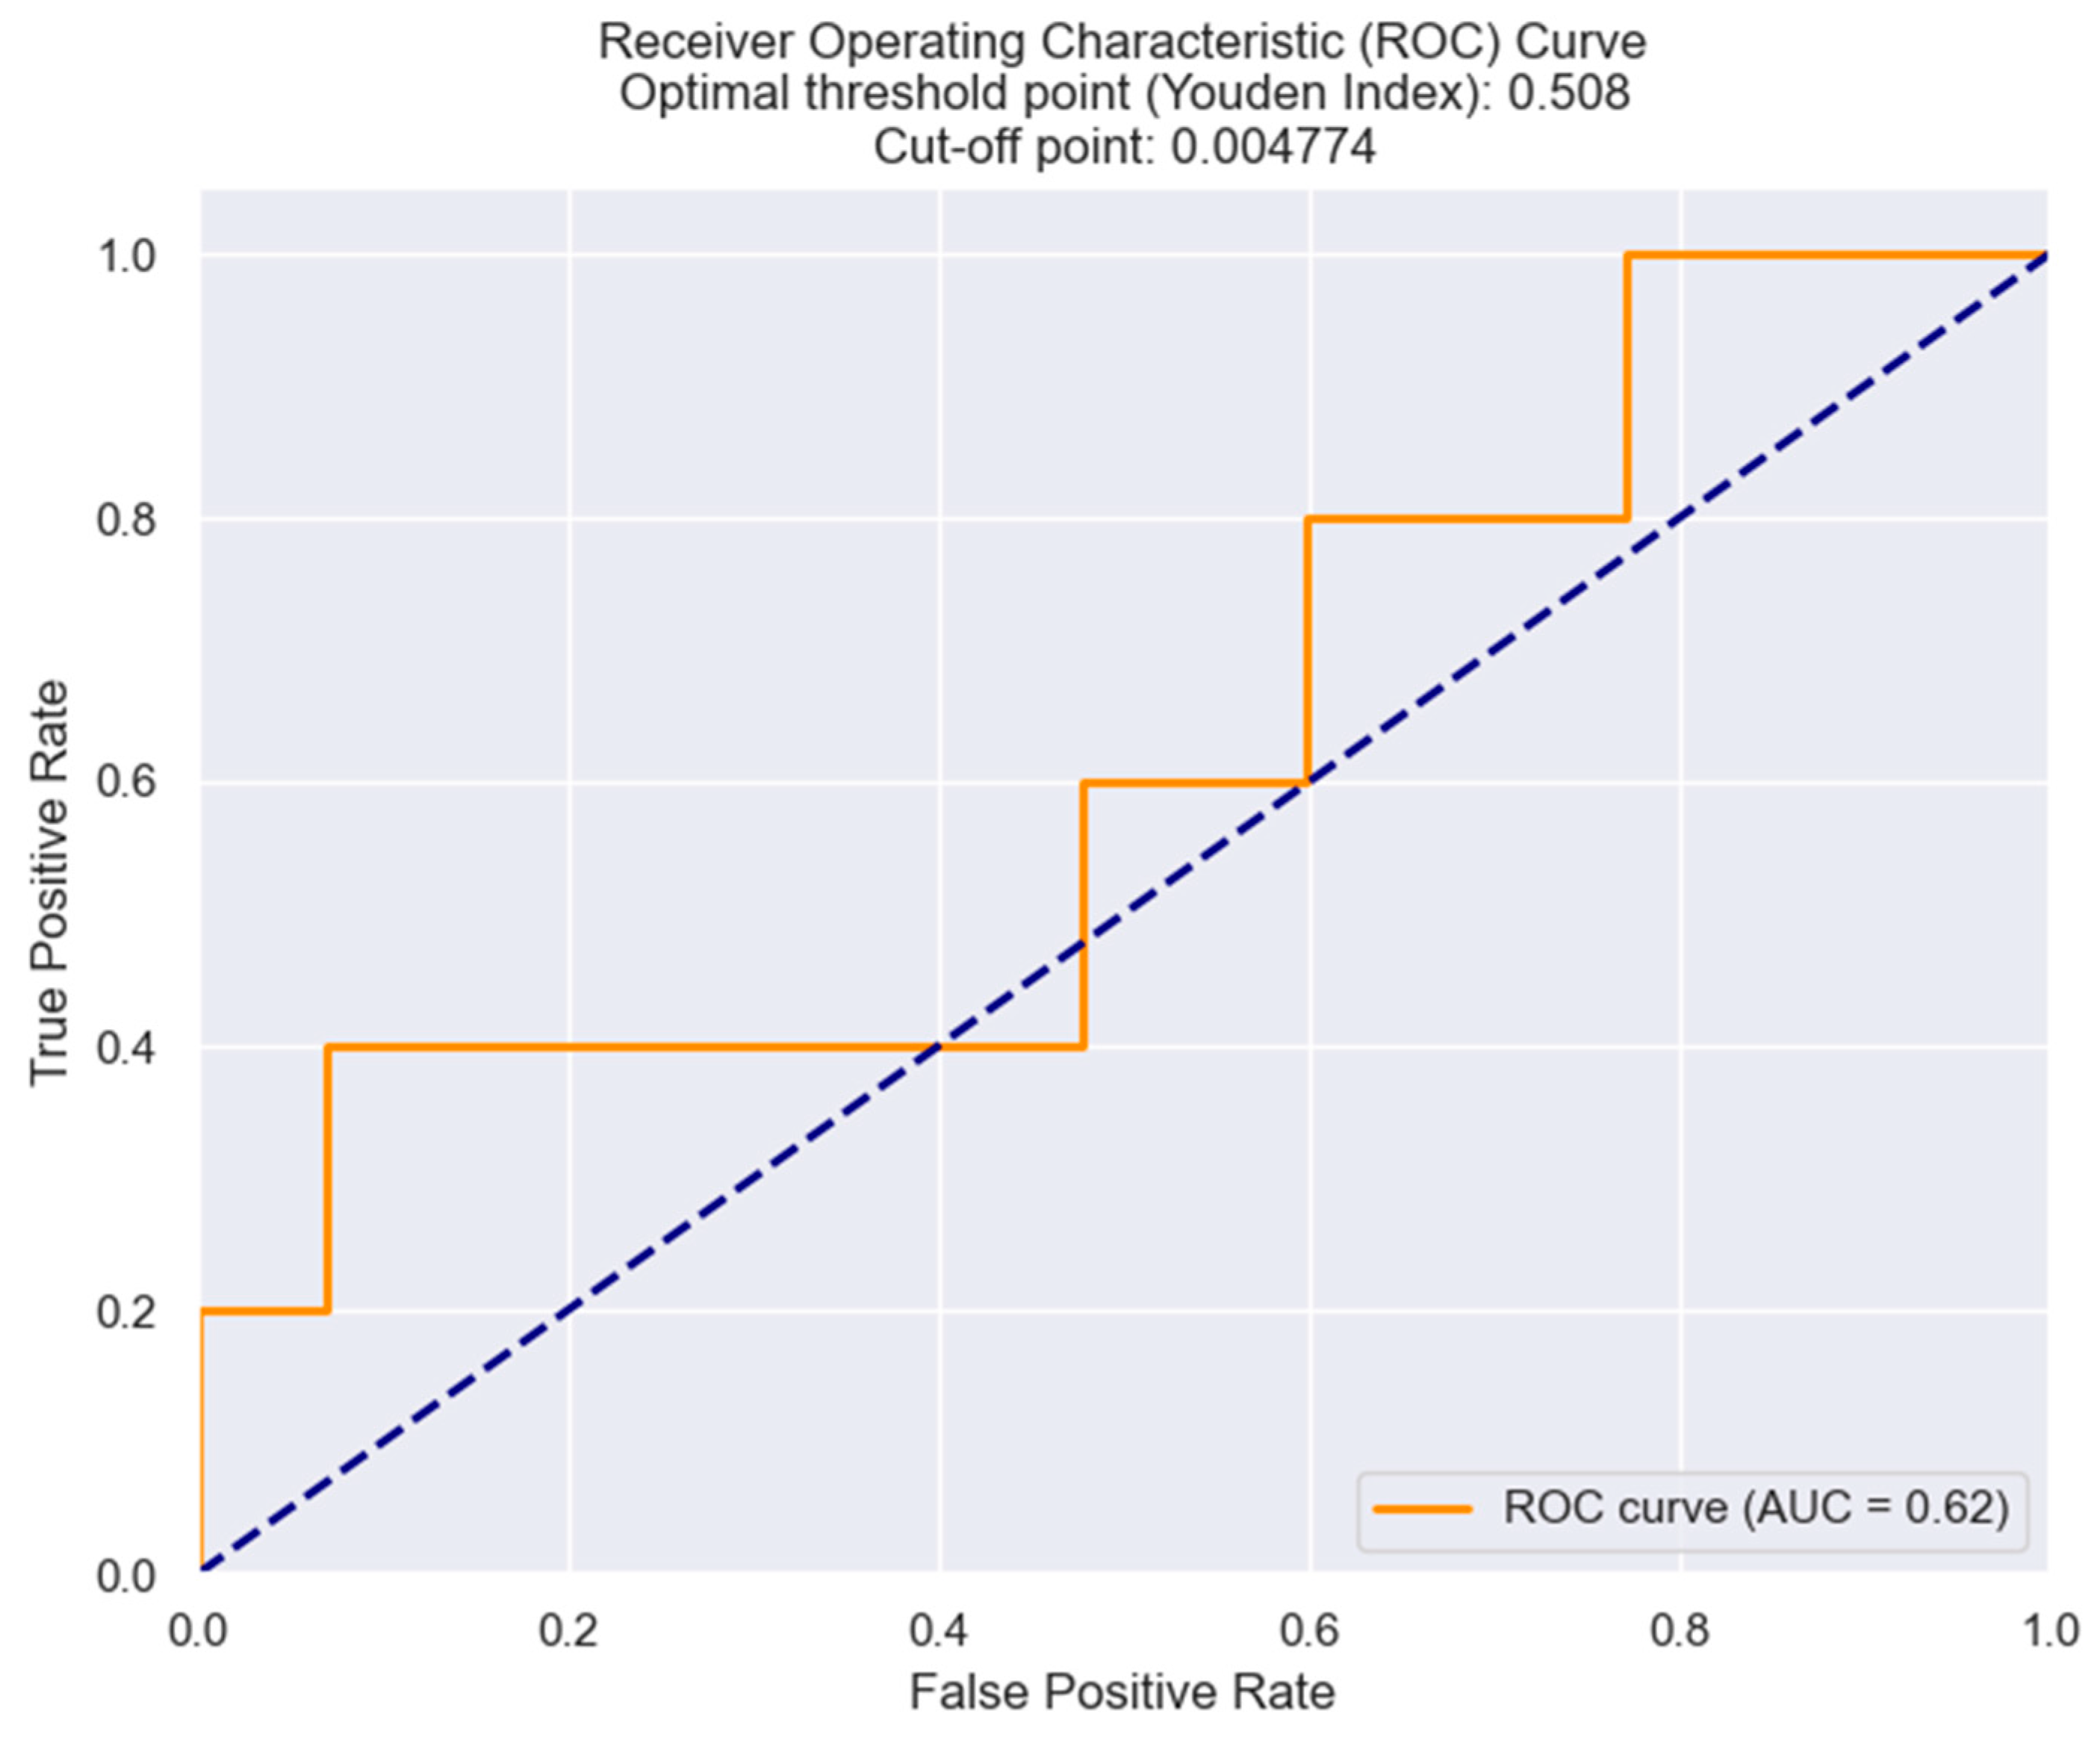
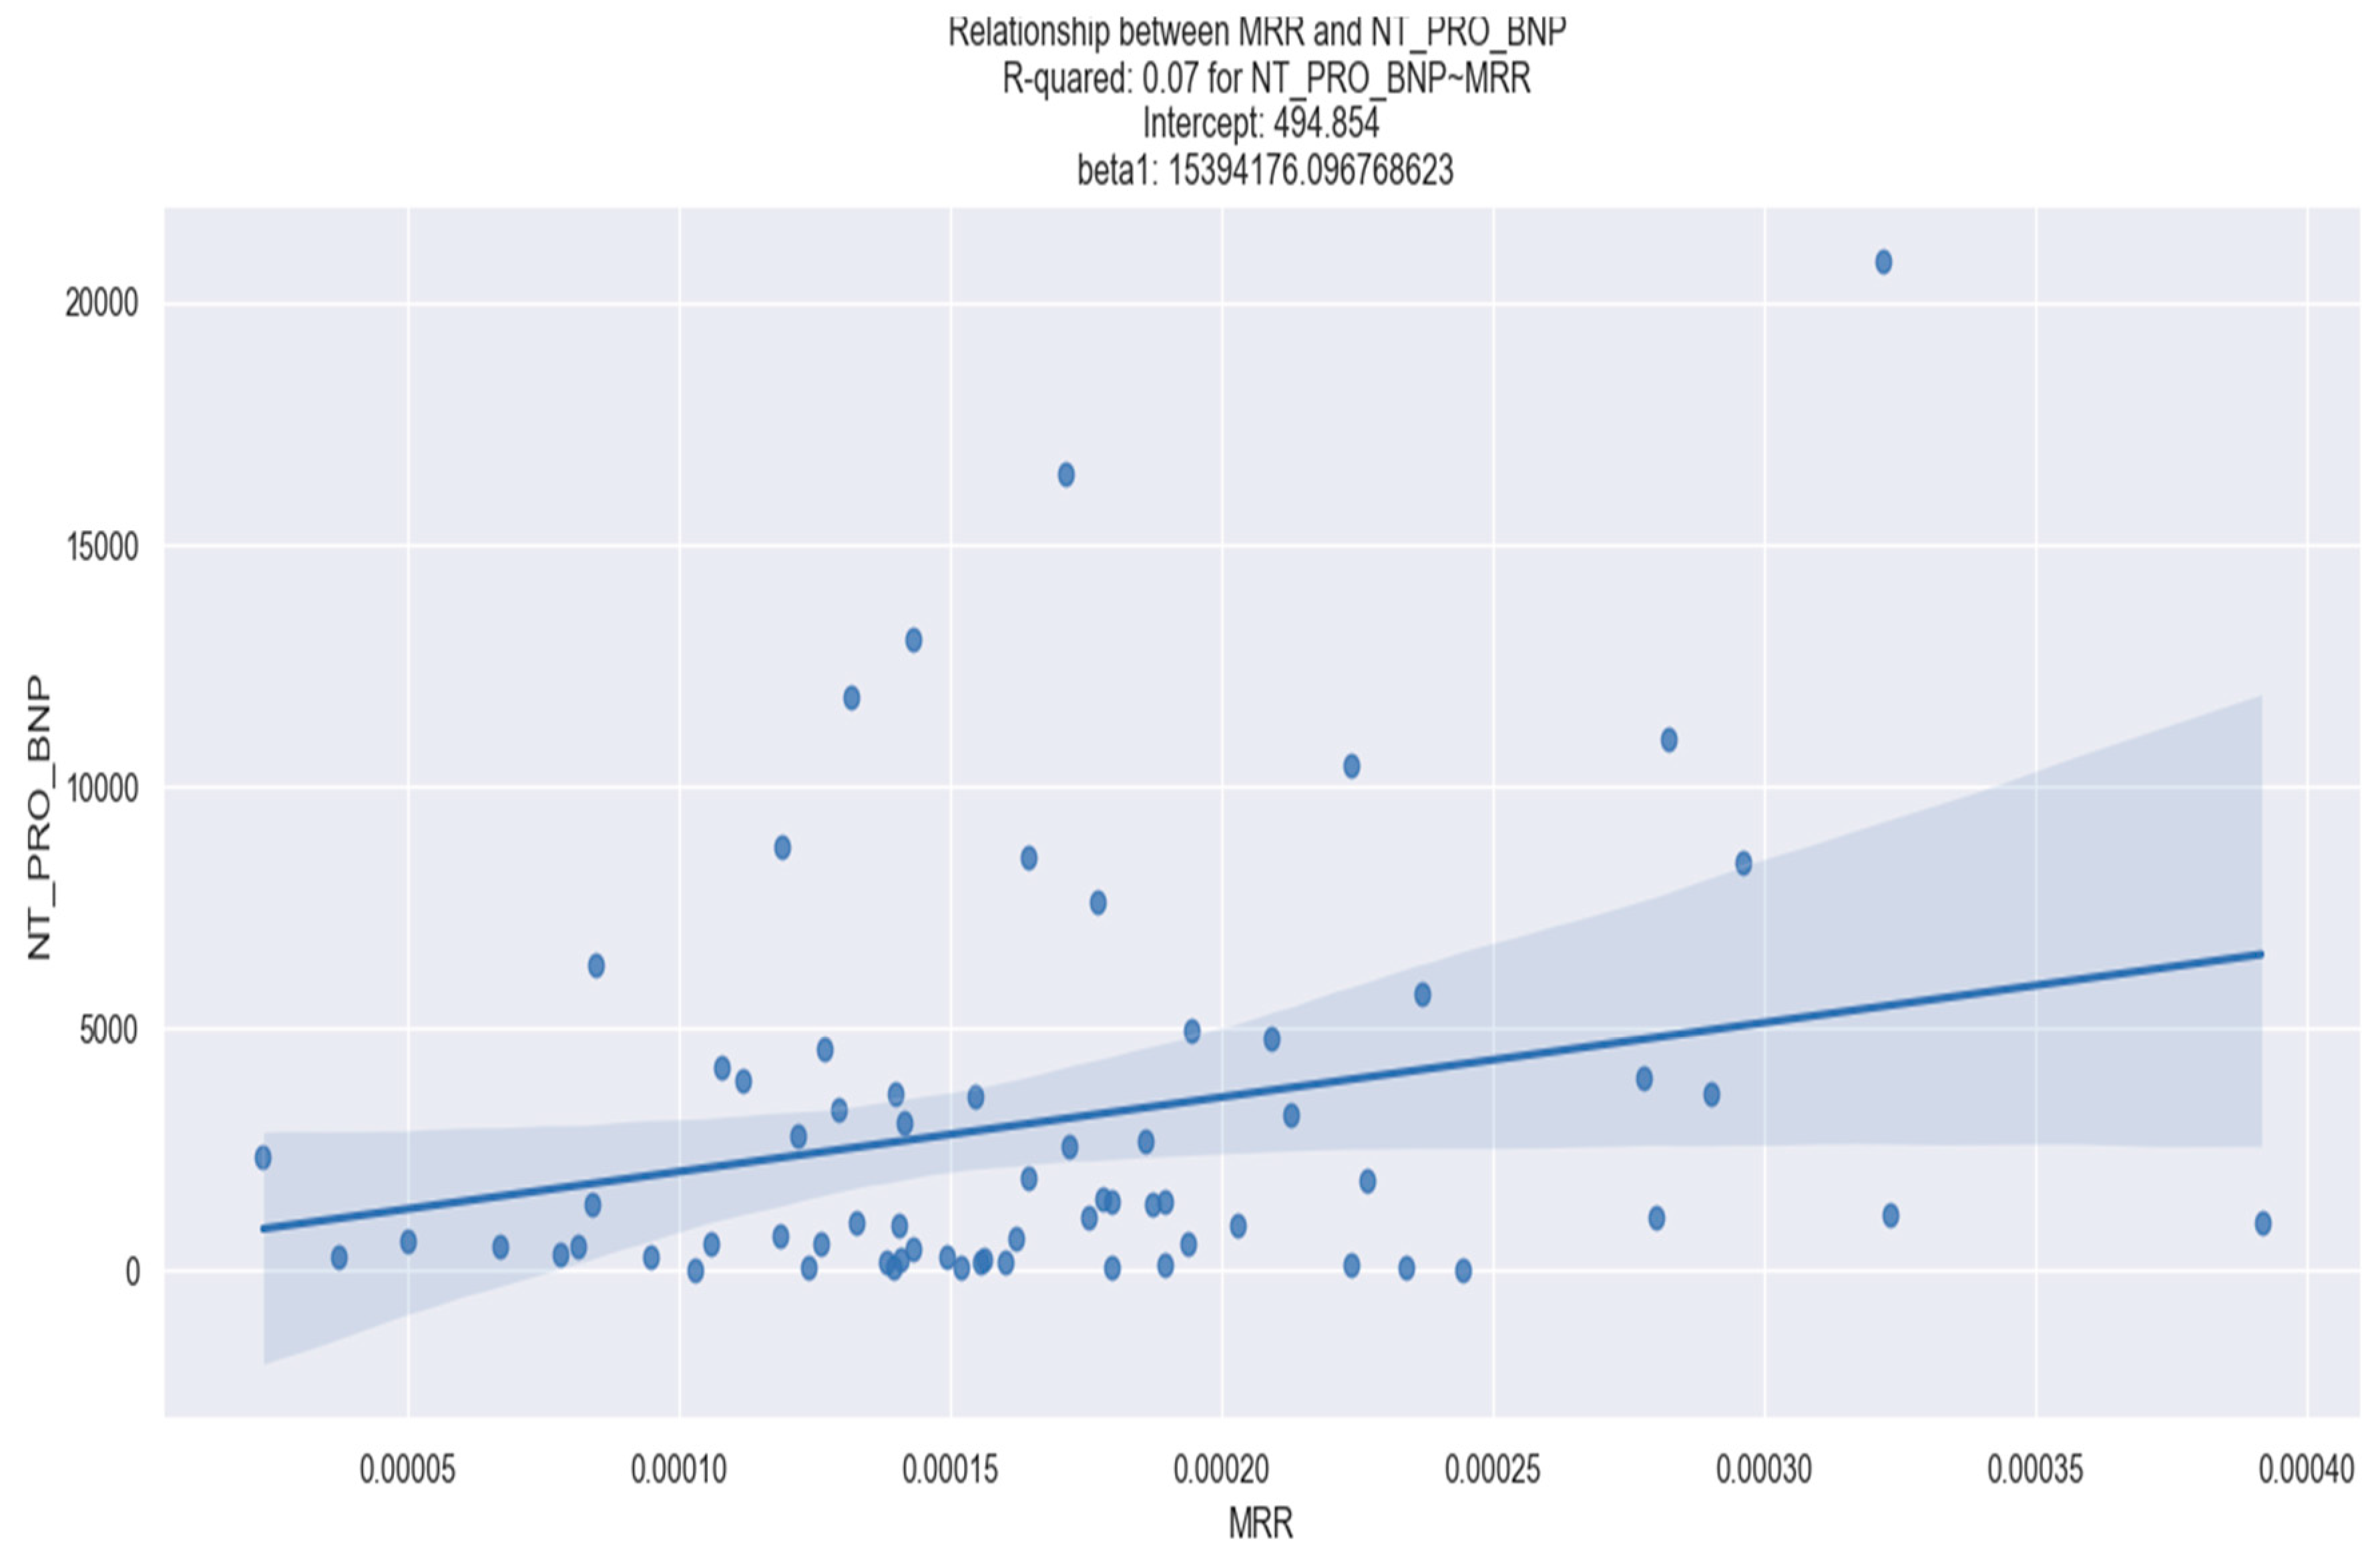
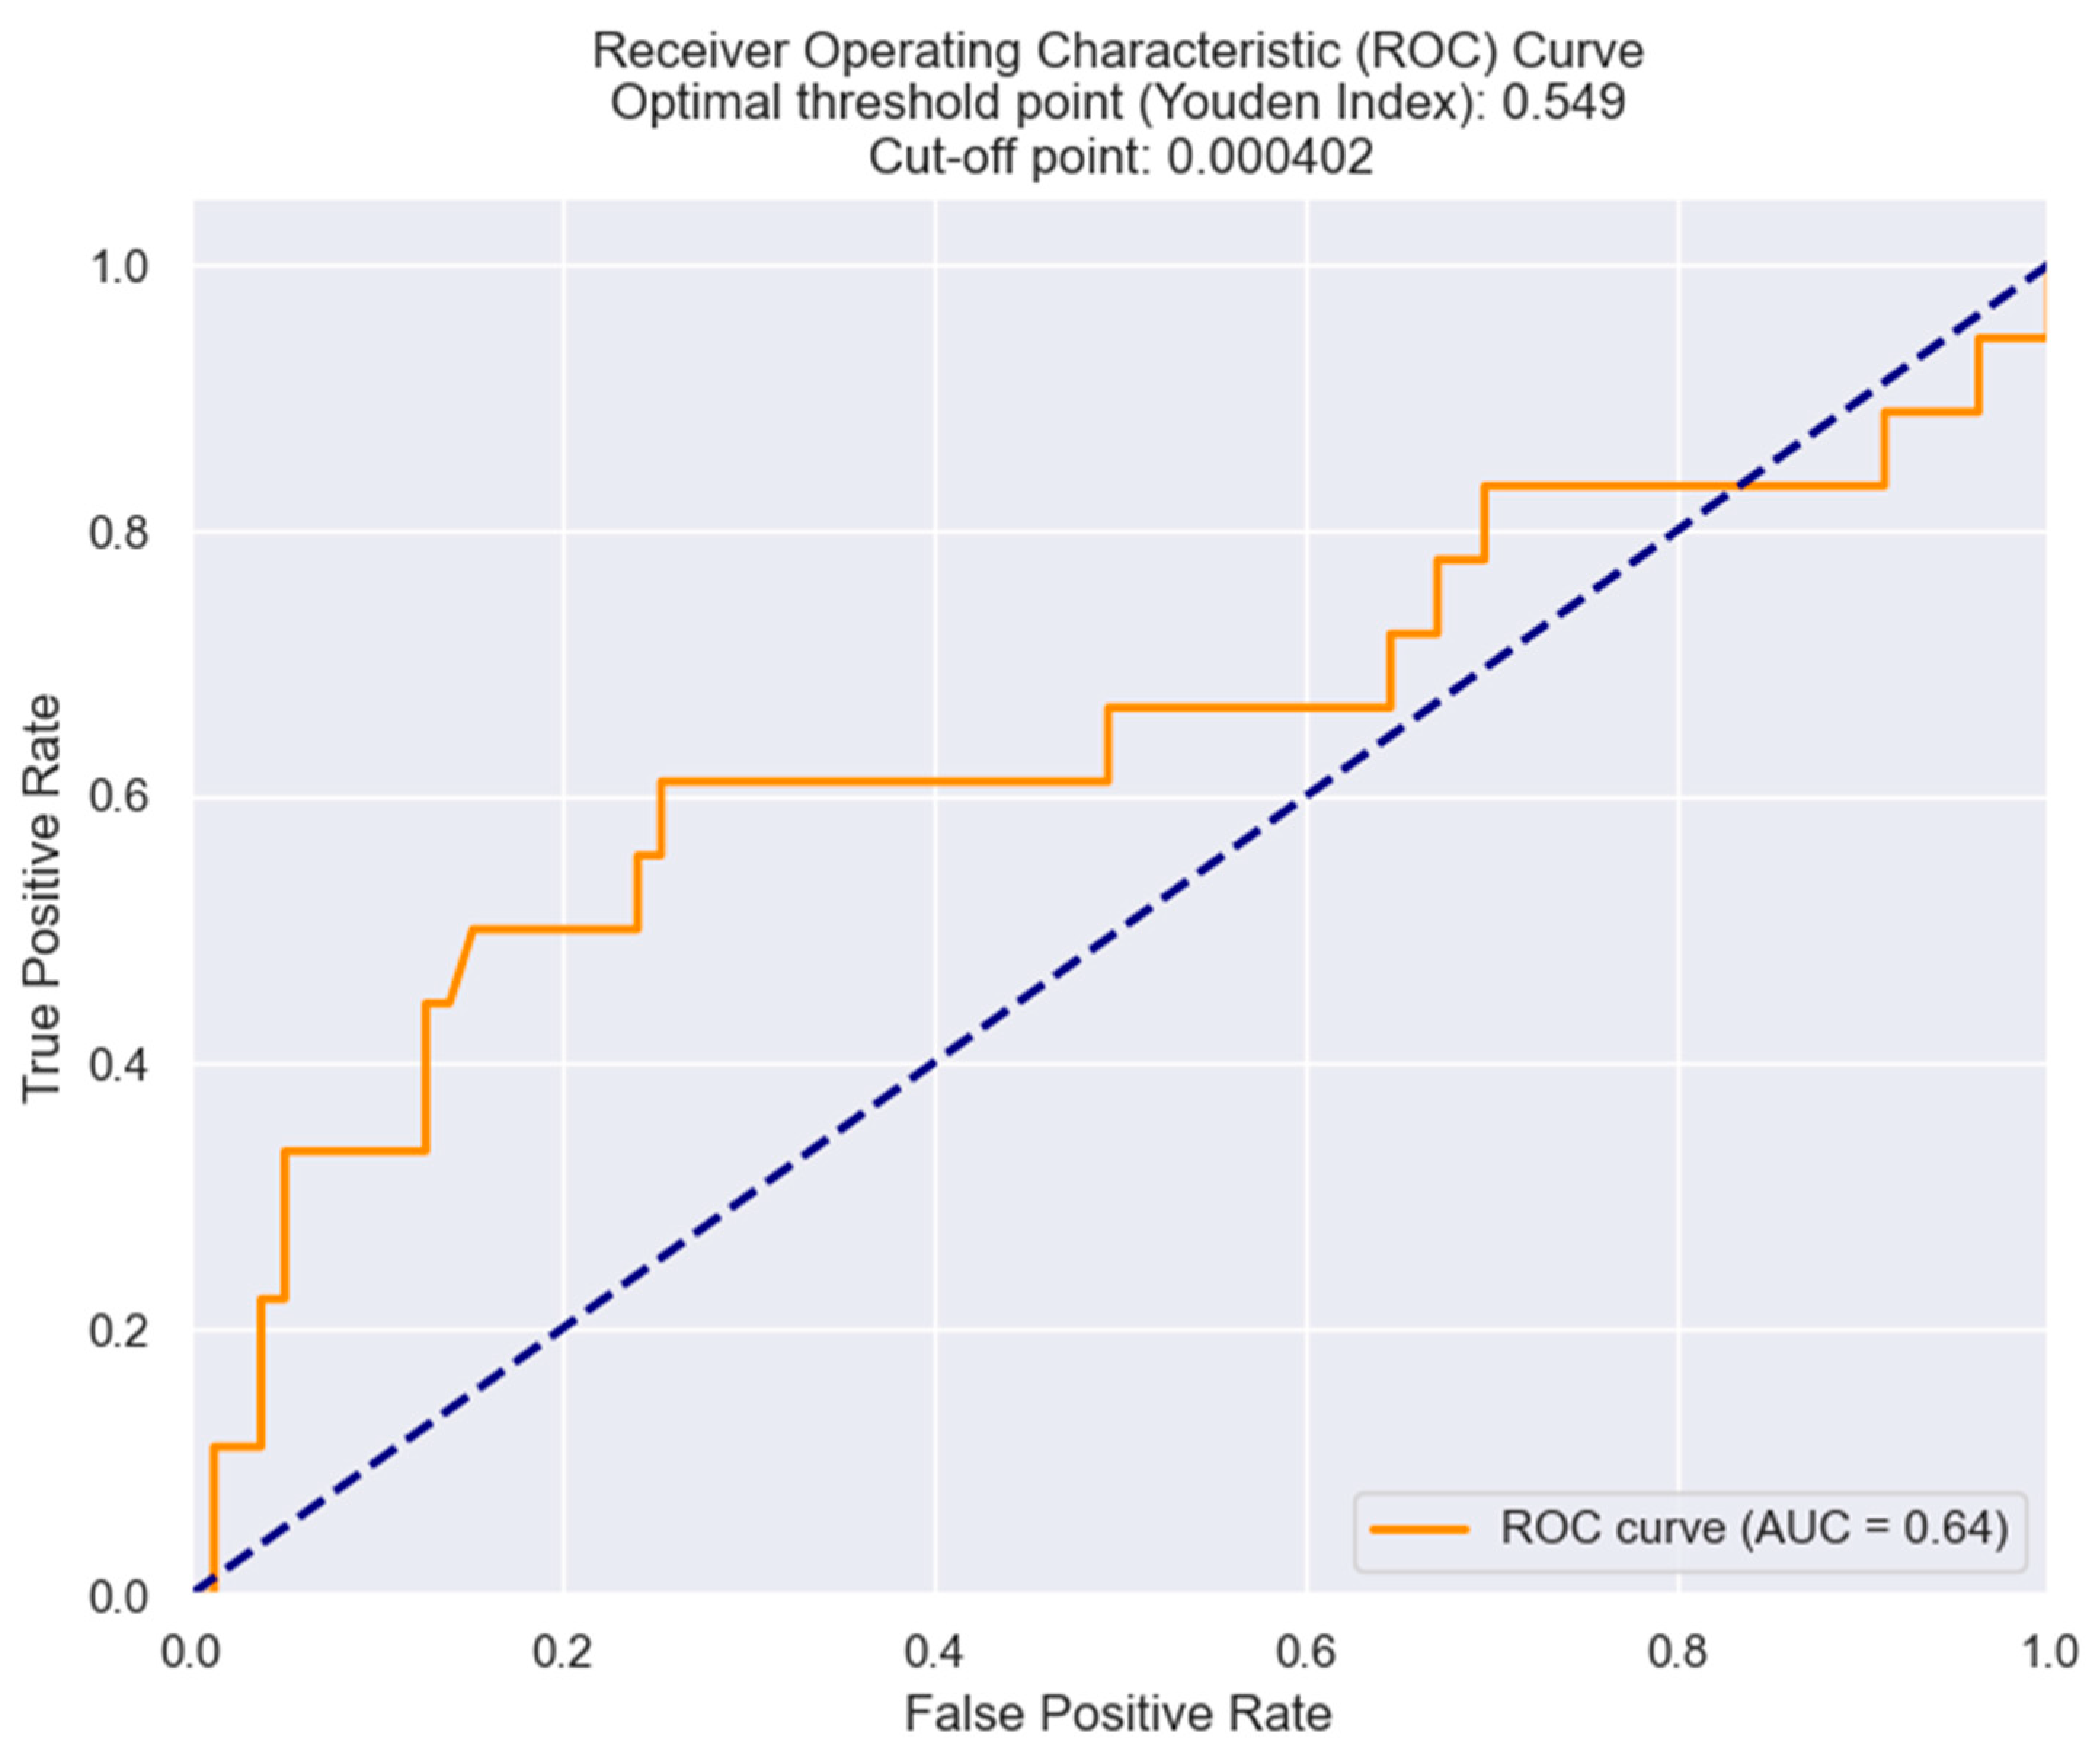
3.3. MRR and Its Predictive Value in NSTEMI Prognosis
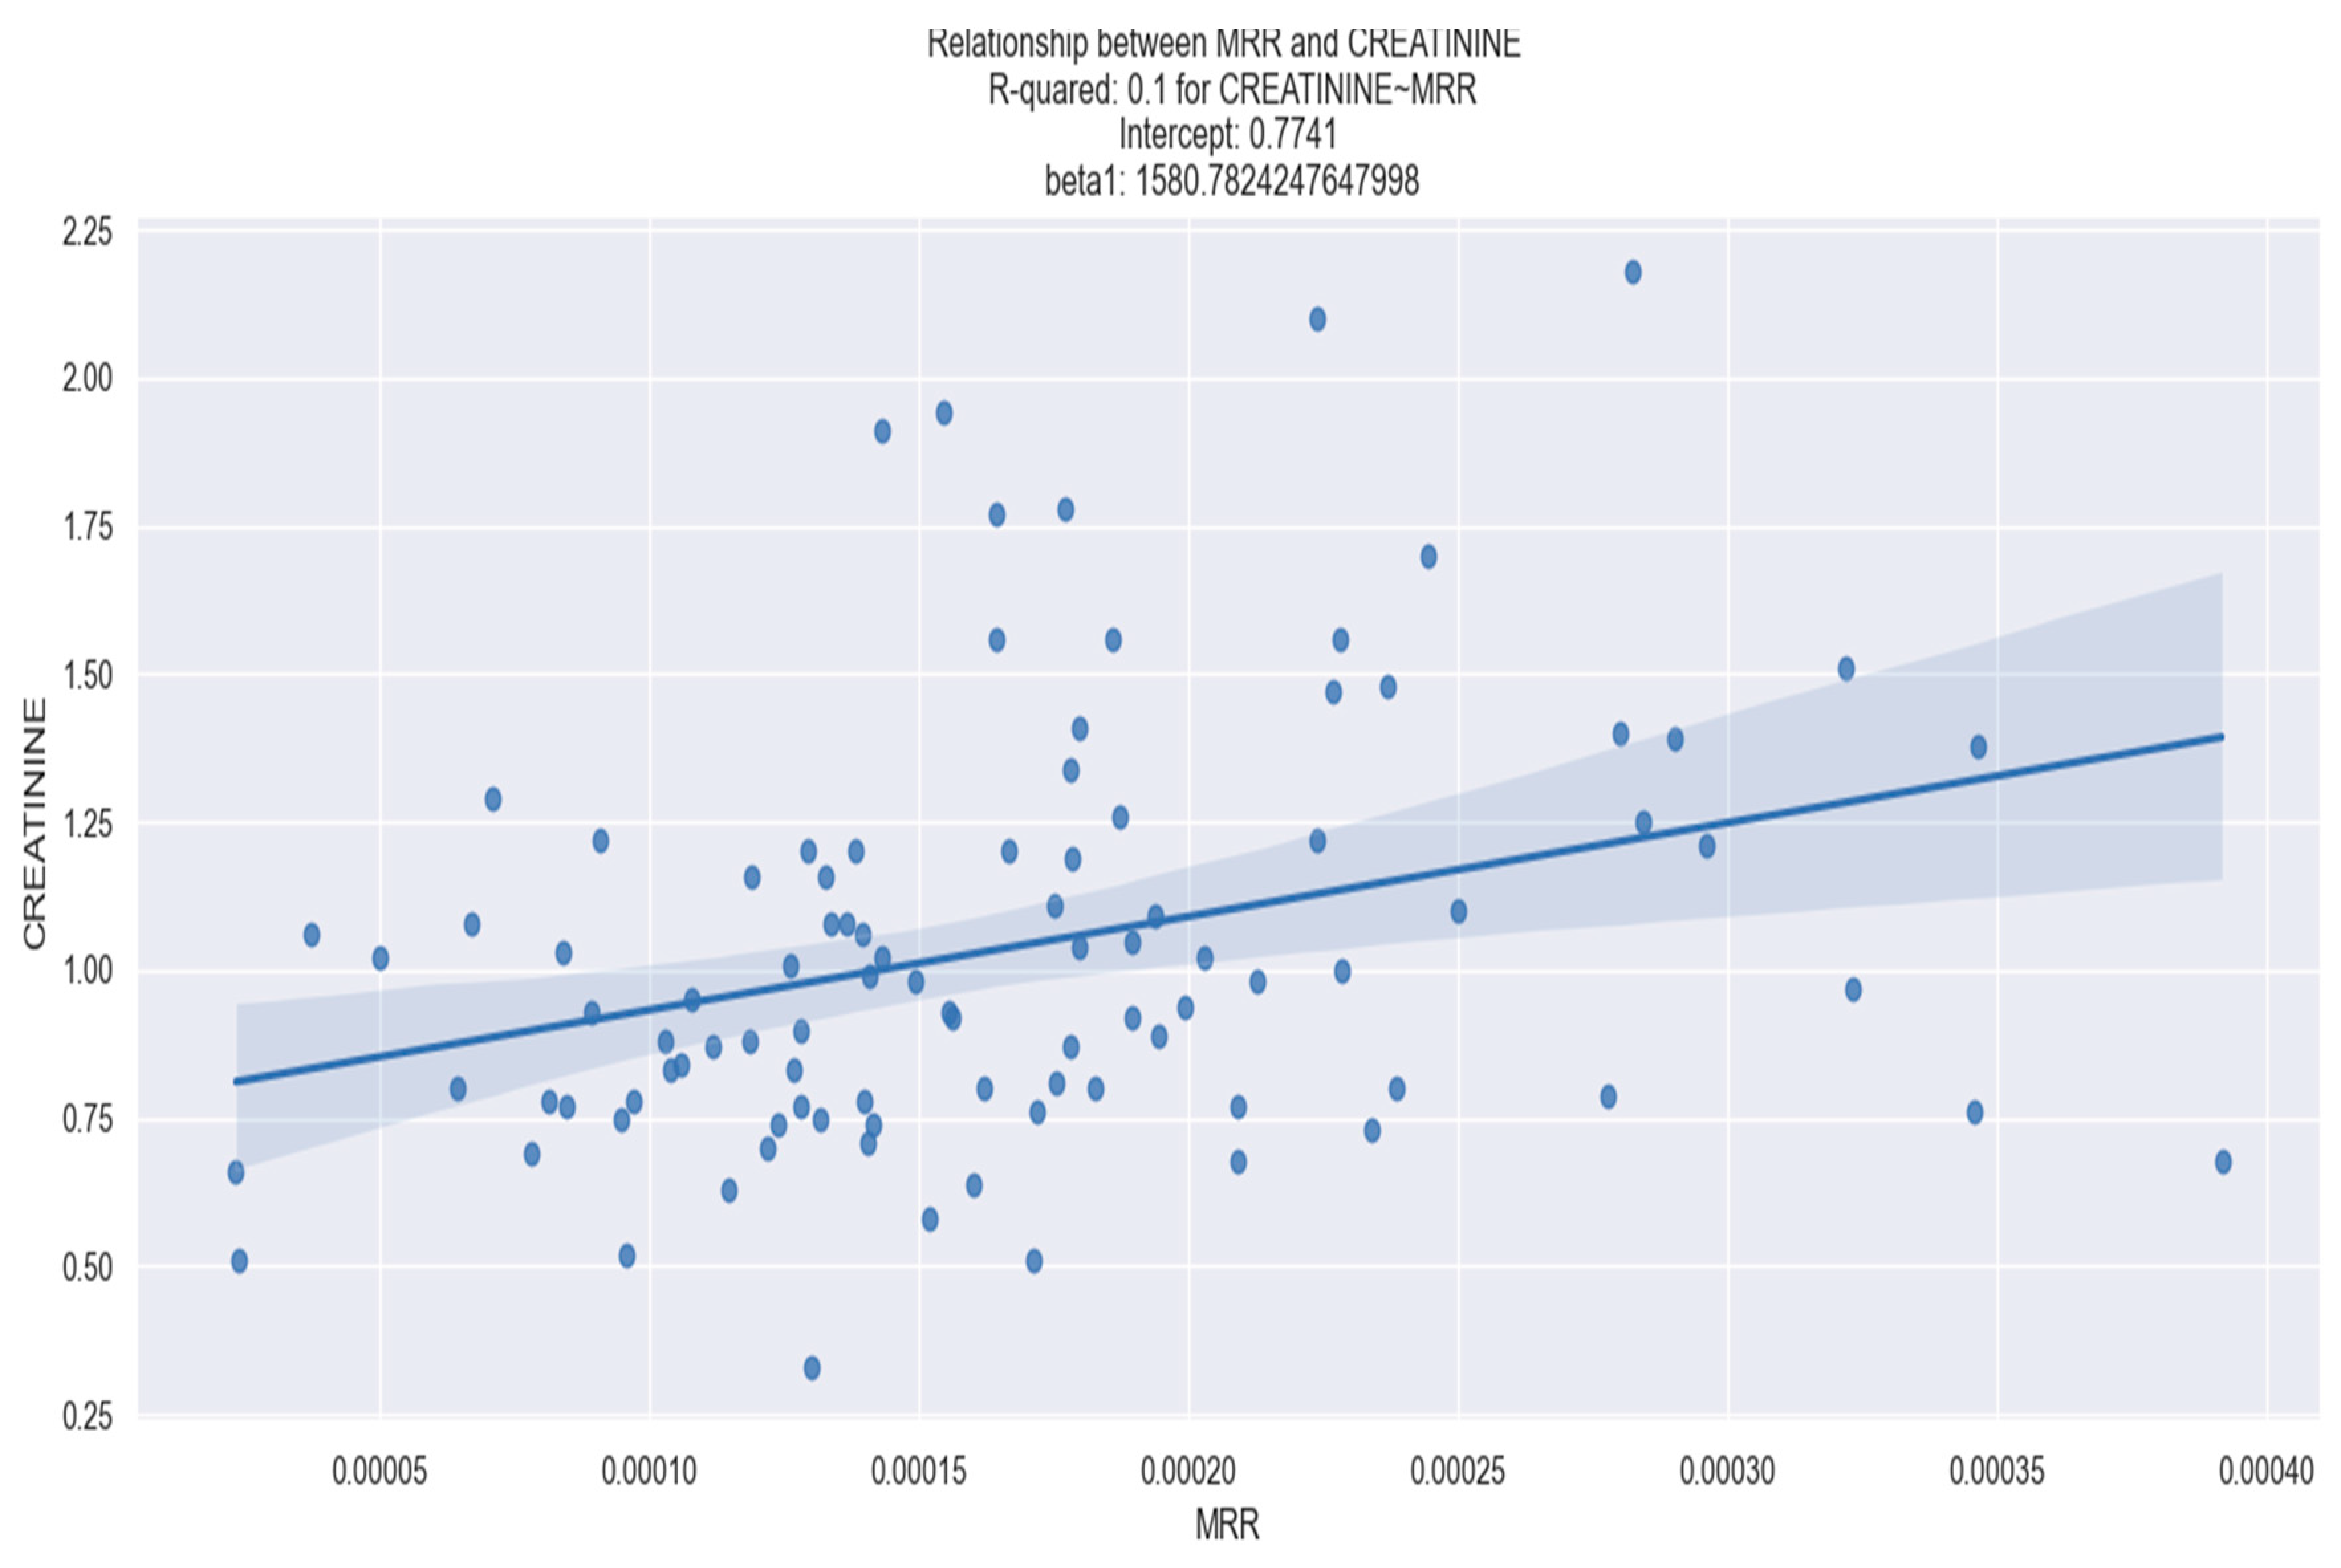
Correlation between MRR and Laboratory Parameters
4. Discussion
4.1. Neutrophils—The First Pillar of a Bottom-Up Phenomenon: Insight into the Role of Neutrophils in Acute Coronary Syndrome and Their Interaction with Red Blood Cells
4.2. Lymphocytes—The Second Pillar of the Bottom-Up Phenomenon
4.3. Monocytes—The Third Pillar of the Bottom-Up Phenomenon
4.4. Limitations of the Study
Future Directions
5. Conclusions
Author Contributions
Funding
Institutional Review Board Statement
Informed Consent Statement
Data Availability Statement
Conflicts of Interest
References
- Nguyen, T.M.; Melichova, D.; Aabel, E.W.; Lie, Ø.H.; Klæboe, L.G.; Grenne, B.; Sjøli, B.; Brunvand, H.; Haugaa, K.; Edvardsen, T. Mortality in Patients with Acute Coronary Syndrome—A Prospective 5-Year Follow-Up Study. J. Clin. Med. 2023, 12, 6598. [Google Scholar] [CrossRef] [PubMed]
- Nowbar, A.N.; Gitto, M.; Howard, J.P.; Francis, D.P.; Al-Lamee, R. Mortality from Ischemic Heart Disease. Circ. Cardiovasc. Qual. Outcomes 2019, 12, e005375. [Google Scholar] [CrossRef] [PubMed]
- Ariss, R.W.; Minhas, A.M.K.; Issa, R.; Ahuja, K.R.; Patel, M.M.; Eltahawy, E.A.; Michos, E.D.; Fudim, M.; Nazir, S. Demographic and Regional Trends of Mortality in Patients with Acute Myocardial Infarction in the United States, 1999 to 2019. Am. J. Cardiol. 2022, 164, 7–13. [Google Scholar] [CrossRef] [PubMed]
- Shumilah, A.M.; Othman, A.M.; Al-Madhagi, A.K. Accuracy of Neutrophil to Lymphocyte and Monocyte to Lymphocyte Ratios as New Inflammatory Markers in Acute Coronary Syndrome. BMC Cardiovasc. Disord. 2021, 21, 422. [Google Scholar] [CrossRef] [PubMed]
- Borghini, A.; Mercuri, A.; Andreassi, M.G. Neutrophil-to-Lymphocyte, Platelet-to-Lymphocyte Ratios, and Systemic Immune-Inflammation Index as Predictors of Mortality in Coronary Artery Disease. J. Cardiovasc. Trans. Res. 2023, 16, 473–475. [Google Scholar] [CrossRef]
- Cp, D.G. Relationship between Red Cell Distribution Width and Clinical Outcome in Patients with Acute Coronary Syndrome. J. Assoc. Physicians India 2022, 70, 11–12. [Google Scholar]
- Everett, B.M.; Pradhan, A.D.; Solomon, D.H.; Paynter, N.; Macfadyen, J.; Zaharris, E.; Gupta, M.; Clearfield, M.; Libby, P.; Hasan, A.A.K.; et al. Rationale and Design of the Cardiovascular Inflammation Reduction Trial: A Test of the Inflammatory Hypothesis of Atherothrombosis. Am. Heart J. 2013, 166, 199–207.e15. [Google Scholar] [CrossRef] [PubMed]
- Kowara, M.; Cudnoch-Jedrzejewska, A. Pathophysiology of Atherosclerotic Plaque Development-Contemporary Experience and New Directions in Research. Int. J. Mol. Sci. 2021, 22, 3513. [Google Scholar] [CrossRef]
- Wrigley, B.J.; Shantsila, E.; Tapp, L.D.; Lip, G.Y.H. CD14++CD16+ Monocytes in Patients with Acute Ischaemic Heart Failure. Eur. J. Clin. Invest. 2013, 43, 121–130. [Google Scholar] [CrossRef]
- Matter, M.A.; Paneni, F.; Libby, P.; Frantz, S.; Stähli, B.E.; Templin, C.; Mengozzi, A.; Wang, Y.-J.; Kündig, T.M.; Räber, L.; et al. Inflammation in Acute Myocardial Infarction: The Good, the Bad and the Ugly. Eur. Heart J. 2024, 45, 89–103. [Google Scholar] [CrossRef]
- Swirski, F.K.; Hilgendorf, I.; Robbins, C.S. From Proliferation to Proliferation: Monocyte Lineage Comes Full Circle. Semin. Immunopathol. 2014, 36, 137–148. [Google Scholar] [CrossRef] [PubMed]
- Libby, P.; Nahrendorf, M.; Swirski, F.K. Leukocytes Link Local and Systemic Inflammation in Ischemic Cardiovascular Disease: An Expanded “Cardiovascular Continuum. J. Am. Coll. Cardiol. 2016, 67, 1091–1103. [Google Scholar] [CrossRef] [PubMed]
- Hofmann, U.; Frantz, S. Role of T-Cells in Myocardial Infarction. Eur. Heart J. 2016, 37, 873–879. [Google Scholar] [CrossRef] [PubMed]
- Wang, Y.; Wang, H.; Yin, W.; Lin, Y.; Zhou, L.; Sheng, X.; Xu, Y.; Sha, R.; Lu, J. Novel Lymphocyte to Red Blood Cell Ratio (LRR), Neutrophil to Red Blood Cell Ratio (NRR), Monocyte to Red Blood Cell Ratio (MRR) as Predictive and Prognostic Biomarkers for Locally Advanced Breast Cancer. Gland. Surg. 2019, 8, 627–635. [Google Scholar] [CrossRef] [PubMed]
- Byrne, R.A.; Rossello, X.; Coughlan, J.J.; Barbato, E.; Berry, C.; Chieffo, A.; Claeys, M.J.; Dan, G.-A.; Dweck, M.R.; Galbraith, M.; et al. 2023 ESC Guidelines for the Management of Acute Coronary Syndromes. Eur. Heart J. 2023, 44, 3720–3826. [Google Scholar] [CrossRef] [PubMed]
- Zhang, N.; Aiyasiding, X.; Li, W.; Liao, H.; Tang, Q. Neutrophil Degranulation and Myocardial Infarction. Cell Commun. Signal. 2022, 20, 50. [Google Scholar] [CrossRef] [PubMed]
- Bezerra, O.C.; França, C.M.; Rocha, J.A.; Neves, G.A.; Souza, P.R.M.; Teixeira Gomes, M.; Malfitano, C.; Loleiro, T.C.A.; Dourado, P.M.; Llesuy, S.; et al. Cholinergic Stimulationmproves Oxidative Stress and Inflammation in Experimental Myocardial Infarction. Sci. Rep. 2017, 7, 13687. [Google Scholar] [CrossRef] [PubMed]
- Maréchal, P.; Tridetti, J.; Nguyen, M.-L.; Wéra, O.; Jiang, Z.; Gustin, M.; Donneau, A.-F.; Oury, C.; Lancellotti, P. Neutrophil Phenotypes in Coronary Artery Disease. J. Clin. Med. 2020, 9, 1602. [Google Scholar] [CrossRef]
- American College of Cardiology. Update. Cardiac Biomarkers and Heart Failure. Available online: https://www.acc.org/Latest-in-Cardiology/Articles/2015/02/09/13/00/http%3a%2f%2fwww.acc.org%2fLatest-in-Cardiology%2fArticles%2f2015%2f02%2f09%2f13%2f00%2fCardiac-Biomarkers-and-Heart-Failure (accessed on 28 March 2024).
- Ibrahim, N.E.; Januzzi, J.L. Established and Emerging Roles of Biomarkers in Heart Failure. Circ. Res. 2018, 123, 614–629. [Google Scholar] [CrossRef]
- Cho, J.H.; Cho, H.-J.; Lee, H.-Y.; Ki, Y.-J.; Jeon, E.-S.; Hwang, K.-K.; Chae, S.C.; Baek, S.H.; Kang, S.-M.; Choi, D.-J.; et al. Neutrophil-Lymphocyte Ratio in Patients with Acute Heart Failure Predicts In-Hospital and Long-Term Mortality. J. Clin. Med. 2020, 9, 557. [Google Scholar] [CrossRef]
- Misumida, N.; Kobayashi, A.; Saeed, M.; Fox, J.T.; Kanei, Y. Neutrophil-to-Lymphocyte Ratio as an Independent Predictor of Left Main and/or Three-Vessel Disease in Patients with Non-ST-Segment Elevation Myocardial Infarction. Cardiovasc. Revasc. Med. 2015, 16, 331–335. [Google Scholar] [CrossRef] [PubMed]
- Mourouzis, K.; Oikonomou, E.; Siasos, G.; Tsalamadris, S.; Vogiatzi, G.; Antonopoulos, A.; Fountoulakis, P.; Goliopoulou, A.; Papaioannou, S.; Tousoulis, D. Pro-Inflammatory Cytokines in Acute Coronary Syndromes. Curr. Pharm. Des. 2020, 26, 4624–4647. [Google Scholar] [CrossRef] [PubMed]
- Ma, Y. Role of Neutrophils in Cardiac Injury and Repair Following Myocardial Infarction. Cells 2021, 10, 1676. [Google Scholar] [CrossRef] [PubMed]
- Kain, V.; Halade, G.V. Role of Neutrophils in Ischemic Heart Failure. Pharmacol. Ther. 2020, 205, 107424. [Google Scholar] [CrossRef] [PubMed]
- Margraf, A.; Lowell, C.A.; Zarbock, A. Neutrophils in Acute Inflammation: Current Concepts and Translational Implications. Blood 2022, 139, 2130–2144. [Google Scholar] [CrossRef] [PubMed]
- Ma, Y.; Yabluchanskiy, A.; Lindsey, M.L. Neutrophil Roles in Left Ventricular Remodeling Following Myocardial Infarction. Fibrogenesis Tissue Repair. 2013, 6, 11. [Google Scholar] [CrossRef]
- Lin, W.; Chen, H.; Chen, X.; Guo, C. The Roles of Neutrophil-Derived Myeloperoxidase (MPO) in Diseases: The New Progress. Antioxidants 2024, 13, 132. [Google Scholar] [CrossRef]
- Bagaitkar, J.; Huang, J.; Zeng, M.Y.; Pech, N.K.; Monlish, D.A.; Perez-Zapata, L.J.; Miralda, I.; Schuettpelz, L.G.; Dinauer, M.C. NADPH Oxidase Activation Regulates Apoptotic Neutrophil Clearance by Murine Macrophages. Blood 2018, 131, 2367–2378. [Google Scholar] [CrossRef]
- Kahlenberg, J.M.; Carmona-Rivera, C.; Smith, C.K.; Kaplan, M.J. Neutrophil Extracellular Trap-Associated Protein Activation of the NLRP3 Inflammasome Is Enhanced in Lupus Macrophages. J. Immunol. 2013, 190, 1217–1226. [Google Scholar] [CrossRef]
- Jorch, S.K.; Kubes, P. An Emerging Role for Neutrophil Extracellular Traps in Noninfectious Disease. Nat. Med. 2017, 23, 279–287. [Google Scholar] [CrossRef]
- Bonaventura, A.; Vecchié, A.; Abbate, A.; Montecucco, F. Neutrophil Extracellular Traps and Cardiovascular Diseases: An Update. Cells 2020, 9, 231. [Google Scholar] [CrossRef] [PubMed]
- Stakos, D.A.; Kambas, K.; Konstantinidis, T.; Mitroulis, I.; Apostolidou, E.; Arelaki, S.; Tsironidou, V.; Giatromanolaki, A.; Skendros, P.; Konstantinides, S.; et al. Expression of Functional Tissue Factor by Neutrophil Extracellular Traps in Culprit Artery of Acute Myocardial Infarction. Eur. Heart J. 2015, 36, 1405–1414. [Google Scholar] [CrossRef] [PubMed]
- Boneschansker, L.; Inoue, Y.; Oklu, R.; Irimia, D. Capillary Plexuses Are Vulnerable to Neutrophil Extracellular Traps. Integr. Biol. 2016, 8, 149–155. [Google Scholar] [CrossRef]
- Wen, W.; Zhang, Z.; She, J.; Bai, X.; Wu, Y.; Gao, L.; Zhou, J.; Yuan, Z. The Predictive Values of White Blood Cell Indices (Lymphocyte and Eosinophilic Granulocyte) for Heart Failure in Acute Coronary Syndrome Patients Following Percutaneous Coronary Intervention: A Prospective Cohort Study. CIA 2023, 18, 951–962. [Google Scholar] [CrossRef] [PubMed]
- Wang, H.; Liu, Z.; Shao, J.; Lin, L.; Jiang, M.; Wang, L.; Lu, X.; Zhang, H.; Chen, Y.; Zhang, R. Immune and Inflammation in Acute Coronary Syndrome: Molecular Mechanisms and Therapeutic Implications. J. Immunol. Res. 2020, 2020, e4904217. [Google Scholar] [CrossRef] [PubMed]
- Schäfer, S.; Zernecke, A. CD8+ T Cells in Atherosclerosis. Cells 2020, 10, 37. [Google Scholar] [CrossRef] [PubMed]
- Ketelhuth, D.F.J.; Hansson, G.K. Adaptive Response of T and B Cells in Atherosclerosis. Circ. Res. 2016, 118, 668–678. [Google Scholar] [CrossRef] [PubMed]
- Tse, K.; Tse, H.; Sidney, J.; Sette, A.; Ley, K. T Cells in Atherosclerosis. Int. Immunol. 2013, 25, 615–622. [Google Scholar] [CrossRef] [PubMed]
- Selders, G.S.; Fetz, A.E.; Radic, M.Z.; Bowlin, G.L. An Overview of the Role of Neutrophils in Innate Immunity, Inflammation and Host-Biomaterial Integration. Regen. Biomater. 2017, 4, 55–68. [Google Scholar] [CrossRef]
- Pérez, S.; Rius-Pérez, S. Macrophage Polarization and Reprogramming in Acute Inflammation: A Redox Perspective. Antioxidants 2022, 11, 1394. [Google Scholar] [CrossRef]
- Kologrivova, I.; Shtatolkina, M.; Suslova, T.; Ryabov, V. Cells of the Immune System in Cardiac Remodeling: Main Players in Resolution of Inflammation and Repair After Myocardial Infarction. Front. Immunol. 2021, 12, 664457. [Google Scholar] [CrossRef] [PubMed]
- Jian, Y.; Zhou, X.; Shan, W.; Chen, C.; Ge, W.; Cui, J.; Yi, W.; Sun, Y. Crosstalk between Macrophages and Cardiac Cells after Myocardial Infarction. Cell Commun. Signal 2023, 21, 109. [Google Scholar] [CrossRef] [PubMed]
- Laurén, E.; Sankkila, L.; Pettilä, V.; Kerkelä, E. Immunomodulatory Properties of Packed Red Blood Cells during Storage. Transfus. Med. Hemotherapy 2022, 50, 208–217. [Google Scholar] [CrossRef] [PubMed]
- Ruggeri, F.S.; Marcott, C.; Dinarelli, S.; Longo, G.; Girasole, M.; Dietler, G.; Knowles, T.P.J. Identification of Oxidative Stress in Red Blood Cells with Nanoscale Chemical Resolution by Infrared Nanospectroscopy. Int. J. Mol. Sci. 2018, 19, 2582. [Google Scholar] [CrossRef] [PubMed]
- Kong, P.; Cui, Z.-Y.; Huang, X.-F.; Zhang, D.-D.; Guo, R.-J.; Han, M. Inflammation and Atherosclerosis: Signaling Pathways and Therapeutic Intervention. Sig Transduct. Target. Ther. 2022, 7, 131. [Google Scholar] [CrossRef] [PubMed]
- Buttari, B.; Profumo, E.; Riganò, R. Crosstalk between Red Blood Cells and the Immune System and Its Impact on Atherosclerosis. Biomed. Res. Int. 2015, 2015, 616834. [Google Scholar] [CrossRef]
- Hulsmans, M.; Sam, F.; Nahrendorf, M. Monocyte and Macrophage Contributions to Cardiac Remodeling. J. Mol. Cell Cardiol. 2016, 93, 149–155. [Google Scholar] [CrossRef] [PubMed]
- Nahrendorf, M.; Swirski, F.K. Lifestyle Effects on Hematopoiesis and Atherosclerosis. Circ. Res. 2015, 116, 884–894. [Google Scholar] [CrossRef] [PubMed]
- Araldi, E.; Chamorro-Jorganes, A.; van Solingen, C.; Fernandez-Hernando, C.; Suarez, Y. Therapeutic Potential of Modulating microRNAs in Atherosclerotic Vascular Disease. Curr. Vasc. Pharmacol. 2015, 13, 291–304. [Google Scholar] [CrossRef]
- Pamukcu, B.; Lip, G.Y.H.; Devitt, A.; Griffiths, H.; Shantsila, E. The Role of Monocytes in Atherosclerotic Coronary Artery Disease. Ann. Med. 2010, 42, 394–403. [Google Scholar] [CrossRef]
- Mami, I.; Tavernier, Q.; Bouvier, N.; Aboukamis, R.; Desbuissons, G.; Rabant, M.; Poindessous, V.; Laurent-Puig, P.; Beaune, P.; Tharaux, P.-L.; et al. A Novel Extrinsic Pathway for the Unfolded Protein Response in the Kidney. J. Am. Soc. Nephrol. 2016, 27, 2670–2683. [Google Scholar] [CrossRef] [PubMed]
- Rabb, H.; Griffin, M.D.; McKay, D.B.; Swaminathan, S.; Pickkers, P.; Rosner, M.H.; Kellum, J.A.; Ronco, C. Acute Dialysis Quality Initiative Consensus XIII Work Group. Inflammation in AKI: Current Understanding, Key Questions, and Knowledge Gaps. J. Am. Soc. Nephrol. 2016, 27, 371–379. [Google Scholar] [CrossRef] [PubMed]
- Jansen, M.P.B.; Emal, D.; Teske, G.J.D.; Dessing, M.C.; Florquin, S.; Roelofs, J.J.T.H. Release of Extracellular DNA Influences Renal Ischemia Reperfusion Injury by Platelet Activation and Formation of Neutrophil Extracellular Traps. Kidney Int. 2017, 91, 352–364. [Google Scholar] [CrossRef]
- Ziegler-Heitbrock, L. Blood Monocytes and Their Subsets: Established Features and Open Questions. Front. Immunol. 2015, 6, 153782. [Google Scholar] [CrossRef] [PubMed]
- Boyette, L.B.; Macedo, C.; Hadi, K.; Elinoff, B.D.; Walters, J.T.; Ramaswami, B.; Chalasani, G.; Taboas, J.M.; Lakkis, F.G.; Metes, D.M. Phenotype, Function, and Differentiation Potential of Human Monocyte Subsets. PLoS ONE 2017, 12, e0176460. [Google Scholar] [CrossRef]
- Connaughton, E.P.; Naicker, S.; Hanley, S.A.; Slevin, S.M.; Eykelenboom, J.K.; Lowndes, N.F.; O’Brien, T.; Ceredig, R.; Griffin, M.D.; Dennedy, M.C. Phenotypic and Functional Heterogeneity of Human Intermediate Monocytes Based on HLA-DR Expression. Immunol. Cell Biol. 2018, 96, 742–758. [Google Scholar] [CrossRef]


| Variable | Prevalence % |
|---|---|
| Female | 36.08% |
| Male | 63.92% |
| BMI >30 | 36.08% |
| Smoker | 51.55% |
| Arterial Hypertension | 79.38% |
| Diabetes mellitus | 39.18% |
| Dyslipidemia | 56.7% |
| Killip class III/IV | 18.56% |
| Dependent Variable | R Squared | Independent Variable | Coefficient | p Value |
|---|---|---|---|---|
| NT-proBNP | 0.099 | NRR | 1,952,000 | 0.008 |
| Admission CK | 0.05 | NRR | 117,000 | 0.028 |
| Admission CK-MB | 0.04 | NRR | 122,300 | 0.51 |
| Admission high-sensitivity troponin I | 0.025 | NRR | 1,751,000 | 0.123 |
| Peak CK | 0.019 | NRR | 122,000 | 0.182 |
| Peak CK-MB | 0.021 | NRR | 15,630 | 0.156 |
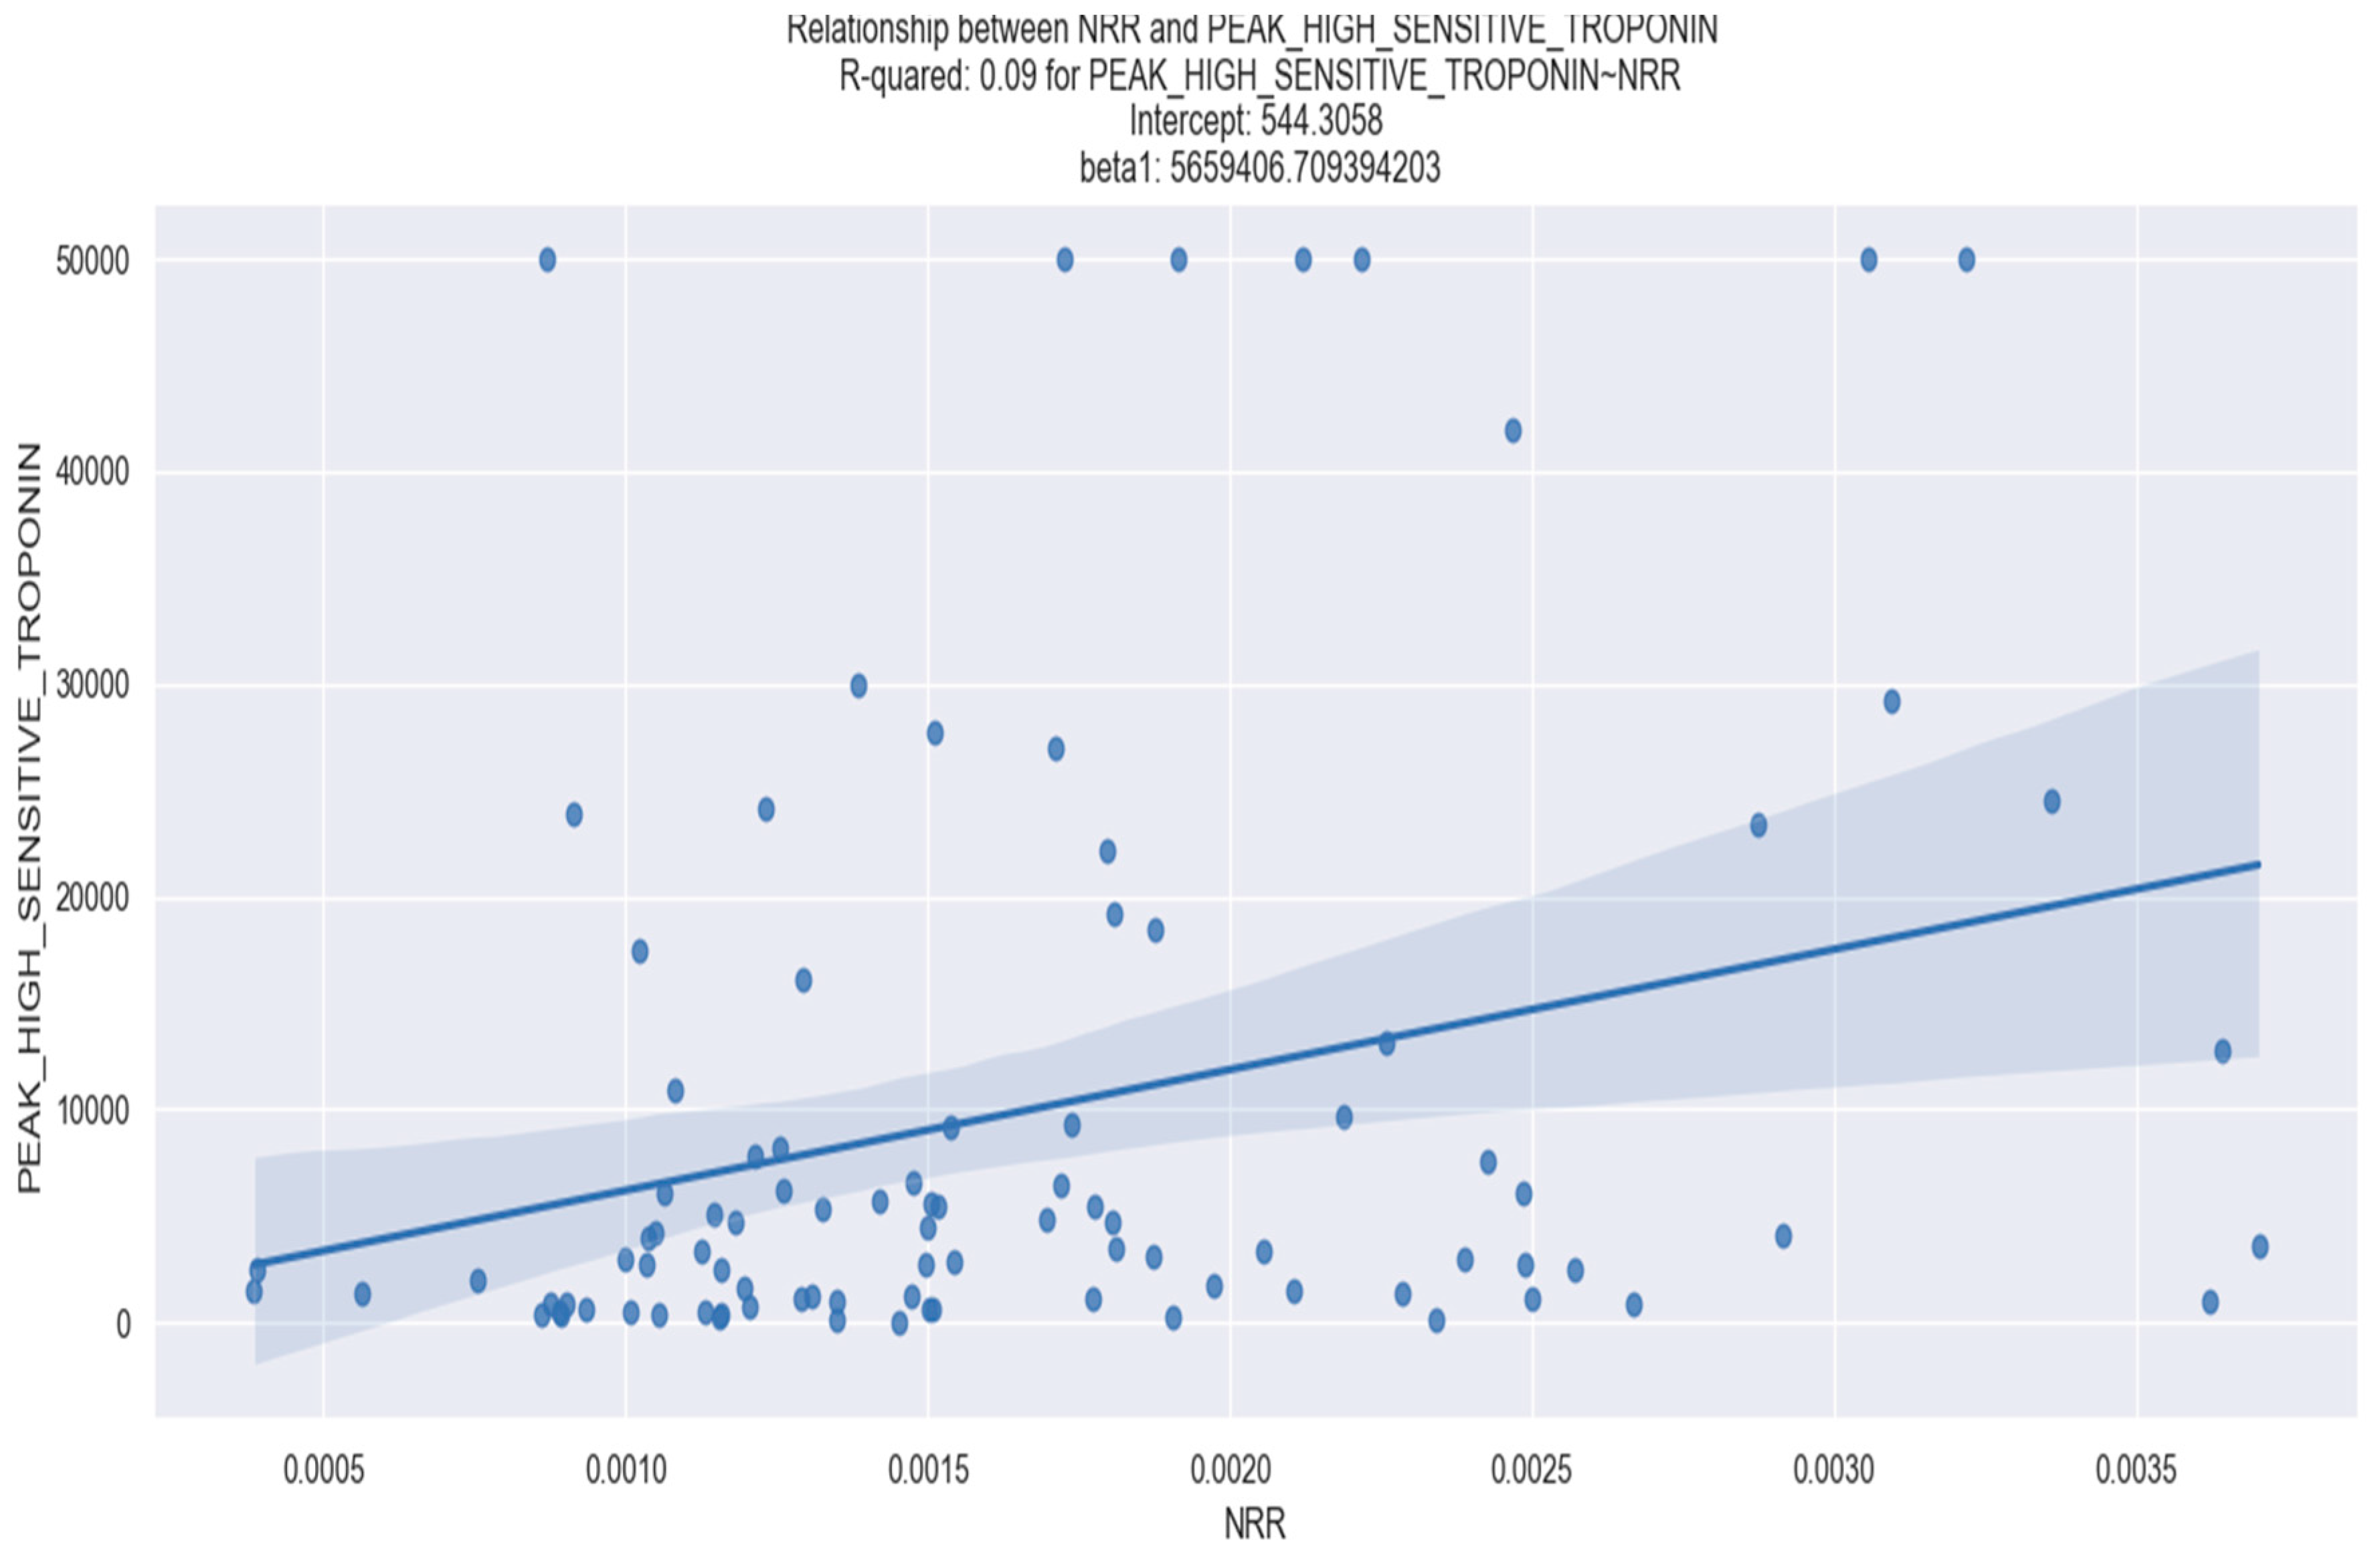
| Peak high-sensitivity troponin I | 0.086 | NRR | 5,659,000 | 0.004 |
| Creatinine | 0.198 | NRR | 219.1154 | 0.504 |
| Dependent Variable | R Squared | Independent Variable | Coefficient | p Value |
|---|---|---|---|---|
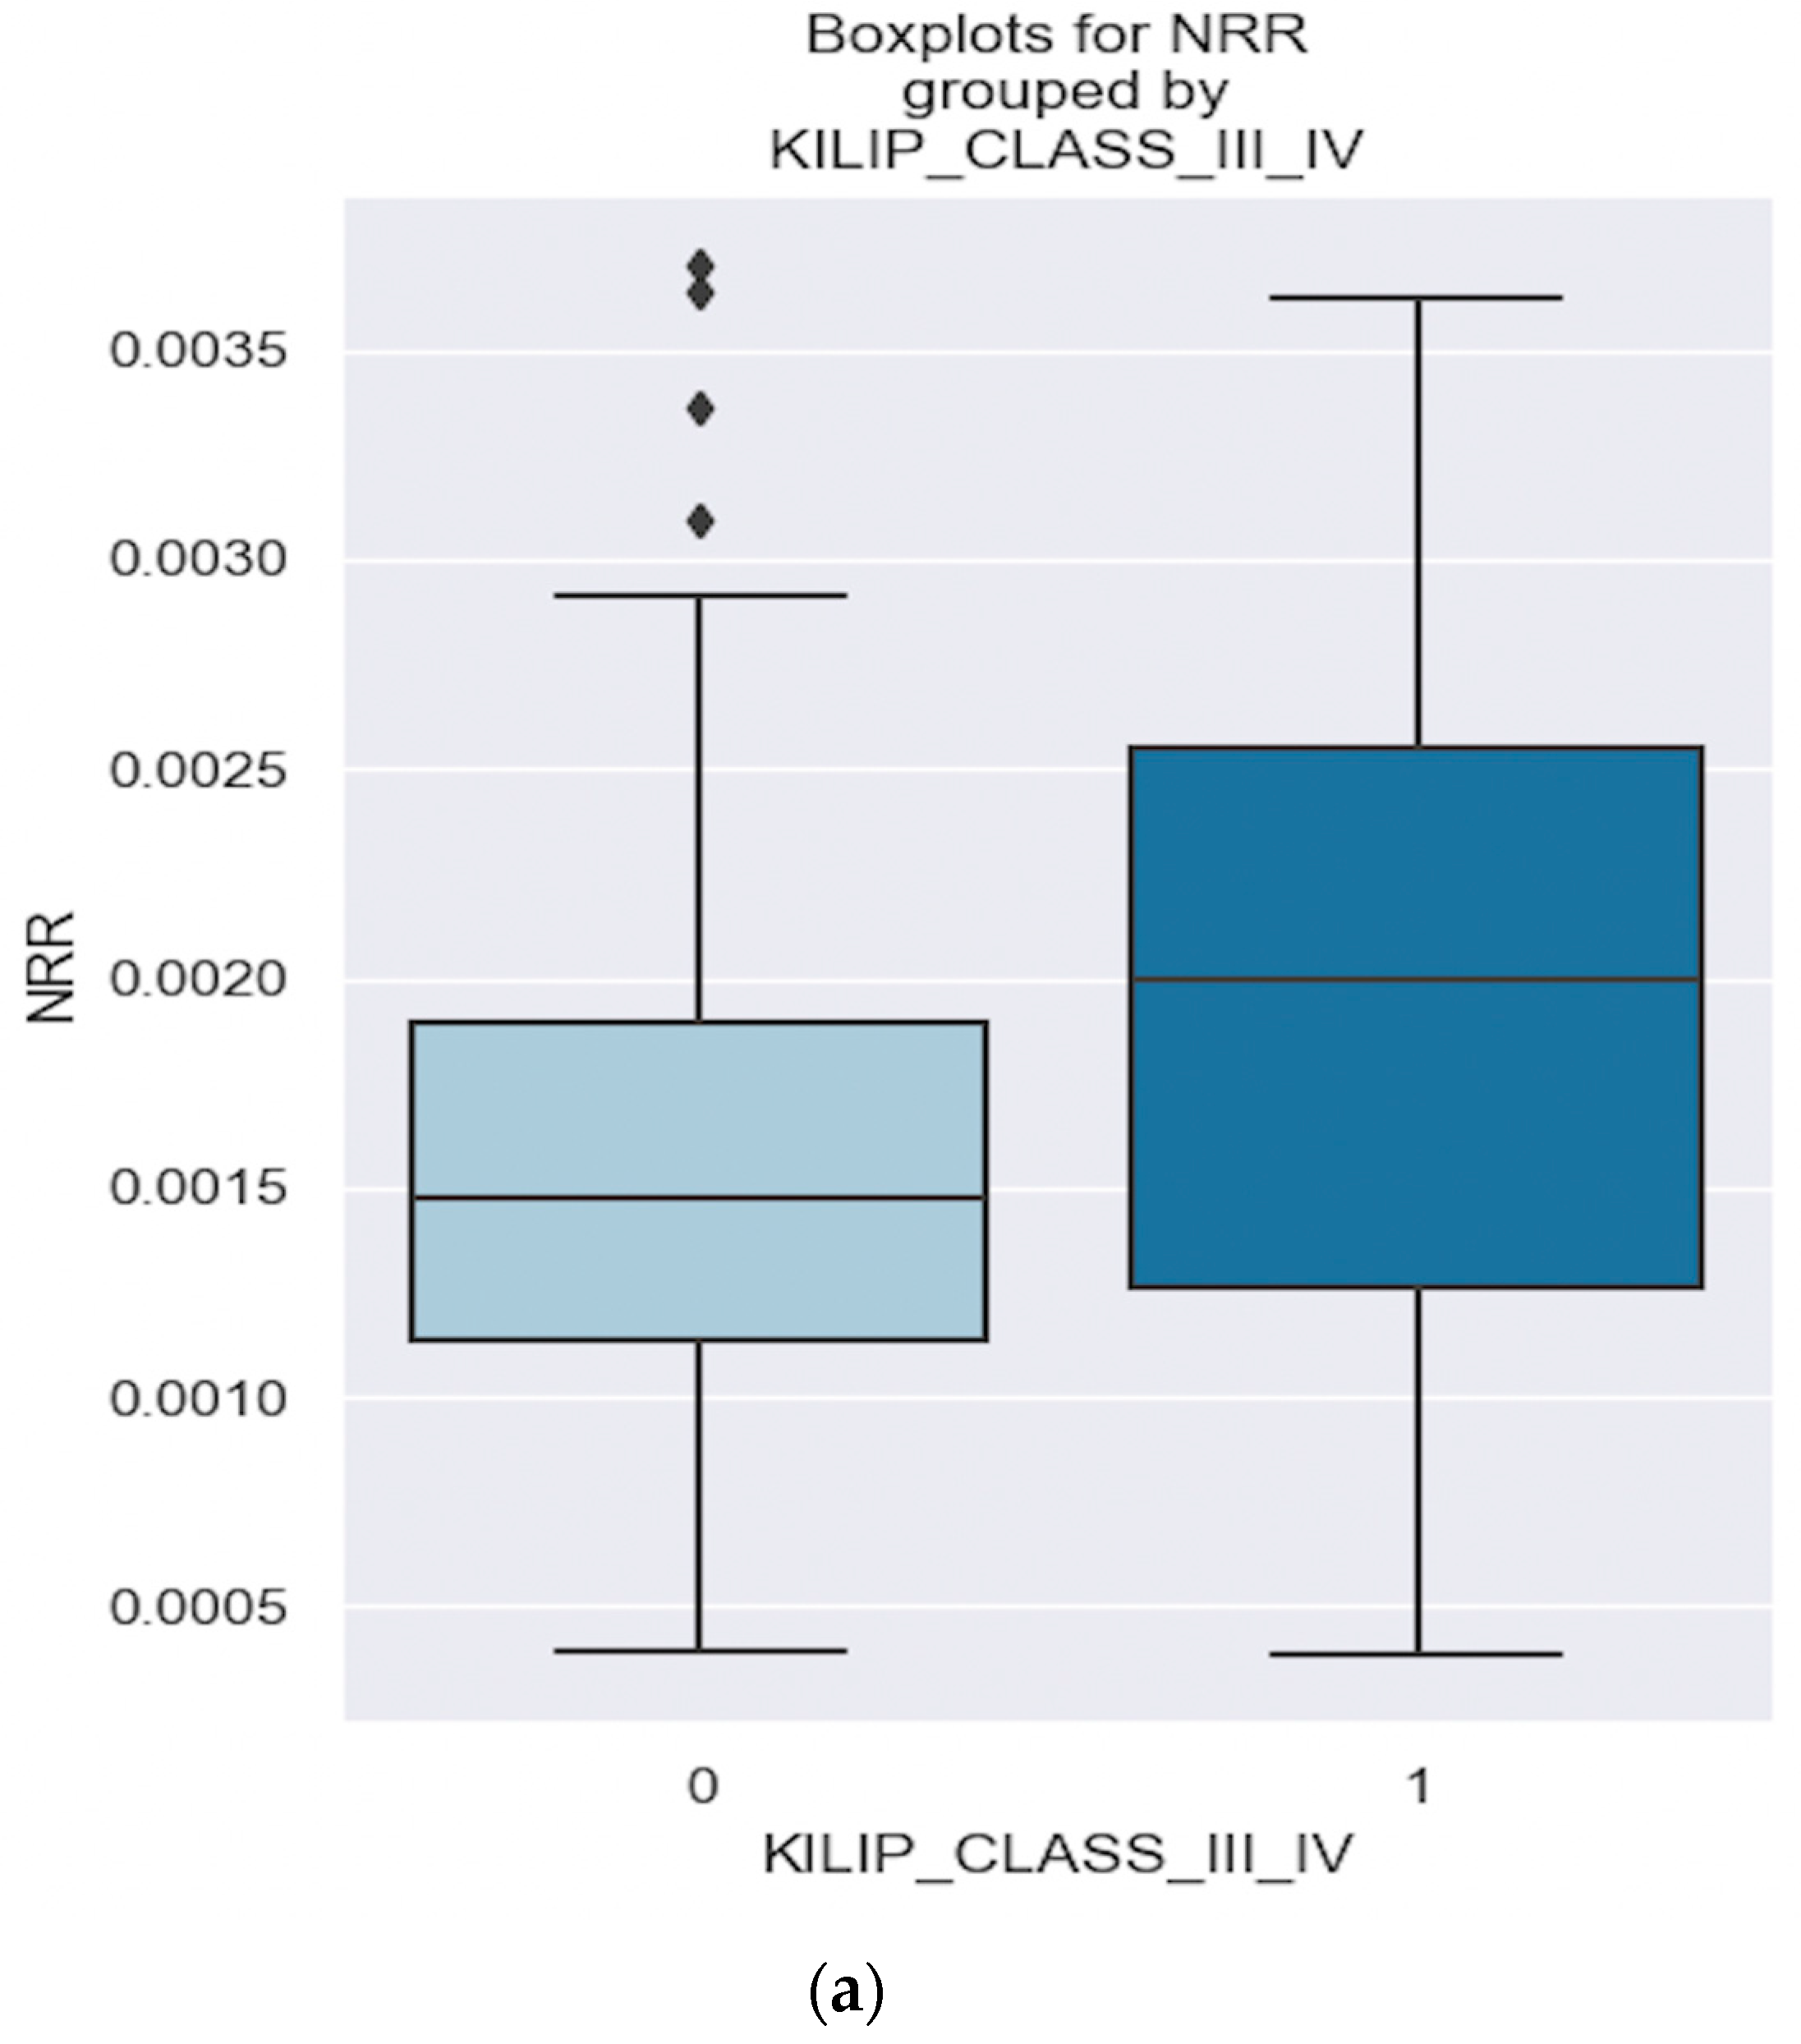
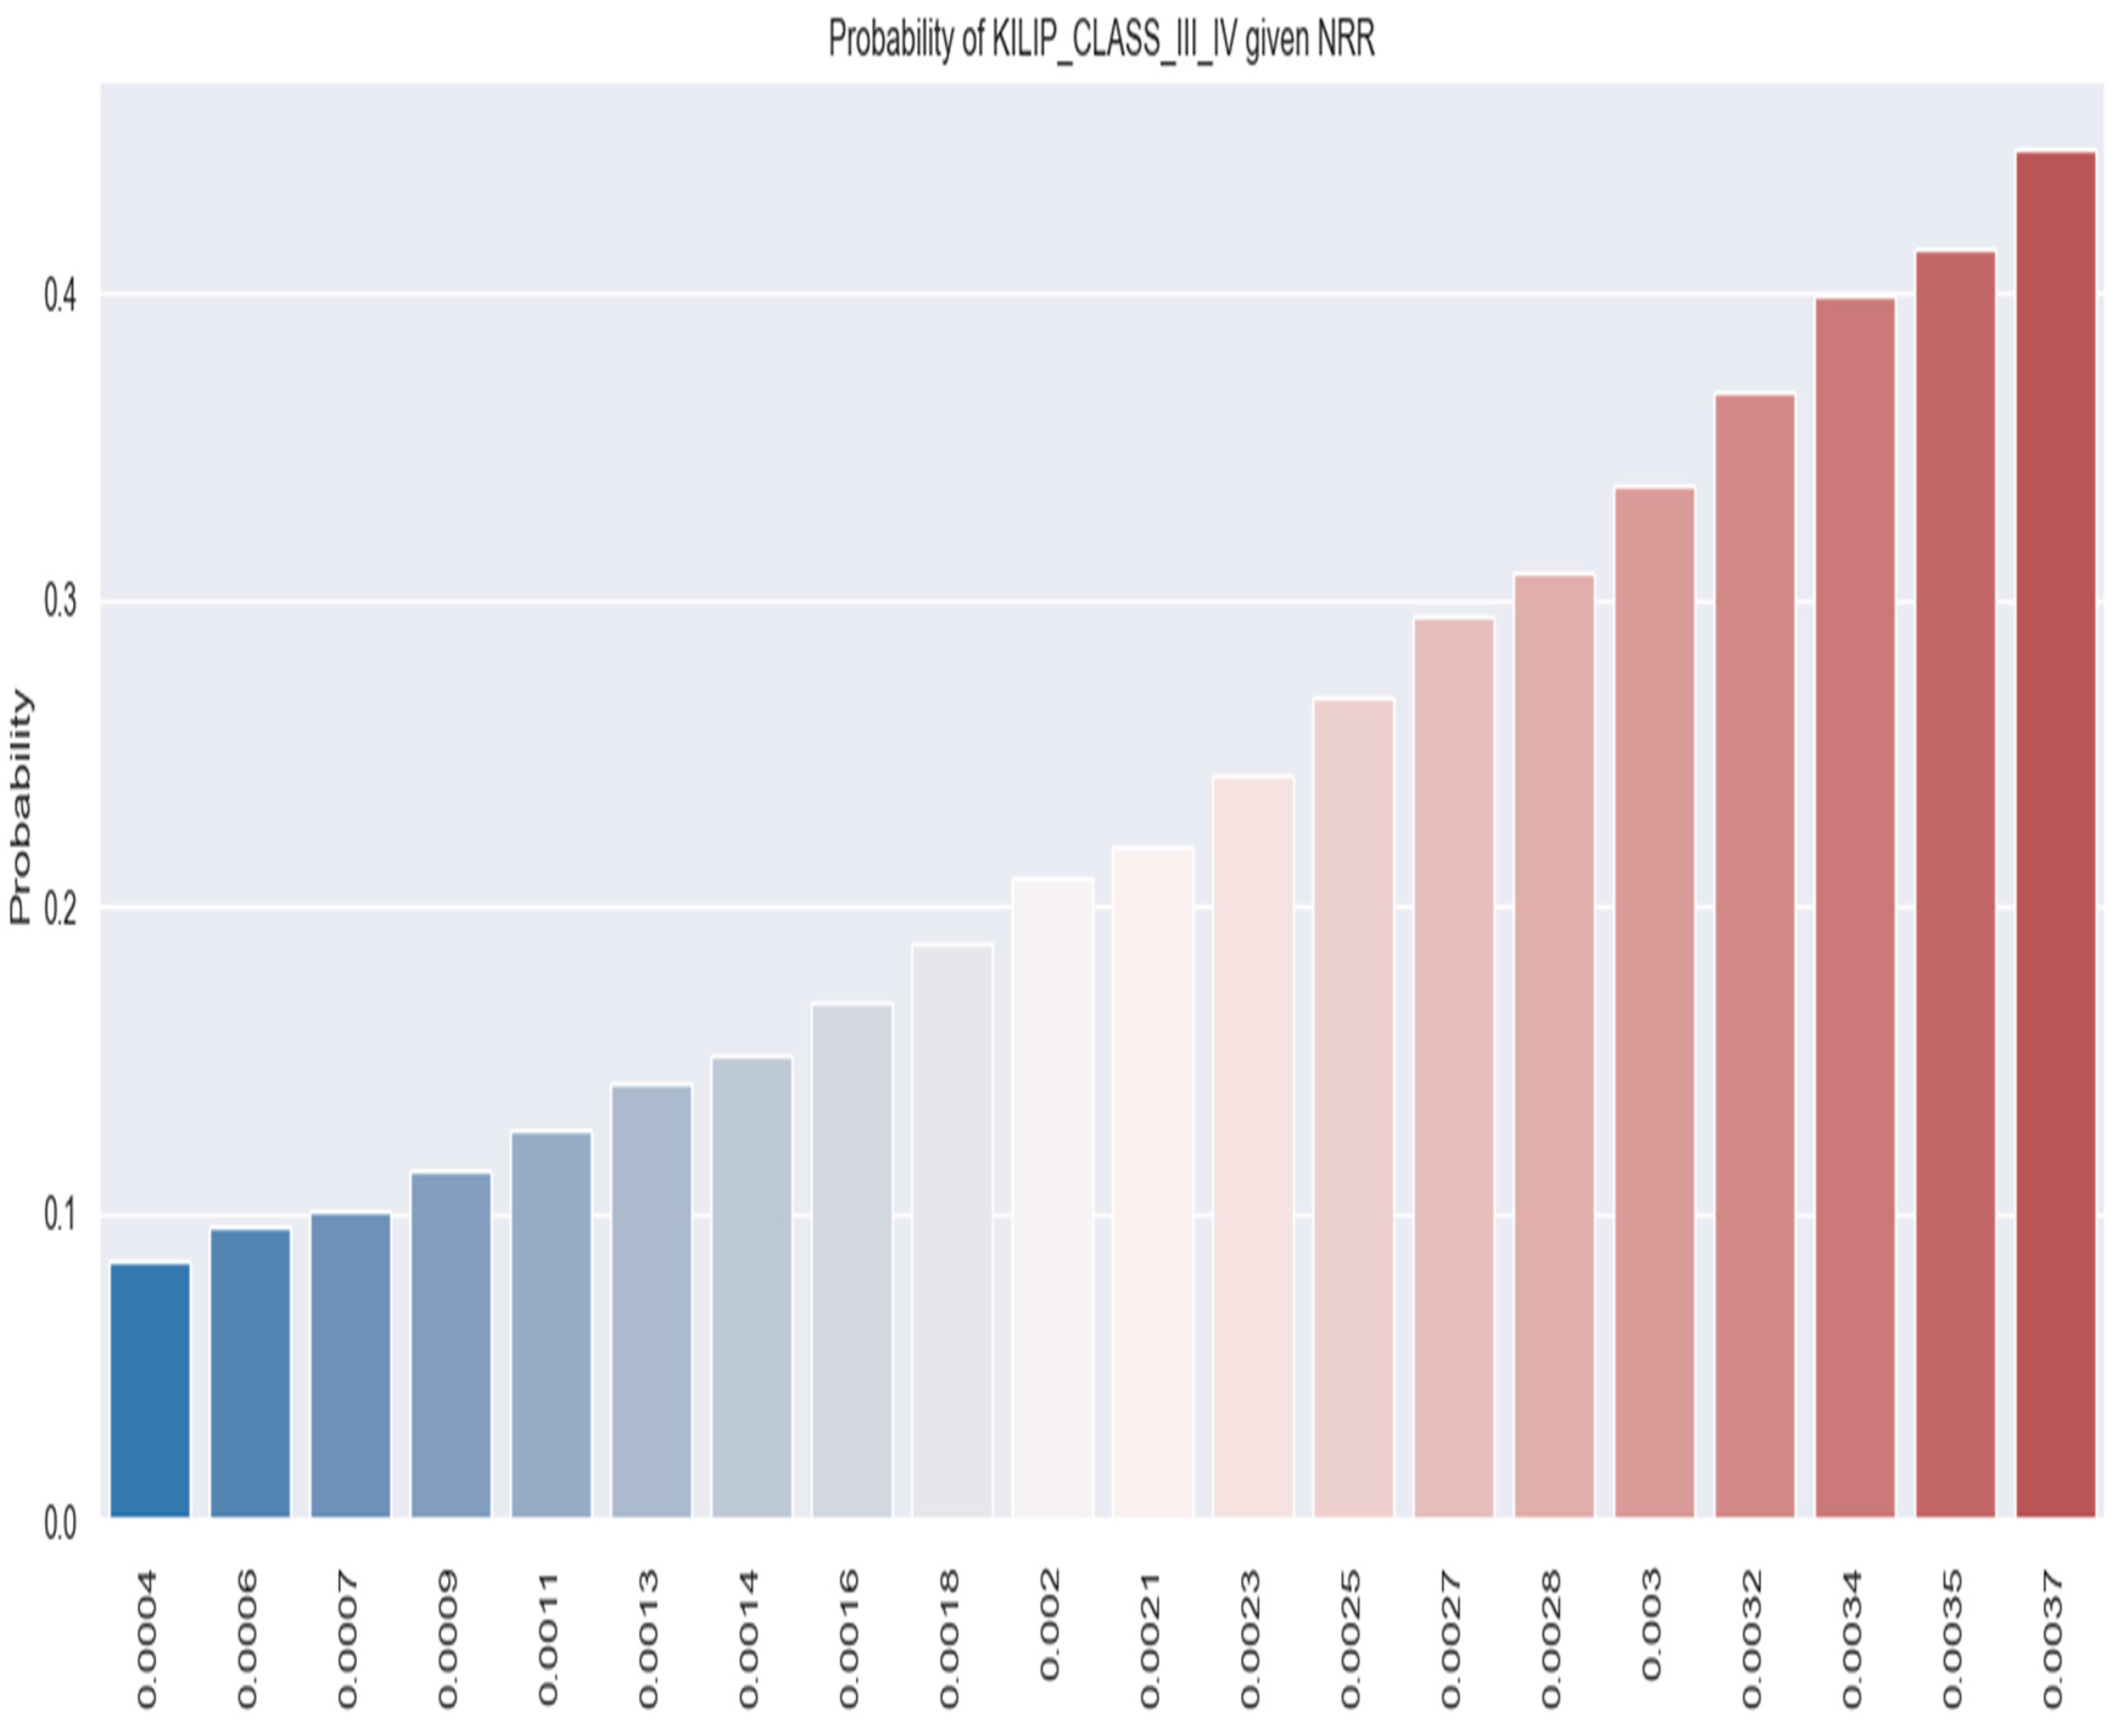
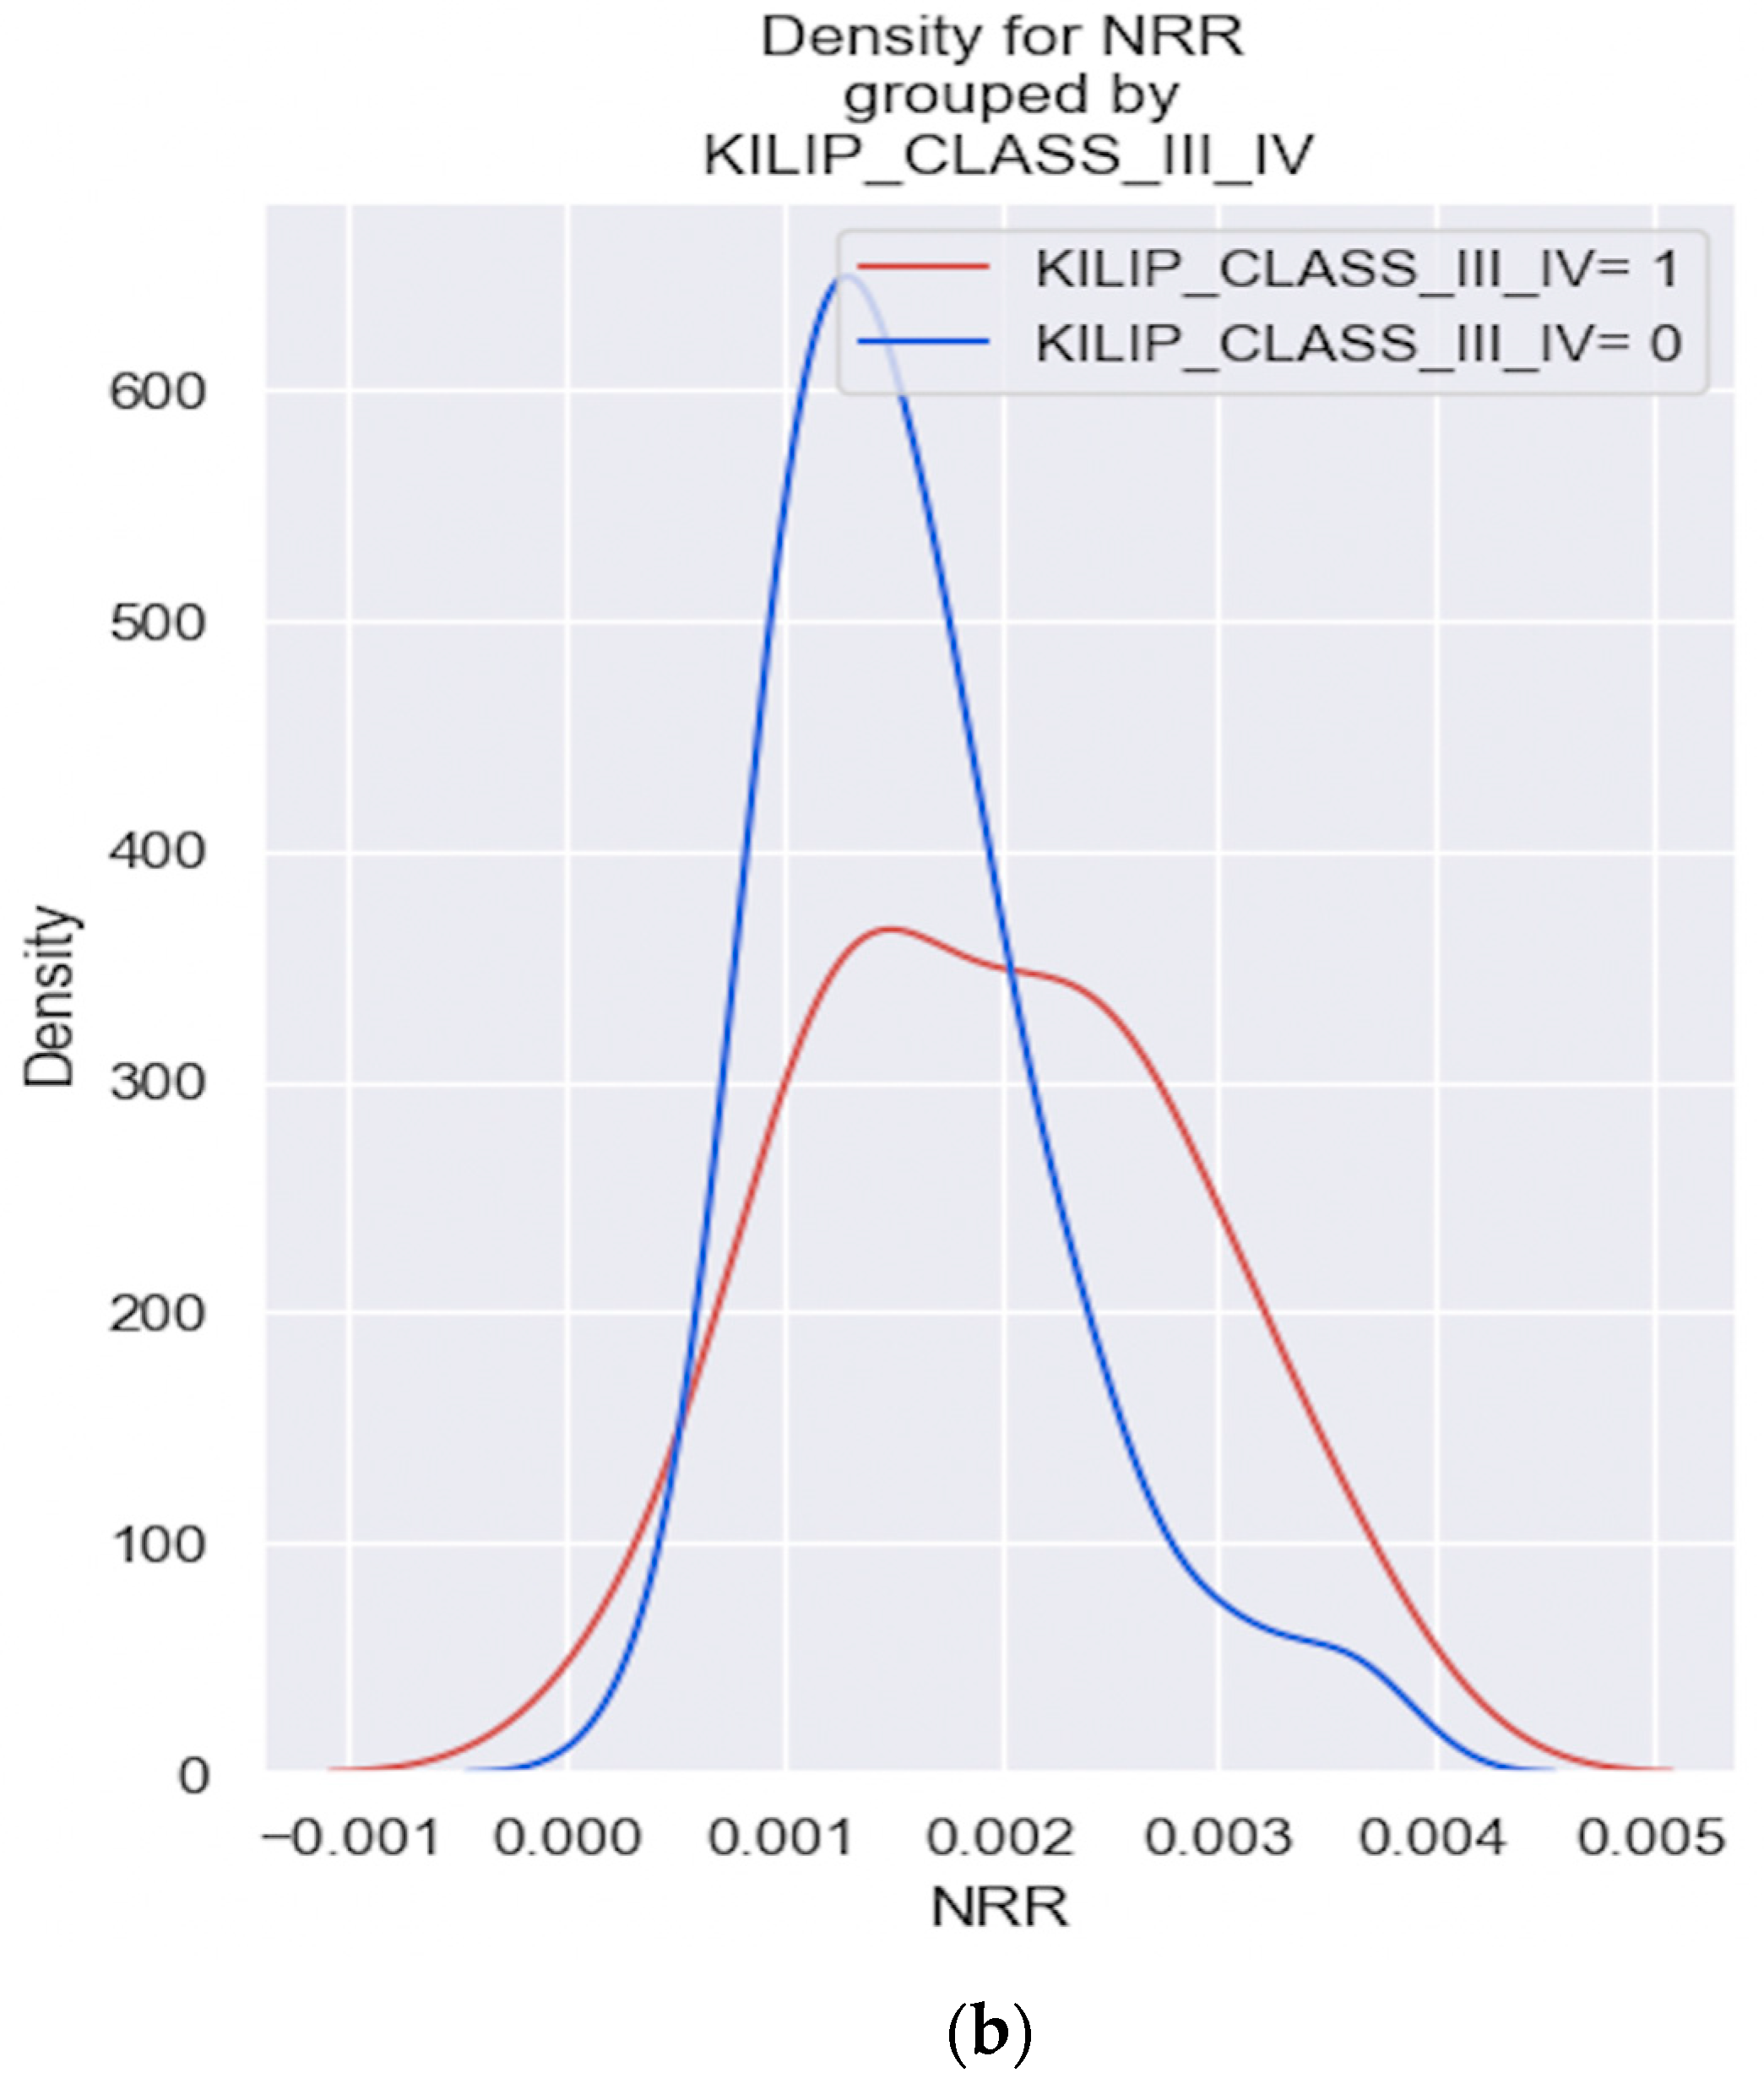
| Killip class III/IV | 0.03933 | NRR | 658.3634 | 0.055 |
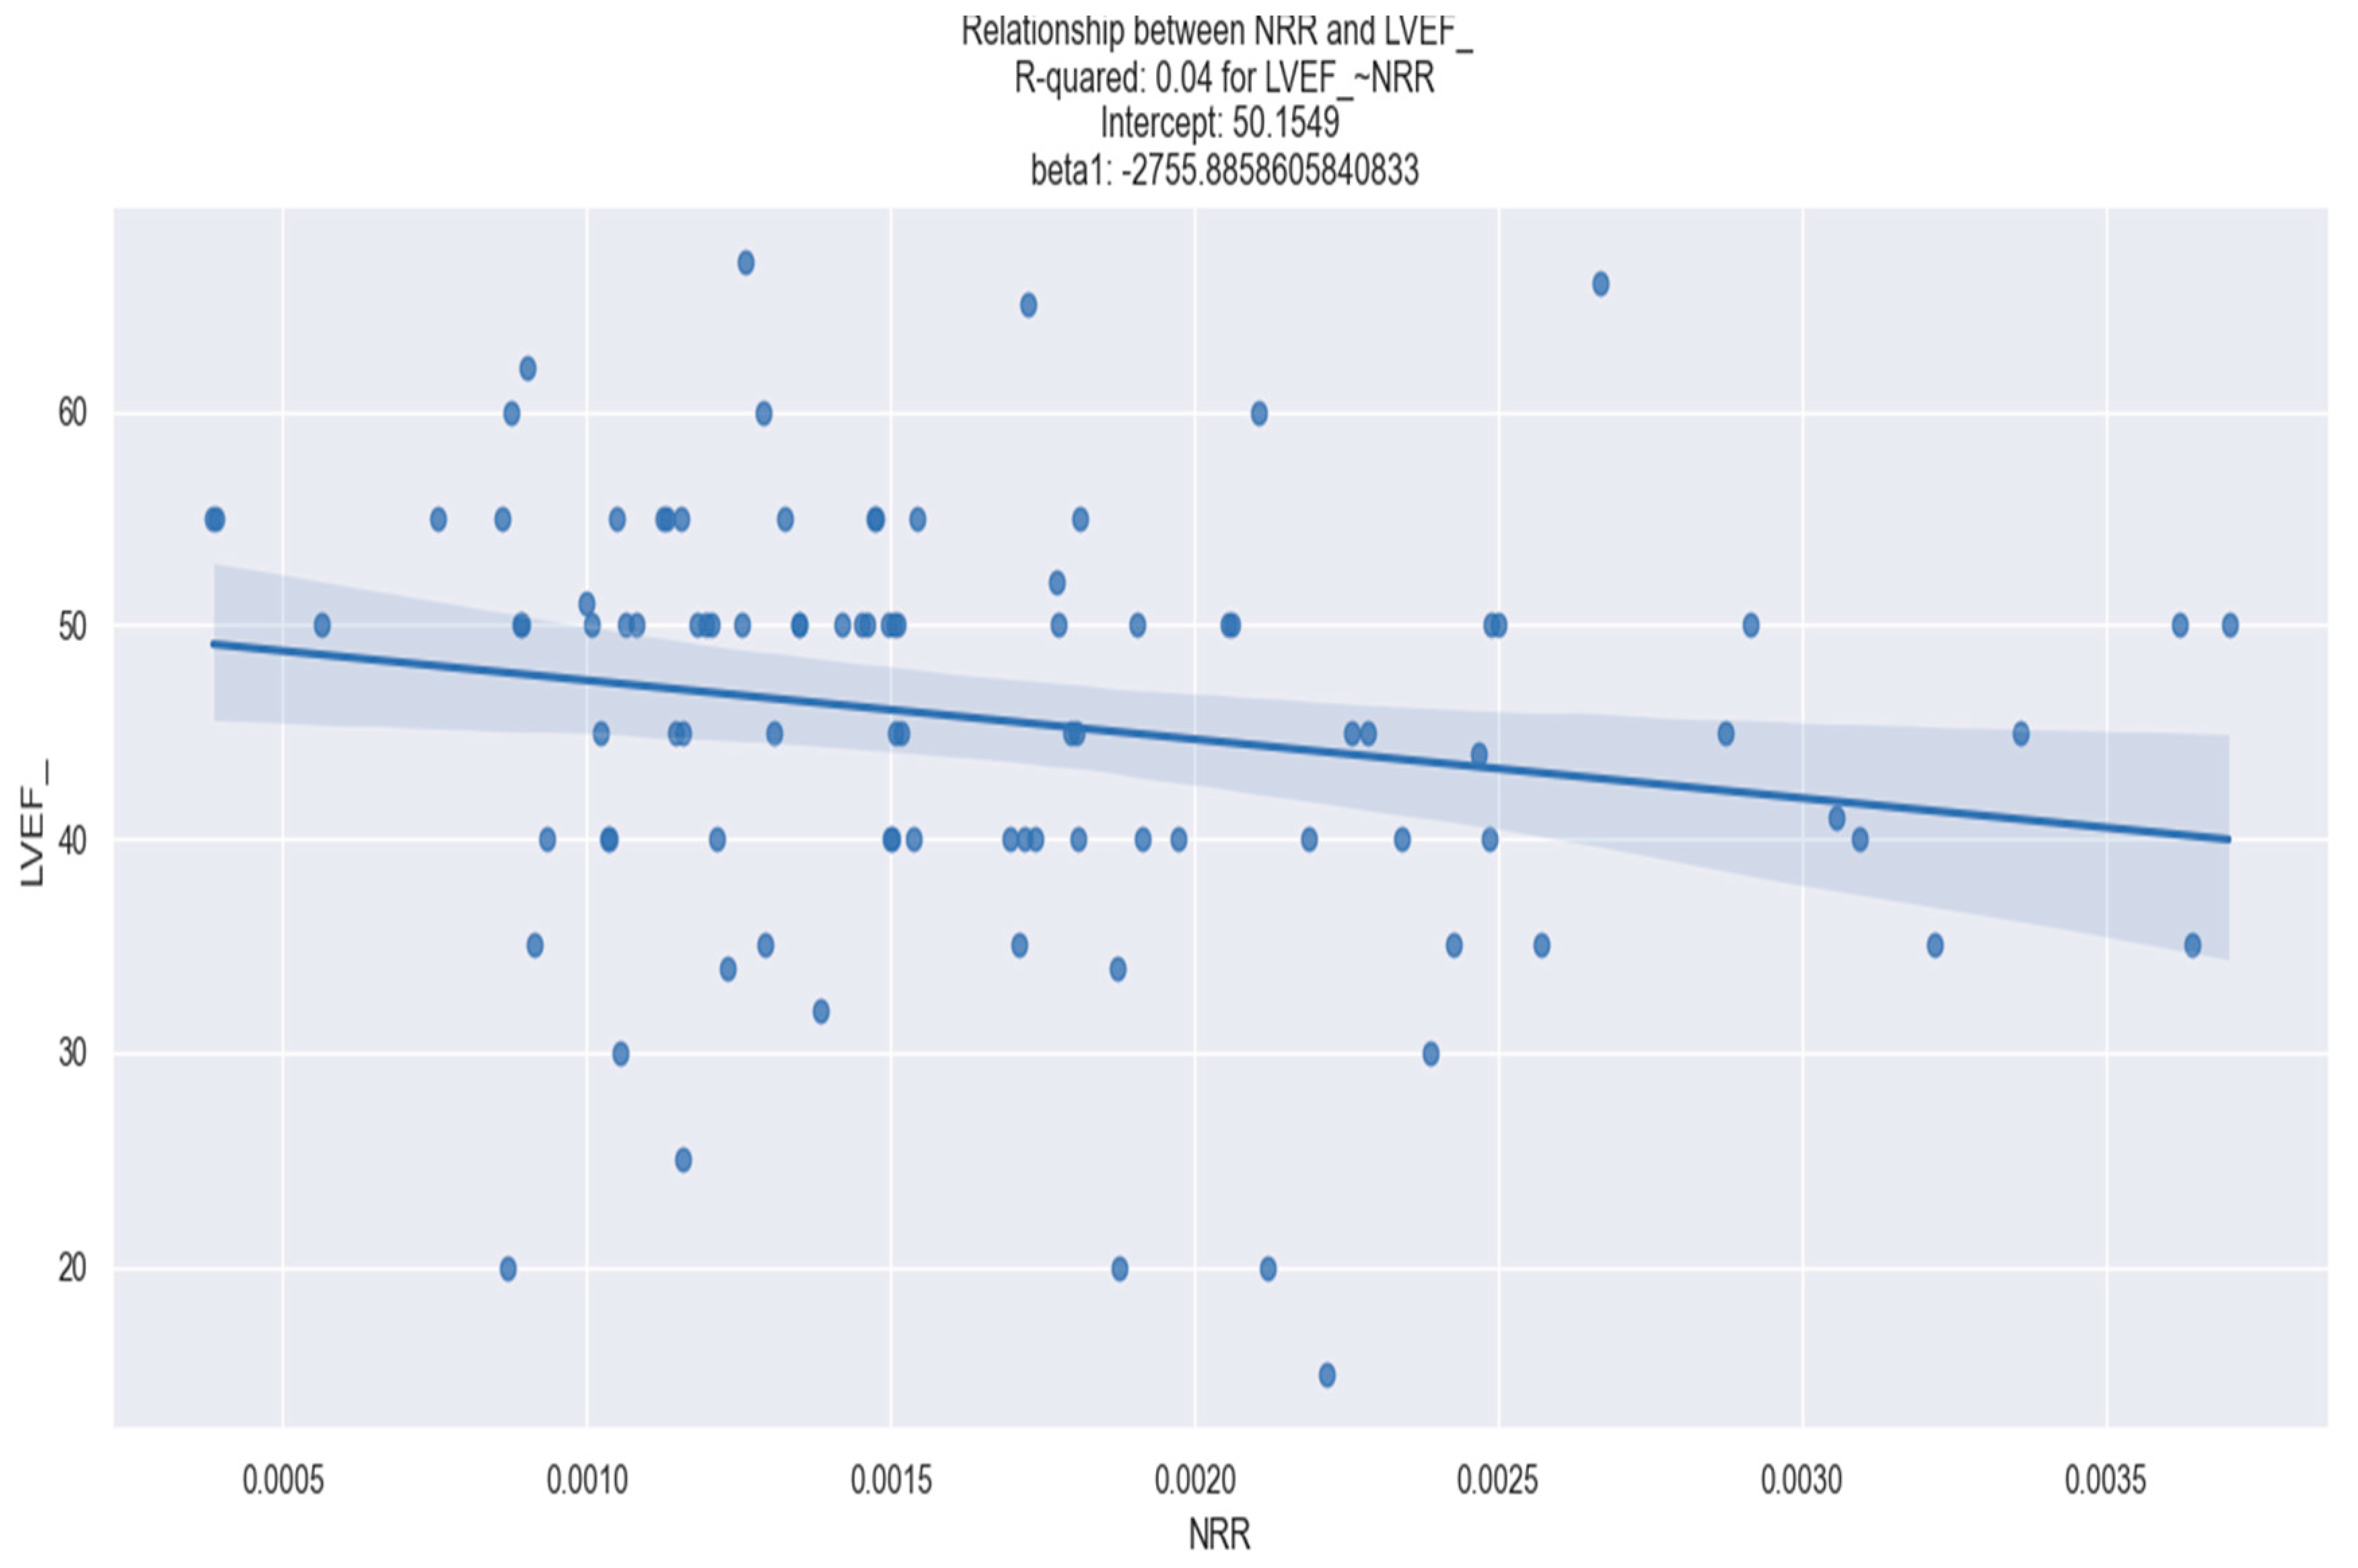
| LVEF | 0.040 | NRR | −2722.8859 | 0.048 |
| Triple vessel disease | 0.0001099 | NRR | 34.5361 | 0.906 |
| Indication for surgical revascularization | 0.0346 | NRR | 612.9748 | 0.047 |
| Length of hospital stay | 0.028/ | NRR | 683.4844 | 0.103 |
| In-hospital mortality | 0.04906 | NRR | 81.2499 | 0.077 |
| 30-day readmission | 0.009722 | NRR | −412.5714 | 0.504 |
| 30-day mortality | 0.002529 | NRR | 193.7938 | 0.748 |
| Dependent Variable | Killip Class III/IV | No. Observations | 97 | |||
|---|---|---|---|---|---|---|
| Model | Logit | Df Residuals: | 95.0 | |||
| Method | MLE | Df Model: | 1.0 | |||
| Date | Tue. 3 October 2023 | Pseudo R-squ.: | 0.03933 | |||
| Converged | TRUE | LL-Null: | −46.534 | |||
| Coef | Std err | Z | p > |z| | [0.025 | 0.975] | |
| Intercept | −2.6494 | 0.696 | −3.805 | 0.0 | −4.014 | −1.285 |
| NRR | 658.3634 | 342.773 | 1.921 | 0.055 | −13.46 | 1330.187 |
| Dependent Variable | R Squared | Independent Variable | Coefficient | p Value |
|---|---|---|---|---|
| NT-proBNP | 0.099 | LRR | −894,700 | 0.53 |
| Admission CK | 0.008 | LRR | −79,710 | 0.386 |
| Admission CK-MB | 0.07 | LRR | −8938 | 0.230 |
| Admission high-sensitivity troponin I | 0.015 | LRR | −2,337,000 | 0.229 |
| Peak CK | 0.001 | LRR | −45,080 | 0.774 |
| Peak CK-MB | 0.004 | LRR | −10,930 | 0.563 |
| Peak high-sensitivity troponin I | 0.000 | LRR | −510,200 | 0.881 |
| Creatinine | 0.000 | LRR | 11.444 | 0.895 |
| Dependent Variable | R Squared | Independent Variable | Coefficient | p Value |
|---|---|---|---|---|
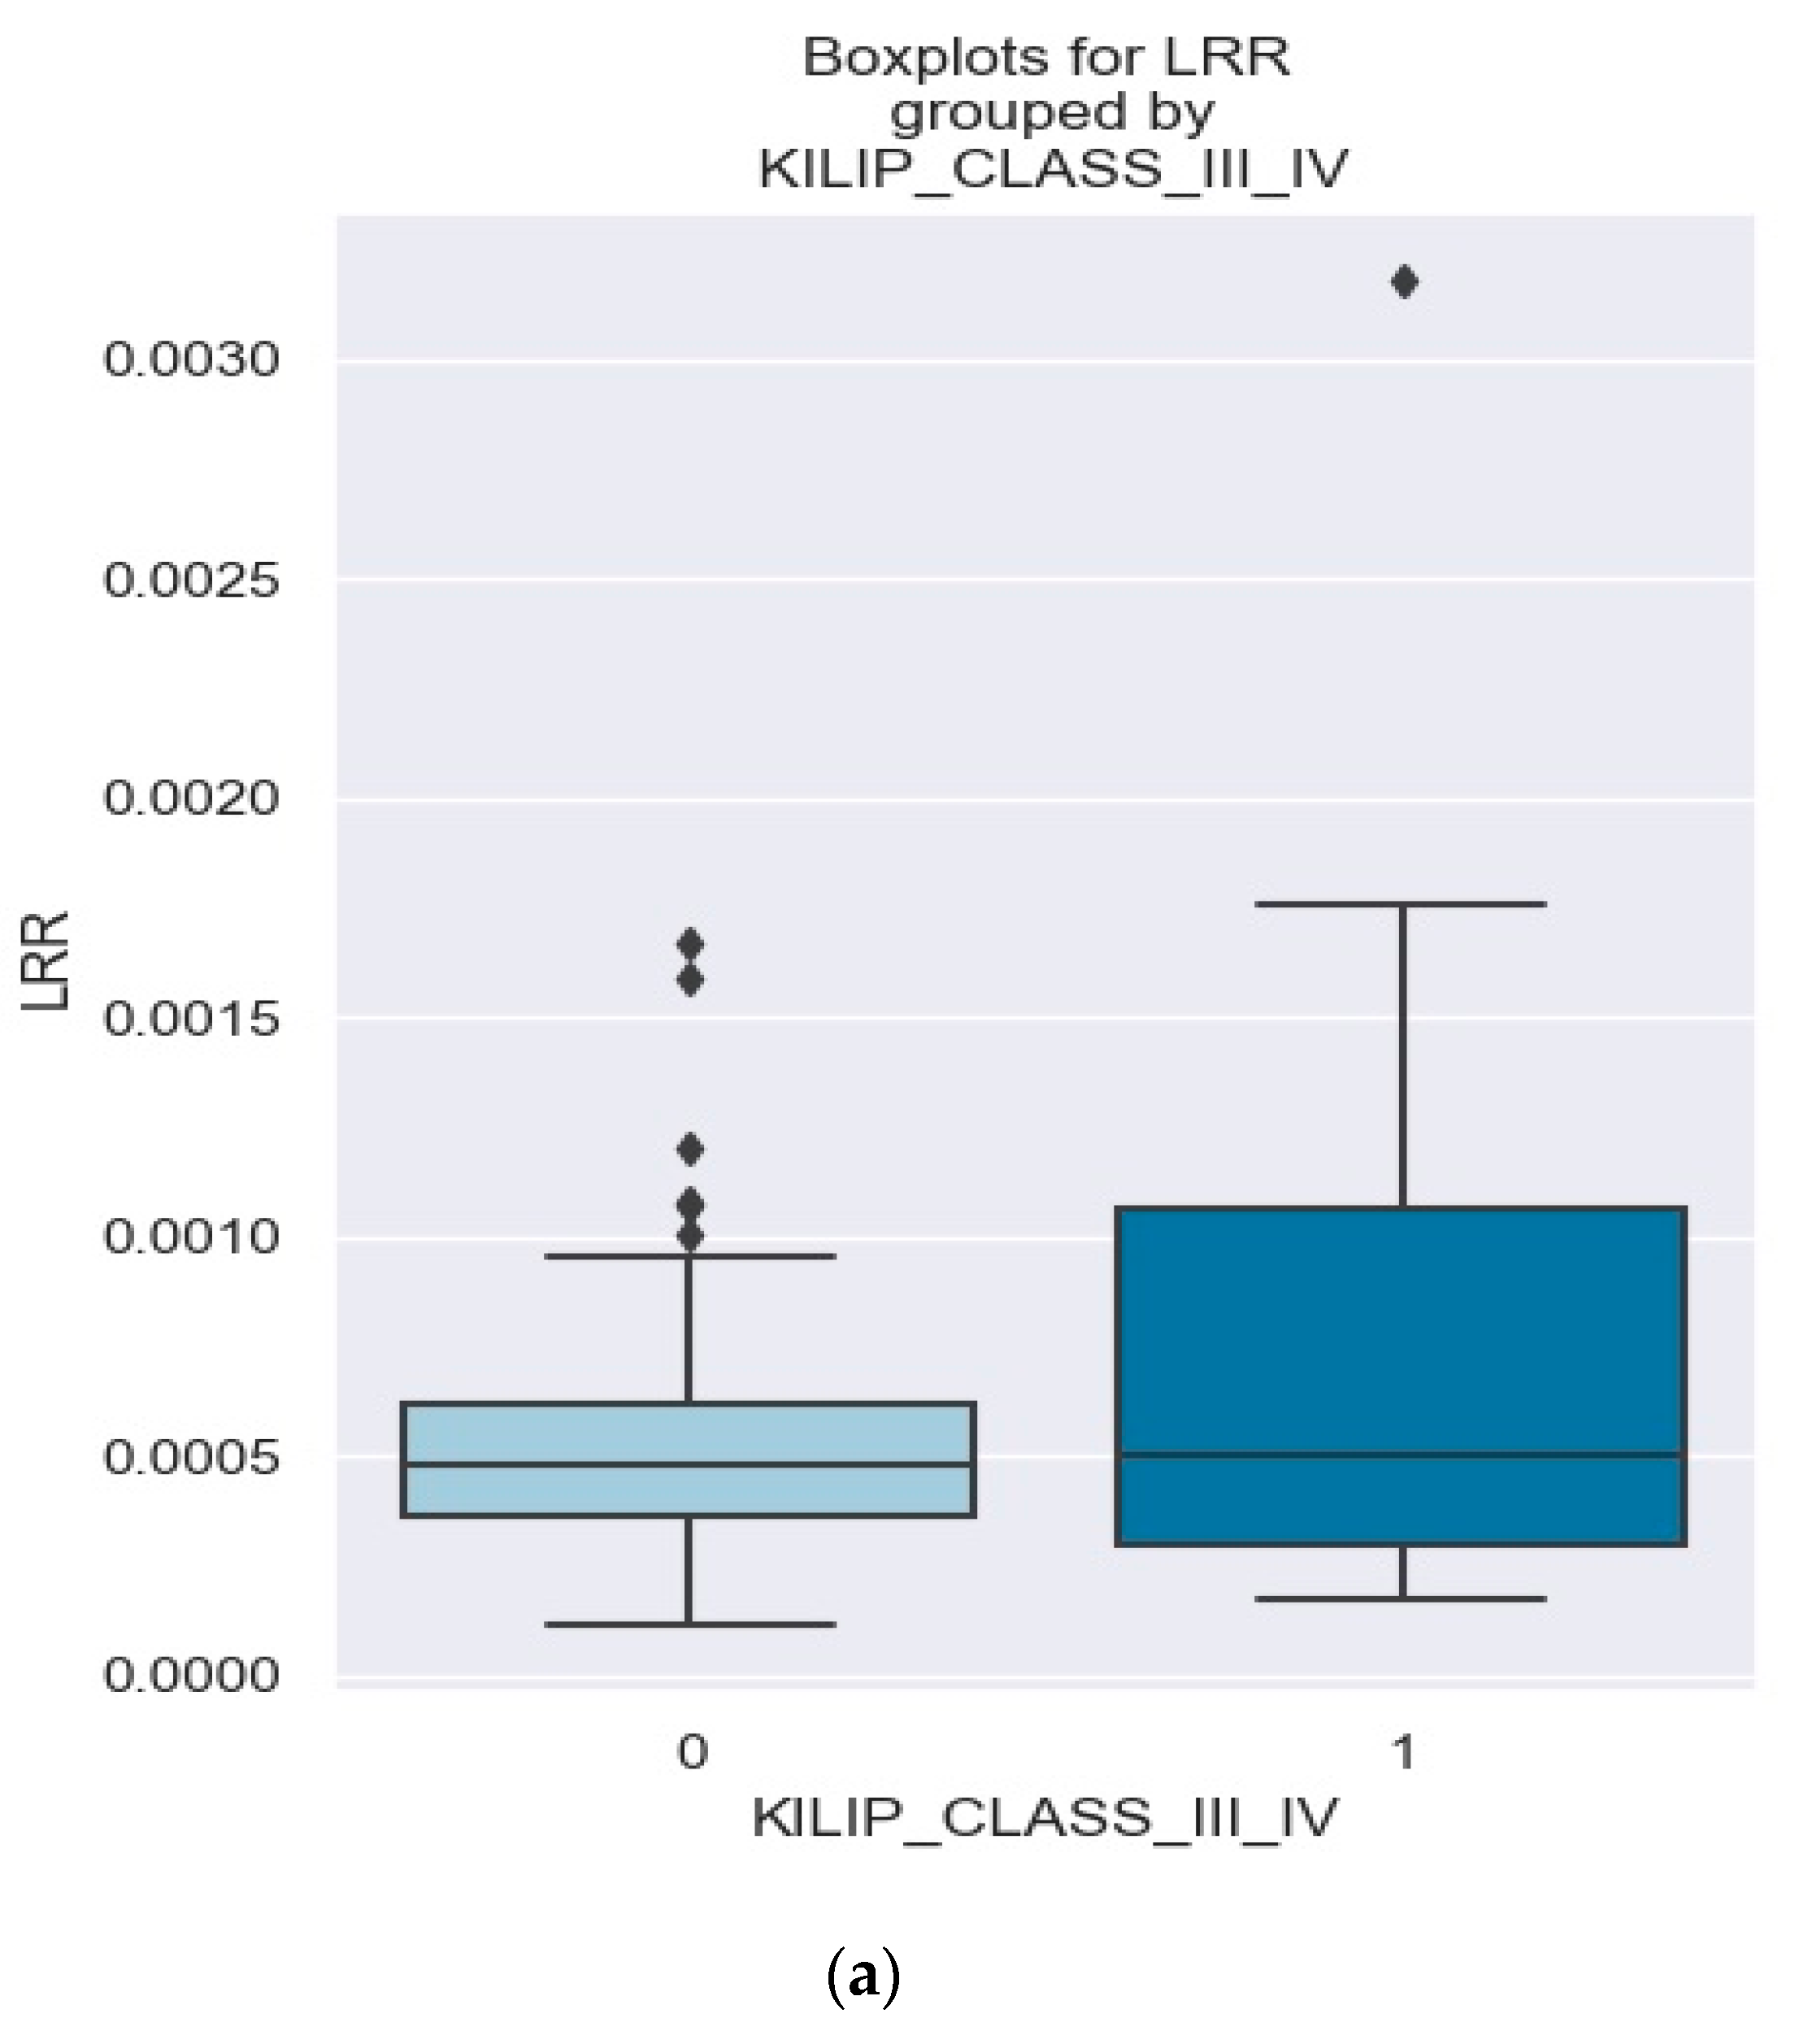
| Killip class III/IV | 0.04983 | LRR | 1203.1063 | 0.043 |
| LVEF | 0.00 | LRR | −52.78 | 0.983 |
| Triple vessel disease | 0.0453 | LRR | 33.3808 | 0.947 |
| Indication for surgical revascularization | 0.001761 | LRR | 232.7326 | 0.647 |
| Length of hospital stay | 0.008 | LRR | 634.6635 | 0.379 |
| In-hospital mortality | 0.1264 | LRR | 865.9245 | 0.015 |
| 30-day Readmission | 0.01596 | LRR | 660.7905 | 0.328 |
| 30-day mortality | 0.0007319 | LRR | 198.672 | 0.87 |
| Dependent Variable | Killip Class III–IV | No. Observations | 97 | |||
|---|---|---|---|---|---|---|
| Model | Logit | Df Residuals: | 95.0 | |||
| Method | MLE | Df Model: | 1.0 | |||
| Date | Tue. 3 October 2023 | Pseudo R-squ.: | 0.04983 | |||
| Converged | TRUE | LL-Null: | −46.534 | |||
| Coef | Std err | Z | p > |z| | [0.025 | 0.975] | |
| Intercept | −2.2424 | 0.477 | −4.7 | 0.0 | −3.178 | −1.307 |
| LRR | 1203.1063 | 595.883 | 2.019 | 0.043 | 35.198 | 2371.015 |
| Dependent Variable | R Squared | Independent Variable | Coefficient | p Value |
|---|---|---|---|---|
| NT-proBNP | 0.067 | MRR | 15,390,000 | 0.032 |
| Admission CK | 0.000 | MRR | 70,260.0 | 0.896 |
| Admission CK MB | 0.002 | MRR | 2730 | 0.210 |
| Admission high-sensitivity troponin I | 0.015 | MRR | −2,337,000 | 0.229 |
| Peak CK | 0.004 | MRR | −584,900 | 0.521 |
| Peak CKMB | 0.010 | MRR | −10,700 | 0.326 |
| Peak high-sensitivity troponin I | 0.002 | MRR | 7,873,000 | 0.697 |
| Creatinine | 0.104 | MRR | 1580.7824 | 0.001 |
| Dependent Variable | R Squared | Independent Variable | Coefficient | p Value |
|---|---|---|---|---|
| Killip class III/IV | 0.04963 | MRR | 7508.7325 | 0.033 |
| LVEF | 0.014 | MRR | −16,280 | 0.244 |
| Triple vessel disease | 0.02149 | MRR | 4826.8294 | 0.104 |
| Indication for surgical revascularization | 0.04572 | MRR | 7143.8966 | 0.025 |
| Length of hospitalization | 0.001 | MRR | 1017.7005 | 0.809 |
| In-hospital mortality | 0.04044 | MRR | 1393.9474 | 0.105 |
| 30-day Readmission | 0.0021 | MRR | 1717.5616 | 0.743 |
| 30-day mortality | 0.01314 | MRR | 4302.8286 | 0.461 |
| Dependent Variable | Killip Class III–IV | No. Observations | 97 | |||
|---|---|---|---|---|---|---|
| Model | Logit | Df Residuals: | 95.0 | |||
| Method | MLE | Df Model: | 1.0 | |||
| Date | Tue. 3 October 2023 | Pseudo R-squ.: | 0.04963 | |||
| Converged | TRUE | LL-Null: | −46.534 | |||
| Coef | Std err | Z | p > |z| | [0.025 | 0.975] | |
| Intercept | −2.8215 | 0.721 | −3.911 | 0.0 | −4.235 | −1.408 |
| MRR | 7508.7325 | 3531.517 | 2.126 | 0.033 | 587.086 | 14,400.0 |
Disclaimer/Publisher’s Note: The statements, opinions and data contained in all publications are solely those of the individual author(s) and contributor(s) and not of MDPI and/or the editor(s). MDPI and/or the editor(s) disclaim responsibility for any injury to people or property resulting from any ideas, methods, instructions or products referred to in the content. |
© 2024 by the authors. Licensee MDPI, Basel, Switzerland. This article is an open access article distributed under the terms and conditions of the Creative Commons Attribution (CC BY) license (https://creativecommons.org/licenses/by/4.0/).
Share and Cite
Jercălău, C.E.; Andrei, C.L.; Darabont, R.O.; Guberna, S.; Staicu, A.M.; Rusu, C.T.; Ceban, O.; Sinescu, C.J. Blood Cell Ratios Unveiled: Predictive Markers of Myocardial Infarction Prognosis. Healthcare 2024, 12, 824. https://doi.org/10.3390/healthcare12080824
Jercălău CE, Andrei CL, Darabont RO, Guberna S, Staicu AM, Rusu CT, Ceban O, Sinescu CJ. Blood Cell Ratios Unveiled: Predictive Markers of Myocardial Infarction Prognosis. Healthcare. 2024; 12(8):824. https://doi.org/10.3390/healthcare12080824
Chicago/Turabian StyleJercălău, Cosmina Elena, Cătălina Liliana Andrei, Roxana Oana Darabont, Suzana Guberna, Arina Maria Staicu, Cătălin Teodor Rusu, Octavian Ceban, and Crina Julieta Sinescu. 2024. "Blood Cell Ratios Unveiled: Predictive Markers of Myocardial Infarction Prognosis" Healthcare 12, no. 8: 824. https://doi.org/10.3390/healthcare12080824
APA StyleJercălău, C. E., Andrei, C. L., Darabont, R. O., Guberna, S., Staicu, A. M., Rusu, C. T., Ceban, O., & Sinescu, C. J. (2024). Blood Cell Ratios Unveiled: Predictive Markers of Myocardial Infarction Prognosis. Healthcare, 12(8), 824. https://doi.org/10.3390/healthcare12080824