Does Internet Use Affect Individuals’ Medical Service Satisfaction? Evidence from China


Abstract
:1. Introduction
2. Background: Medical Services and Internet Development Situation in China
3. Methodology
3.1. Data Source
3.2. Variable Setting
3.2.1. Dependent Variable
3.2.2. Explanatory Variable
3.3. Model Introduction and Estimation Method
3.4. Methods for the Robustness Check
4. Results
4.1. Statistical Analyses
4.2. Baseline Regression Results
4.3. Robustness Checks
4.3.1. Substitution Variable Method Ⅰ
4.3.2. Substitution Variable Method Ⅱ
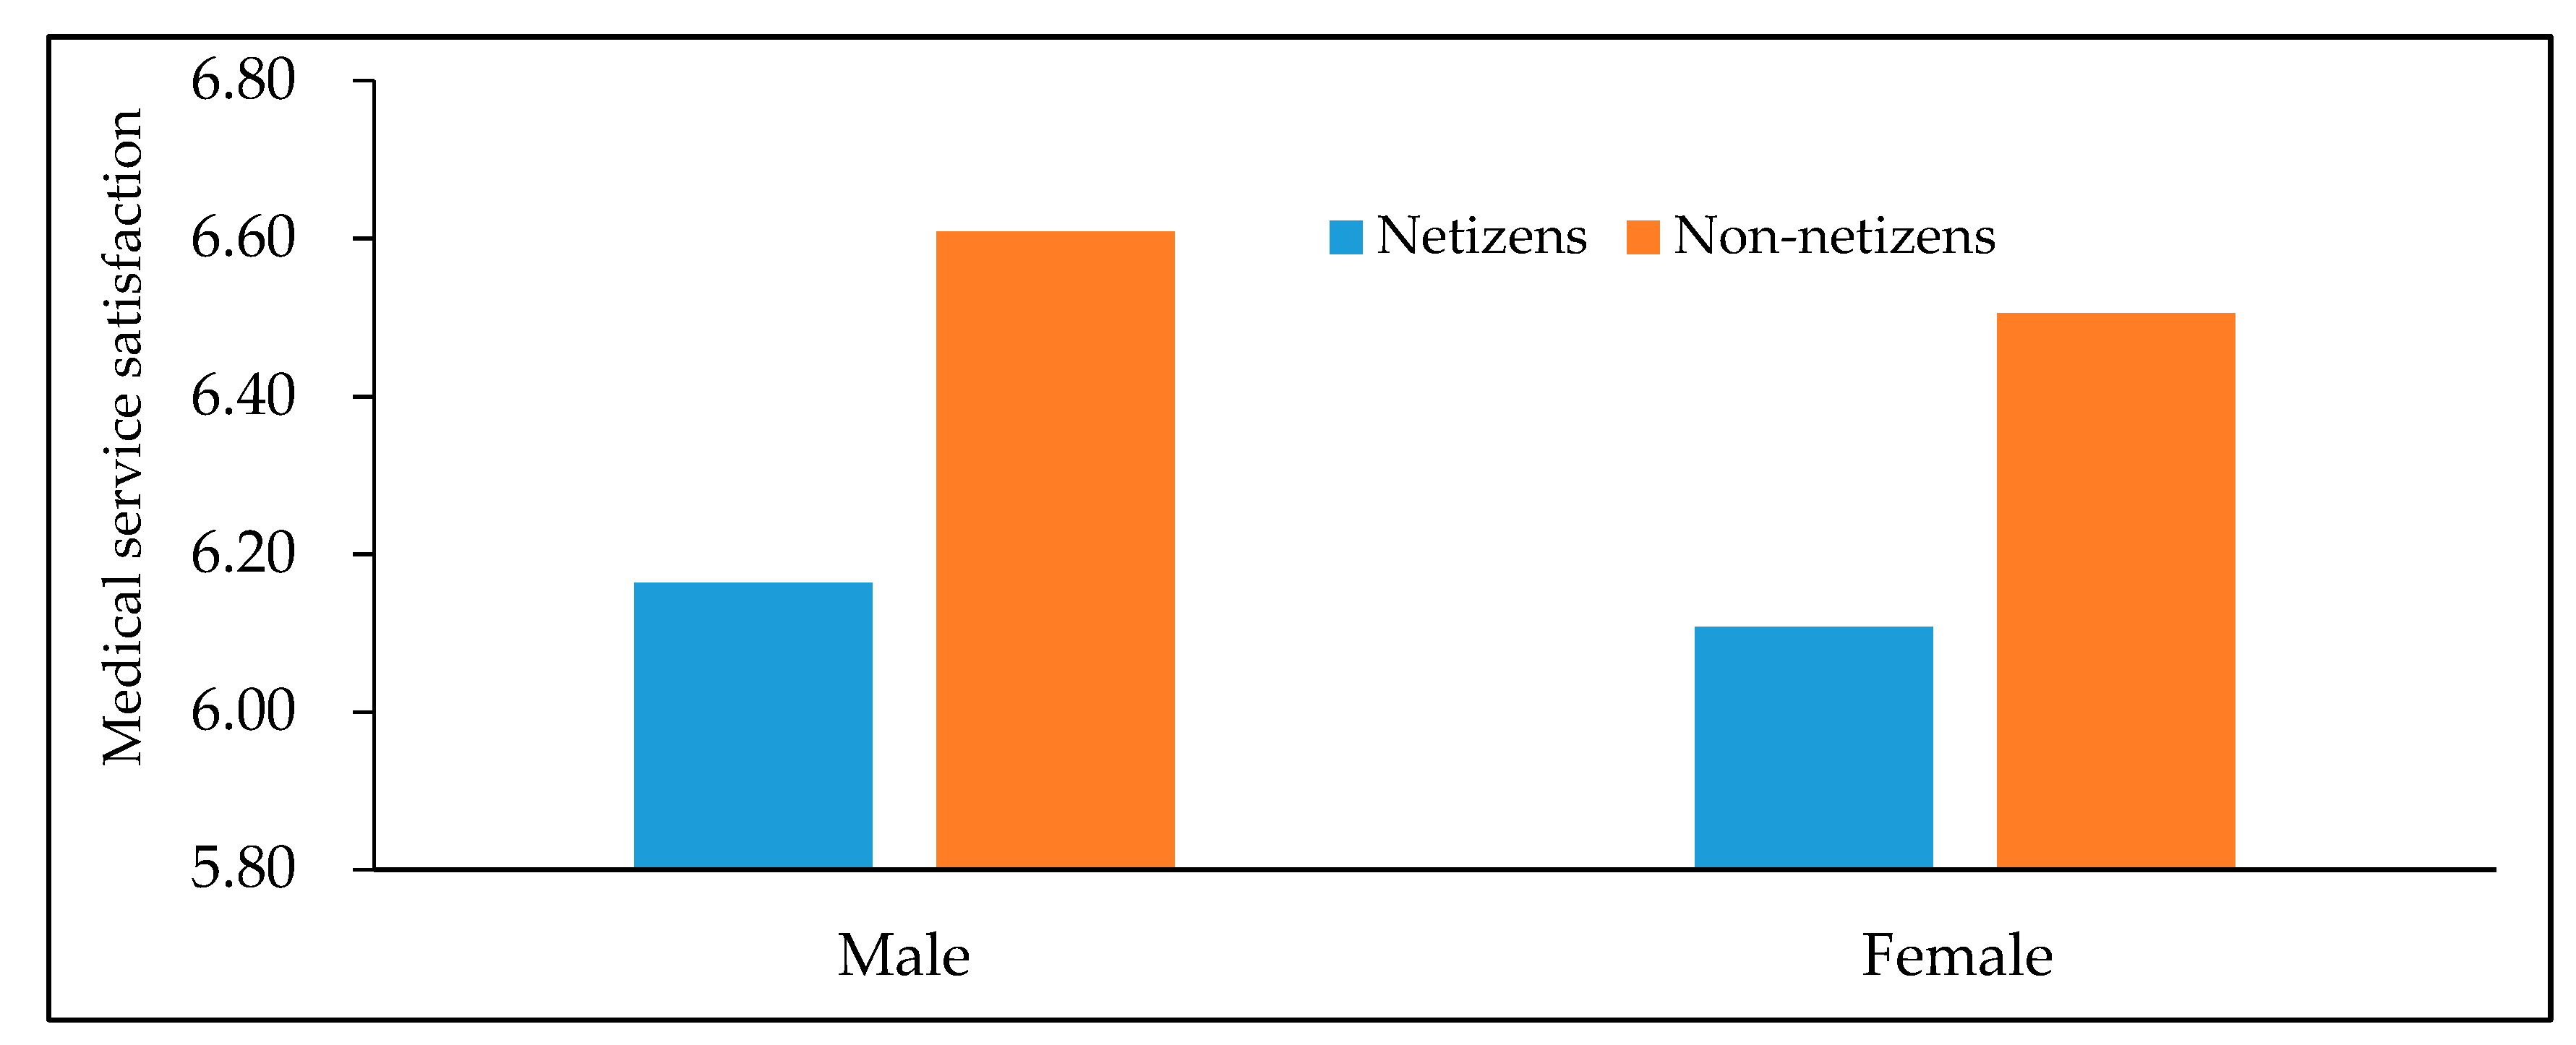
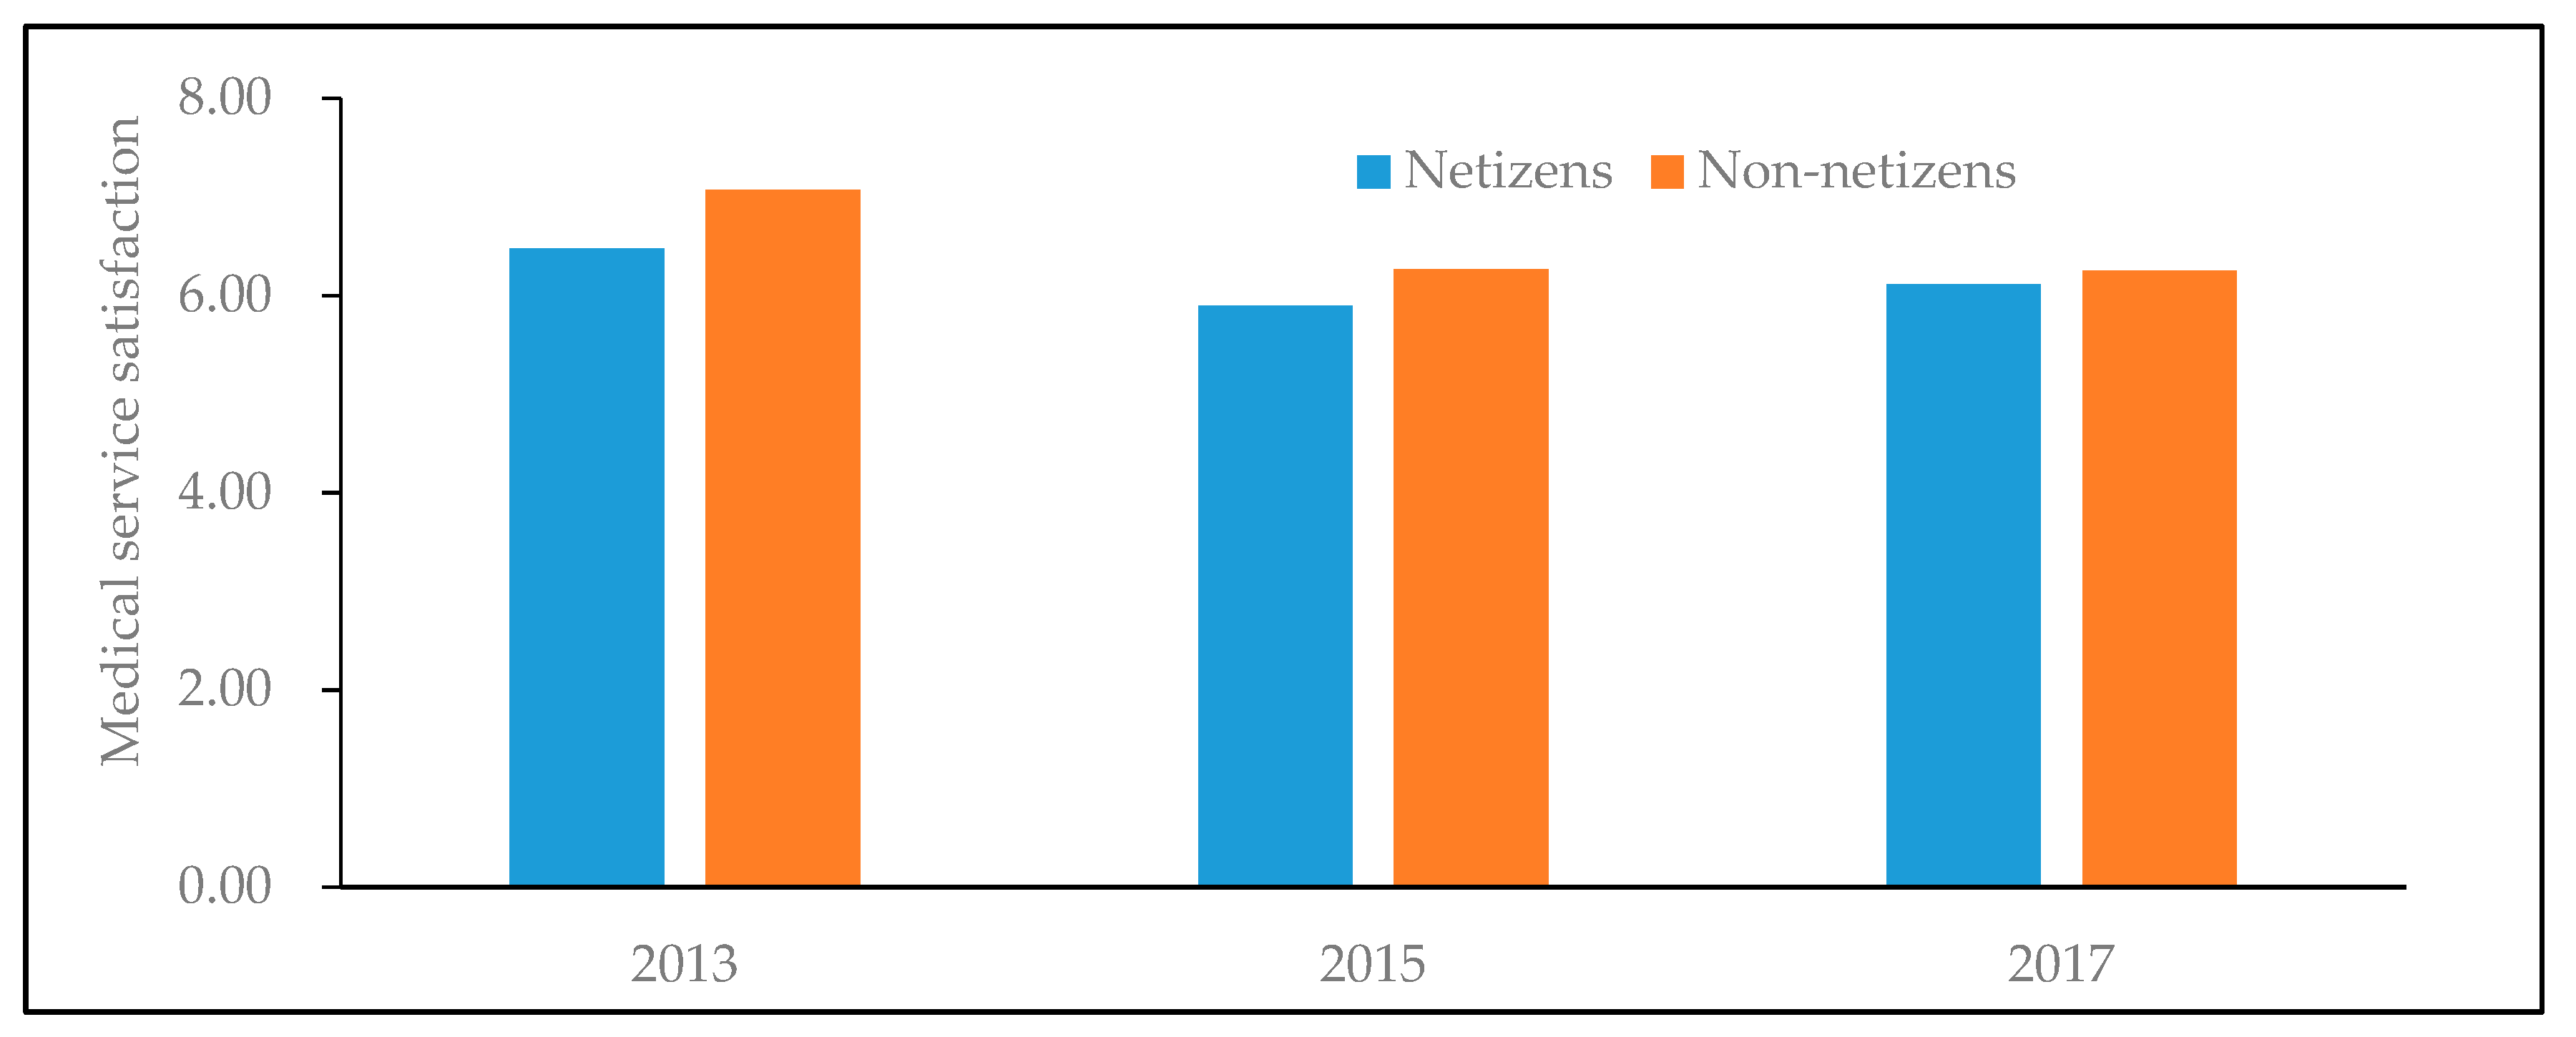
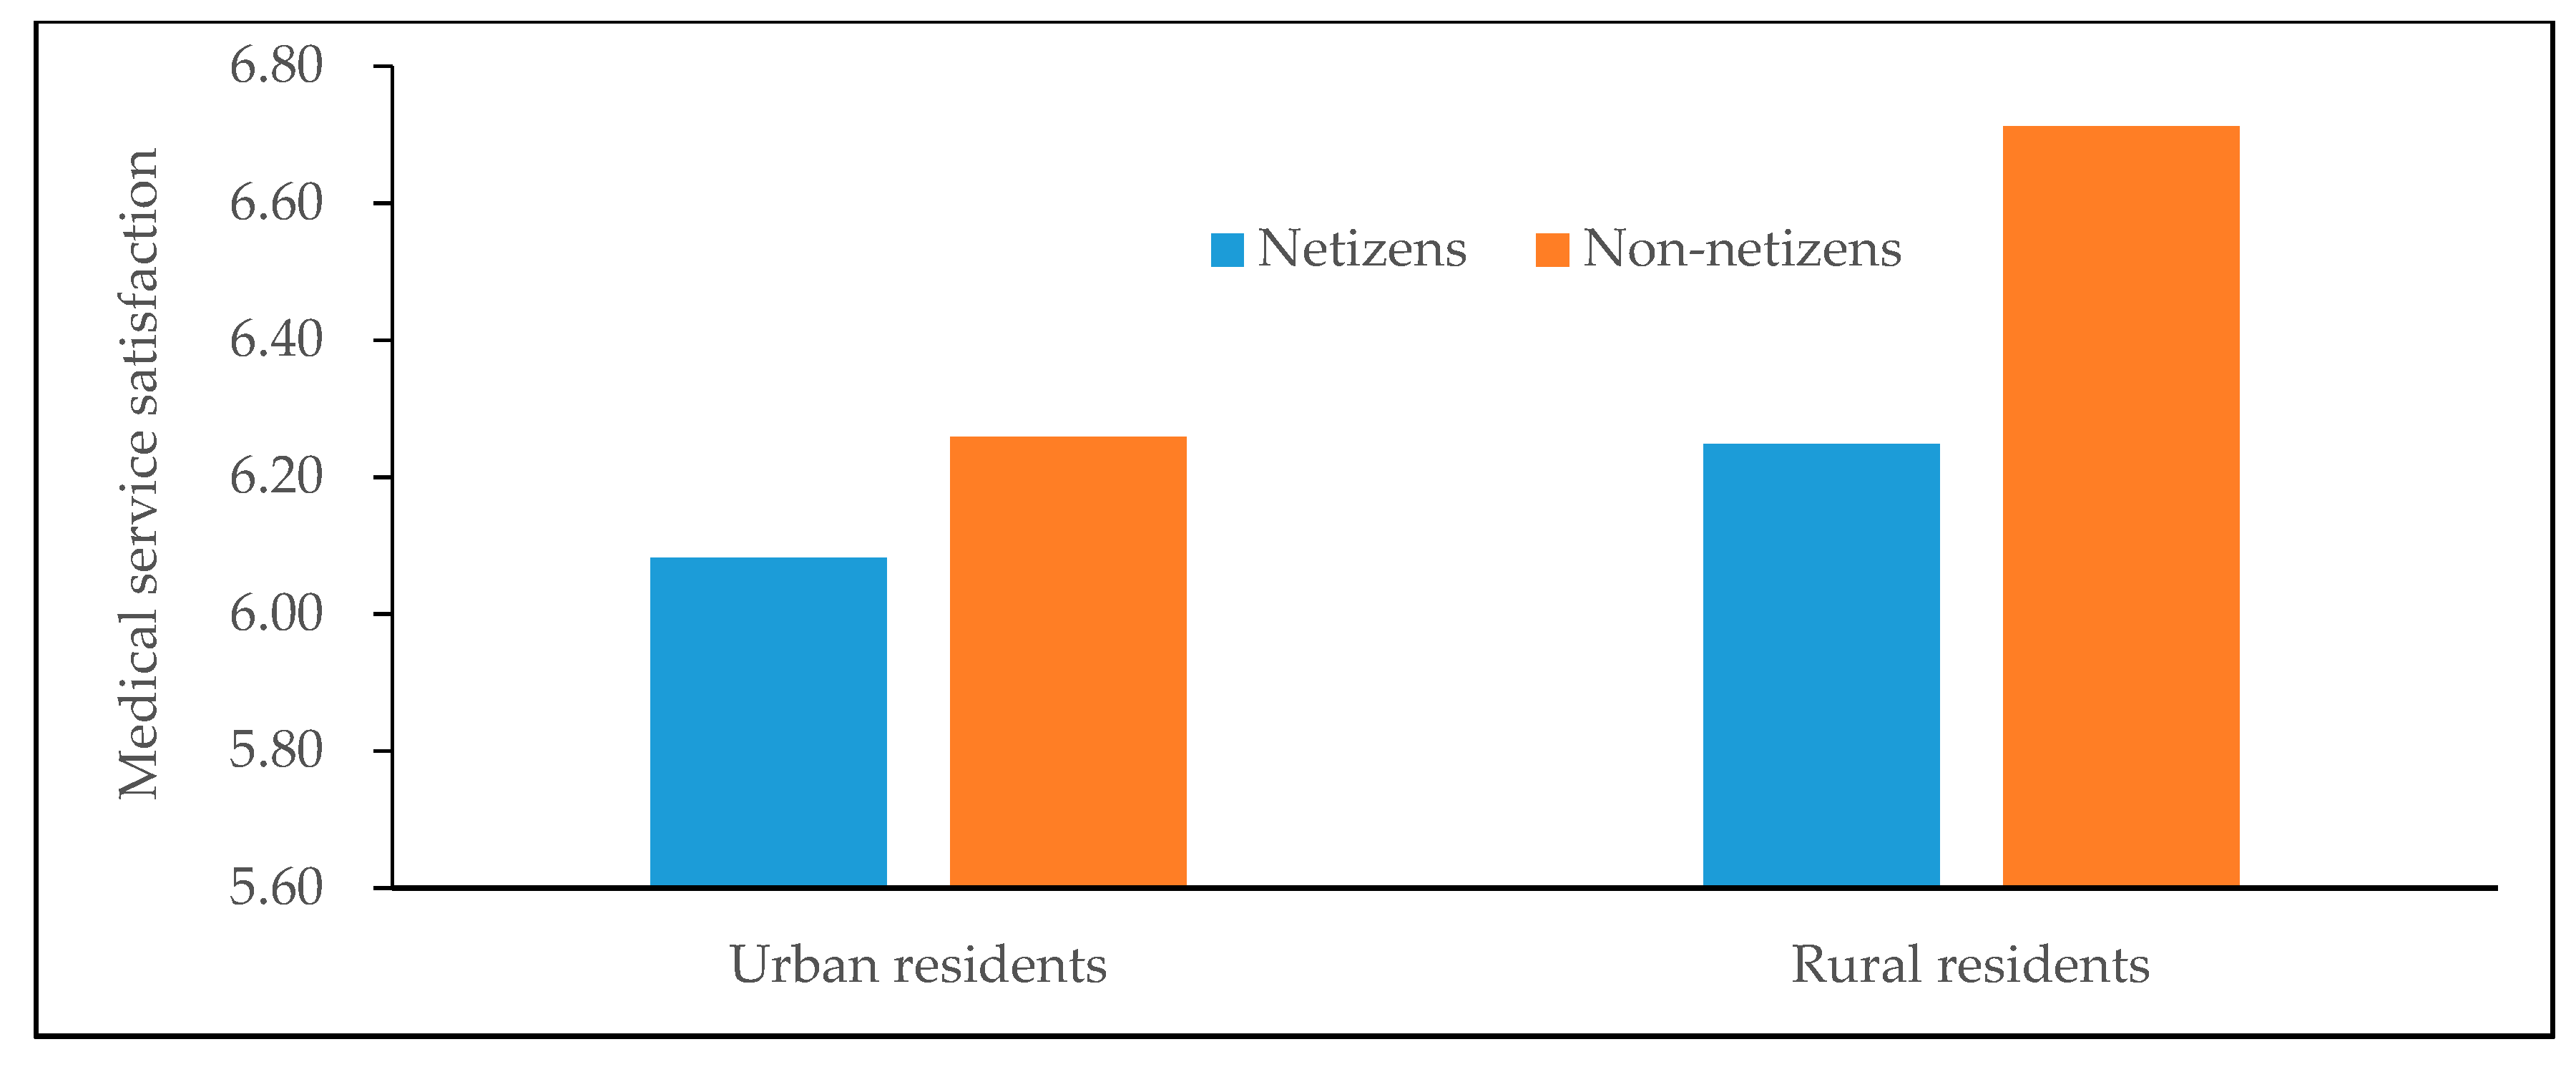
4.3.3. Subdivided Sample Analysis.
4.3.4. Internet Use and Medical Service Satisfaction (Ordered Logit and Probit Estimation)
4.3.5. PSM Analysis.
4.3.6. Internet Use and Medical Service Satisfaction: Placebo Test
5. Discussion
6. Limitations and Future Research
7. Conclusions
Author Contributions
Funding
Conflicts of Interest
References
- Zhao, S.; Lin, Q.; Ran, J.; Musa, S.S.; Yang, G.; Wang, W.; Lou, Y.; Gao, D.; Yang, L.; He, D.; et al. Preliminary estimation of the basic reproduction number of novel coronavirus (2019-nCoV) in China, from 2019 to 2020: A data-driven analysis in the early phase of the outbreak. Int. J. Infect. Dis. 2020, 92, 214–217. [Google Scholar] [CrossRef] [Green Version]
- Finance, S. The National Health Commission of the People’s Republic of China Refuted Rumors: Radix Isatidis and Fumigating Vinegar Cannot Prevent the Novel Coronavirus Pneumonia. Available online: https://finance.sina.cn/2020-01-21/detail-iihnzahk5670182.d.html?from=wap (accessed on 18 February 2020).
- The Paper. While Preventing and Controlling the “Virus Epidemic”, We Should also Guard the “Information Epidemic” War. Available online: http://www.sohu.com/a/371634927_354899 (accessed on 20 February 2020).
- Johansson, D.; Jönsson, P.; Ivarsson, B.; Christiansson, M. Information Technology and Medical Technology Personnel´s Perception Regarding Segmentation of Medical Devices: A Focus Group Study. Health 2020, 8, 23. [Google Scholar] [CrossRef] [PubMed] [Green Version]
- Hämeen-Anttila, K.; Pietilä, K.; Pylkkänen, L.; Pohjanoksa-Mäntylä, M. Internet as a source of medicines information (MI) among frequent internet users. Res. Soc. Adm. Pharm. 2018, 14, 758–764. [Google Scholar] [CrossRef] [PubMed] [Green Version]
- Liobikienė, G.; Bernatonienė, J. The determinants of access to information on the Internet and knowledge of health related topics in European countries. Health Policy 2018, 122, 1348–1355. [Google Scholar] [CrossRef] [PubMed]
- Alkhatlan, H.M.; Rahman, K.F.; Aljazzaf, B.H. Factors affecting seeking health-related information through the internet among patients in Kuwait. Alex. J. Med. 2018, 54, 331–336. [Google Scholar] [CrossRef] [Green Version]
- Jiang, S.; Beaudoin, C.E. Health literacy and the internet: An exploratory study on the 2013 HINTS survey. Comput. Hum. Behav. 2016, 58, 240–248. [Google Scholar] [CrossRef]
- De Rosis, S.; Barsanti, S. Patient satisfaction, e-health and the evolution of the patient-general practitioner relationship. Evidence from an Italian survey. Health Policy 2016, 120, 1279–1292. [Google Scholar] [CrossRef] [Green Version]
- Alghamdi, K.; Moussa, N.A. Internet use by the public to search for health-related information. Int. J. Med Inform. 2012, 81, 363–373. [Google Scholar] [CrossRef]
- Birkhoff, S.D.; Moriarty, H. Challenges in mobile health app research: Strategies for interprofessional researchers. J. Interprofessional Educ. Pr. 2020, 19, 100325. [Google Scholar] [CrossRef]
- Zhang, M.W.B.; Tran, B.X.; Huong, L.T.; Hinh, N.D.; Nguyen, H.L.; Tho, T.D.; Latkin, C.; Ho, R.C. Internet addiction and sleep quality among Vietnamese youths. Asian J. Psychiatry 2017, 28, 15–20. [Google Scholar] [CrossRef]
- Lin, C.-H.; Chen, S.-K.; Chang, S.-M.; Lin, S.S.J. Cross-lagged relationships between problematic Internet use and lifestyle changes. Comput. Hum. Behav. 2013, 29, 2615–2621. [Google Scholar] [CrossRef]
- Weinstein, A.M.; Lejoyeux, M. Internet Addiction or Excessive Internet Use. Am. J. Drug Alcohol Abus. 2010, 36, 277–283. [Google Scholar] [CrossRef] [Green Version]
- Yu, H.; Zhao, X.; Li, N.; Wang, M.; Zhou, P. Effect of excessive Internet use on the time–frequency characteristic of EGG. Prog. Nat. Sci. 2009, 19, 1383–1387. [Google Scholar] [CrossRef]
- Iacovelli, A.; Valenti, S. Internet addiction’s effect on likeability and rapport. Comput. Hum. Behav. 2009, 25, 439–443. [Google Scholar] [CrossRef]
- Anosike, A.; Olakunde, B.; Adeyinka, D.; Ezeokafor, C.; Amanze, O.; Mathews, O.; Alau, K.; Ogungbemi, K. Clients’ satisfaction with HIV treatment and care services in Nigeria. Public Health 2019, 167, 50–54. [Google Scholar] [CrossRef]
- Qiao, T.; Geater, A.; Chongsuvivatwong, V.; Fan, Y.; Guo, Z. Feedback intervention to doctors improves patient satisfaction among outpatients in Inner Mongolia Autonomous Region, China. Public Health 2017, 152, 136–144. [Google Scholar] [CrossRef]
- Vuković, M.; Gvozdenović, B.S.; Gajić, T.; Gajić, B.S.; Jakovljević, C.M.; Mccormickć, B.P. Validation of a patient satisfaction questionnaire in primary health care. Public Health 2012, 126, 710–718. [Google Scholar] [CrossRef]
- Singh, H.; Mustapha, N.; Haqq, E.D. Patient satisfaction at health centres in Trinidad and Tobago. Public Health 1996, 110, 251–255. [Google Scholar] [CrossRef]
- Zhang, L.; Cao, X.; Liang, Q.; Li, X.; Yang, J.; Yuan, J. High-frequency repetitive transcranial magnetic stimulation of the left dorsolateral prefrontal cortex restores attention bias to negative information in methamphetamine addicts. Psychiatry Res. 2018, 265, 151–160. [Google Scholar] [CrossRef]
- Bebbington, K.; Macleod, C.; Ellison, T.M.; Fay, N. The sky is falling: Evidence of a negativity bias in the social transmission of information. Evol. Hum. Behav. 2017, 38, 92–101. [Google Scholar] [CrossRef] [Green Version]
- Macatee, R.J.; Albanese, B.J.; Schmidt, N.B.; Cougle, J.R. Attention bias towards negative emotional information and its relationship with daily worry in the context of acute stress: An eye-tracking study. Behav. Res. Ther. 2017, 90, 96–110. [Google Scholar] [CrossRef] [Green Version]
- Norris, C.J.; Larsen, J.T.; Crawford, L.E.; Cacioppo, J.T. Better (or worse) for some than others: Individual differences in the positivity offset and negativity bias. J. Res. Personal. 2011, 45, 100–111. [Google Scholar] [CrossRef]
- Vaish, A.; Grossmann, T.; Woodward, A. Not all emotions are created equal: The negativity bias in social-emotional development. Psychol. Bull. 2008, 134, 383–403. [Google Scholar] [CrossRef] [Green Version]
- Baumeister, R.F.; Bratslavsky, E.; Finkenauer, C.; Vohs, K.D. Bad is stronger than good. Rev. Gen. Psychol. 2001, 5, 323–370. [Google Scholar] [CrossRef]
- Carretié, L.; Mercado, F.; Tapia, M.; Hinojosa, J.A. Emotion, attention and the ‘negativity bias’, studied through event-related potentials. Int. J. Psychophysiol. 2001, 41, 75–85. [Google Scholar] [CrossRef]
- Kensinger, E.A. Negative emotion enhances memory accuracy: Behavioral and neuroimaging evidence. Curr. Dir. Psychol. Sci. 2007, 16, 213–218. [Google Scholar] [CrossRef]
- Rozin, P.; Royzman, E.B. Negativity bias, negativity dominance, and contagion. Pers. Soc. Psychol. Rev. 2001, 5, 296–320. [Google Scholar] [CrossRef]
- Walker, C.J.; Blaine, B. The virulence of dread rumors: A field experiment. Lang. Commun. 1991, 11, 291–297. [Google Scholar] [CrossRef]
- Hamlin, J.K.; Wynn, K.; Bloom, P. 3-month-olds show a negativity bias in their social evaluations. Dev. Sci 2010, 13, 923–929. [Google Scholar] [CrossRef] [Green Version]
- Fessler, D.M.; Pisor, A.C.; Navarrete, C.D. Negatively-biased credulity and the cultural evolution of beliefs. PLoS ONE 2014, 9, e95167. [Google Scholar] [CrossRef]
- Carstensen, L.L.; Deliema, M. The positivity effect: A negativity bias in youth fades with age. Curr. Opin. Behav. Sci. 2018, 19, 7–12. [Google Scholar] [CrossRef]
- Baltazar, N.C.; Shutts, K.; Kinzler, K.D. Children show heightened memory for threatening social actions. J. Exp. Child Psychol. 2012, 112, 102–110. [Google Scholar] [CrossRef]
- Öhman, A.; Lundqvist, D.; Esteves, F. The face in the crowd revisited: A threat advantage with schematic stimuli. J. Personal. Soc. Psychol. 2001, 80, 381–396. [Google Scholar] [CrossRef]
- Shook, N.J.; Fazio, R.H.; Vasey, M.W. Negativity bias in attitude learning: A possible indicator of vulnerability to emotional disorders? J. Behav. Ther. Exp. Psychiatr 2007, 38, 144–155. [Google Scholar] [CrossRef]
- Abramson, L.Y.; Metalsky, G.I.; Alloy, L.B. Hopelessness depression: A theorybased subtype of depression. Psychol. Rev. 1989, 96, 358–372. [Google Scholar] [CrossRef]
- Pinto, A.; Whisman, M.A. Negative affect and cognitive biases in suicidal and nonsuicidal hospitalized adolescents. J. Am. Acad. Child Adolesc. Psychiatry 1996, 35, 158–165. [Google Scholar] [CrossRef]
- Watters, A.J.; Williams, L.M. Negative biases and risk for depression; integrating self-report and emotion task markers. Depress. Anxiety 2011, 28, 703–718. [Google Scholar] [CrossRef]
- Williams, L.M.; Gatt, J.M.; Schofield, P.R.; Olivieri, G.; Peduto, A.; Gordon, E. ‘Negativity bias’ in risk for depression and anxiety: Brain–body fear circuitry correlates, 5-HTT-LPR and early life stress. Neuroimage 2009, 47, 804–814. [Google Scholar] [CrossRef]
- Zhang, J.; Cheng, M.; Wei, X.; Gong, X.; Zhang, S. Internet use and the satisfaction with governmental environmental protection: Evidence from China. J. Clean. Prod. 2019, 211, 1025–1035. [Google Scholar] [CrossRef]
- Maslow, A.H. Motivation and Personality; Harper: New York, NY, USA, 1954. [Google Scholar]
- Liu, H.; Zhao, Z. Does health insurance matter? Evidence from China’s urban resident basic medical insurance. J. Comp. Econ. 2014, 42, 1007–1020. [Google Scholar] [CrossRef]
- Zhu, S.; Li, L.; Li, Y. China’s criminal penalty for medical malpractice: Too lenient or not? Leg. Med. 2011, 13, 116–119. [Google Scholar] [CrossRef]
- Huang, M.; Wang, J.; Ni, X.; Chen, G.; Kong, L. Neurocritical care in China: Past, present, and future. World Neurosurg. 2016, 95, 502–506. [Google Scholar] [CrossRef]
- Zeng, H.J.; Zhou, G.Y.; Yan, H.H.; Yang, X.H.; Jin, H.M. Chinese nurses are at high risk for suicide: A review of nurses suicide in china 2007–2016. Arch. Psychiatr. 2018, 32, 896–900. [Google Scholar] [CrossRef]
- Sohu. China’s Top 10 Buzzwords of Social Life in 2018. 2018. Available online: https://www.sohu.com/a/285263283_189783 (accessed on 8 February 2020).
- Fernandes, A.M.; Mattoo, A.; Nguyen, H.; Schiffbauer, M. The Internet and Chinese exports in the pre-ali baba era. J. Dev. Econ. 2019, 138, 57–76. [Google Scholar] [CrossRef] [Green Version]
- National Bureau of Statistics of China. Number of Internet Users. 2019. Available online: http://data.stats.gov.cn/easyquery.htm?cn=C01 (accessed on 8 February 2020).
- China Industry Information Network. Forecast and Analysis of the Market Status of China’s Medical Informatization Industry and the Size of the Internet Medical Market in the First Half of 2018. 2018. Available online: http://www.chyxx.com/industry/201812/699893.html (accessed on 8 February 2020).
- Institute of Sociology, Chinese Academy of Social Sciences. China Social Survey (CSS). Available online: http://css.cssn.cn/css_sy/ (accessed on 8 February 2020).
- Zhang, J.; Cai, Z.; Cheng, M.; Zhang, H.; Zhang, H.; Zhu, Z. Association of Internet use with attitudes toward food safety in China: A cross-sectional study. Int. J. Environ. Res. Public Health 2019, 16, 4162. [Google Scholar] [CrossRef] [Green Version]
- Tranos, E.; Stich, C. Individual internet usage and the availability of online content of local interest: A multilevel approach. Comput. Environ. Urban Syst. 2020, 79, 101371. [Google Scholar] [CrossRef]
- Asadullah, M.N.; Xiao, S.; Yeoh, E. Subjective well-being in China, 2005–2010: The role of relative income, gender, and location. China Econ. Rev. 2018, 48, 83–101. [Google Scholar] [CrossRef] [Green Version]
- Zheng, S.; Duan, Y.; Ward, M.R. The effect of broadband internet on divorce in China. Technol. Forecast. Soc. Chang. 2019, 139, 99–114. [Google Scholar] [CrossRef]
- Rosenbaum, P.R.; Rubin, D.B. The central role of the propensity score in observational studies for causal effects. Biometrika 1983, 70, 41–55. [Google Scholar] [CrossRef]
- Rosenbaum, P.R.; Rubin, D.B. Constructing a control group using multivariate matched sampling methods that incorporate the propensity score. Am. Stat. 1985, 39, 33–38. [Google Scholar]
- Choi, D.H.; Yoo, W.; Noh, G.Y.; Park, K. The impact of social media on risk perceptions during the MERS outbreak in South Korea. Comput. Hum. Behav. 2017, 72, 422–431. [Google Scholar] [CrossRef]
- Christensen, A.S.P.; Meyer, M.K.H.; Dalum, P.; Krarup, A.F. Can a mass media campaign raise awareness of alcohol as a risk factor for cancer and public support for alcohol related policies? Prev. Med. 2019, 126, 105722. [Google Scholar] [CrossRef]
- Bago, J.L.; Lompo, M.L. Exploring the linkage between exposure to mass media and HIV awareness among adolescents in Uganda. Sex. Reprod. Healthc. 2019, 21, 1–8. [Google Scholar] [CrossRef]
- Chen, W.; Stoecker, C. Mass media coverage and influenza vaccine uptake. Vaccine 2020, 38, 271–277. [Google Scholar] [CrossRef]
- Seki, T.; Hamazaki, K.; Natori, T.; Inadera, H. Relationship between internet addiction and depression among Japanese university students. J. Affect. Disord. 2019, 256, 668–672. [Google Scholar] [CrossRef]
- Yücens, B.; Üzer, A. The relationship between internet addiction, social anxiety, impulsivity, self-esteem, and depression in a sample of Turkish undergraduate medical students. Psychiatry Res. 2018, 267, 313–318. [Google Scholar] [CrossRef]


| Variable | Definition |
|---|---|
| MSS | Ten categories: From very dissatisfied = 1 to very satisfied = 10. |
| IU | Using the Internet = 1, else = 0 |
| Gender | Male = 1, female = 0 |
| Age | Respondents’ age |
| Education | Six categories: Illiteracy = 1, primary school = 2, junior high school = 3, senior high school=4, undergraduate = 5, graduate = 6 |
| Political identity | Party member = 1, else = 0 |
| Household registration | Urban = 1, rural = 0 |
| Family economic level | Five categories: Low = 1 and high = 5. |
| Medical insurance | Have medical insurance = 1, else = 0 |
| Attitudes toward Internet information | Four categories: Strongly disagree = 1 and strongly agree = 4. |
| Attitudes toward netizens | Four categories: Strongly disagree = 1 and strongly agree = 4. |
| Watching TV | Six categories: Never= 1 and every day = 6. |
| Listening radio, | Six categories: Never= 1 and every day = 6. |
| Reading newspapers | Six categories: Never= 1 and every day = 6. |
| Reading books | Six categories: Never= 1 and every day = 6. |
| Service quality of medical institutions (when respondents went to a medical institution recently) | |
| Doctor attitude (X1) | Evaluation on the attitude of medical staff. Ten categories: 1 = “very dissatisfied” to 10 = “very satisfied” |
| Doctors’ professional skills (X2) | Evaluation of doctor’s professional skills. Ten categories: 1 = “very dissatisfied” to 10= “very satisfied” |
| Doctors’ medical ethics (X3) | Evaluation of doctor’s medical ethics. Ten categories: 1 = “very dissatisfied” to 10= “very satisfied” |
| Hospital environment (X4) | Evaluation of hospital environment. Ten categories: 1 = “very dissatisfied” to 10= “very satisfied” |
| Hospital equipment (X5) | Evaluation of hospital equipment. Ten categories: 1 = “very dissatisfied” to 10= “very satisfied” |
| Order of medical treatment (X6) | Evaluation of the order of medical treatment Ten categories: 1 = “very dissatisfied” to 10= “very satisfied” |
| Convenience of seeking medical service | |
| Distance from hospital (X7) | Do you agree that it is too far from the clinic? Four categories: 1 = “very agree” to 4 = “very disagree” |
| Appointment time (X8) | Do you agree that the appointment time is too long? Four categories: 1 = “very agree” to 4 = “very disagree”. |
| Waiting time (X9) | Do you agree that the waiting time is too long? Four categories: 1 = “very agree” to 4 = “very disagree” |
| Medical expense (x10) | Do you agree medical expenses are too expensive Four categories: 1 = “very agree” to 4 = “very disagree” |
| Medical safety (X11) | Evaluation of medical safety. Four categories: 1 = “very unsafe” to 4= “very safe” |
| Doctor-patient relationship (X12) | Degree of trust in doctors. Four categories: 1 = “very distrust” to 4= “very trust” |
| Supply level of government medical services (X13) | Evaluation of the work for local government in providing medical services. Four categories: 1= “very bad” to 4= “very good”. |
| Variable | Total Sample | Netizens | Non-netizens | |||
|---|---|---|---|---|---|---|
| Mean | SD | Mean | SD | Mean | SD | |
| MSS | 6.40 | 2.47 | 6.14 | 2.35 | 6.55 | 2.52 |
| IU | 0.37 | 0.48 | ||||
| Gender | 0.45 | 0.50 | 0.49 | 0.50 | 0.43 | 0.50 |
| Age | 46.27 | 13.80 | 36.21 | 12.03 | 52.16 | 11.10 |
| Education | 2.99 | 1.22 | 3.92 | 1.02 | 2.46 | 0.97 |
| Political identity | 0.10 | 0.30 | 0.15 | 0.36 | 0.07 | 0.25 |
| Household registration | 0.48 | 0.50 | 0.67 | 0.47 | 0.36 | 0.48 |
| Family economic level | 2.18 | 0.91 | 2.35 | 0.86 | 2.09 | 0.92 |
| Medical insurance | 0.88 | 0.32 | 0.87 | 0.34 | 0.89 | 0.31 |
| X1 | 7.10 | 2.06 | 6.74 | 2.12 | 7.26 | 2.01 |
| X2 | 6.93 | 1.92 | 6.72 | 1.93 | 7.02 | 1.91 |
| X3 | 7.04 | 2.06 | 6.69 | 2.17 | 7.20 | 1.99 |
| X4 | 7.04 | 1.89 | 6.83 | 1.91 | 7.14 | 1.87 |
| X5 | 6.84 | 1.96 | 6.84 | 1.89 | 6.84 | 1.99 |
| X6 | 7.07 | 1.95 | 6.73 | 2.07 | 7.22 | 1.87 |
| X7 | 3.08 | 0.87 | 3.17 | 0.81 | 3.04 | 0.90 |
| X8 | 3.18 | 0.86 | 3.04 | 0.93 | 3.24 | 0.82 |
| X9 | 2.99 | 0.93 | 2.78 | 0.99 | 3.09 | 0.89 |
| X10 | 2.29 | 0.95 | 2.24 | 0.94 | 2.32 | 0.96 |
| X11 | 2.87 | 0.59 | 2.72 | 0.59 | 2.93 | 0.58 |
| X12 | 3.01 | 0.69 | 2.87 | 0.66 | 3.09 | 0.69 |
| X13 | 2.80 | 0.67 | 2.71 | 0.63 | 2.85 | 0.66 |
| Attitudes toward Internet information | 2.70 | 0.76 | 2.70 | 0.76 | 2.27 | 0.70 |
| Attitudes toward netizens | 2.99 | 0.77 | 2.99 | 0.77 | 2.53 | 0.74 |
| Watching TV | 5.40 | 1.21 | 5.21 | 1.35 | 5.49 | 1.13 |
| Listening radio, | 1.55 | 1.40 | 1.74 | 1.52 | 1.46 | 1.33 |
| Reading newspapers | 2.25 | 1.82 | 3.40 | 1.92 | 1.73 | 1.51 |
| Reading books | 2.19 | 1.76 | 3.47 | 1.91 | 1.61 | 1.33 |
| Variable | Dependent variable: MSS | |||
|---|---|---|---|---|
| (1) | (2) | (3) | (4) | |
| IU | –0.1503*** | –0.1011*** | –0.1306*** | –0.1364*** |
| (0.0126) | (0.0173) | (0.0174) | (0.0174) | |
| Gender | 0.0313** | 0.0471*** | 0.0489*** | |
| (0.0128) | (0.0128) | (0.0128) | ||
| Age (reference for younger than 31 years old) | ||||
| 30 < Age < 45 | –0.1070*** | –0.1116*** | –0.1315*** | |
| (0.0192) | (0.0192) | (0.0192) | ||
| 44 < Age < 65 | –0.0278 | –0.0390* | –0.0700*** | |
| (0.0200) | (0.0200) | (0.0202) | ||
| 64 < Age | 0.0681** | 0.0435 | 0.0088 | |
| (0.0289) | (0.0290) | (0.0291) | ||
| Education (reference for the illiteracy) | ||||
| Primary school | –0.0531** | –0.0683*** | –0.0713*** | |
| (0.0240) | (0.0241) | (0.0240) | ||
| Junior high school | –0.0938*** | –0.1276*** | –0.1342*** | |
| (0.0242) | (0.0242) | (0.0242) | ||
| Senior high school | –0.1140*** | –0.1657*** | –0.1726*** | |
| (0.0275) | (0.0276) | (0.0276) | ||
| College | –0.0233 | –0.0935*** | –0.1120*** | |
| (0.0311) | (0.0313) | (0.0313) | ||
| Graduate | –0.1837*** | –0.2791*** | –0.2965*** | |
| (0.0692) | (0.0681) | (0.0679) | ||
| Political identity | 0.1889*** | 0.1438*** | 0.1346*** | |
| (0.0217) | (0.0217) | (0.0217) | ||
| Household registration | –0.1424*** | –0.1327*** | –0.1166*** | |
| (0.0139) | (0.0139) | (0.0140) | ||
| Family economic level | 0.1638*** | 0.1596*** | ||
| (0.0073) | (0.0073) | |||
| Medical insurance | 0.2816*** | |||
| (0.0210) | ||||
| Province | YES | YES | YES | YES |
| Year | YES | YES | YES | YES |
| N | 28,239 | 28,239 | 28,239 | 28,239 |
| Variable | Dependent Variable: MSS | |
|---|---|---|
| (1) | (2) | |
| Attitudes toward Internet information | 0.0490*** | |
| (0.0182) | ||
| Attitudes toward netizens | 0.0460*** | |
| (0.0175) | ||
| Control variable | YES | YES |
| Province | YES | YES |
| Year | ||
| N | 6466 | 6579 |
| Variable | Dependent Variable | ||||||
|---|---|---|---|---|---|---|---|
| X1 | X2 | X3 | X4 | X5 | X6 | X7 | |
| (1) | (2) | (3) | (4) | (5) | (6) | (7) | |
| IU | –0.1107*** | –0.0822** | –0.1111*** | –0.0679* | 0.0118 | –0.1034*** | –0.0239 |
| (0.0359) | (0.0367) | (0.0370) | (0.0368) | (0.0361) | (0.0370) | (0.0390) | |
| Control variable | YES | YES | YES | YES | YES | YES | YES |
| Province | YES | YES | YES | YES | YES | YES | YES |
| Year | YES | YES | YES | YES | YES | YES | YES |
| N | 7560 | 7552 | 7557 | 7553 | 7533 | 7559 | 7553 |
| Variable | X8 | X9 | X10 | X11 | X12 | X13 | |
| (8) | (9) | (10) | (11) | (12) | (13) | ||
| IU | –0.1616*** | –0.2000*** | –0.1552*** | –0.1766*** | –0.2064*** | –0.1455*** | |
| (0.0397) | (0.0388) | (0.0374) | (0.0373) | (0.0195) | (0.0248) | ||
| Control variable | YES | YES | YES | YES | YES | YES | |
| Province | YES | YES | YES | YES | YES | YES | |
| Year | YES | YES | YES | YES | YES | YES | |
| N | 7412 | 7509 | 7433 | 8809 | 27,595 | 17,931 | |
| Variable | Dependent Variable: MSS | ||||||
|---|---|---|---|---|---|---|---|
| Male | Female | Urban | Rural | 2013 | 2015 | 2017 | |
| (1) | (2) | (3) | (4) | (5) | (6) | (7) | |
| IU | –0.1665*** | –0.1066*** | –0.1277*** | –0.1240*** | –0.1348*** | –0.0993*** | –0.1331*** |
| (0.0255) | (0.0238) | (0.0237) | (0.0263) | (0.0323) | (0.0305) | (0.0280) | |
| Control variable | YES | YES | YES | YES | YES | YES | YES |
| Province | YES | YES | YES | YES | YES | YES | YES |
| Year | YES | YES | YES | YES | |||
| N | 12,794 | 15,445 | 13,461 | 14,778 | 9161 | 9390 | 9688 |
| Variable | Dependent Variable: MSS | ||
|---|---|---|---|
| Primary School and Below | Junior and Senior High School | Undergraduate and above | |
| (1) | (2) | (3) | |
| IU | –0.1636*** | –0.1382*** | –0.1053 |
| (0.0428) | (0.0204) | (0.0650) | |
| Control variable | YES | YES | YES |
| Province | YES | YES | YES |
| Year | YES | YES | YES |
| N | 10,173 | 14,031 | 4035 |
| Variable | Dependent variable | |||
|---|---|---|---|---|
| MSS | MSS1 | |||
| Ordered Logit | Probit | |||
| (1) | (2) | (3) | (4) | |
| IU | –0.2437*** | –0.2289*** | –0.0817*** | –0.1276*** |
| (0.0214) | (0.0296) | (0.0162) | (0.0221) | |
| Control variable | NO | YES | NO | YES |
| Province | YES | YES | YES | YES |
| Year | YES | YES | YES | YES |
| N | 28,239 | 28,239 | 28,239 | 28,239 |
| Matching Methods | 2-nearest Neighbor Matching | Radius Matching | Kernel Matching | Local linear Regression Matching |
|---|---|---|---|---|
| ATT | –0.3389*** | –0.3661*** | –0.3332*** | –0.3772*** |
| (0.0867) | (0.0729) | (0.0697) | (0.0860) | |
| Control variables | YES | YES | YES | YES |
| Sample number of treatment group | 10,427 | 10,427 | 10,427 | 10,427 |
| Sample number of Control group | 17,812 | 17,812 | 17,812 | 17,812 |
| Variable | Dependent Variable: MSS | |||
|---|---|---|---|---|
| (1) | (2) | (3) | (4) | |
| Watching TV | 0.0247*** | |||
| (0.0095) | ||||
| Listening radio | 0.0124 | |||
| (0.0082) | ||||
| Reading newspapers | 0.0028 | |||
| (0.0076) | ||||
| Reading books | 0.0160** | |||
| (0.0080) | ||||
| Control variable | YES | YES | YES | YES |
| Province | YES | YES | YES | YES |
| Year | YES | YES | YES | YES |
| N | 9160 | 9152 | 9152 | 9156 |
© 2020 by the authors. Licensee MDPI, Basel, Switzerland. This article is an open access article distributed under the terms and conditions of the Creative Commons Attribution (CC BY) license (http://creativecommons.org/licenses/by/4.0/).
Share and Cite
Liu, H.; Gong, X.; Zhang, J. Does Internet Use Affect Individuals’ Medical Service Satisfaction? Evidence from China. Healthcare 2020, 8, 81. https://doi.org/10.3390/healthcare8020081
Liu H, Gong X, Zhang J. Does Internet Use Affect Individuals’ Medical Service Satisfaction? Evidence from China. Healthcare. 2020; 8(2):81. https://doi.org/10.3390/healthcare8020081
Chicago/Turabian StyleLiu, Hu, Xiaomei Gong, and Jiaping Zhang. 2020. "Does Internet Use Affect Individuals’ Medical Service Satisfaction? Evidence from China" Healthcare 8, no. 2: 81. https://doi.org/10.3390/healthcare8020081
APA StyleLiu, H., Gong, X., & Zhang, J. (2020). Does Internet Use Affect Individuals’ Medical Service Satisfaction? Evidence from China. Healthcare, 8(2), 81. https://doi.org/10.3390/healthcare8020081