
The Effects of Alcohol Hangover on Response Inhibition and Attentional Bias towards Alcohol-Related Stimuli


Abstract
:1. Introduction
2. Materials and Methods
2.1. Participants
2.2. Design
2.3. Measures
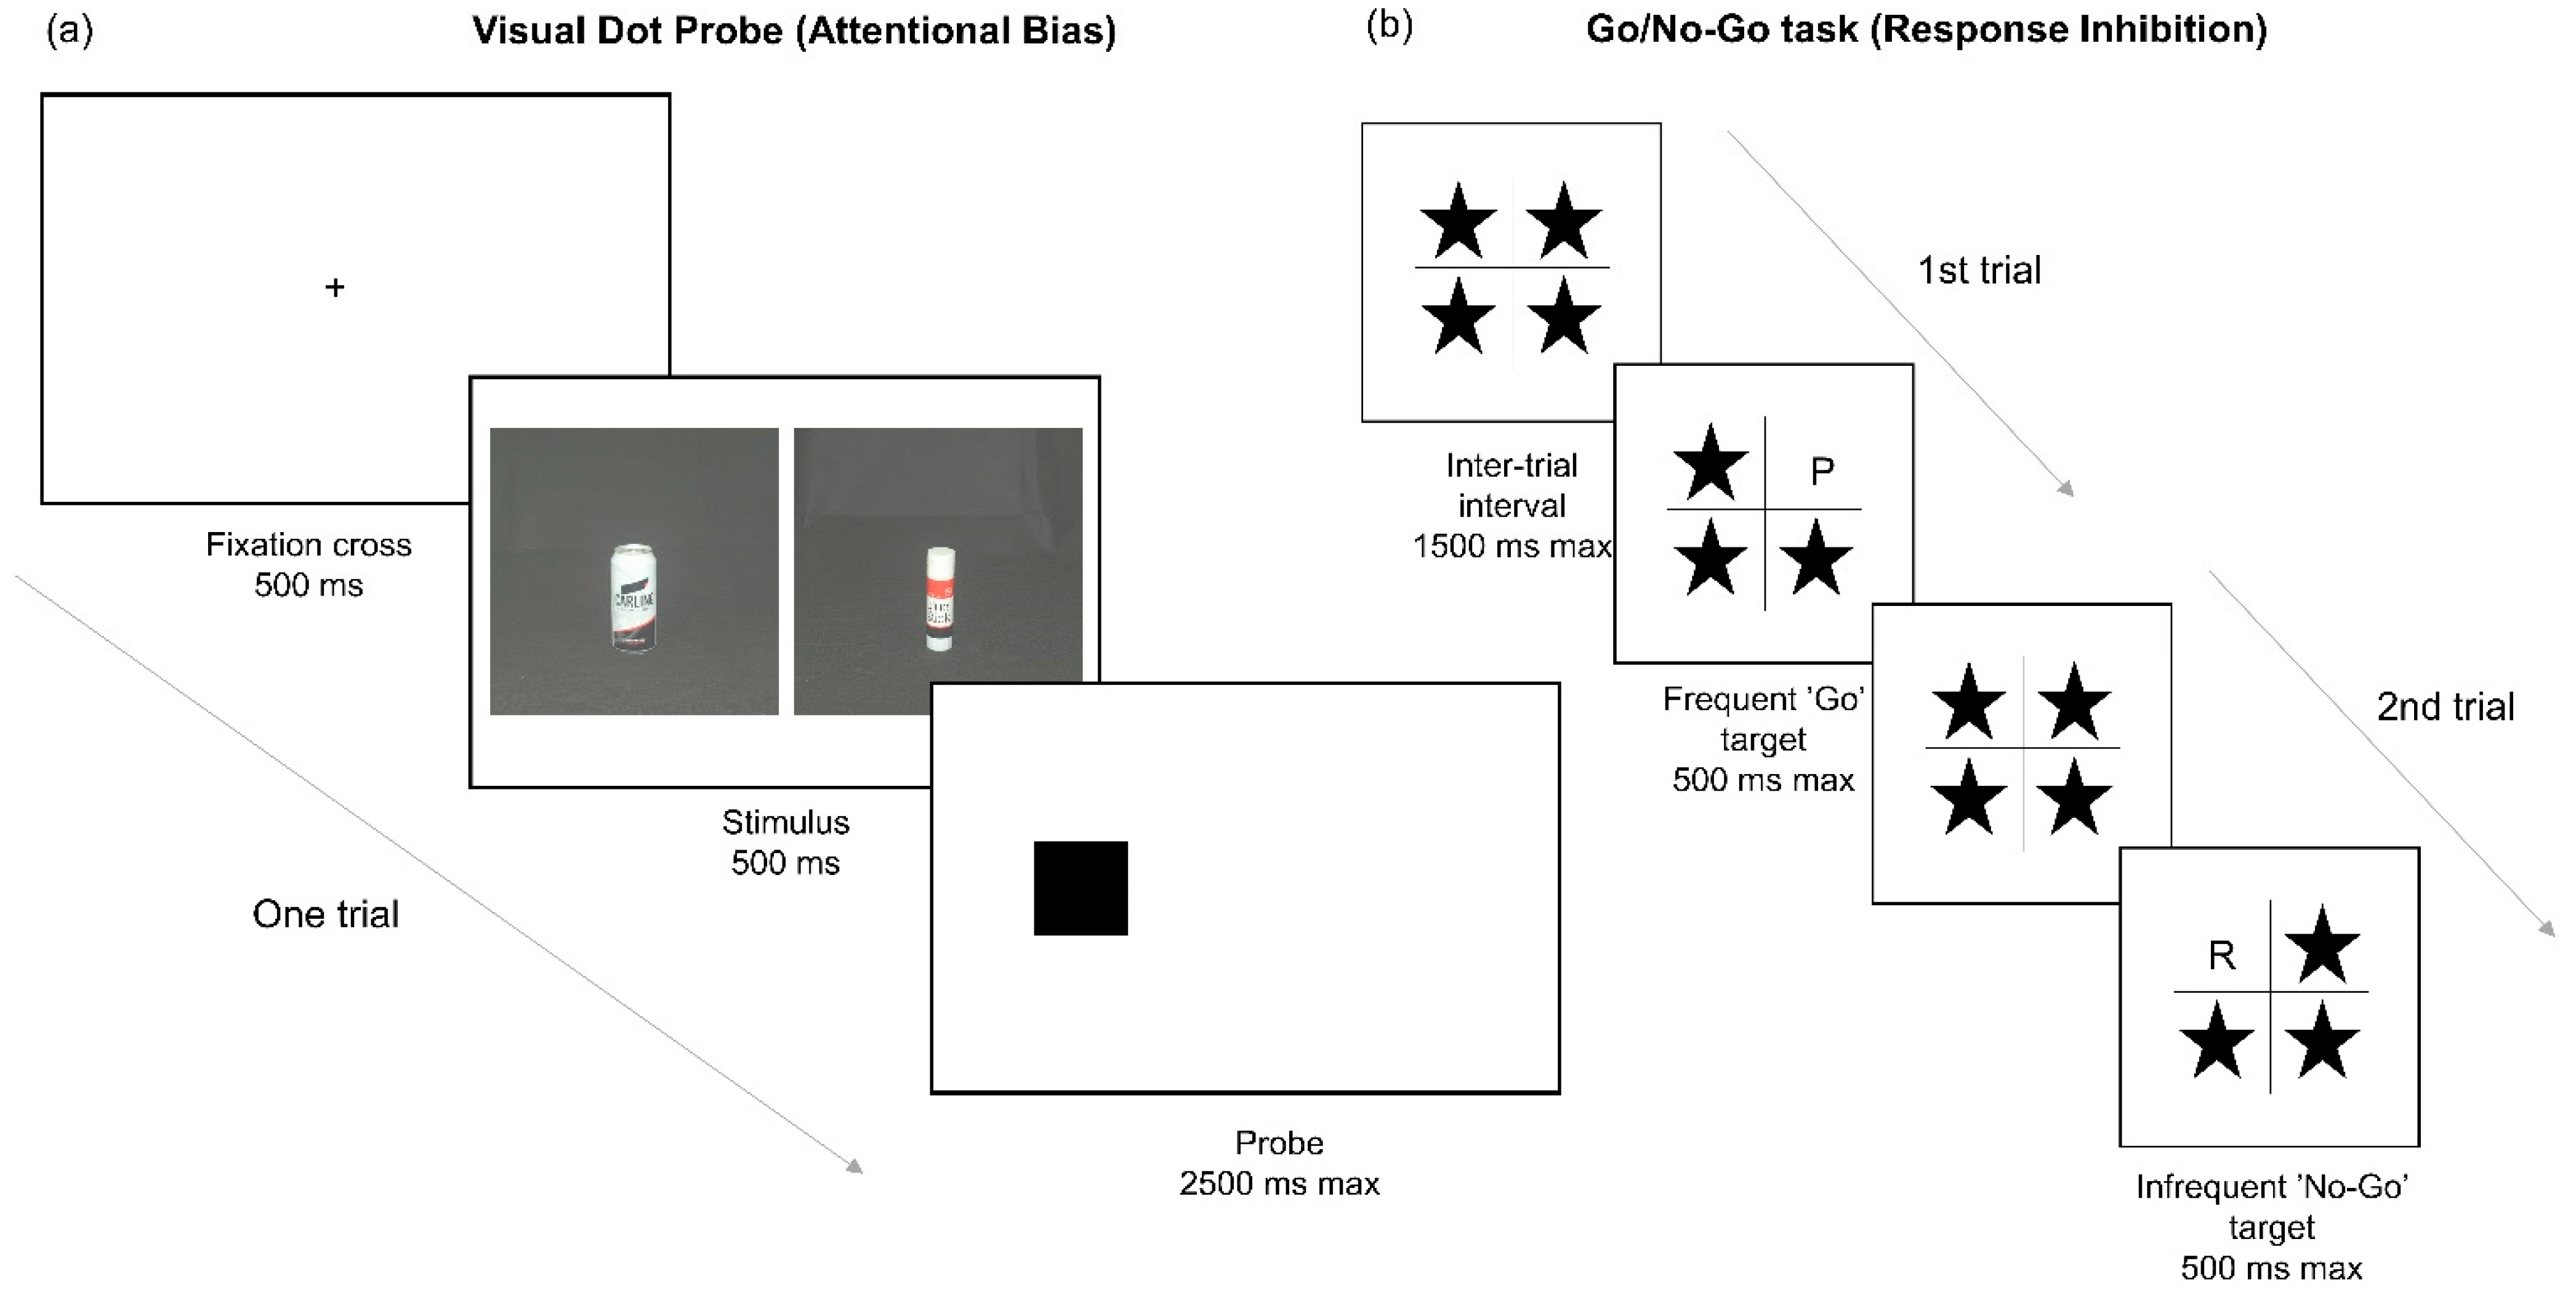
2.4. Procedure
2.5. Statistical Analysis
3. Results
3.1. Participant Characteristics
3.2. Alcohol Consumption Prior to Hangover Condition
3.3. Effects of Hangover on Response Inhibition
3.4. Effects of Hangover on Attentional Bias
3.5. Correlational Analysis
3.6. Subjective Measures
4. Discussion
5. Conclusions
Author Contributions
Funding
Institutional Review Board Statement
Informed Consent Statement
Data Availability Statement
Acknowledgments
Conflicts of Interest
References
- McGee, R.; Kypri, K. Alcohol-related problems experienced by university students in New Zealand. Aust. N. Z. J. Public Health 2004, 28, 321–323. [Google Scholar] [CrossRef] [PubMed]
- Verster, J.C.; Scholey, A.; van de Loo, A.E.; Benson, S.; Stock, A.-K. Updating the Definition of the Alcohol Hangover. J. Clin. Med. 2020, 9, 823–827. [Google Scholar] [CrossRef] [Green Version]
- Bhattacharya, A. Splitting the Bill: Alcohol’s Impact on the Economy; Institute for Alcohol Studies: London, UK, 2017. [Google Scholar]
- Molbak, M.; Schou, A.; Tolstrup, J. Alcohol Hangover and Risk of Drinking Problems and Alcohol Use Disorder: A Systematic Review. J. Alcohol. Drug Depend. 2017, 5, 1–7. [Google Scholar] [CrossRef]
- Courtney, K.E.; Worley, M.; Castro, N.; Tapert, S.F. The effects of alcohol hangover on future drinking behavior and the development of alcohol problems. Addict. Behav. 2018, 78, 209–215. [Google Scholar] [CrossRef]
- Robertson, B.M.; Epler, A.J. Hangover and Risk for Alcohol Use Disorders: Existing Evidence and Potential Mechanisms. Curr. Drug Abus. Rev. 2010, 3, 92–102. [Google Scholar] [CrossRef]
- Jentsch, J.D.; Taylor, J.R. Impulsivity resulting from frontostriatal dysfunction in drug abuse: Implications for the control of behavior by reward-related stimuli. Psychopharmacology 1999, 146, 373–390. [Google Scholar] [CrossRef]
- Goldstein, R.Z.; Volkow, N.D. Drug Addiction and Its Underlying Neurobiological Basis: Neuroimaging Evidence for the Involvement of the Frontal Cortex. Am. J. Psychiatry 2002, 159, 1642–1652. [Google Scholar] [CrossRef] [PubMed]
- Field, M.; Wiers, R.W.; Christiansen, P.; Fillmore, M.T.; Verster, J.C. Acute Alcohol Effects on Inhibitory Control and Implicit Cognition: Implications for Loss of Control Over Drinking. Alcohol. Clin. Exp. Res. 2010, 34, 1346–1352. [Google Scholar] [CrossRef]
- Field, M.; Mogg, K.; Bradley, B.P. Craving and cognitive biases for alcohol cues in social drinkers. Alcohol Alcohol. 2005, 40, 504–510. [Google Scholar] [CrossRef] [PubMed] [Green Version]
- Duka, T.; Townshend, J.M. The priming effect of alcohol pre-load on attentional bias to alcohol-related stimuli. Psychopharmacology 2004, 176, 353–361. [Google Scholar] [CrossRef]
- Robinson, T.E. The neural basis of drug craving: An incentive-sensitization theory of addiction. Brain Res. Rev. 1993, 18, 247–291. [Google Scholar] [CrossRef]
- Rooke, S.E.; Hine, D.W.; Thorsteinsson, E.B. Implicit cognition and substance use: A meta-analysis. Addict. Behav. 2008, 33, 1314–1328. [Google Scholar] [CrossRef] [Green Version]
- Field, M.; Cox, W.M. Attentional bias in addictive behaviors: A review of its development, causes, and consequences. Drug Alcohol Depend. 2008, 97, 1–20. [Google Scholar] [CrossRef]
- Field, M.; Mogg, K.; Zetteler, J.; Bradley, B.P. Attentional biases for alcohol cues in heavy and light social drinkers: The roles of initial orienting and maintained attention. Psychopharmacology 2004, 176, 88–93. [Google Scholar] [CrossRef] [PubMed]
- Adams, S.; Ataya, A.F.; Attwood, A.S.; Munafò, M.R. Effects of acute alcohol consumption on alcohol-related cognitive biases in light and heavy drinkers are task-dependent. J. Psychopharmacol. 2011, 26, 245–253. [Google Scholar] [CrossRef] [PubMed]
- Bruce, G.; Jones, B.T. A pictorial Stroop paradigm reveals an alcohol attentional bias in heavier compared to lighter social drinkers. J. Psychopharmacol. 2004, 18, 527–533. [Google Scholar] [CrossRef]
- Ryan, F. Attentional bias and alcohol dependence: A controlled study using the modified stroop paradigm. Addict. Behav. 2002, 27, 471–482. [Google Scholar] [CrossRef]
- Townshend, J.M.; Duka, T. Attentional Bias Associated with Alcohol Cues: Differences between Heavy and Occasional Social Drinkers. Psychopharmacology 2001, 157, 67–74. [Google Scholar]
- Jones, B.T.; Bruce, G.; Livingstone, S.; Reed, E. Alcohol-related attentional bias in problem drinkers with the flicker change blindness paradigm. Psychol. Addict. Behav. 2006, 20, 171–177. [Google Scholar] [CrossRef]
- De Wit, H.; Crean, J.; Richards, J.B. Effects of d-Amphetamine and ethanol on a measure of behavioral inhibition in humans. Behav. Neurosci. 2000, 114, 830–837. [Google Scholar] [CrossRef]
- Marczinski, C.A.; Abroms, B.D.; Van Selst, M.; Fillmore, M.T. Alcohol-induced impairment of behavioral control: Differential effects on engaging vs. disengaging responses. Psychopharmacology 2005, 182, 452–459. [Google Scholar] [CrossRef]
- Noël, X.; Bechara, A.; Dan, B.; Hanak, C.; Verbanck, P. Response inhibition deficit is involved in poor decision making under risk in nonamnesic individuals with alcoholism. Neuropsychology 2007, 21, 778–786. [Google Scholar] [CrossRef] [Green Version]
- Weafer, J.; Fillmore, M.T. Individual differences in acute alcohol impairment of inhibitory control predict ad libitum alcohol consumption. Psychopharmacology 2008, 201, 315–324. [Google Scholar] [CrossRef] [Green Version]
- Adams, S.; Ataya, A.F.; Attwood, A.S.; Munafò, M.R. Effects of alcohol on disinhibition towards alcohol-related cues. Drug Alcohol Depend. 2013, 127, 137–142. [Google Scholar] [CrossRef]
- Weafer, J.; Fillmore, M.T.; Jessica, W. Alcohol-related stimuli reduce inhibitory control of behavior in drinkers. Psychopharmacology 2012, 222, 489–498. [Google Scholar] [CrossRef] [Green Version]
- Koob, G.F. Theoretical Frameworks and Mechanistic Aspects of Alcohol Addiction: Alcohol Addiction as a Reward Deficit Disorder BT—Behavioral Neurobiology of Alcohol Addiction; Sommer, W.H., Spanagel, R., Eds.; Springer: Berlin/Heidelberg, Germany, 2011; pp. 3–30. [Google Scholar] [CrossRef]
- McKinney, A. A Review of the Next Day Effects of Alcohol on Subjective Mood Ratings. Curr. Drug Abus. Rev. 2010, 3, 88–91. [Google Scholar] [CrossRef]
- Gauvin, D.V.; Baird, T.J.; Vanecek, S.A.; Briscoe, R.J.; Vallett, M.; Holloway, F.A. Effects of Time-of-Day and Photoperiod Phase Shifts on Voluntary Ethanol Consumption in Rats. Alcohol. Clin. Exp. Res. 1997, 21, 817–825. [Google Scholar] [CrossRef] [PubMed]
- Verster, J. Editorial: [The “Hair of the Dog”: A Useful Hangover Remedy or a Predictor of Future Problem Drinking?]. Curr. Drug Abus. Rev. 2009, 2, 1–4. [Google Scholar] [CrossRef]
- Hunt-Carter, E.E.; Slutske, W.; Piasecki, T. Characteristics and Correlates to Relieve Hangover in a College Sample. Alcohol. Clin. Exp. Res. 2005, 29, 152A. [Google Scholar]
- Devenney, L.E.; Coyle, K.B.; Verster, J.C. Memory and attention during an alcohol hangover. Hum. Psychopharmacol. Clin. Exp. 2019, 34, e2701. [Google Scholar] [CrossRef] [PubMed] [Green Version]
- McKinney, A.; Coyle, K.; Penning, R.; Verster, J.C. Next day effects of naturalistic alcohol consumption on tasks of attention. Hum. Psychopharmacol. Clin. Exp. 2012, 27, 587–594. [Google Scholar] [CrossRef]
- Devenney, L.E.; Coyle, K.B.; Verster, J.C. Cognitive performance and mood after a normal night of drinking: A naturalistic alcohol hangover study in a non-student sample. Addict. Behav. Rep. 2019, 10, 100197. [Google Scholar] [CrossRef] [PubMed]
- Zink, N.; Bensmann, W.; Beste, C.; Stock, A.-K. Alcohol Hangover Increases Conflict Load via Faster Processing of Subliminal Information. Front. Hum. Neurosci. 2018, 12, 316. [Google Scholar] [CrossRef] [PubMed]
- Friedman, N.P.; Miyake, A. The Relations Among Inhibition and Interference Control Functions: A Latent-Variable Analysis. J. Exp. Psychol. Gen. 2004, 133, 101–135. [Google Scholar] [CrossRef] [Green Version]
- Opitz, A.; Hubert, J.; Beste, C.; Stock, A.-K. Alcohol Hangover Slightly Impairs Response Selection but not Response Inhibition. J. Clin. Med. 2019, 8, 1317. [Google Scholar] [CrossRef] [Green Version]
- Bezdjian, S.; Baker, L.A.; Lozano, D.I.; Raine, A. Assessing inattention and impulsivity in children during the Go/NoGo task. Br. J. Dev. Psychol. 2009, 27, 365–383. [Google Scholar] [CrossRef] [Green Version]
- Christiansen, P.; Mansfield, R.; Duckworth, J.; Field, M.; Jones, A. Internal reliability of the alcohol-related visual probe task is increased by utilising personalised stimuli and eye-tracking. Drug Alcohol Depend. 2015, 155, 170–174. [Google Scholar] [CrossRef]
- Patton, J.H.; Stanford, M.S.; Barratt, E.S. Factor-Structure-of-the-Barratt-Impulsiveness-Scale. J. Clin. Psychol. 1995, 51, 764–768. [Google Scholar] [CrossRef]
- Verster, J.C.; De Haan, L.; Kuipers, E.; Kuerten, Y.; Van Laar, M.; Olivier, B. The RT-18: A new screening tool to assess young adult risk-taking behavior. Int. J. Gen. Med. 2011, 4, 575–584. [Google Scholar] [CrossRef] [Green Version]
- Spielberger, C.D.; Gorsuch, R.L.; Lushene, R.; Vagg, P.R.; Jacobs, G.A. Manual for the State-Trait Anxiety Inventory; Consulting Psychologists Press: Palo Alto, CA, USA, 1983. [Google Scholar]
- Babor, T.F.; Higgins-Biddle, J.C.; Saunders, J.B.; Monteiro, M.G. The Alcohol Use Disorders Identification Test; World Health Organization: Geneva, Switzerland, 1992. [Google Scholar]
- Kypri, K.; Langley, J.; Stephenson, S. Episode-Centred analysis of drinking to intzoxication in university students. Alcohol Alcohol. 2005, 40, 447–452. [Google Scholar] [CrossRef] [PubMed] [Green Version]
- Van De Loo, A.; Mackus, M.; Korte-Bouws, G.; Brookhuis, K.; Garssen, J.; Verster, J. Urine ethanol concentration and alcohol hangover severity. Psychopharmacology 2017, 234, 73–77. [Google Scholar] [CrossRef] [PubMed] [Green Version]
- Mulder-Hajonides; van der Meulen, W.; Wijnberg, J.; Hollander, J.; De Diana, I.; van den Hoofdakker, R. Measurement of Subjective Sleep Quality. In Proc of Int. Eur. Sleep Cong.; Elsevier: Amsterdam, The Netherlands, 1981; Volume 5, p. 98. [Google Scholar]
- Åkerstedt, T.; Gillberg, M. Subjective and Objective Sleepiness in the Active Individual. Int. J. Neurosci. 1990, 52, 29–37. [Google Scholar] [CrossRef]
- Bohn, M.J.; Krahn, D.D.; Staehler, B.A. Development and Initial Validation of a Measure of Drinking Urges in Abstinent Alcoholics. Alcohol. Clin. Exp. Res. 1995, 19, 600–606. [Google Scholar] [CrossRef]
- Bond, A.; Lader, M. The use of analogue scales in rating subjective feelings. Br. J. Med. Psychol. 1974, 47, 211–218. [Google Scholar] [CrossRef]
- Zijlstra, F.R.; Van Doorn, L. The Construction of a Scale to Measure Perceived Effort; University of Technology: Baghdad, Iraq, 1985. [Google Scholar]
- Holloway, F.A. Low-Dose Alcohol Effects on Human Behavior and Performance: A Review of Post-1984 Research; Office of Aviation Medicine: Washington, DC, USA, 1994. [Google Scholar]
- Ratcliff, R. Methods for dealing with reaction time outliers. Psychol. Bull. 1993, 114, 510–532. [Google Scholar] [CrossRef] [PubMed]
- Herbert, M.; Johns, M.W.; Dore, C. Factor analysis of analogue scales measuring subjective feelings before and after sleep. Br. J. Med. Psychol. 1976, 49, 373–379. [Google Scholar] [CrossRef] [PubMed]
- Gunn, C.; Griffin, C.; Verster, J.C.; Adams, S. The Effect of Alcohol Hangover on Response Inhibition and Attentional Bias. In Alcoholism-Clinical and Experimental Research; Wiley: Hoboken, NJ, USA, 2017. [Google Scholar]
- Field, A.P. Discovering Statistics Using IBM SPSS Statistics, 5th ed.; SAGE: London, UK, 2018. [Google Scholar]
- Gunn, C.; Mackus, M.; Griffin, C.; Munafò, M.R.; Adams, S. A systematic review of the next-day effects of heavy alcohol consumption on cognitive performance. Addiction 2018, 113, 2182–2193. [Google Scholar] [CrossRef] [PubMed]
- Scholey, A.; Benson, S.; Kaufman, J.; Terpstra, C.; Ayre, E.; Verster, J.C.; Allen, C.; Devilly, G.J. Effects of Alcohol Hangover on Cognitive Performance: Findings from a Field/Internet Mixed Methodology Study. J. Clin. Med. 2019, 8, 440. [Google Scholar] [CrossRef] [Green Version]
- Gao, H.; Qi, M.; Zhang, Q. Response inhibition is more effortful than response activation. NeuroReport 2017, 28, 404–407. [Google Scholar] [CrossRef]
- Eccleston, C.; Baeyens, F.; Helen, P.; Hinkley, K.; Ku-, M.; Wall, P.; Williams, A.D.C.; Yorke, L. Pain Demands Attention: A Cognitive-Affective Model of the Interruptive Function of Pain. Psychol. Bull. 1999, 125, 356–366. [Google Scholar] [CrossRef] [PubMed]
- Boksem, M.A.; Tops, M. Mental fatigue: Costs and benefits. Brain Res. Rev. 2008, 59, 125–139. [Google Scholar] [CrossRef] [PubMed] [Green Version]
- Van Der Linden, D. The urge to stop: The cognitive and biological nature of acute mental fatigue. In Cognitive Fatigue: Multidisciplinary Perspectives on Current Research and Future Applications; American Psychological Association (APA): Worcester, MA, USA, 2010; pp. 149–164. [Google Scholar] [CrossRef]
- Boksem, M.A.; Meijman, T.F.; Lorist, M.M. Mental fatigue, motivation and action monitoring. Biol. Psychol. 2006, 72, 123–132. [Google Scholar] [CrossRef] [PubMed]
- Lavie, N.; Hirst, A.; De Fockert, J.W.; Viding, E. Load Theory of Selective Attention and Cognitive Control. J. Exp. Psychol. Gen. 2004, 133, 339–354. [Google Scholar] [CrossRef] [Green Version]
- Mc Kinney, A.; Coyle, K. Alcohol hangover Effects on measures of affect the morning after a normal night’s drinking. Alcohol Alcohol. 2005, 41, 54–60. [Google Scholar] [CrossRef] [Green Version]
- Ataya, A.F.; Adams, S.; Mullings, E.; Cooper, R.M.; Attwood, A.S.; Munafò, M.R. Internal reliability of measures of substance-related cognitive bias. Drug Alcohol Depend. 2012, 121, 148–151. [Google Scholar] [CrossRef] [PubMed]
- Walshe, E.A.; McIntosh, C.W.; Romer, D.; Winston, F.K. Executive Function Capacities, Negative Driving Behavior and Crashes in Young Drivers. Int. J. Environ. Res. Public Health 2017, 14, 1314. [Google Scholar] [CrossRef] [PubMed] [Green Version]
- Alford, C.; Broom, C.; Carver, H.; Johnson, S.J.; Lands, S.; Reece, R.; Verster, J.C. The Impact of Alcohol Hangover on Simulated Driving Performance during a ‘Commute to Work’—Zero and Residual Alcohol Effects Compared. J. Clin. Med. 2020, 9, 1435. [Google Scholar] [CrossRef]
- Verster, J.C.; Bervoets, A.C.; De Klerk, S.; Vreman, R.A.; Olivier, B.; Roth, T.; Brookhuis, K.A. Effects of alcohol hangover on simulated highway driving performance. Psychopharmacology 2014, 231, 2999–3008. [Google Scholar] [CrossRef]
- Bhattacharya, A. Financial Headache: The Cost of Workplace Hangovers and Intoxication to the UK Economy; Institute for Alcohol Studies: London, UK, 2019. [Google Scholar]


| Measures | Participants | Mean | SD |
|---|---|---|---|
| Age | Total | 20.22 | 2.2 |
| Male | 19.47 | 2.2 | |
| Female | 20.22 | 2.68 | |
| AUDIT | Total | 12.75 | 3.96 |
| Male | 13.32 | 3.79 | |
| Female | 12.12 | 4.17 | |
| ‘Typical’ heavy drinking eBAC | Total | 0.17 | 0.06 |
| Male | 0.17 | 0.06 | |
| Female | 0.17 | 0.05 | |
| ‘Typical’ heavy drinking units | Total | 15.05 | 5.41 |
| Male | 17.49 | 5.14 | |
| Female | 12.48 | 4.5 | |
| Previous night heavy drinking eBAC | Total | 0.17 | 0.05 |
| Male | 0.17 | 0.06 | |
| Female | 0.17 | 0.05 | |
| Previous night heavy drinking units | Total | 14.75 | 5.64 |
| Male | 17.68 | 5.86 | |
| Female | 11.66 | 3.35 |
| Variable | Test | n | Hangover | No-Hangover | Statistic | p | Effect Size | ||
|---|---|---|---|---|---|---|---|---|---|
| Mean | (SD) | Mean | (SD) | ||||||
| Response Inhibition | Commission errors | 36 | 20.61 | (11.31) | 16.33 | (9.18) | t = 3.728 | 0.001 | d = 0.62 |
| Attentional Bias | VDP: AB scores | 33 | 0.34 | (2.93) | 3.96 | (2.12) | F = 1.054 | 0.312 | d = 0.36 |
| Hangover Severity | mAHSS | 35 | 3.2 | (1.37) | 0.31 | (0.32) | t = 13.155 | <0.001 | d = 2.22 |
| 1-item hangover severity | 35 | 5.51 | (1.85) | 0.09 | (0.51) | t = 15.795 | <0.001 | d = 2.66 | |
| Mood | Alertness | 35 | 45.49 | (0.67) | 54.72 | (0.67) | F = 83.991 | <0.001 | d = 3.19 |
| Tranquility | 35 | 44.34 | (0.60) | 47.83 | (0.68) | F = 18.218 | <0.001 | d = 1.49 | |
| Mental Effort | RSME | 37 | 76.68 | (25.18) | 47.55 | (22.23) | t = 7.09 | <0.001 | d = 1.17 |
| Alcohol Craving | AUQ | 36 | 9.81 | (3.76) | 11.72 | (4.81) | t = −2.39 | 0.023 | d = 0.4 |
| Sleep | KSS | 34 | 6.53 | (1.08) | 3.56 | (1.16) | t = 12.74 | <0.001 | d = 2.19 |
| GSQS | 35 | 6.54 | (2.28) | 2.51 | (2.2) | t = 8.09 | <0.001 | d = 1.37 | |
Publisher’s Note: MDPI stays neutral with regard to jurisdictional claims in published maps and institutional affiliations. |
© 2021 by the authors. Licensee MDPI, Basel, Switzerland. This article is an open access article distributed under the terms and conditions of the Creative Commons Attribution (CC BY) license (http://creativecommons.org/licenses/by/4.0/).
Share and Cite
Gunn, C.; Fairchild, G.; Verster, J.C.; Adams, S. The Effects of Alcohol Hangover on Response Inhibition and Attentional Bias towards Alcohol-Related Stimuli. Healthcare 2021, 9, 373. https://doi.org/10.3390/healthcare9040373
Gunn C, Fairchild G, Verster JC, Adams S. The Effects of Alcohol Hangover on Response Inhibition and Attentional Bias towards Alcohol-Related Stimuli. Healthcare. 2021; 9(4):373. https://doi.org/10.3390/healthcare9040373
Chicago/Turabian StyleGunn, Craig, Graeme Fairchild, Joris C. Verster, and Sally Adams. 2021. "The Effects of Alcohol Hangover on Response Inhibition and Attentional Bias towards Alcohol-Related Stimuli" Healthcare 9, no. 4: 373. https://doi.org/10.3390/healthcare9040373