
Improving Hospital Length of Stay: Results of a Retrospective Cohort Study

 , , and
Abstract
:1. Introduction
2. Materials and Methods
2.1. Overview of the Project
2.2. Context
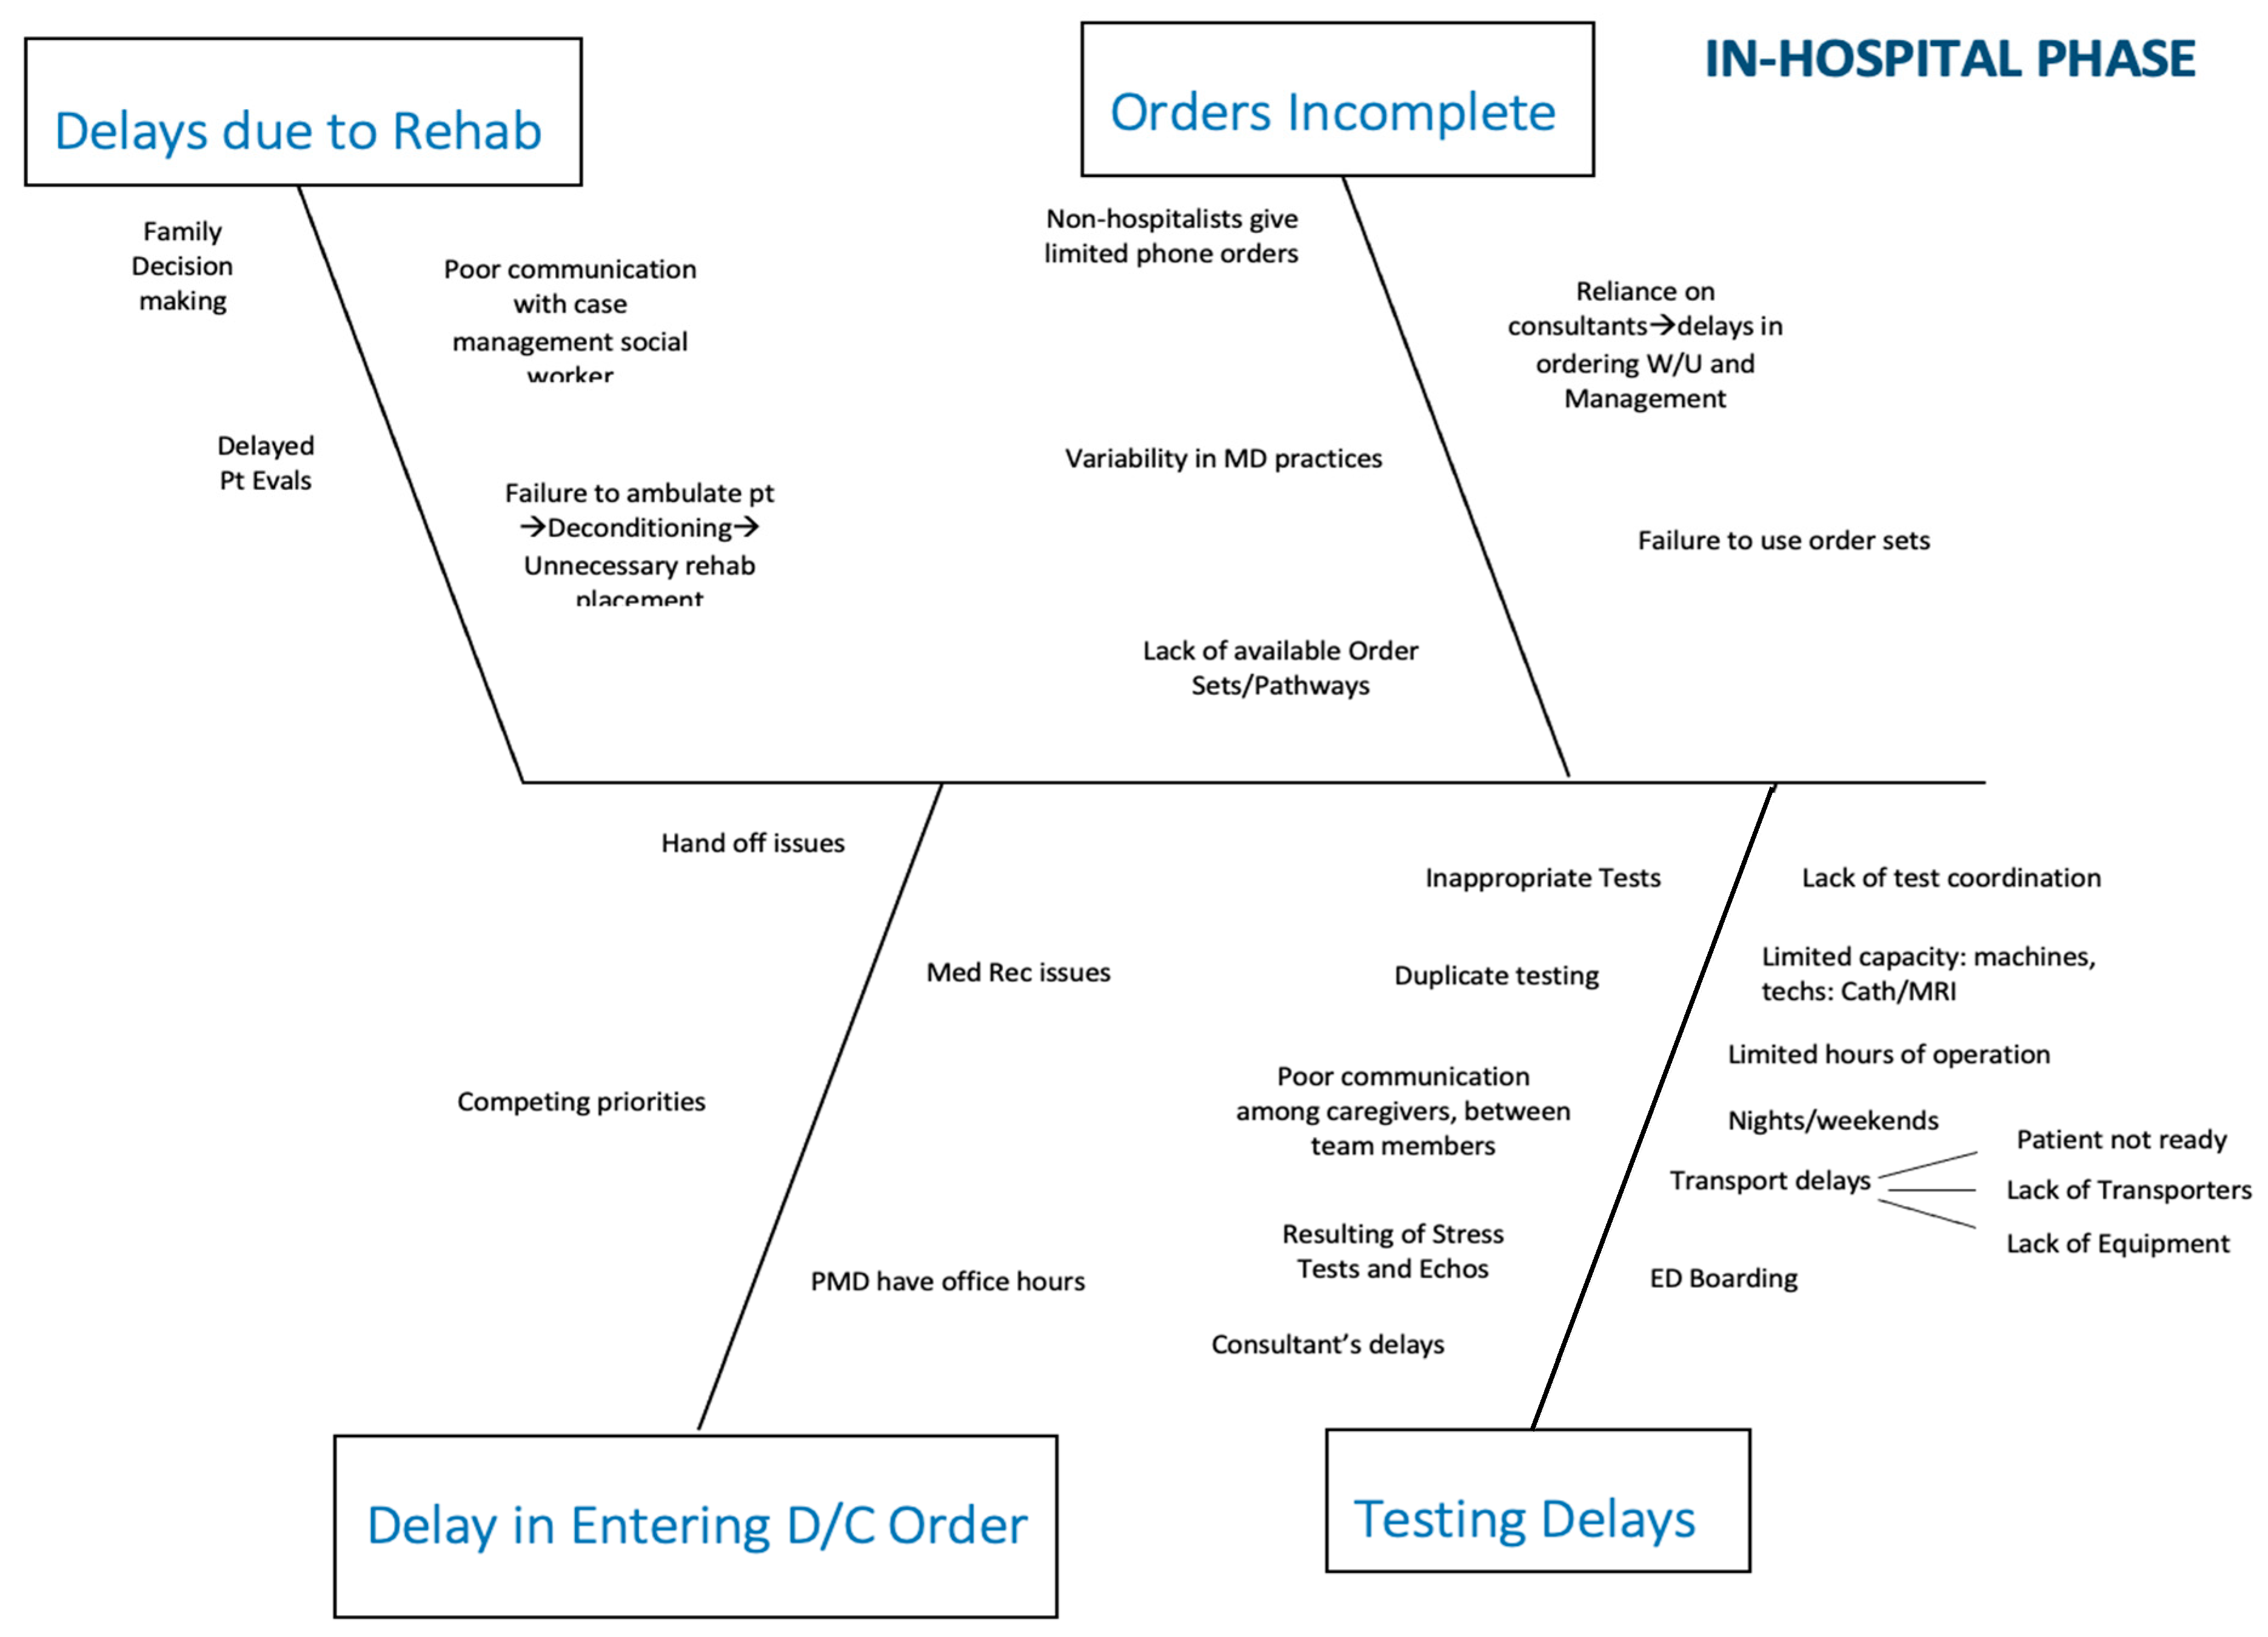
2.3. QI Process
2.4. Interventions
2.5. Increase Use of Hospitalist Model of Care
2.6. Deployment of Mid-Level Providers
2.7. Early Ambulation Program
2.8. Ancillary Services
2.8.1. US
2.8.2. MRI
2.8.3. Stress Testing
2.8.4. Physical Therapy
2.9. Outcomes Measures
3. Results
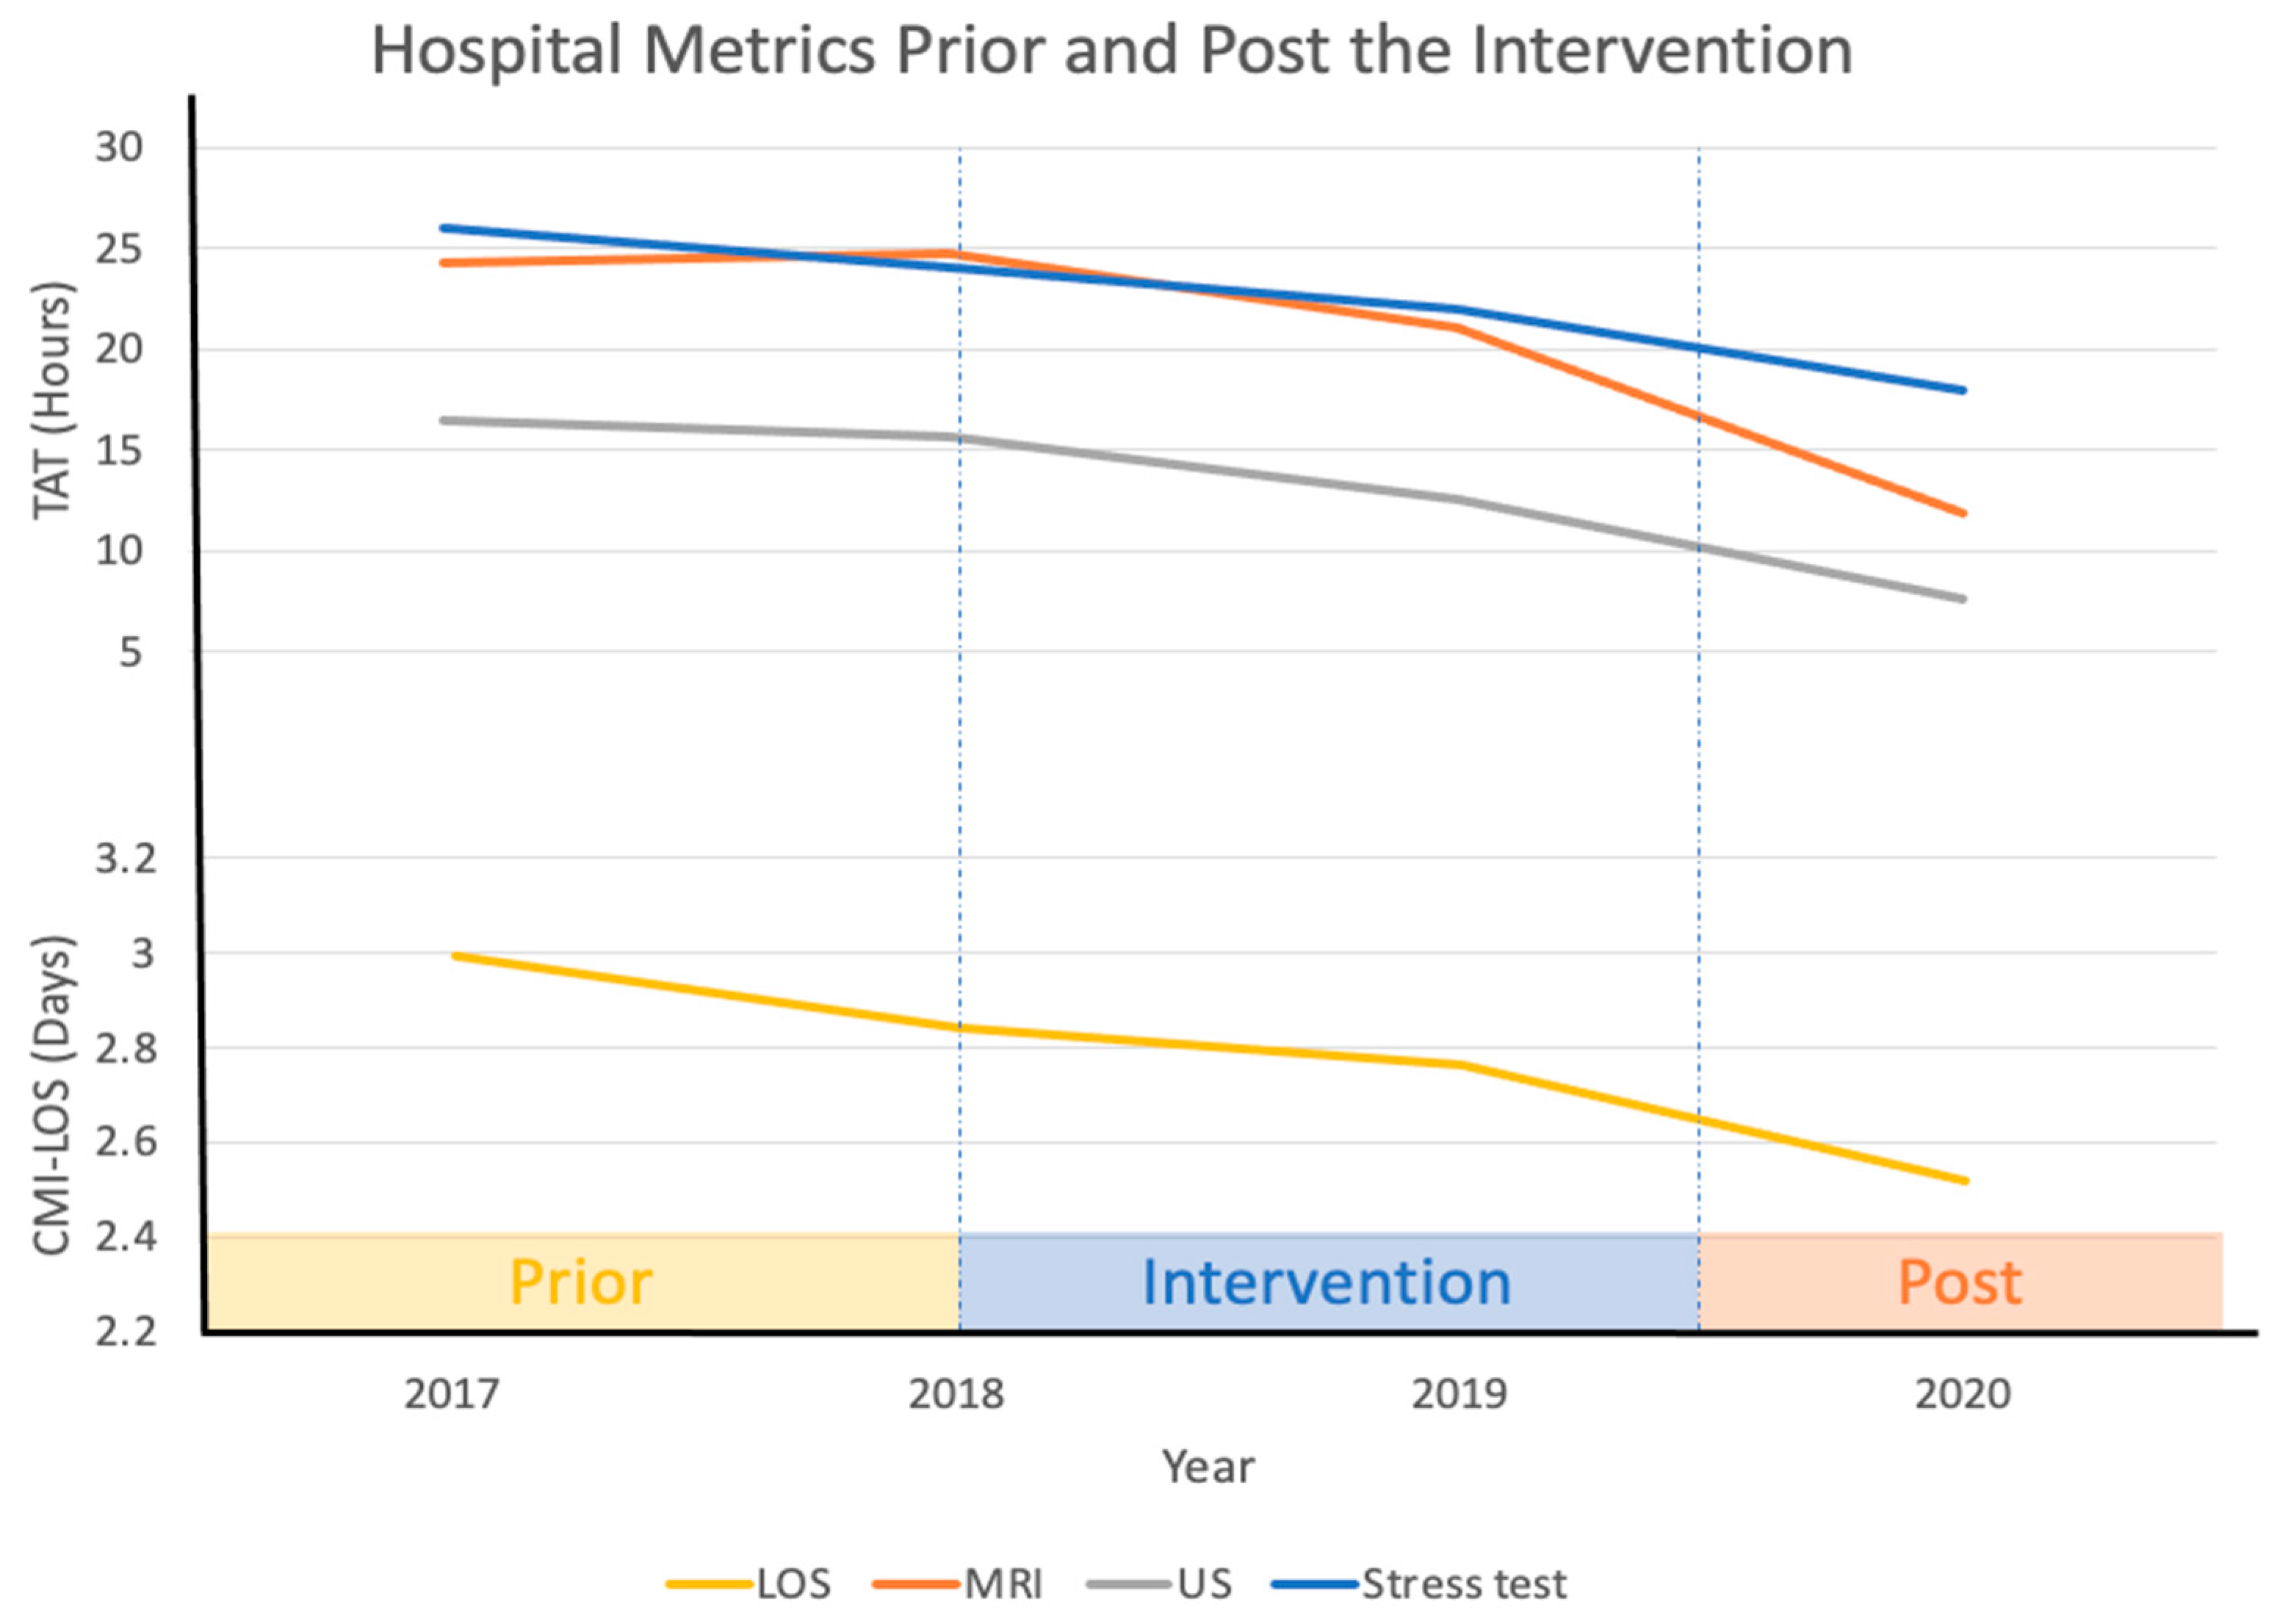
3.1. Length of Stay
3.2. Financial Impact
4. Discussion
5. Conclusions
Author Contributions
Funding
Institutional Review Board Statement
Informed Consent Statement
Data Availability Statement
Acknowledgments
Conflicts of Interest
References
- Branning, G.V.M. Healthcare Spending: Plenty of Blame to Go Around. Am. Health Drug Benefits 2016, 9, 445–447. [Google Scholar]
- Ray, J.C.; Kusumoto, F. The transition to value-based care. J. Interv. Card. Electrophysiol. 2016, 47, 61–68. [Google Scholar] [CrossRef] [PubMed]
- NEJM Catalyst. What Is Value Based Care? 2017. Available online: https://catalyst.nejm.org/doi/full/10.1056/CAT.17.0558 (accessed on 13 January 2021).
- Weiss, A.J.; Elixhauser, A. Overview of Hospital Stays in the United States, 2012: Statistical Brief #180. In Healthcare Cost and Utilization Project (HCUP) Statistical Briefs; Agency for Healthcare Research and Quality (US): Rockville, MD, USA, 2016. [Google Scholar]
- Baek, H.; Cho, M.; Kim, S.; Hwang, H.; Song, M.; Yoo, S. Analysis of length of hospital stay using electronic health records: A statistical and data mining approach. PLoS ONE 2018, 13, 0195901. [Google Scholar]
- Ogrinc, G.; Davies, L.; Goodman, D.; Batalden, P.; Davidoff, F.; Stevens, D. SQUIRE 2.0 (Standards for QUality Improvement Reporting Excellence): Revised publication guidelines from a detailed consensus process. BMJ Qual. Saf. 2016, 25, 986–992. [Google Scholar] [CrossRef] [Green Version]
- Wachter, R.M. An introduction to the hospitalist model. Ann. Intern. Med. 1999, 130, 338–342. [Google Scholar] [CrossRef]
- Doherty-King, B.; Bowers, B.J. Attributing the responsibility for ambulating patients: A qualitative study. Int. J. Nurs. Stud. 2013, 50, 1240–1246. [Google Scholar] [CrossRef] [Green Version]
- Drolet, A.; DeJuilio, P.; Harkless, S.; Henricks, S.; Kamin, E.; Leddy, E.A. Move to Improve: The Feasibility of Using an Early Mobility Protocol to Increase Ambulation in the Intensive and Intermediate Care Settings. Phys. Ther. 2013, 93, 197–207. [Google Scholar] [CrossRef] [PubMed] [Green Version]
- Zecchin, R.P.; Chai, Y.Y.; Roach, K.A.; Speerin, R.; Lindsay, G.; Squire, J. Is nurse-supervised exercise stress testing safe practice? Heart Lung. 1999, 28, 175–185. [Google Scholar] [CrossRef]
- Maier, E.; Jensen, L.; Sonnenberg, B.; Archer, S. Interpretation of exercise stress test recordings: Concordance between nurse practitioner and cardiologist. Heart Lung. 2008, 37, 144–152. [Google Scholar] [CrossRef] [PubMed]
- Franklin, B.A.; Gordon, S.; Timmis, G.C.; O’Neill, W.W. Is direct physician supervision of exercise stress testing routinely necessary? Chest 1997, 111, 262–265. [Google Scholar] [CrossRef] [PubMed]
- Zhao, Q.; Yu, S.; Huang, H.; Cui, H.; Qin, M.; Kong, B. The seasonal variation in hospitalizations due to chronic systolic heart failure correlates with blood sodium levels and cardiac function. Exp. Clin. Cardiol. 2013, 18, 77–80. [Google Scholar] [PubMed]
- Ho, A.T.N.; Shmelev, A.; Charbek, E. Trends and seasonal variation of hospitalization and mortality of interstitial lung disease in the United States from 2006 to 2016. Respir. Res. 2020, 21, 152. [Google Scholar] [CrossRef] [PubMed]
- Gotsman, I.; Zwas, D.; Admon, D.; Lotan, C.; Keren, A. Seasonal Variation in Hospital Admission in Patients with Heart Failure and Its Effect on Prognosis. Cardiology 2010, 117, 268–274. [Google Scholar] [CrossRef] [PubMed]
- Liu, Y.; Gong, P.; Wang, M.; Zhou, J. Seasonal variation of admission severity and outcomes in ischemic stroke—A consecutive hospital-based stroke registry. Chronobiol. Int. 2018, 35, 295–302. [Google Scholar] [CrossRef] [PubMed]
- Tadros, R.O.; Tardiff, M.L.; Faries, P.L.; Stoner, M.; Png, C.Y.M.; Kaplan, D. Vascular surgeon-hospitalist comanagement improves in-hospital mortality at the expense of increased in-hospital cost. J. Vasc. Surg. 2017, 65, 819–825. [Google Scholar] [CrossRef] [PubMed] [Green Version]
- Rees, E.M.; Nightingale, E.S.; Jafari, Y.; Waterlow, N.R.; Clifford, S.B.; Pearson, C.A. COVID-19 length of hospital stay: A systematic review and data synthesis. BMC Med. 2020, 18, 270. [Google Scholar] [CrossRef] [PubMed]
- U.S. Department of Health & Human Services. Secretary Priorities. Available online: https://www.hhs.gov/about/leadership/secretary/priorities/index.html (accessed on 7 March 2021).
- Conway, P.H. Value-driven health care: Implications for hospitals and hospitalists. J. Hosp. Med. 2009, 4, 507–511. [Google Scholar] [CrossRef] [PubMed] [Green Version]


| Obstacle | Potential Solutions |
|---|---|
| Orders Incomplete | |
| Non-hospitalists give limited phone orders | Increase use of hospitalists/unit-based APNs |
| Variability in physician practices | Hospitalists/APNS/MDR rounds |
| Failure to use order sets | APNs |
| Lack of available order sets/care pathways | Develop orders sets/pathways |
| Testing Delays: Physician Related | |
| Inappropriate tests: not indicated | APNs/MDR |
| Inappropriate tests: Could be done as O/P | APNs/MDR |
| Duplicate testing | APNs/MDR |
| Consultant-related order delay | APNs |
| Poor communication among team members | MDR/APNs |
| Delayed results: echo and stress | Remote reading/APN stress model |
| Testing Delays: System Related | |
| Wasted transport time due to poor test coordination | Command center |
| Limited Capacity/Machines, Techs, Hours | |
| MRI (hours) | Staff MRI 24/7 |
| Cath lab (rooms/staff) | Improve capacity and efficiency |
| Ultrasound (hours) | Increase evening staffing |
| Stress test (weekend hours) | Institute APN stress model |
| Transport Delays | |
| Patient/nurse not ready | Command center |
| Lack of transporters | Staffing issue |
| Lack of equipment | Purchase wheelchairs/stretchers as needed |
| Delayed Entry of D/C Orders | |
| Competing priorities | MDR/APNs |
| PMD rounds AFTER office hours | APNs |
| Handoff issues (Weekends) | MDR/APNs |
| Delays 2/2 Rehab Placement | |
| Failure to ambulate | OOB initiative |
| Poor communication among team members | MDR/APNs |
| Delayed PT evaluation | Increase PT staffing |
| Family decision making | MDR/APNs |
| Obstacle | Potential Solutions |
|---|---|
| Discharge Planning Delays | |
| Failure to identify discharges until day of discharge | MDR |
| Placement Issues | |
| Patients on 1:1 observation not accepted | None |
| MH facilities do not accept PD patients | Work to change policy |
| Delay in initiation of facility search | MDR/APNs |
| Lack of SW support on weekends | Increase SW resources on weekends |
| Delays in authorization | Have facilities accept patients pending authorization |
| Failure of facilities to accept patients after hours | Have standard set of rules for all participating facilities |
| Transport Delays: Alert | Have alternative provider available |
| Transport Delays: LogistiCare | None |
| Nursing Delays | |
| Misaligned incentives | Create incentives for nurses to discharge early |
| Passive alert system | Discharge board |
| Meds to beds | Should not be an obstacle (can deliver to CTC or lounge) |
| Competing nursing priorities | ANM to assist |
| Lack of ownership of process | Nurse manager or designee to “own” process |
| Internal transportation issues | Rapid discharge team |
| Clinical Delays | |
| Delayed physician discharge order | Hold hospitalists, faculty, residents accountable |
| APN deployment | |
| Med Rec and Rx issues | Increase use of hospitalists/APNs |
Publisher’s Note: MDPI stays neutral with regard to jurisdictional claims in published maps and institutional affiliations. |
© 2021 by the authors. Licensee MDPI, Basel, Switzerland. This article is an open access article distributed under the terms and conditions of the Creative Commons Attribution (CC BY) license (https://creativecommons.org/licenses/by/4.0/).
Share and Cite
Patel, S.; Alshami, A.; Douedi, S.; Campbell, N.; Hossain, M.; Mushtaq, A.; Tarina, D.; Sealove, B.; Kountz, D.; Carpenter, K.; et al. Improving Hospital Length of Stay: Results of a Retrospective Cohort Study. Healthcare 2021, 9, 762. https://doi.org/10.3390/healthcare9060762
Patel S, Alshami A, Douedi S, Campbell N, Hossain M, Mushtaq A, Tarina D, Sealove B, Kountz D, Carpenter K, et al. Improving Hospital Length of Stay: Results of a Retrospective Cohort Study. Healthcare. 2021; 9(6):762. https://doi.org/10.3390/healthcare9060762
Chicago/Turabian StylePatel, Swapnil, Abbas Alshami, Steven Douedi, Natasha Campbell, Mohammad Hossain, Arman Mushtaq, Dana Tarina, Brett Sealove, David Kountz, Kim Carpenter, and et al. 2021. "Improving Hospital Length of Stay: Results of a Retrospective Cohort Study" Healthcare 9, no. 6: 762. https://doi.org/10.3390/healthcare9060762
APA StylePatel, S., Alshami, A., Douedi, S., Campbell, N., Hossain, M., Mushtaq, A., Tarina, D., Sealove, B., Kountz, D., Carpenter, K., Angelo, E., Buccellato, V., Sable, K., Frank, E., & Asif, A. (2021). Improving Hospital Length of Stay: Results of a Retrospective Cohort Study. Healthcare, 9(6), 762. https://doi.org/10.3390/healthcare9060762