
Impact of Work Value Perception on Workers’ Physical and Mental Health: Evidence from China


Abstract
:1. Introduction
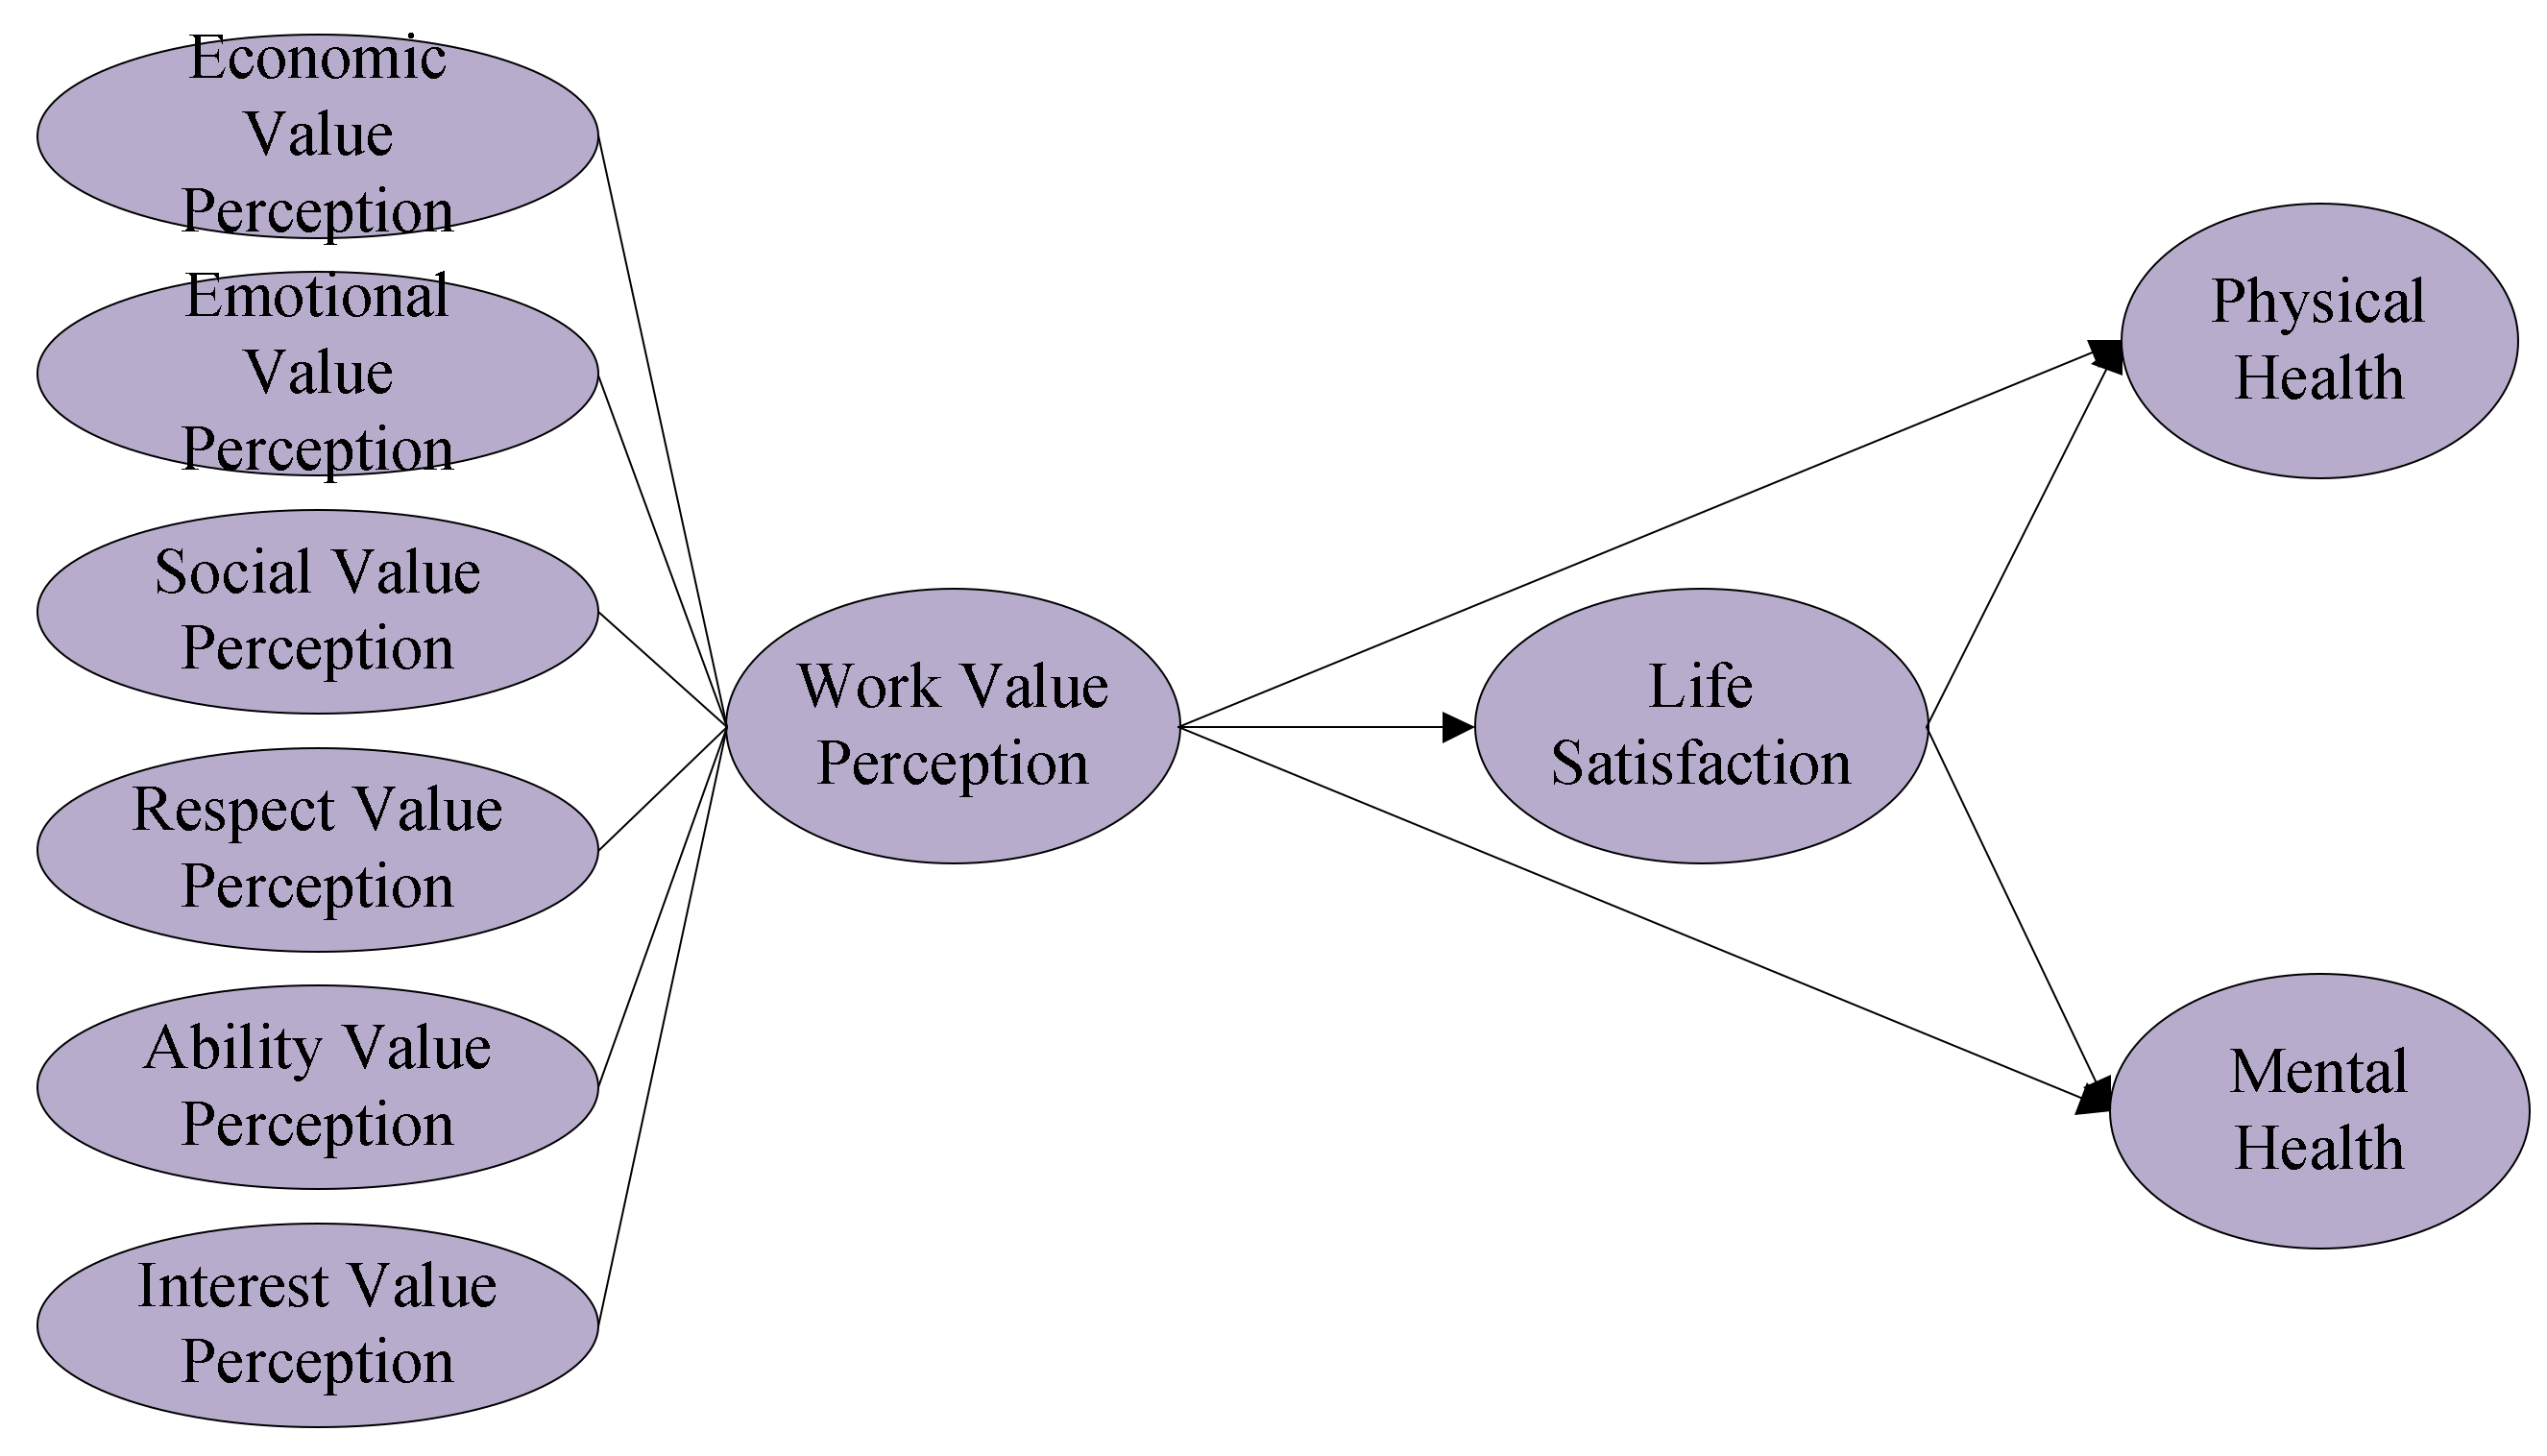
2. Theoretical Framework and Hypothesis Development
2.1. Work Value Perception Related to Existence Needs and Health
2.2. Work Value Perception Related to Relatedness Needs and Health
2.3. Work Value Perception Related to Growth Needs and Health
2.4. Mediating Role of Life Satisfaction
3. Method
3.1. Sample
3.2. Measures
3.2.1. Explained Variables
3.2.2. Explanatory Variable
3.2.3. Mediating Variable
3.2.4. Control Variables
3.3. Data Analysis
4. Results
4.1. Descriptive Analysis
4.2. Benchmark Regression
4.3. Solving the Endogeneity Problem
4.4. Regressions of Different Dimensions
4.5. Robustness Check by Subgroup Regressions
4.6. Mechanism Analysis
5. Discussion
5.1. Theoretical Implications
5.2. Practical Implications
5.3. Strengths and Limitations
6. Conclusions
Author Contributions
Funding
Institutional Review Board Statement
Informed Consent Statement
Data Availability Statement
Conflicts of Interest
Appendix A

| Items | Item 1 | Item 2 | Item 3 | Item 4 | Item 5 | Item 6 | Item 7 | Item 8 | Item 9 | Item 10 | Item 11 | Item 12 | Item 13 | Item 14 | Item 15 | Item 16 | Item 17 | Item 18 | Item 19 | Item 20 |
|---|---|---|---|---|---|---|---|---|---|---|---|---|---|---|---|---|---|---|---|---|
| Item 1 | 1.000 | |||||||||||||||||||
| Item 2 | 0.562 | 1.000 | ||||||||||||||||||
| Item 3 | 0.690 | 0.636 | 1.000 | |||||||||||||||||
| Item 4 | 0.582 | 0.521 | 0.700 | 1.000 | ||||||||||||||||
| Item 5 | 0.588 | 0.548 | 0.672 | 0.678 | 1.000 | |||||||||||||||
| Item 6 | 0.685 | 0.582 | 0.724 | 0.695 | 0.751 | 1.000 | ||||||||||||||
| Item 7 | 0.580 | 0.540 | 0.652 | 0.668 | 0.701 | 0.749 | 1.000 | |||||||||||||
| Item 8 | 0.564 | 0.499 | 0.651 | 0.710 | 0.663 | 0.720 | 0.723 | 1.000 | ||||||||||||
| Item 9 | 0.568 | 0.499 | 0.664 | 0.732 | 0.664 | 0.719 | 0.708 | 0.854 | 1.000 | |||||||||||
| Item 10 | 0.586 | 0.549 | 0.685 | 0.656 | 0.669 | 0.700 | 0.662 | 0.722 | 0.765 | 1.000 | ||||||||||
| Item 11 | 0.466 | 0.530 | 0.503 | 0.466 | 0.506 | 0.553 | 0.519 | 0.493 | 0.512 | 0.561 | 1.000 | |||||||||
| Item 12 | 0.663 | 0.550 | 0.681 | 0.641 | 0.649 | 0.780 | 0.680 | 0.686 | 0.702 | 0.701 | 0.619 | 1.000 | ||||||||
| Item 13 | 0.563 | 0.534 | 0.653 | 0.624 | 0.643 | 0.696 | 0.652 | 0.672 | 0.690 | 0.688 | 0.542 | 0.756 | 1.000 | |||||||
| Item 14 | 0.576 | 0.527 | 0.665 | 0.648 | 0.643 | 0.705 | 0.651 | 0.694 | 0.725 | 0.738 | 0.550 | 0.739 | 0.760 | 1.000 | ||||||
| Item 15 | 0.569 | 0.517 | 0.670 | 0.655 | 0.651 | 0.687 | 0.665 | 0.704 | 0.729 | 0.731 | 0.515 | 0.709 | 0.735 | 0.789 | 1.000 | |||||
| Item 16 | 0.575 | 0.515 | 0.676 | 0.685 | 0.668 | 0.711 | 0.672 | 0.762 | 0.780 | 0.741 | 0.531 | 0.734 | 0.727 | 0.790 | 0.813 | 1.000 | ||||
| Item 17 | 0.565 | 0.516 | 0.651 | 0.598 | 0.618 | 0.663 | 0.586 | 0.637 | 0.658 | 0.742 | 0.508 | 0.679 | 0.675 | 0.716 | 0.729 | 0.746 | 1.000 | |||
| Item 18 | 0.628 | 0.537 | 0.674 | 0.663 | 0.645 | 0.761 | 0.677 | 0.694 | 0.712 | 0.707 | 0.558 | 0.771 | 0.701 | 0.735 | 0.718 | 0.765 | 0.750 | 1.000 | ||
| Item 19 | 0.569 | 0.516 | 0.663 | 0.665 | 0.668 | 0.681 | 0.658 | 0.710 | 0.733 | 0.745 | 0.509 | 0.700 | 0.720 | 0.765 | 0.842 | 0.796 | 0.773 | 0.763 | 1.000 | |
| Item 20 | 0.583 | 0.546 | 0.687 | 0.680 | 0.671 | 0.698 | 0.674 | 0.758 | 0.782 | 0.765 | 0.540 | 0.711 | 0.726 | 0.774 | 0.801 | 0.847 | 0.791 | 0.777 | 0.851 | 1.000 |
Appendix B
Measurement Dimensions of Work Value Perception
- My current job can meet my economic needs. (Economic value perception)
- My current job can make me feel at ease. (Emotional value perception)
- My current job can make me get to know more people. (Social value perception)
- My current job can make me get respect from other people. (Respect value perception)
- My current job can give my ability to full play. (Ability value perception)
- My current job can satisfy my interest. (Interest value perception)
References
- Laiken, M.E. The Ecology of Learning and Work: Learning for Transformative Work Practices. In Learning Toward an Ecological Consciousness: Selected Transformative Practices; Palgrave Macmillan: New York, NY, USA, 2004. [Google Scholar]
- Reichel, A.; Neumann, Y.; Pizam, A. The work values and motivational profiles of vocational, collegiate, nonconformist, and academic students. Res. High. Educ. 1981, 14, 187–199. [Google Scholar] [CrossRef]
- Harris, C.T.; Earle, J.R. Gender and work values: Survey findings from a working-class sample. Sex Roles 1986, 15, 487–494. [Google Scholar] [CrossRef]
- Adkins, C.L.; Russell, C.J. Supervisor-subordinate work value congruence and subordinate performance: A pilot study. J. Bus. Psychol. 1997, 12, 205–218. [Google Scholar] [CrossRef]
- Sinisalo, P. Changing work values and expressed educational plans of adolescents: A cross-sectional follow-up of three cohorts in Finland. Eur. J. Psychol. Educ. 2004, 19, 227. [Google Scholar] [CrossRef]
- Lee, H.W.; Yen, K.W. A study of the relationship between work values and career orientation of employed in the high technology industry. Qual. Quant. 2013, 47, 803–810. [Google Scholar] [CrossRef]
- Yang, F.; Jiang, Y.; Paudel, K.P. Impact of work value awareness on self-rated physical health of rural-to-urban migrant workers in China. Healthcare 2021, 9, 505. [Google Scholar] [CrossRef]
- Kim, T.H.; Shin, Y.J.; Kim, D.Y. A study on the employee’s attitude differentiated by their perception gap of work value prior and posterior to joining a company. J. Hum. Resour. Manag. Res. 2014, 21, 407–434. [Google Scholar] [CrossRef]
- Craig, C.; Menon, C.V.; Klein, M.I. A positive relationship between nature appreciation, emotional functioning, and perception of work value. Proc. Hum. Factors Ergon. Soc. Annu. Meet. 2015, 59, 1061–1065. [Google Scholar] [CrossRef] [Green Version]
- Athanasou, J.A. Work Values. In Promoting Career Development after Personal Injury; Sense Publishers: Rotterdam, The Netherlands, 2017. [Google Scholar]
- Ferrie, J.E.; Westerlund, H.; Virtanen, M.; Vahtera, J.; Kivimäki, M. Flexible labor markets and employee health. Scand. J. Work. Environ. Health Suppl. 2008, 6, 98–110. [Google Scholar]
- Yi, G.; Liu, L.; Manio, M.; Latkin, C.; Hall, B.J. The influence of housing on sexual and reproductive health status and service utilization among Filipina migrant domestic workers in Macao (SAR), China: A population survey. J. Migr. Health 2020, 1–2, 100007. [Google Scholar] [CrossRef]
- Peng, L.; Chan, A.H.S. Adjusting work conditions to meet the declined health and functional capacity of older construction workers in Hong Kong. Saf. Sci. 2020, 127, 104711. [Google Scholar] [CrossRef]
- King, E.A. Child welfare workers’ experiences of client-perpetrated violence: Implications for worker mental health. Child. Youth Serv. Rev. 2021, 120, 105763. [Google Scholar] [CrossRef]
- Xiao, C.; Yang, Y.; Chi, G. Does the mental health of migrant workers suffer from long commute time? Evidence from China. J. Transp. Health 2020, 19, 100932. [Google Scholar] [CrossRef]
- Oliva-Moreno, J. Loss of labour productivity caused by disease and health problems: What is the magnitude of its effect on Spain’s Economy. Eur. J. Health Econ. 2012, 13, 605–614. [Google Scholar] [CrossRef]
- Dollard, M.F.; Neser, D.Y. Worker health is good for the economy: Union density and psychosocial safety climate as determinants of country differences in worker health and productivity in 31 European countries. Soc. Sci. Med. 2013, 92, 114–123. [Google Scholar] [CrossRef] [PubMed]
- Bates, N.; Callander, E.; Lindsay, D.; Watt, K. Labour force participation and the cost of lost productivity due to cancer in Australia. BMC Public Health 2018, 18, 375. [Google Scholar] [CrossRef] [Green Version]
- Borjas, G.J. Welfare reform, labor supply, and health insurance in the immigrant population. J. Health Econ. 2003, 22, 933–958. [Google Scholar] [CrossRef] [PubMed] [Green Version]
- Haas, S.A.; Glymour, M.M.; Berkman, L.F. Childhood health and labor market inequality over the life course. J. Health Soc. Behav. 2011, 52, 298–313. [Google Scholar] [CrossRef] [Green Version]
- Ng, E.; Muntaner, C.; Chung, H. Welfare states, labor markets, political dynamics, and population health: A time-series cross-sectional analysis among east and southeast Asian nations. Asia Pac. J. Public Health 2016, 28, 219–231. [Google Scholar] [CrossRef]
- Moyce, S.C.; Schenker, M. Migrant workers and their occupational health and safety. Annu. Rev. Public Health 2018, 39, 351–365. [Google Scholar] [CrossRef] [Green Version]
- Walters, D.; Wadsworth, E. Participation in safety and health in European workplaces: Framing the capture of representation. Eur. J. Ind. Relat. 2020, 26, 75–90. [Google Scholar] [CrossRef]
- Woolley, T.; Lowe, J.; Raasch, B.; Glasby, M.; Buettner, P.G. Workplace sun protection policies and employees’ sun-related skin damage. Am. J. Health Behav. 2008, 32, 201–208. [Google Scholar] [CrossRef] [PubMed]
- Howard, J.; Hearl, F. Occupational safety and health in the USA: Now and the future. Ind. Health 2012, 50, 80–83. [Google Scholar] [CrossRef] [Green Version]
- Arcury, T.A.; Grzywacz, J.G.; Anderson, A.M.; Mora, D.C.; Carrillo, L.; Chen, H.Y.; Quandt, S.A. Employer, use of personal protective equipment, and work safety climate: Latino poultry processing workers. Am. J. Ind. Med. 2013, 56, 180–188. [Google Scholar] [CrossRef] [PubMed]
- Peters, C.E.; Koehoorn, M.W.; Demers, P.A.; Nicol, A.M.; Kalia, S. Outdoor workers’ use of sun protection at work and leisure. Saf. Health Work 2016, 7, 208–212. [Google Scholar] [CrossRef] [Green Version]
- Lippel, K.; Walters, D. Regulating health and safety and workers’ compensation in Canada for the mobile workforce: Now you see them, now you don’t. New Solut. J. Environ. Occup. Health Policy 2019, 29, 317–348. [Google Scholar] [CrossRef] [PubMed]
- Neely, M.T. The portfolio ideal worker: Insecurity and inequality in the new economy. Qual. Sociol. 2020, 43, 271–296. [Google Scholar] [CrossRef]
- Guo, R.Y. More than just breadwinners: How Chinese male migrant workers’ family relationships shape their factory labour process. Community Work Fam. 2019, 1–20. [Google Scholar] [CrossRef]
- Tracton-Bishop, B. They are not machines: Korean women workers and their fight for democratic trade unionism in the 1970s. Contemp. Sociol. J. Rev. 2005, 34, 180–181. [Google Scholar] [CrossRef]
- Gardener, D. Workers’ rights and corporate accountability—The move towards practical, worker-driven change for sportswear workers in Indonesia. Gend. Dev. 2012, 20, 49–65. [Google Scholar] [CrossRef]
- Alderfer, C.P. An empirical test of a new theory of human needs. Organ. Behav. Hum. Perform. 1969, 4, 142–175. [Google Scholar] [CrossRef]
- Dostert, J.; Müller, R. Motivational assistance system design for industrial production: From motivation theories to design strategies. Cogn. Tech. Work 2020, 23, 507–535. [Google Scholar] [CrossRef]
- George, J.M.; Brief, A.P. The economic instrumentality of work: An examination of the moderating effects of financial requirements and sex on the pay-life satisfaction relationship. J. Vocat. Behav. 1990, 37, 357–368. [Google Scholar] [CrossRef]
- Duffy, R.D.; Kim, H.J.; Gensmer, N.P.; Raque-Bogdan, T.L.; Douglass, R.P.; England, J.W.; Buyukgoze-Kavasc, A. Linking decent work with physical and mental health: A psychology of working perspective. J. Vocat. Behav. 2019, 112, 384–395. [Google Scholar] [CrossRef]
- Ennis, N.E.; Hobfoll, S.E.; Schröder, K.E.E. Money doesn’t talk, it swears: How economic stress and resistance resources impact inner-city women’s depressive mood. Am. J. Community Psychol. 2020, 28, 149–173. [Google Scholar] [CrossRef]
- Diala, C.C.; Muntaner, C. Mood and anxiety disorders among rural, urban, and metropolitan residents in the United States. Community Ment. Health J. 2013, 39, 239–252. [Google Scholar] [CrossRef]
- Erdem, O.; Lenthe, F.J.; Burdorf, A. Income inequality and psychological distress at neighbourhood and municipality level: An analysis in the Netherlands. Health Place 2019, 56, 1–8. [Google Scholar] [CrossRef] [PubMed]
- Sorensen, G.; Dennerlein, J.T.; Peters, S.E.; Sabbath, E.L.; Kelly, E.L.; Wagner, G.R. The future of research on work, safety, health and wellbeing: A guiding conceptual framework. Soc. Sci. Med. 2021, 269, 113593. [Google Scholar] [CrossRef]
- Nyström, A.; Andersson-Segesten, K. Peace of mind as an important aspect of old people’s health. Scand. J. Caring Sci. 1990, 4, 55–62. [Google Scholar] [CrossRef]
- Hoffmann, S.W.; Tug, S.; Simon, P. Obesity prevalence and unfavorable health risk behaviors among German kindergarten teachers: Cross-sectional results of the kindergarten teacher health study. BMC Public Health 2013, 13, 927. [Google Scholar] [CrossRef] [Green Version]
- Shigemi, J.; Mino, Y.; Tsuda, T.; Babazono, A.; Aoyama, H. The relationship between job stress and mental health at work. Ind. Health 1997, 35, 29–35. [Google Scholar] [CrossRef] [Green Version]
- Cahill, J.; Cullen, P.; Gaynor, K. Interventions to support the management of work-related stress (WRS) and wellbeing/mental health issues for commercial pilots. Cogn. Tech. Work. 2020, 22, 517–547. [Google Scholar] [CrossRef]
- Golkar, A.; Johansson, E.; Kasahara, M.; Osika, W.; Perski, A.; Savic, I. The influence of work-related chronic stress on the regulation of emotion and on functional connectivity in the brain. PLoS ONE 2014, 9, e104550. [Google Scholar] [CrossRef]
- Milićević Šantrić, M.; Gačević, M.; Milić, N.; Filipović, J.; Todorovic, J.; Terzic-Supic, Z. Work-pressure, job-satisfaction and turnover intentions among health managers in Serbia. Eur. J. Public Health 2019, 29, ckz185.081. [Google Scholar] [CrossRef]
- Hurn, B.J.; Tomalin, B. International Team Building and Teamworking. In Cross-Cultural Communication; Palgrave Macmillan: London, UK, 2013. [Google Scholar]
- Jones, B.K.; McAdams, D.P. Becoming generative: Socializing influences recalled in life stories in late midlife. J. Adult Dev. 2013, 20, 158–172. [Google Scholar] [CrossRef]
- Plaza-Úbeda, J.A.; de Burgos-Jiménez, J.; Carmona-Moreno, E. Measuring stakeholder integration: Knowledge, interaction and adaptational behavior dimensions. J. Bus. Ethics 2010, 93, 419–442. [Google Scholar] [CrossRef]
- Nguyen, P.D.; Dang, C.X.; Nguyen, L.D. Would better earning, work environment, and promotion opportunities increase employee performance? An investigation in state and other sectors in Vietnam. Public Organ. Rev. 2015, 15, 565–579. [Google Scholar] [CrossRef]
- El Kadiri Boutchich, D. Factors with significant impact on efficiency of research laboratories: Case of the public university. Qual. Quant. 2020, 54, 1317–1333. [Google Scholar] [CrossRef]
- King, C.; Murillo, E.; Lee, H. The effects of generational work values on employee brand attitude and behavior: A multi-group analysis. Int. J. Hosp. Manag. 2017, 66, 92–105. [Google Scholar] [CrossRef]
- Nelson, J.L.; Hegtvedt, K.A.; Haardorfer, R.; Hayward, J.L. Trust and respect at work: Justice antecedents and the role of coworker dynamics. Work. Occup. 2019, 46, 307–338. [Google Scholar] [CrossRef]
- Renger, D.; Miche, M.; Casini, A. Professional recognition at work the protective role of esteem, respect, and care for burnout among employees. J. Occup. Environ. Med. 2020, 62, 202–209. [Google Scholar] [CrossRef]
- Boafo, I.M. The effects of workplace respect and violence on nurses’ job satisfaction in Ghana: A cross-sectional survey. Hum. Resour. Health 2018, 16, 6. [Google Scholar] [CrossRef] [PubMed]
- Zhong, F.; Yano, E.; Lan, Y.; Wang, M.; Wang, Z.; Wang, X. Mental ability and psychological work performance in Chinese workers. Ind. Health 2006, 44, 598–603. [Google Scholar] [CrossRef] [Green Version]
- Klehe, U.; Anderson, N. Working hard and working smart: Motivation and ability during typical and maximum performance. J. Appl. Psychol. 2007, 92, 978–992. [Google Scholar] [CrossRef] [Green Version]
- Mache, S.; Vitzthum, K.; Groneberg, D.A. High work ability and performance in psychiatric health care services: Associations with organizational, individual and contextual factors. Neurol. Psychiatry Brain Res. 2015, 21, 88–95. [Google Scholar] [CrossRef]
- Hurt, D.J.; Holen, M.C. Work values in vocational interest exploration. J. Vocat. Behav. 1976, 8, 89–93. [Google Scholar] [CrossRef]
- Lent, R.W.; Brown, S.D.; Hackett, G. Toward a unifying social cognitive theory of career and academic interest, choice, and performance. J. Vocat. Behav. 1994, 45, 79–122. [Google Scholar] [CrossRef]
- Kassam, A.F.; Cortez, A.R.; Winer, L.K.; Kuethe, J.W.; Athota, K.P.; Quillin, R.C. The impact of medical student interest in surgery on clerkship performance and career choice. Am. J. Surg. 2020, 219, 359–365. [Google Scholar] [CrossRef]
- Swaney, K.; Prediger, D. The relationship between interest-occupation congruence and job satisfaction. J. Vocat. Behav. 1985, 26, 13–24. [Google Scholar] [CrossRef]
- Hoff, K.A.; Song, Q.C.; Wee, C.J.M.; Phan, W.M.J.; Rounds, J. Interest fit and job satisfaction: A systematic review and meta-analysis. J. Vocat. Behav. 2020, 123, 103503. [Google Scholar] [CrossRef]
- Jiang, Z.; Milia, L.D.; Jiang, Y.; Jiang, X. Thriving at work: A mentoring-moderated process linking task identity and autonomy to job satisfaction. J. Vocat. Behav. 2020, 118, 103373. [Google Scholar] [CrossRef]
- Ghetta, A.; Hirschi, A.; Wang, M.; Rossier, J.; Herrmann, A. Birds of a feather flock together: How congruence between worker and occupational personality relates to job satisfaction over time. J. Vocat. Behav. 2020, 119, 103412. [Google Scholar] [CrossRef]
- Piko, B.F. Burnout, role conflict, job satisfaction and psychosocial health among Hungarian health care staff: A questionnaire survey. Int. J. Nurs. Stud. 2006, 43, 311–318. [Google Scholar] [CrossRef]
- Scanlan, J.N.; Still, M. Job satisfaction, burnout and turnover intention in occupational therapists working in mental health. Aust. Occup. Ther. J. 2013, 60, 310–318. [Google Scholar] [CrossRef] [PubMed]
- Faragher, E.B.; Cass, M.; Cooper, C.L. The relationship between job satisfaction and health: A meta-analysis. Occup. Environ. Med. 2005, 62, 105–112. [Google Scholar] [CrossRef]
- Scanlan, J.N.; Hazelton, T. Relationships between job satisfaction, burnout, professional identity and meaningfulness of work activities for occupational therapists working in mental health. Aust. Occup. Ther. J. 2019, 66, 581–590. [Google Scholar] [CrossRef]
- Gonzalez-Mule, E.; Carter, K.M.; Mount, M.K. Are smarter people happier? Meta-analyses of the relationships between general mental ability and job and life satisfaction. J. Vocat. Behav. 2017, 99, 146–164. [Google Scholar] [CrossRef]
- Lee, E.S.; Shin, Y. Social cognitive predictors of Korean secondary school teachers’ job and life satisfaction. J. Vocat. Behav. 2017, 102, 139–150. [Google Scholar] [CrossRef]
- Bamundo, P.J.; Kopelman, R.E. The moderating effects of occupation, age, and urbanization on the relationship between job satisfaction and life satisfaction. J. Vocat. Behav. 1980, 17, 106–123. [Google Scholar] [CrossRef]
- Lent, R.W.; Nota, L.; Soresi, S.; Ginevra, M.C.; Duffy, R.D.; Brown, S.D. Predicting the job and life satisfaction of italian teachers: Test of a social cognitive model. J. Vocat. Behav. 2011, 79, 91–97. [Google Scholar] [CrossRef]
- Körner, A.; Reitzle, M.; Silbereisen, R.K. Work-related demands and life satisfaction: The effects of engagement and disengagement among employed and long-term unemployed people. J. Vocat. Behav. 2012, 80, 187–196. [Google Scholar] [CrossRef]
- Santilli, S.; Nota, L.; Ginevra, M.C.; Soresi, S. Career adaptability, hope and life satisfaction in workers with intellectual disability. J. Vocat. Behav. 2014, 85, 67–74. [Google Scholar] [CrossRef]
- Demerouti, E.; Bakker, A.B.; Schaufeli, W.B. Spillover and crossover of exhaustion and life satisfaction among dual-earner parents. J. Vocat. Behav. 2005, 67, 266–289. [Google Scholar] [CrossRef]
- Bouwkamp-Memmer, J.C.; Whiston, S.C.; Hartung, P.J. Work values and job satisfaction of family physicians. J. Vocat. Behav. 2013, 82, 248–255. [Google Scholar] [CrossRef]
- Schlett, C.; Ziegler, R. Job emotions and job cognitions as determinants of job satisfaction: The moderating role of individual differences in need for affect. J. Vocat. Behav. 2014, 84, 74–89. [Google Scholar] [CrossRef]
- Strine, T.W.; Chapman, D.P.; Balluz, L.S.; Moriarty, D.G.; Mokdad, A.H. The associations between life satisfaction and health-related quality of life, chronic illness, and health behaviors among U.S. Community-dwelling adults. J. Community Health 2008, 33, 40–50. [Google Scholar] [CrossRef]
- Grant, N.; Wardle, J.; Steptoe, A. The relationship between life satisfaction and health behavior: A cross-cultural analysis of young adults. Int. J. Behav. Med. 2009, 16, 259–268. [Google Scholar] [CrossRef]
- Haar, J.M.; Russo, M.; Suñe, A.; Ollier-Malaterre, A. Outcomes of work–life balance on job satisfaction, life satisfaction and mental health: A study across seven cultures. J. Vocat. Behav. 2014, 85, 361–373. [Google Scholar] [CrossRef]
- Luo, Y.; Hawkley, L.C.; Waite, L.J.; Cacioppo, J.T. Loneliness, health, and mortality in old age: A national longitudinal study. Soc. Sci. Med. 2012, 74, 907–914. [Google Scholar] [CrossRef] [Green Version]
- Moor, I.; Spallek, J.; Richter, M. Explaining socioeconomic inequalities in self-rated health: A systematic review of the relative contribution of material, psychosocial and behavioural factors. J. Epidemiol. Community Health 2017, 71, 565–575. [Google Scholar] [CrossRef]
- Colen, C.G.; Ramey, D.M.; Cooksey, E.C.; Williams, D.R. Racial disparities in health among nonpoor African Americans and Hispanics: The role of acute and chronic discrimination. Soc. Sci. Med. 2018, 199, 167–180. [Google Scholar] [CrossRef]
- Radloff, L.S. The CES-D scale: A self report depression scale for research in the general population. Appl. Psychol. Meas. 1977, 1, 385–401. [Google Scholar] [CrossRef]
- Ohrnberger, J.; Anselmi, L.; Fichera, E.; Sutton, M. The effect of cash transfers on mental health: Opening the black box–A study from South Africa. Soc. Sci. Med. 2020, 260, 113181. [Google Scholar] [CrossRef]
- Somefun, O.D.; Fotso, A.S. The effect of family and neighbourhood social capital on youth mental health in South Africa. J. Adolesc. 2020, 83, 22–26. [Google Scholar] [CrossRef]
- Zhang, J.; Sun, W.; Kong, Y.; Wang, C. Reliability and validity of the Center for Epidemiological Studies Depression Scale in 2 special adult samples from rural China. Compr. Psychiatry 2012, 53, 1243–1251. [Google Scholar] [CrossRef] [Green Version]
- Lance, C.E.; Lautenschlager, G.J.; Sloan, C.E.; Varca, P.E. A comparison between bottom–up, top–down, and bidirectional models of relationships between global and life facet satisfaction. J. Personal. 1989, 57, 601–624. [Google Scholar] [CrossRef]
- Schimmack, U.; Wagner, G.G.; Krause, P.; Schupp, J. Stability and change of well being: An experimentally enhanced latent state-trait-error analysis. Soc. Indic. Res. 2010, 95, 19–31. [Google Scholar] [CrossRef]
- Nijdam-Jones, A.; McNiel, D.E. Prospective study of mental health court and life satisfaction. Int. J. Law Psychiatry 2020, 73, 101643. [Google Scholar] [CrossRef]
- Gove, W.R.; Hughes, M.; Style, C.B. Does marriage have positive effects on the psychological well-being of the individual? J. Health Soc. Behav. 1983, 24, 122–131. [Google Scholar] [CrossRef]
- Li, J.H.; Luo, C.; de Klerk, N. Trends in infant/child mortality and life expectancy in Indigenous populations in Yunnan Province, China. Aust. N. Z. J. Public Health 2008, 32, 216–223. [Google Scholar] [CrossRef]
- Sun, Y.; Shang, J. Factors affecting the health of residents in China: A perspective based on the living environment. Ecol. Indic. 2015, 51, 228–236. [Google Scholar] [CrossRef]
- Korkmaz, S.; Park, D.J. Comparison of safety perception between foreign and local workers in the construction industry in Republic of Korea. Saf. Health Work 2018, 9, 53–58. [Google Scholar] [CrossRef]
- Jiang, Y.; Luo, H.; Yang, F. Influences of migrant construction workers’ environmental risk perception on their physical and mental health: Evidence from China. Int. J. Environ. Res. Public Health 2020, 17, 7424. [Google Scholar] [CrossRef]
- Latifa, Y.A.A.; Chong, M.C.; Tang, L.Y.; Wong, L.P.; Raimi, A.M. The effect of health education on knowledge and self-care among Arabic schoolgirls with primary dysmenorrhea in Malaysia. J. Nurse Pract. 2020, 16, 762–767. [Google Scholar]
- Yang, F.; Jiang, Y. Heterogeneous influences of social support on physical and mental health: Evidence from China. Int. J. Environ. Res. Public Health 2020, 17, 6838. [Google Scholar] [CrossRef]
- Adler, N.E.; Newman, K. Socioeconomic disparities in health: Pathways and policies. Health Aff. 2002, 21, 60–76. [Google Scholar] [CrossRef]
- Boden, J.M.; Lee, J.O.; Horwood, L.J.; Grest, C.V.; McLeod, G.F.H. Modelling possible causality in the associations between unemployment, cannabis use, and alcohol misuse. Soc. Sci. Med. 2017, 175, 127–134. [Google Scholar] [CrossRef]
- Hult, M.; Pietilä, A.M.; Koponen, P.; Saaranen, T. Association between good work ability and health behaviours among unemployed: A cross-sectional survey. Appl. Nurs. Res. 2018, 43, 86–92. [Google Scholar] [CrossRef] [Green Version]
- Saran, I.; Winn, L.; Kirui, J.K.; Menya, D.; O’Meara, W.P. The relative importance of material and non-material incentives for community health workers: Evidence from a discrete choice experiment in Western Kenya. Soc. Sci. Med. 2020, 246, 112726. [Google Scholar] [CrossRef]
- Cath, C.; Wachter, S.; Mittelstadt, B.; Taddeo, M.; Floridi, L. Artificial intelligence and the ‘Good Society’: The US, EU, and UK approach. Sci. Eng. Ethics 2018, 24, 505–528. [Google Scholar]
- Gay, P. The Enlightenment; Weidenfeld & Nicolson: London, UK, 1967. [Google Scholar]
- Edelstein, D. The Enlightenment: A Genealogy; University of Chicago Press: Chicago, IL, USA, 2010. [Google Scholar]
| Variable | Mean | SD | Min | Max |
|---|---|---|---|---|
| Physical health | 3.589 | 0.994 | 1 | 5 |
| Mental health | 27.121 | 8.899 | 20 | 80 |
| Work value perception | 21.859 | 4.126 | 6 | 30 |
| Life satisfaction | 3.714 | 0.935 | 1 | 5 |
| Gender (1 = male; 0 = female) | 0.502 | 0.500 | 0 | 1 |
| Age (years) | 46.858 | 12.898 | 16 | 96 |
| Education (years) | 8.658 | 4.200 | 0 | 23 |
| Marital status (1 = married; 0 = unmarried) | 0.874 | 0.331 | 0 | 1 |
| Religion (1 = with religion; 0 = without religion) | 0.127 | 0.333 | 0 | 1 |
| Income (logarithm of annual income) | 9.910 | 1.141 | 4.605 | 14.931 |
| Smoking (1 = yes; 0 = no) | 0.308 | 0.462 | 0 | 1 |
| Drinking (1 = yes; 0 = no) | 0.222 | 0.415 | 0 | 1 |
| Exercise (1 = yes; 0 = no) | 0.314 | 0.464 | 0 | 1 |
| IV | 21.859 | 0.660 | 20.208 | 23.089 |
| N | 16,890 | |||
| Variables | Physical Health (Ordered Probit) | Mental Health (OLS) | ||||
|---|---|---|---|---|---|---|
| (1) | (2) | (3) | (4) | (5) | (6) | |
| Work value perception | 0.028 *** | 0.028 *** | 0.012 *** | −0.241 *** | −0.239 *** | −0.091 *** |
| (0.002) | (0.002) | (0.002) | (0.017) | (0.017) | (0.016) | |
| Gender | 0.103 *** | −1.471 *** | ||||
| (0.022) | (0.173) | |||||
| Age | −0.027 *** | 0.024 *** | ||||
| (0.001) | (0.006) | |||||
| Education | 0.019 *** | −0.156 *** | ||||
| (0.003) | (0.019) | |||||
| Marital status | 0.065 ** | −1.019 *** | ||||
| (0.026) | (0.205) | |||||
| Religion | −0.040 | 1.032 *** | ||||
| (0.027) | (0.212) | |||||
| Income | 0.049 *** | −0.214 *** | ||||
| (0.008) | (0.066) | |||||
| Smoking | 0.037 | 0.077 | ||||
| (0.023) | (0.183) | |||||
| Drinking | 0.065 *** | 0.039 | ||||
| (0.023) | (0.177) | |||||
| Exercise | 0.036 * | −0.193 | ||||
| (0.019) | (0.149) | |||||
| Life satisfaction | 0.266 *** | −2.466 *** | ||||
| (0.009) | (0.073) | |||||
| Region | Yes | Yes | Yes | Yes | ||
| Pseudo R2 | 0.004 | 0.019 | 0.082 | |||
| R-squared | 0.013 | 0.029 | 0.115 | |||
| N | 16,890 | |||||
| Variables | IV−2 SLS | IV-Ordered Probit | IV−2 SLS |
|---|---|---|---|
| Physical Health | Physical Health | Mental Health | |
| Work value perception | 0.012 *** | 0.015 *** | −0.095 *** |
| (0.002) | (0.003) | (0.022) | |
| Gender | 0.083 *** | 0.103 *** | −1.471 *** |
| (0.018) | (0.022) | (0.171) | |
| Age | −0.022 *** | −0.027 *** | 0.024 *** |
| (0.001) | (0.001) | (0.006) | |
| Education | 0.017 *** | 0.019 *** | −0.156 *** |
| (0.002) | (0.003) | (0.020) | |
| Marital status | 0.065 *** | 0.065 ** | −1.019 *** |
| (0.021) | (0.026) | (0.212) | |
| Religion | −0.036 | −0.040 | 1.033 *** |
| (0.023) | (0.027) | (0.214) | |
| Income | 0.043 *** | 0.049 *** | −0.213 *** |
| (0.007) | (0.008) | (0.070) | |
| Smoking | 0.029 | 0.037 | 0.078 |
| (0.019) | (0.023) | (0.176) | |
| Drinking | 0.058 *** | 0.065 *** | 0.040 |
| (0.019) | (0.023) | (0.170) | |
| Exercise | 0.029 * | 0.035* | −0.191 |
| (0.016) | (0.019) | (0.146) | |
| Life satisfaction | 0.218 *** | 0.264 *** | −2.462 *** |
| (0.008) | (0.010) | (0.088) | |
| Region | Yes | Yes | Yes |
| atanhrho_12 | −0.020 * | ||
| (0.010) | |||
| R-squared | 0.202 | 0.115 | |
| N | 16,890 | ||
| Variables | (1) | (2) | (3) | (4) | (5) | (6) |
|---|---|---|---|---|---|---|
| Economic value perception | 0.285 *** | |||||
| (0.047) | ||||||
| Emotional value perception | 0.091 *** | |||||
| (0.015) | ||||||
| Social value perception | 0.079 *** | |||||
| (0.013) | ||||||
| Respect value perception | 0.079 *** | |||||
| (0.013) | ||||||
| Ability value perception | 0.078 *** | |||||
| (0.013) | ||||||
| Interest value perception | 0.077 *** | |||||
| (0.013) | ||||||
| Gender | 0.091 *** | 0.107 *** | 0.103 *** | 0.106 *** | 0.102 *** | 0.101 *** |
| (0.022) | (0.022) | (0.022) | (0.022) | (0.022) | (0.022) | |
| Age | −0.027 *** | −0.027 *** | −0.026 *** | −0.026 *** | −0.027 *** | −0.027 *** |
| (0.001) | (0.001) | (0.001) | (0.001) | (0.001) | (0.001) | |
| Education | 0.023 *** | 0.020 *** | 0.019 *** | 0.018 *** | 0.019 *** | 0.019 *** |
| (0.003) | (0.003) | (0.003) | (0.003) | (0.003) | (0.003) | |
| Marital status | 0.027 | 0.063 ** | 0.067 ** | 0.066 ** | 0.068 ** | 0.069 *** |
| (0.027) | (0.026) | (0.026) | (0.026) | (0.026) | (0.026) | |
| Religion | −0.027 | −0.037 | −0.041 | −0.040 | −0.042 | −0.042 |
| (0.027) | (0.027) | (0.027) | (0.027) | (0.027) | (0.027) | |
| Income | 0.050 *** | 0.051 *** | 0.047 *** | 0.048 *** | 0.048 *** | 0.048 *** |
| (0.008) | (0.008) | (0.009) | (0.008) | (0.008) | (0.008) | |
| Smoking | 0.024 | 0.039 | 0.035 | 0.037 | 0.037 | 0.039* |
| (0.024) | (0.023) | (0.023) | (0.023) | (0.023) | (0.023) | |
| Drinking | 0.078 *** | 0.064 *** | 0.067 *** | 0.063 *** | 0.064 *** | 0.063 *** |
| (0.023) | (0.023) | (0.023) | (0.023) | (0.023) | (0.023) | |
| Exercise | 0.063 *** | 0.037* | 0.031 | 0.033 * | 0.034 * | 0.033 * |
| (0.019) | (0.019) | (0.019) | (0.019) | (0.019) | (0.019) | |
| Life satisfaction | 0.270 *** | 0.264 *** | 0.265 *** | 0.263 *** | 0.261 *** | 0.260 *** |
| (0.010) | (0.010) | (0.010) | (0.010) | (0.010) | (0.010) | |
| Region | Yes | Yes | Yes | Yes | Yes | Yes |
| atanhrho_12 | −0.237 *** | −0.066 *** | −0.047 *** | −0.047 *** | −0.034 *** | −0.035 *** |
| (0.038) | (0.014) | (0.013) | (0.012) | (0.013) | (0.013) | |
| N | 16,890 | |||||
| Variables | (1) | (2) | (3) | (4) | (5) | (6) |
|---|---|---|---|---|---|---|
| Economic value perception | −1.824 *** | |||||
| (0.422) | ||||||
| Emotional value perception | −0.566 *** | |||||
| (0.130) | ||||||
| Social value perception | −0.489 *** | |||||
| (0.112) | ||||||
| Respect value perception | −0.492 *** | |||||
| (0.113) | ||||||
| Ability value perception | −0.488 *** | |||||
| (0.112) | ||||||
| Interest value perception | −0.482 *** | |||||
| (0.111) | ||||||
| Gender | −1.413 *** | −1.494 *** | −1.471 *** | −1.487 *** | −1.460 *** | −1.459 *** |
| (0.174) | (0.171) | (0.171) | (0.171) | (0.171) | (0.171) | |
| Age | 0.032 *** | 0.025 *** | 0.021 *** | 0.023 *** | 0.025 *** | 0.024 *** |
| (0.006) | (0.006) | (0.006) | (0.006) | (0.006) | (0.006) | |
| Education | −0.186 *** | −0.161 *** | −0.152 *** | −0.151 *** | −0.153 *** | −0.155 *** |
| (0.021) | (0.020) | (0.020) | (0.021) | (0.020) | (0.020) | |
| Marital status | −0.790 *** | −1.011 *** | −1.031 *** | −1.025 *** | −1.040 *** | −1.047 *** |
| (0.221) | (0.212) | (0.212) | (0.212) | (0.212) | (0.212) | |
| Religion | 0.953 *** | 1.015 *** | 1.040 *** | 1.033 *** | 1.047 *** | 1.048 *** |
| (0.218) | (0.215) | (0.215) | (0.215) | (0.215) | (0.215) | |
| Income | −0.231 *** | −0.230 *** | −0.203 *** | −0.210 *** | −0.210 *** | −0.208 *** |
| (0.071) | (0.070) | (0.071) | (0.070) | (0.070) | (0.071) | |
| Smoking | 0.156 | 0.066 | 0.087 | 0.077 | 0.074 | 0.063 |
| (0.179) | (0.176) | (0.176) | (0.176) | (0.176) | (0.176) | |
| Drinking | −0.054 | 0.046 | 0.029 | 0.050 | 0.046 | 0.053 |
| (0.173) | (0.171) | (0.171) | (0.171) | (0.170) | (0.171) | |
| Exercise | −0.376 ** | −0.203 | −0.167 | −0.178 | −0.183 | −0.175 |
| (0.152) | (0.146) | (0.147) | (0.146) | (0.146) | (0.146) | |
| Life satisfaction | −2.551 *** | −2.468 *** | −2.471 *** | −2.461 *** | −2.449 *** | −2.444 *** |
| (0.088) | (0.088) | (0.088) | (0.089) | (0.089) | (0.090) | |
| Region | Yes | Yes | Yes | Yes | Yes | Yes |
| R-squared | 0.093 | 0.112 | 0.113 | 0.114 | 0.114 | 0.114 |
| N | 16,890 | |||||
| Variables | Gender Groups | Marital Status Groups | Religious Belief Groups | |||
|---|---|---|---|---|---|---|
| Male | Female | Married | Unmarried | Religious | Nonreligious | |
| Work value perception | 0.016 *** | 0.014 *** | 0.015 *** | 0.019 ** | 0.028 *** | 0.012 *** |
| (0.004) | (0.004) | (0.003) | (0.008) | (0.008) | (0.003) | |
| Age | −0.024 *** | −0.028 *** | 0.089 *** | 0.210 *** | 0.122 ** | 0.097 *** |
| (0.001) | (0.001) | (0.024) | (0.059) | (0.061) | (0.024) | |
| Education | 0.013 *** | 0.023 *** | −0.027 *** | −0.027 *** | −0.024 *** | −0.027 *** |
| (0.004) | (0.003) | (0.001) | (0.002) | (0.002) | (0.001) | |
| Marital status | −0.043 | 0.159 *** | 0.019 *** | 0.029 *** | 0.016 ** | 0.020 *** |
| (0.037) | (0.039) | (0.003) | (0.007) | (0.007) | (0.003) | |
| Religion | 0.039 | −0.097 *** | −0.027 | −0.119 | 0.145* | 0.052 * |
| (0.042) | (0.036) | (0.029) | (0.076) | (0.075) | (0.028) | |
| Income | 0.082 *** | 0.027 ** | 0.050 *** | 0.039 * | 0.029 | 0.049 *** |
| (0.013) | (0.012) | (0.009) | (0.023) | (0.024) | (0.009) | |
| Smoking | 0.046 * | −0.076 | 0.035 | 0.061 | 0.163** | 0.025 |
| (0.025) | (0.080) | (0.025) | (0.063) | (0.071) | (0.025) | |
| Drinking | 0.066 *** | 0.059 | 0.060 ** | 0.111 * | 0.007 | 0.074 *** |
| (0.025) | (0.059) | (0.024) | (0.063) | (0.072) | (0.024) | |
| Exercise | −0.002 | 0.076 *** | 0.035 * | 0.025 | −0.005 | 0.043** |
| (0.027) | (0.027) | (0.021) | (0.052) | (0.056) | (0.020) | |
| Life satisfaction | 0.263 *** | 0.263 *** | 0.260 *** | 0.300 *** | 0.281 *** | 0.2635 *** |
| (0.014) | (0.013) | (0.010) | (0.026) | (0.027) | (0.010) | |
| Region | Yes | Yes | Yes | Yes | Yes | Yes |
| atanhrho_12 | 0.820 *** | −0.027 * | −0.019 * | −0.037 | −0.113 *** | −0.006 |
| (0.008) | (0.014) | (0.011) | (0.030) | (0.030) | (0.011) | |
| N | 8473 | 8417 | 14,768 | 2122 | 2146 | 14,744 |
| Variables | Gender Groups | Marital Status Groups | Religious Belief Groups | |||
|---|---|---|---|---|---|---|
| Male | Female | Married | Unmarried | Religious | Nonreligious | |
| Work value perception | −0.118 *** | −0.073 ** | −0.091 *** | −0.1220 * | −0.256 *** | −0.070 *** |
| (0.029) | (0.032) | (0.023) | (0.063) | (0.065) | (0.023) | |
| Age | 0.015 * | 0.030 *** | −1.504 *** | −1.565 *** | −2.139 *** | −1.374 *** |
| (0.008) | (0.009) | (0.186) | (0.458) | (0.477) | (0.184) | |
| Education | −0.107 *** | −0.181 *** | 0.026 *** | 0.006 | 0.024 | 0.023 *** |
| (0.030) | (0.028) | (0.007) | (0.014) | (0.016) | (0.006) | |
| Marital status | −0.506 * | −1.509 *** | −0.147 *** | −0.272 *** | −0.145 ** | −0.160 *** |
| (0.278) | (0.331) | (0.022) | (0.062) | (0.059) | (0.022) | |
| Religion | 0.315 | 1.618 *** | 0.881 *** | 2.226 *** | −2.243 *** | −0.831 *** |
| (0.300) | (0.302) | (0.226) | (0.650) | (0.630) | (0.225) | |
| Income | −0.337 *** | −0.142 | −0.220 *** | −0.180 | −0.039 | −0.234 *** |
| (0.093) | (0.104) | (0.077) | (0.178) | (0.190) | (0.076) | |
| Smoking | 0.133 | 1.030 | 0.252 | −1.038 ** | −0.820 * | 0.174 |
| (0.180) | (0.704) | (0.191) | (0.452) | (0.490) | (0.187) | |
| Drinking | −0.184 | 1.052 ** | 0.061 | −0.069 | 0.593 | −0.044 |
| (0.180) | (0.487) | (0.182) | (0.480) | (0.473) | (0.182) | |
| Exercise | 0.226 | −0.642 *** | −0.240 | 0.073 | −0.309 | −0.176 |
| (0.201) | (0.213) | (0.158) | (0.385) | (0.414) | (0.156) | |
| Life satisfaction | −1.983 *** | −2.941 *** | −2.399 *** | −2.852 *** | −2.639 *** | −2.446 *** |
| (0.118) | (0.130) | (0.096) | (0.225) | (0.249) | (0.094) | |
| Region | Yes | Yes | Yes | Yes | Yes | Yes |
| R-squared | 0.084 | 0.138 | 0.110 | 0.166 | 0.161 | 0.110 |
| N | 8473 | 8417 | 14,768 | 2122 | 2146 | 14,744 |
| Variables | (1) | (2) | (3) | (4) | (5) | (6) | (7) |
|---|---|---|---|---|---|---|---|
| Total Sample | Male | Female | Married | Unmarried | Religious | Nonreligious | |
| Indirect effect | 0.011 *** | 0.012 *** | 0.010 *** | 0.011 *** | 0.0139 *** | 0.010 *** | 0.011 *** |
| (0.001) | (0.001) | (0.001) | (0.001) | (0.002) | (0.002) | (0.001) | |
| Direct effect | 0.009 *** | 0.010 *** | 0.008 *** | 0.009 *** | 0.011 ** | 0.016 *** | 0.008 *** |
| (0.002) | (0.003) | (0.003) | (0.002) | (0.005) | (0.005) | (0.002) | |
| N | 16,890 | 8473 | 8417 | 14,768 | 2122 | 2146 | 14,744 |
| Variables | (1) | (2) | (3) | (4) | (5) | (6) | (7) |
|---|---|---|---|---|---|---|---|
| Total Sample | Male | Female | Married | Unmarried | Religious | Nonreligious | |
| Indirect effect | −0.111 *** | −0.093 *** | −0.126 *** | −0.105 *** | −0.161 *** | −0.109 *** | −0.111 *** |
| (0.006) | (0.008) | (0.010) | (0.007) | (0.021) | (0.017) | (0.006) | |
| Direct effect | −0.089 *** | −0.108 *** | −0.071 *** | −0.087 *** | −0.103 ** | −0.198 *** | −0.073 *** |
| (0.018) | (0.024) | (0.027) | (0.018) | (0.047) | (0.056) | (0.018) | |
| N | 16,890 | 8473 | 8417 | 14,768 | 2122 | 2146 | 14,744 |
Publisher’s Note: MDPI stays neutral with regard to jurisdictional claims in published maps and institutional affiliations. |
© 2021 by the authors. Licensee MDPI, Basel, Switzerland. This article is an open access article distributed under the terms and conditions of the Creative Commons Attribution (CC BY) license (https://creativecommons.org/licenses/by/4.0/).
Share and Cite
Yang, F.; Jiang, Y.; Pu, X. Impact of Work Value Perception on Workers’ Physical and Mental Health: Evidence from China. Healthcare 2021, 9, 1059. https://doi.org/10.3390/healthcare9081059
Yang F, Jiang Y, Pu X. Impact of Work Value Perception on Workers’ Physical and Mental Health: Evidence from China. Healthcare. 2021; 9(8):1059. https://doi.org/10.3390/healthcare9081059
Chicago/Turabian StyleYang, Fan, Yao Jiang, and Xiaohong Pu. 2021. "Impact of Work Value Perception on Workers’ Physical and Mental Health: Evidence from China" Healthcare 9, no. 8: 1059. https://doi.org/10.3390/healthcare9081059