
Public Perceptions of COVID-19 Vaccines: Policy Implications from US Spatiotemporal Sentiment Analytics

 ,
,  , ,
, ,  , ,
, ,  and
and
Abstract
:1. Introduction
2. Related Work
2.1. COVID-19 Vaccine on Social Media
2.2. COVID-19 Vaccine Hesitancy
2.3. COVID-19 Vaccine Acceptance
3. Methods
- Qualitative synthesis of vaccine tweets to illustrate the common public sentiment scenarios;
- Statistical analysis to validate the significance of the change in sentiment from February to March of 2021 as an extension of the original PSS framework; and
- Contrast of findings from the analysis of the Twitter data collected for this study with secondary data, namely CDC and HPS data. CDC data are used for geographical state-wise mapping of vaccination rates while HPS data are used to examine the alignment of sentiment towards vaccines.
3.1. Data Acquisition and Preparation
3.2. Sentiment Analysis Methods
3.3. Word and Phrase Associations
3.4. Geo-Tagged Analytics
4. Results and Discussion
4.1. Insights from PSS
Scenario Analysis: 3 Significant Scenarios
- (a)
- Scenario 1: Positive public sentiment is dominant in February and in March 2021. Given this scenario, selected on the basis of descriptive analytics, we observe strong positive sentiment towards the vaccine. Illustrative tweets include celebratory posts, such as: “@PurelyNumbers Yay for vaccine!... ”; “@sprizee Happy birthday and congrats on the vaccine!”; “2nd dose ready. #vaccine #Happy”; “got a pfizer vaccine lined up for 4:20p on the afternoon before my birthday, nice nice nice nice”; “I love getting on Twitter / Instagram and seeing another friend, loved, or/and mutual receiving their vaccine. Just makes me so insanely happy" and "Got the vaccine! So thankful for God’s protection all around me!”.These posts demonstrate positive public perceptions based on high levels of confidence that vast segments of the population have in vaccines. There is also a strong positive public perception on the operations and delivery of the vaccines: “Super shout out to everyone at the Moorestown Mall COVID-19 vaccine mega site. Unbelievably efficient & well run....really impressive...”; “Today I got my second dose of the Pfizer COVID-19 vaccine. Kudos to the Vermont National Guard for a job well done: well organized, smooth, courteous.”; “Best ‘day-date’ ever with @john_r_ratliff Our 1st vaccine dose is DONE. Thank you @UofLHealth for the massive undertaking, exceptional organization, and seamless process. #pfizercovid19vacccine #SeeYouIn3Weeks” and “Got my first COVID vaccine this morning administered by @NashvilleHealth. They are doing a phenomenal job with the logistics of rolling this out to our city. Everyone was friendly, helpful and efficient. Big thanks and kudos to all involved!!”.These posts demonstrate public sentiment being driven by the vaccines and by their smooth delivery. An important takeaway from this for public policy is the emphasis on facilitating a comfortable and efficient vaccination process.
- (b)
- Scenario 2: Positive public sentiment decreases from early February to late March 2021. Interestingly, we saw a decrease in positive public sentiment as indicated by the change in the proportion of positive tweets from early February to late March 2021. We do not speculate on the reasons for this but, instead, attempt to identify and discuss mass perceptions to help the public policy discourse.Skepticism, both reasonable and unreasonable, appears to have increased, which may have toned some proportion of positive tweets into neutral or negative territory: “@Ironman_E @cruddydre_ @Ms_Jaydee But if your vaccinated and the vaccine works, what does it matter if im vaccinated? Youre safe right? Because the vaccine works right?”; “If we’re supposed to get the vaccine to protect other people but other people are supposed to get the vaccine to protect other people, who is it actually protecting? If the vaccine is already protecting those other people how does other people getting it further protect them?"; "excited to announce that i am not 30, therefore ineligible to receive a vaccine in the state of New York” and “@7_bunnies @TwixxBar07 @courtneymilan “Experts do not know how long” I’m protected by the antibodies I’ve acquired from infection. That’s fine. They don’t know how long the vaccine will protect, either, so we’ll all learn together. Meanwhile, I’ll stick to my own immune system’s protection”.This change in sentiment, though minor, may be mitigated by a number of factors, such as a general loss of enthusiasm without a loss of confidence in the vaccines. Public policy can be quite useful in addressing such scenarios to prevent the erosion of positive public perceptions of vaccines and on the vaccination process—this can be achieved through appropriate communications and pronounced narrative development.
- (c)
- Scenario 3: Negative public sentiment increases from early February to late March 2021. Multiple sentiment scoring methods affirmed the proportional increase in negative sentiment from early February to late March 2021. This is more alarming than the minor loss of positive sentiment across the same period: a loss of positive sentiment can be attributed to a number of factors and may not necessarily reflect a loss of confidence in vaccines; however, a proportional increase in negative sentiment over time could imply eroding confidence in vaccines based on rumors or inaccurate information. There could also be statistically disproportionate emphasis on some cases of people falling ill after taking the first or both dose/s of the vaccines, or outlier events, such as deaths following vaccination.Illustrative tweets convey these concerns and negative sentiment quite effectively: “Whoa...when they say that the second vaccine might have strange side effects, the are NOT kidding.”; “Vaccine update: a day after shot one of the Pfizer vaccine I’m definitely feeling the arm pain, a headache, and kind of run down.”; “@onewiththesand Oh no. Feel better. Do you feel it is from your vaccine shot?” and “I would not have taken the vaccine if I knew it would make me sick... ”. While there is a general concern about some uneasiness, discomfort and pain post-vaccination, most people appear to accommodate that, as illustrated by many tweets along the lines of: “pretty achy and fatigued following my second vaccine dose yesterday. but still so grateful and hopeful. worth it 1000x over! #GetVaccinated ”.Perhaps, the greater challenge is posed by some factual news on statistical outliers augmented by rumors of people being severely affected by vaccinations or even dying from the vaccine. This is illustrated by the deeply negative sentiment in some of the vaccine tweets in March of 2021: “@cruddydre_ My uncle got the vaccine and died a week or 2 later. I’m good bro yal can have that vaccine.”; “@DanMac2014 @Kayla_Grey @pfizer Wish one could request your vaccine, @moderna was a monster. Haveing had COVID recovered in 3 days with light fever/aches. Vaccine-1st dose F’d me up-5x worse then VID did. I wanted to crawl under a rock & die the past 3 days. Not sure I’ll go for 2nd...”; “Mom don’t be a cry baby. It doesn’t help that I have a sister that tried to have her not take it telling her that there’s people who died from the vaccine...I tell my mom that my sister isn’t well informed...directs mother to the daughter who has a PhD.”; “@princessnofrog Haven’t seen that yet they are not sure because it’s still in the experimental stage but there has been people that have died from the vaccine. Meaning it can be deadly” and “Maybe the vaccine will kill me since the virus didn’t”.Such expressions of fear, despair and negativity tend to spread fast through social media and personal messaging and communications. Public policy is critical in such scenarios and proactive steps are required to build public confidence. Transparency on adverse events must not be compromised—post-vaccination illnesses and the rare cases of death must continue to be documented and such information must be made publicly available.However, public policy must mandate resources for such information to be augmented and qualified by factual information truthfully highlighting the details along at least two lines of reasoning: (a) An emphasis on the rarity of extreme events such as vaccination induced deaths and (b) disassociation of vaccination as the cause of deaths after vaccination, where applicable, and clarity on the identified or potential causes of death.
4.2. Word Frequency and N-Gram Analysis
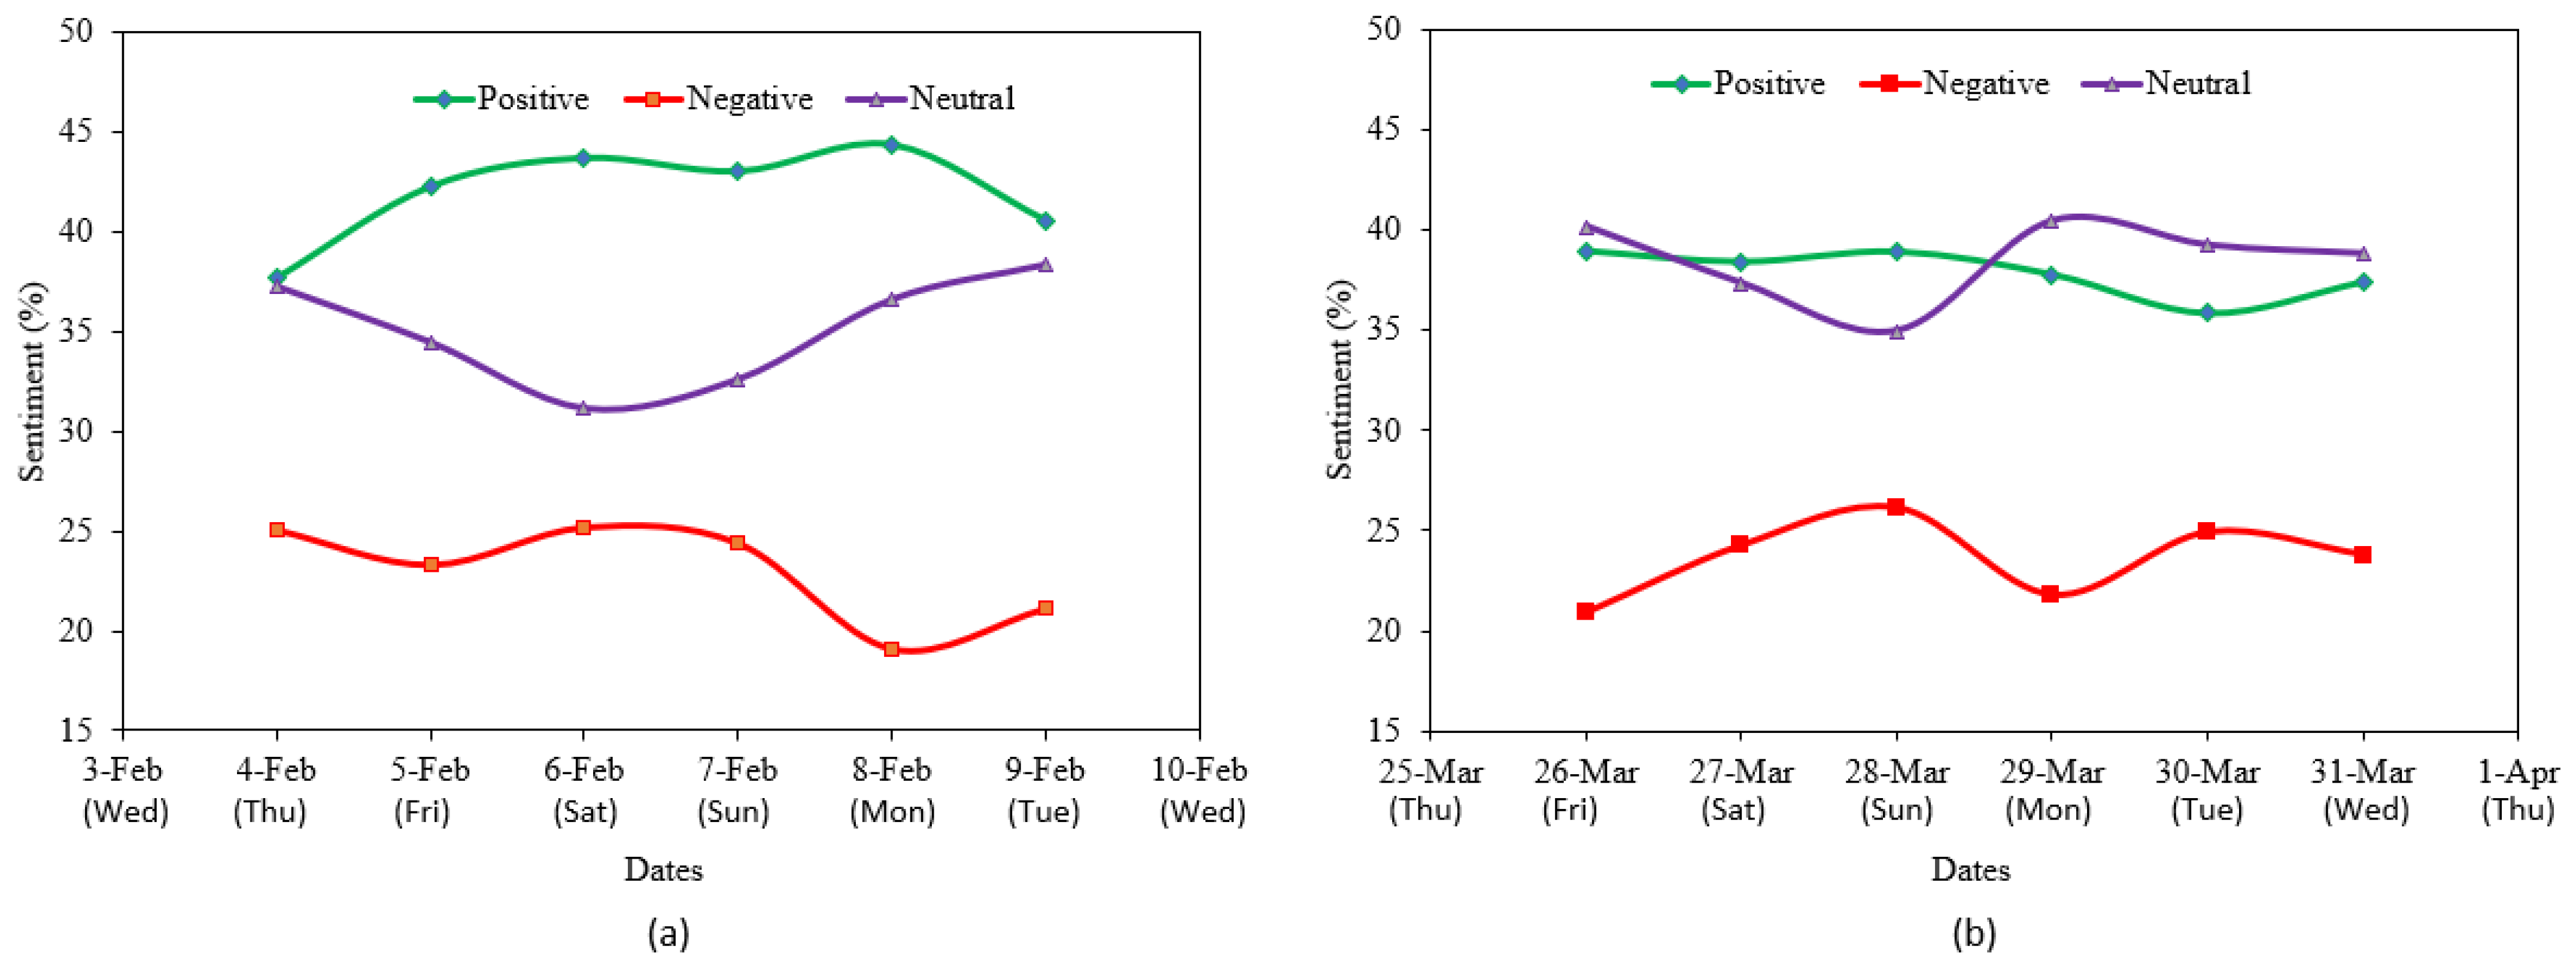
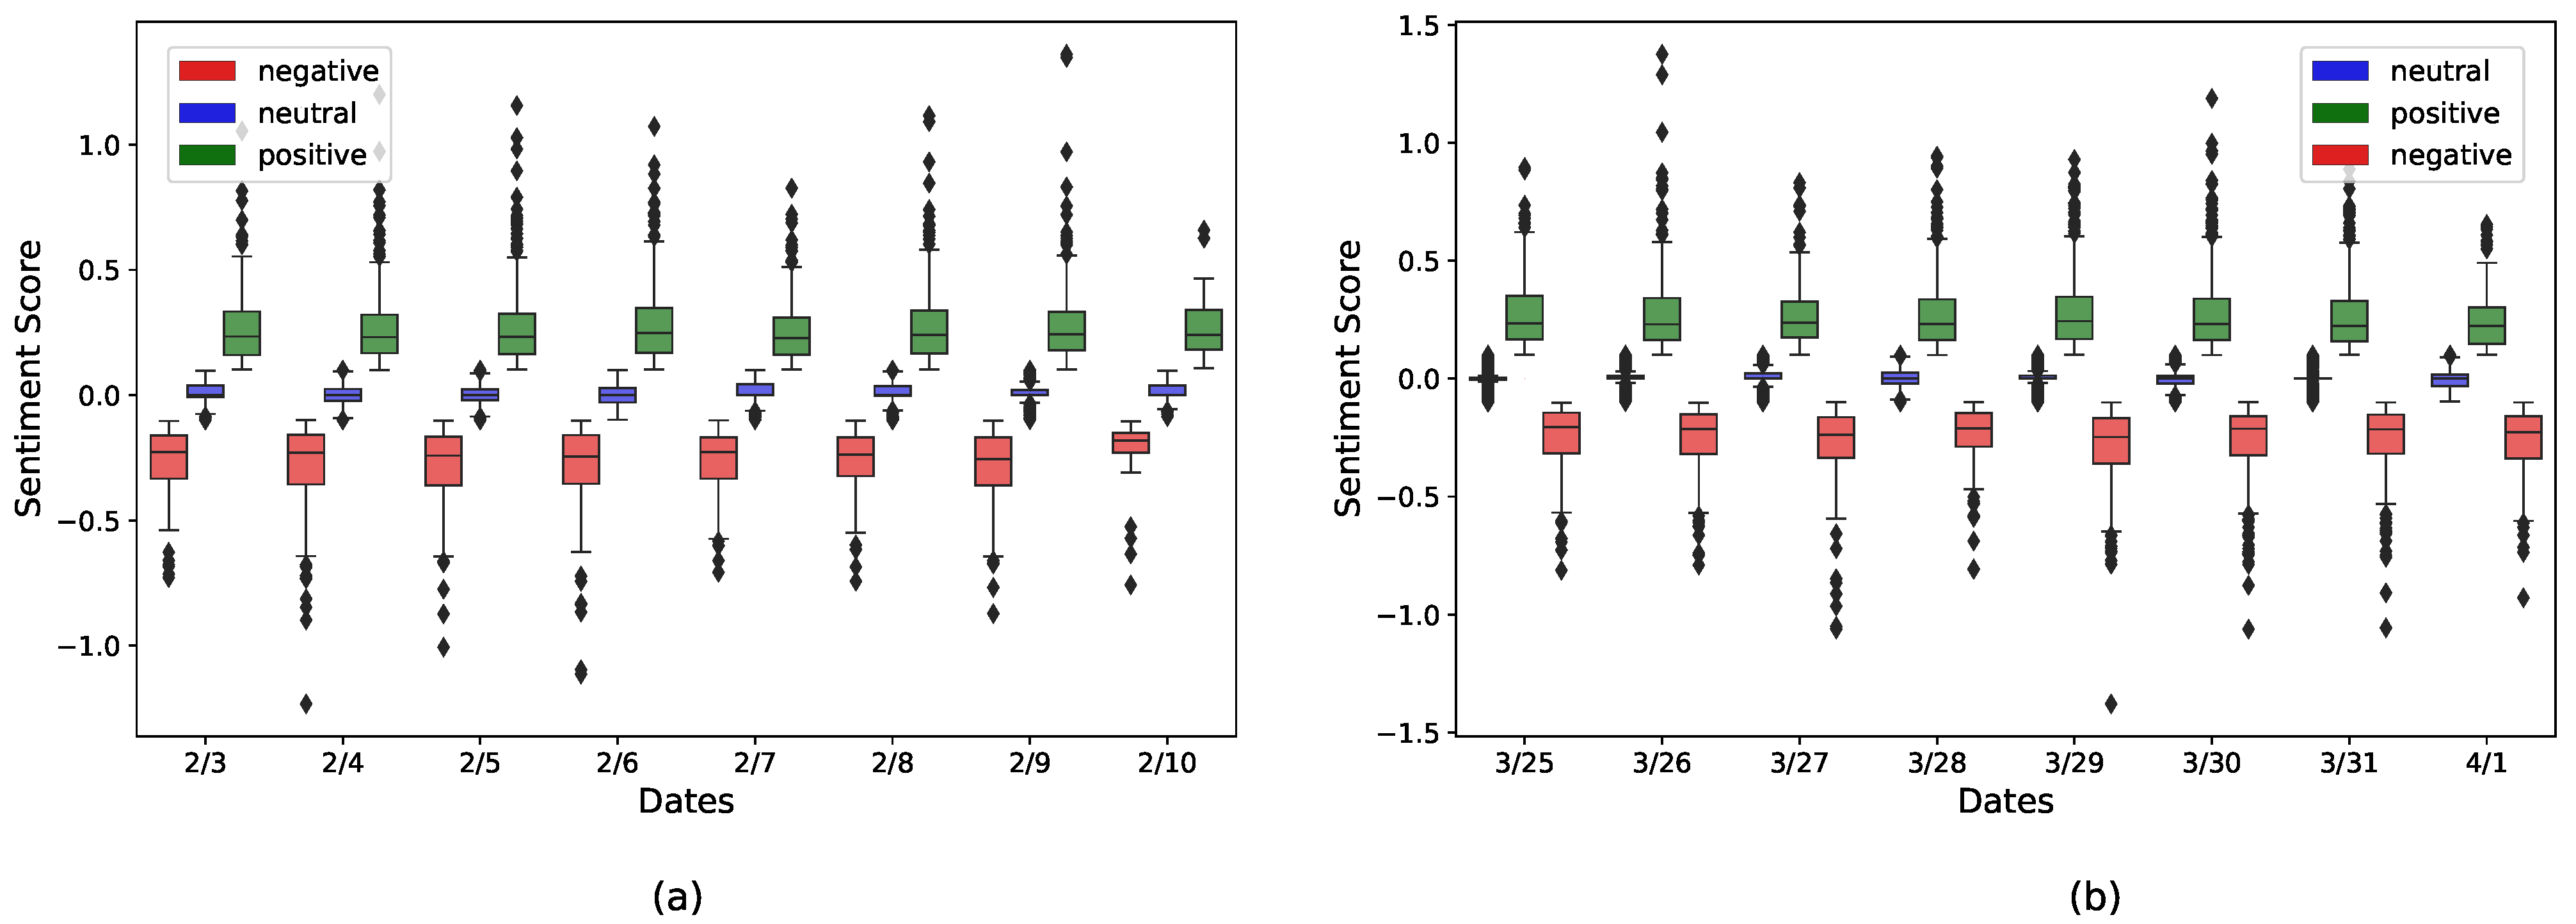
4.3. Temporal Changes in Public Sentiments
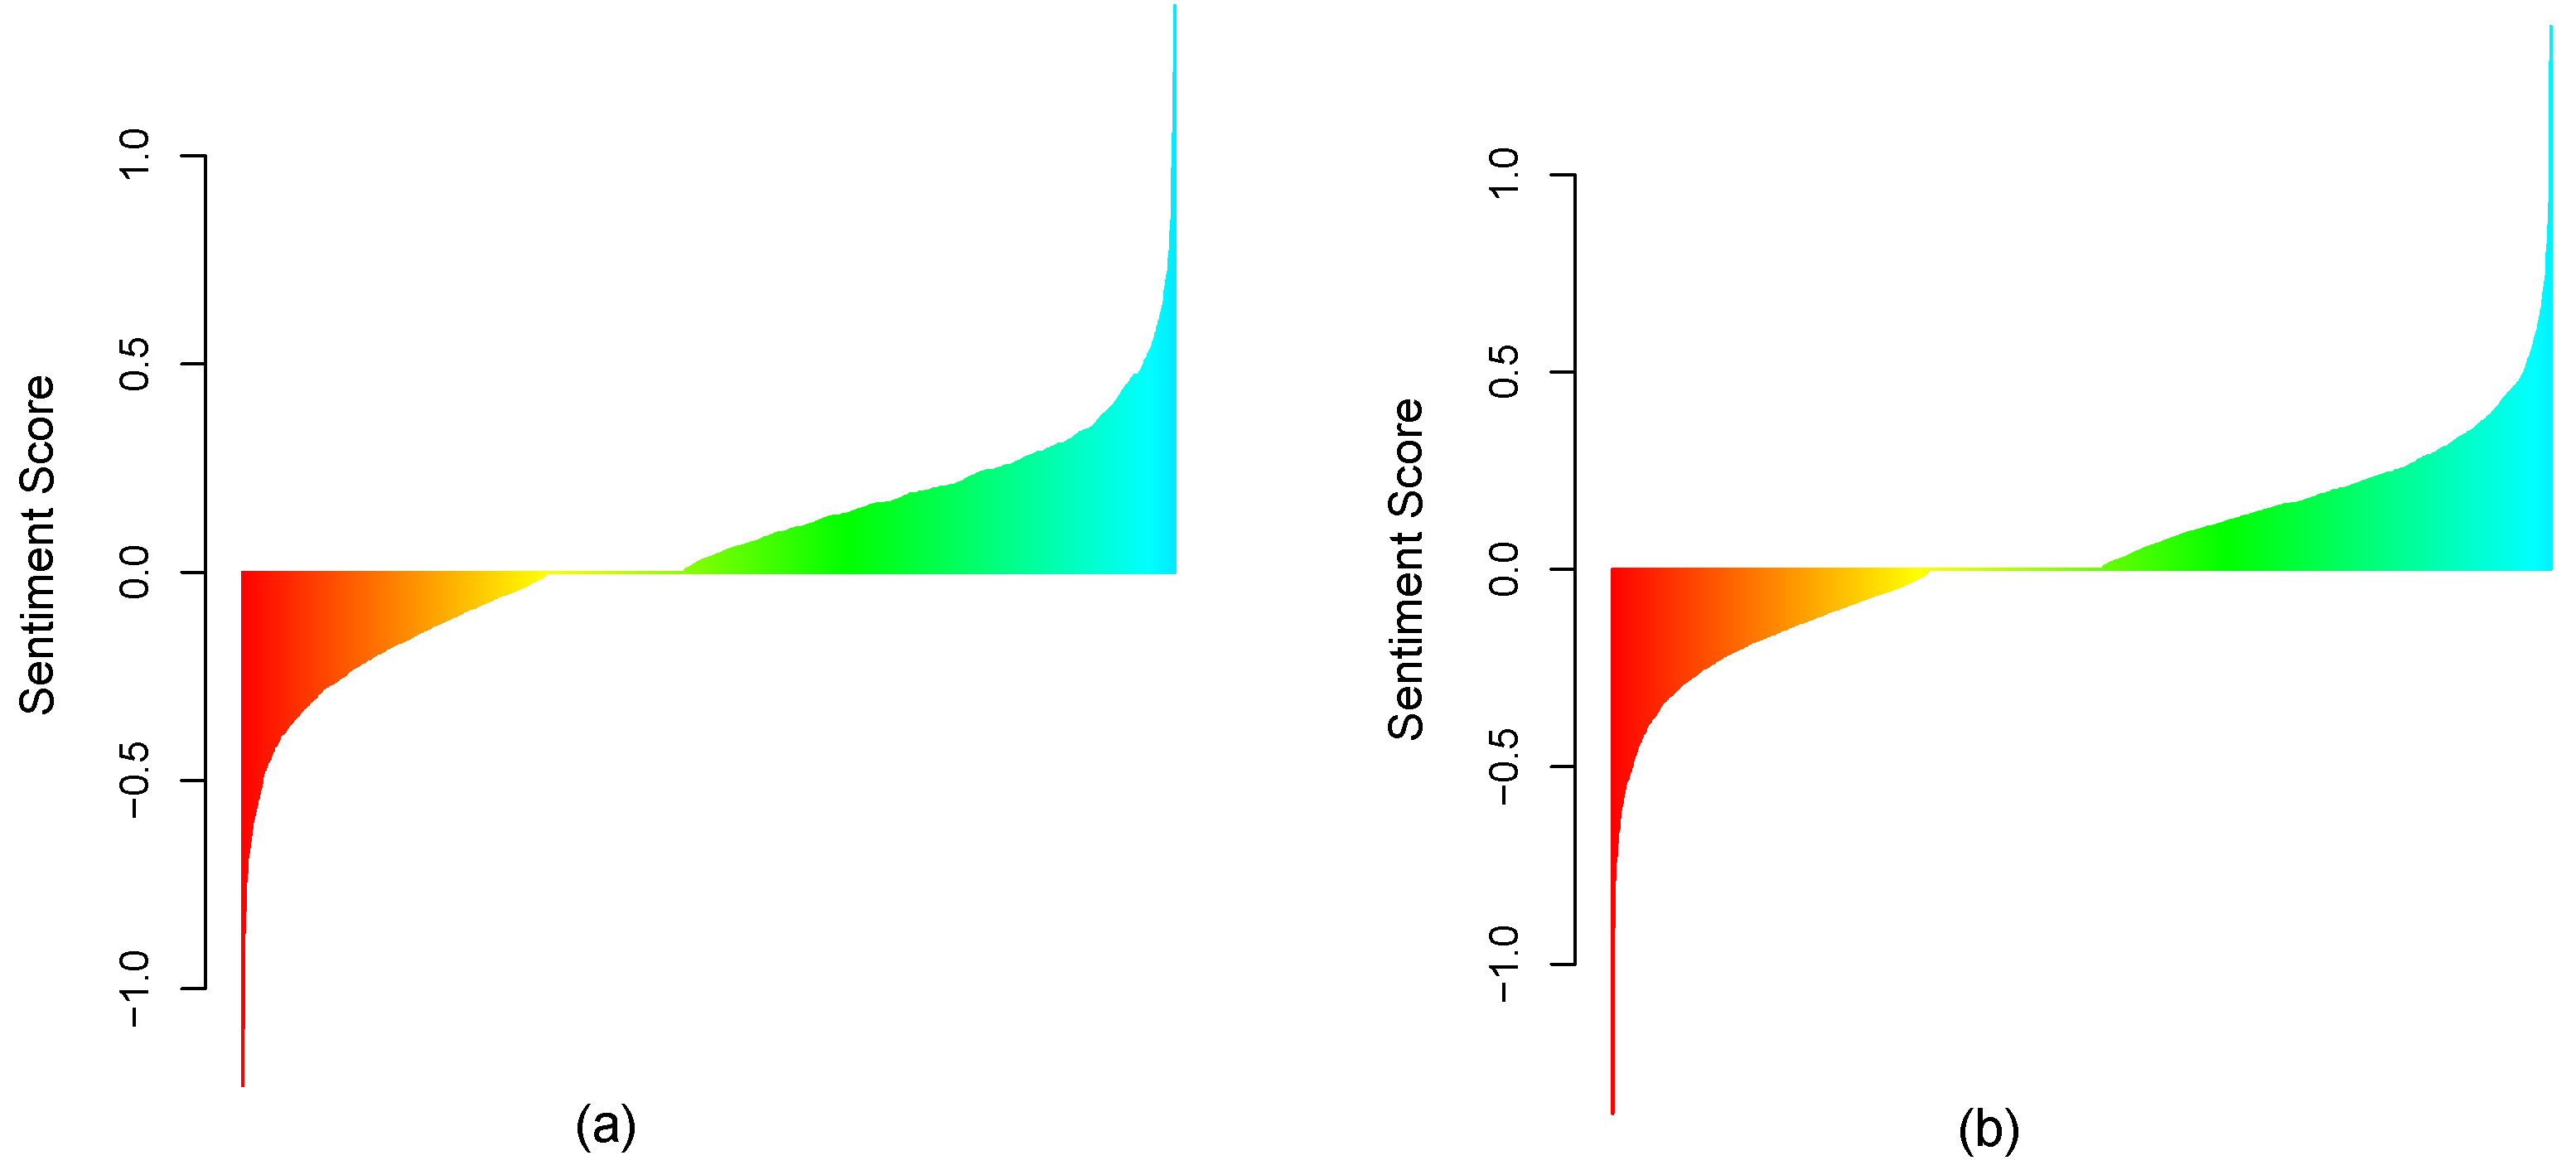
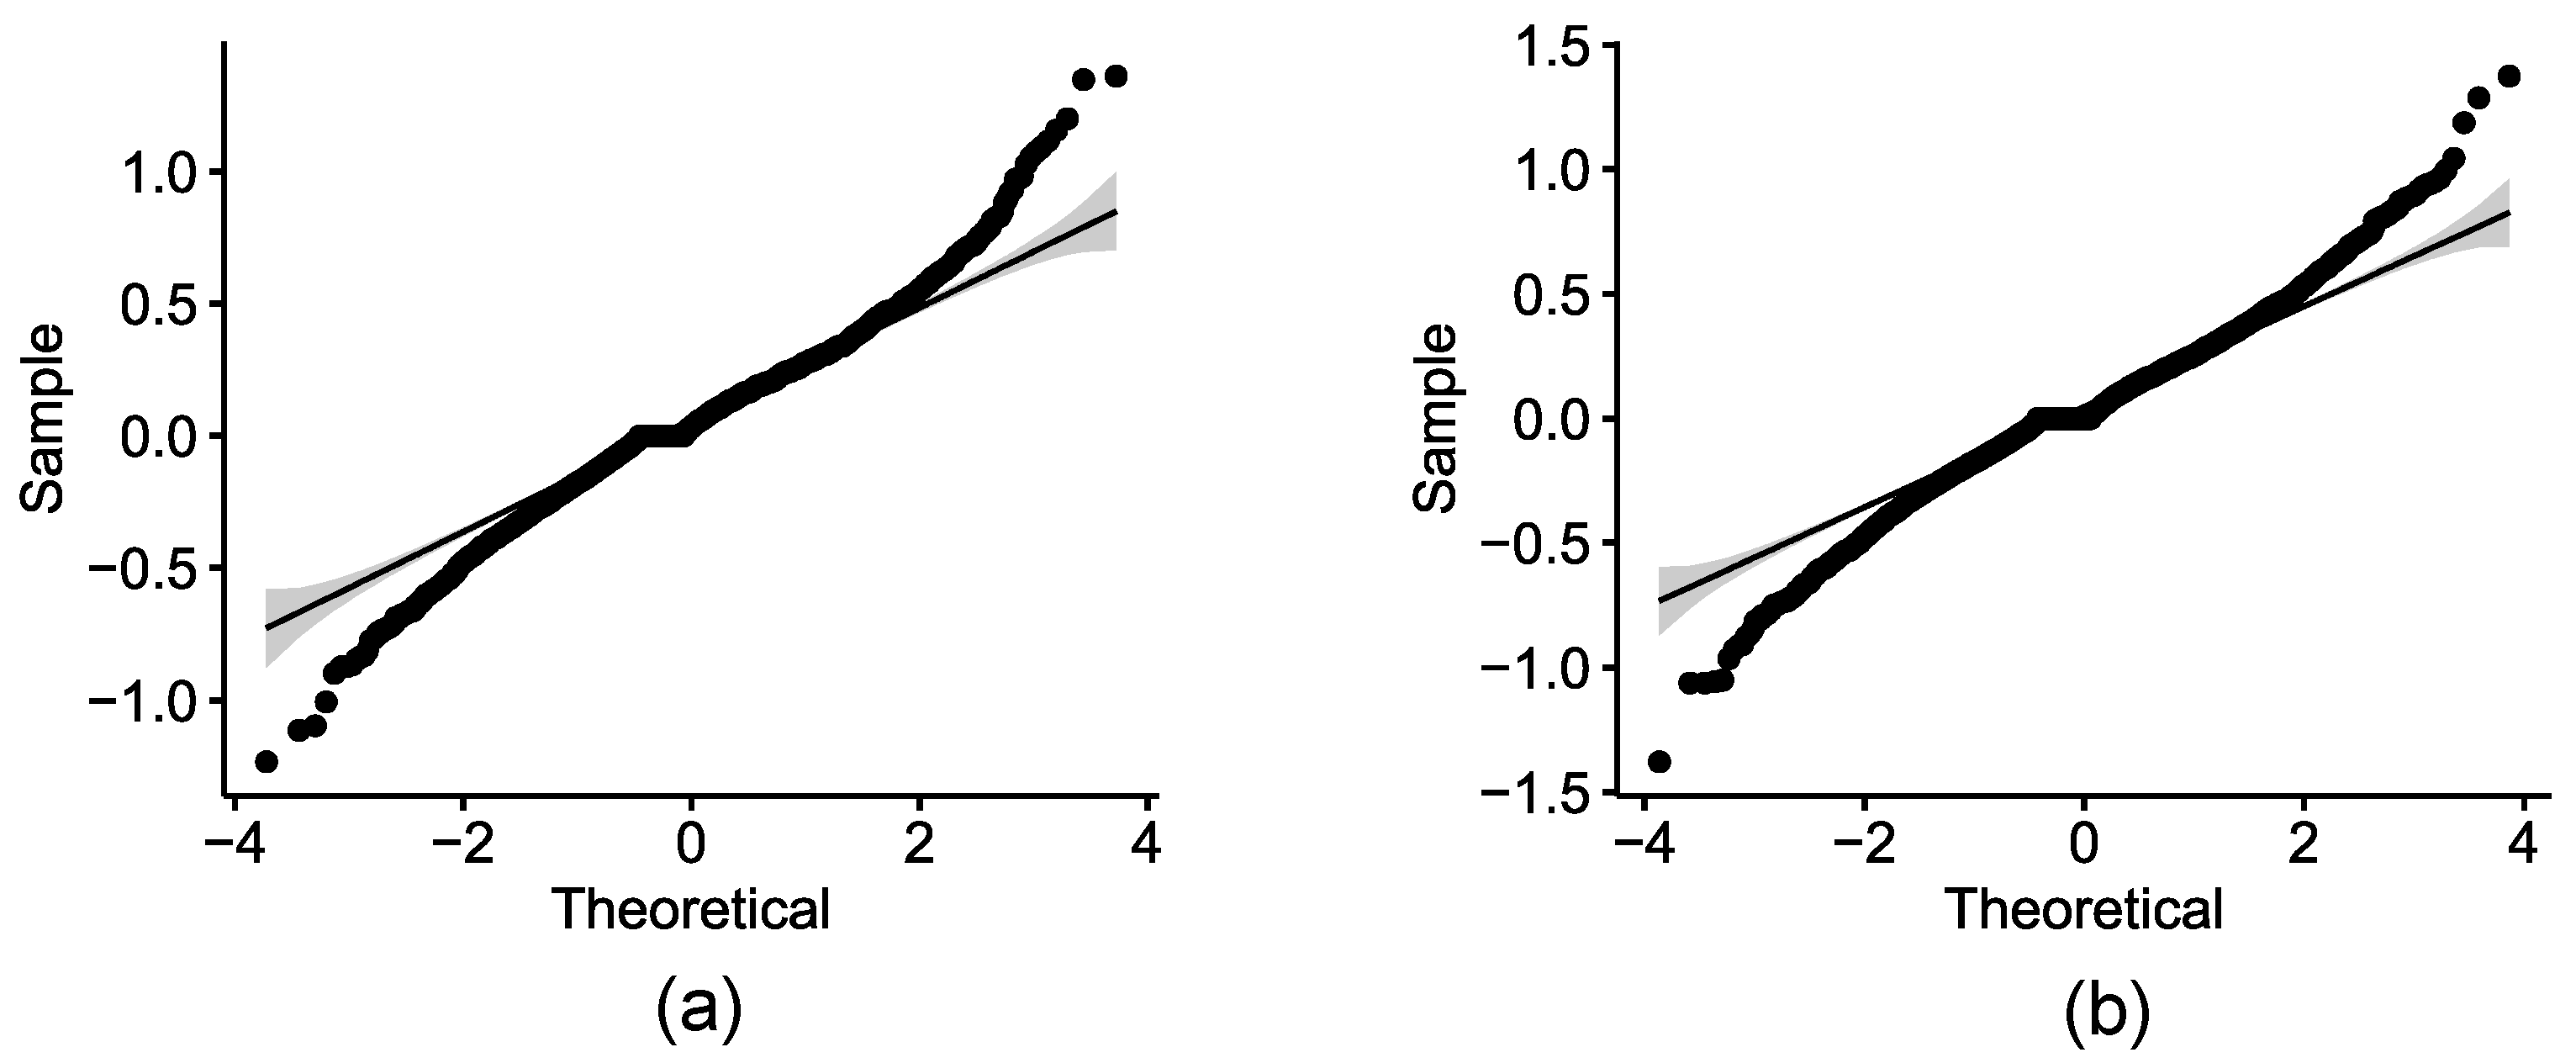
4.4. Statistical Analysis of Sentiment Values
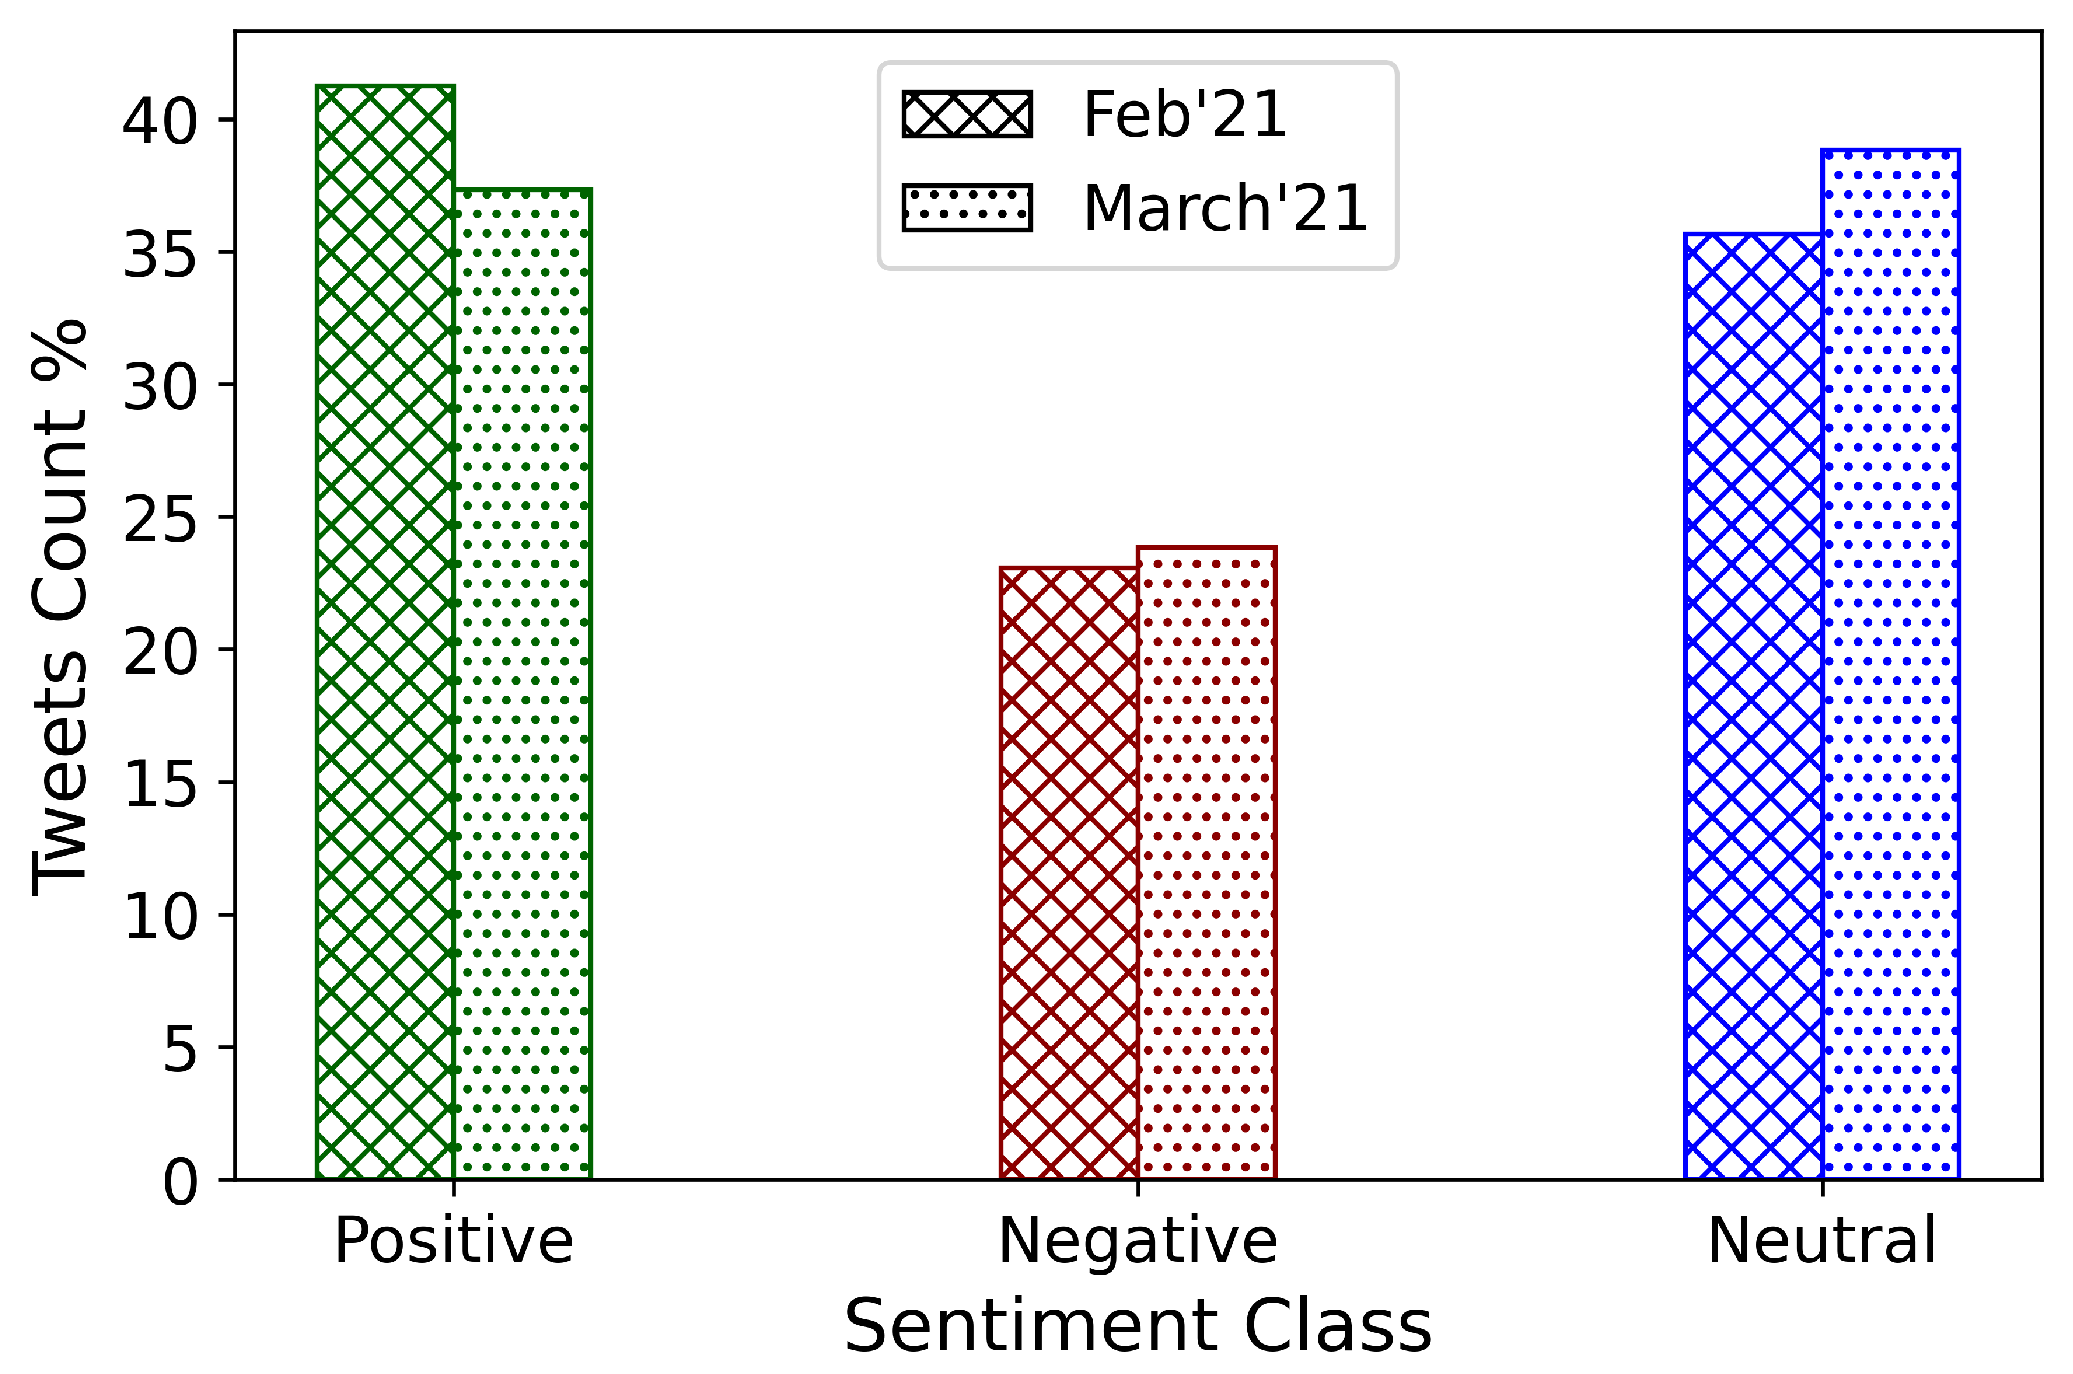
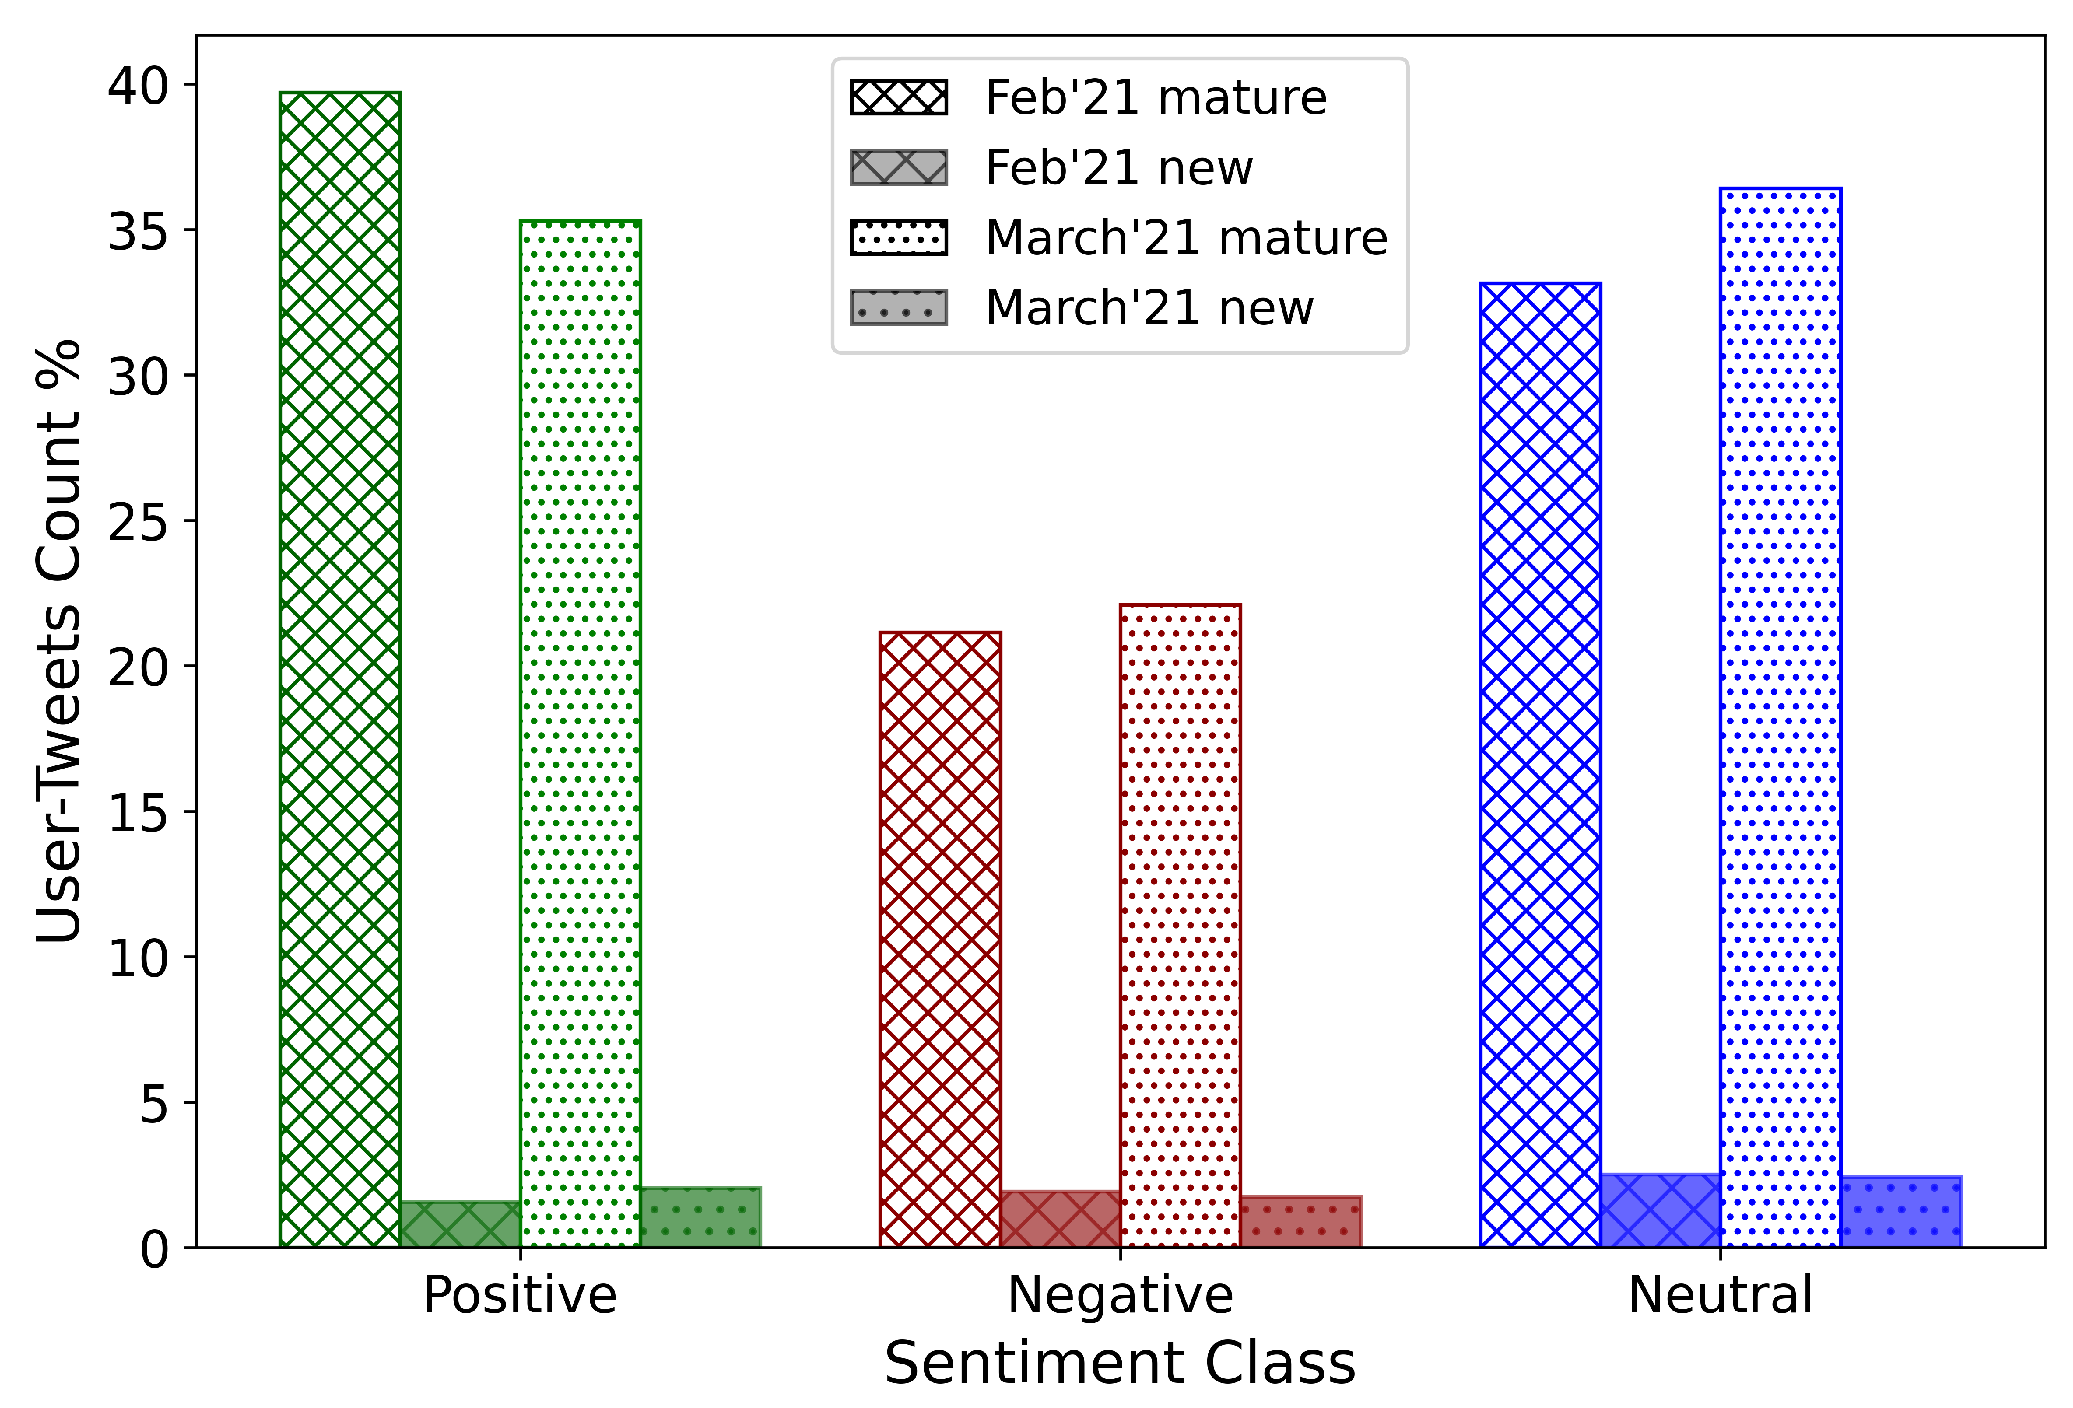
4.4.1. Dominant Positive Sentiment for February and March 2021
4.4.2. February-March: Lower Positivity and Higher Negativity
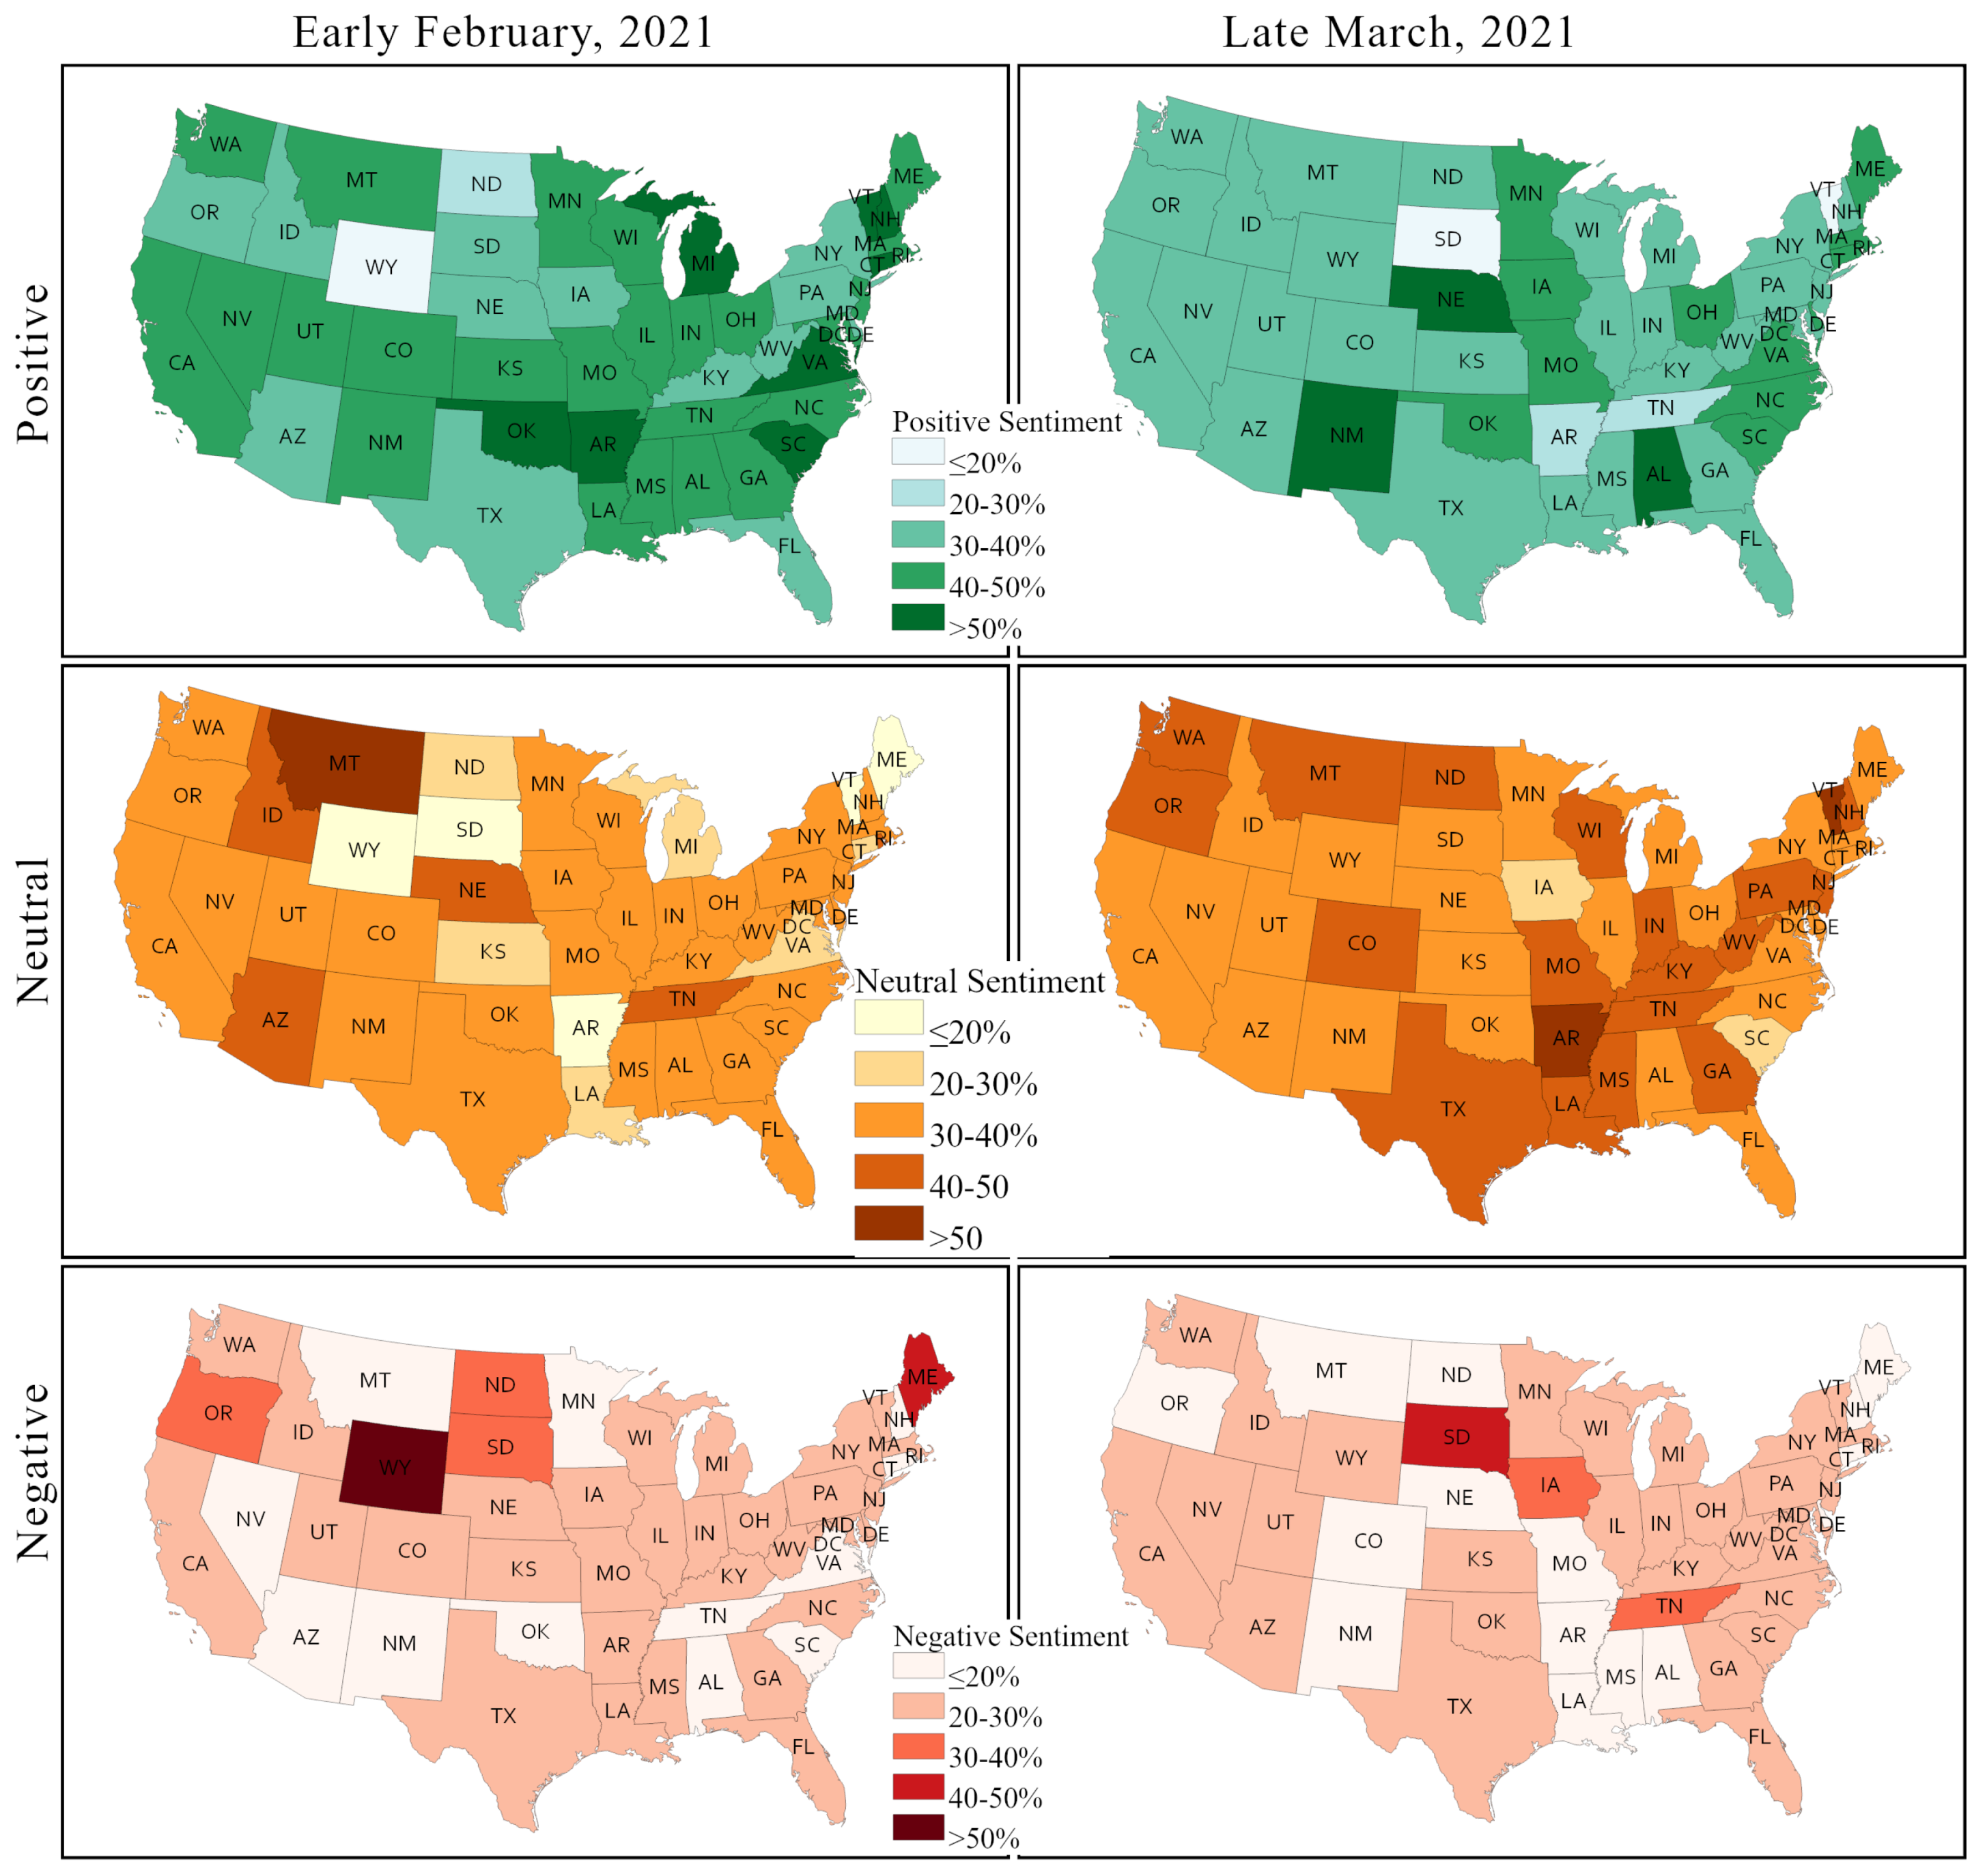
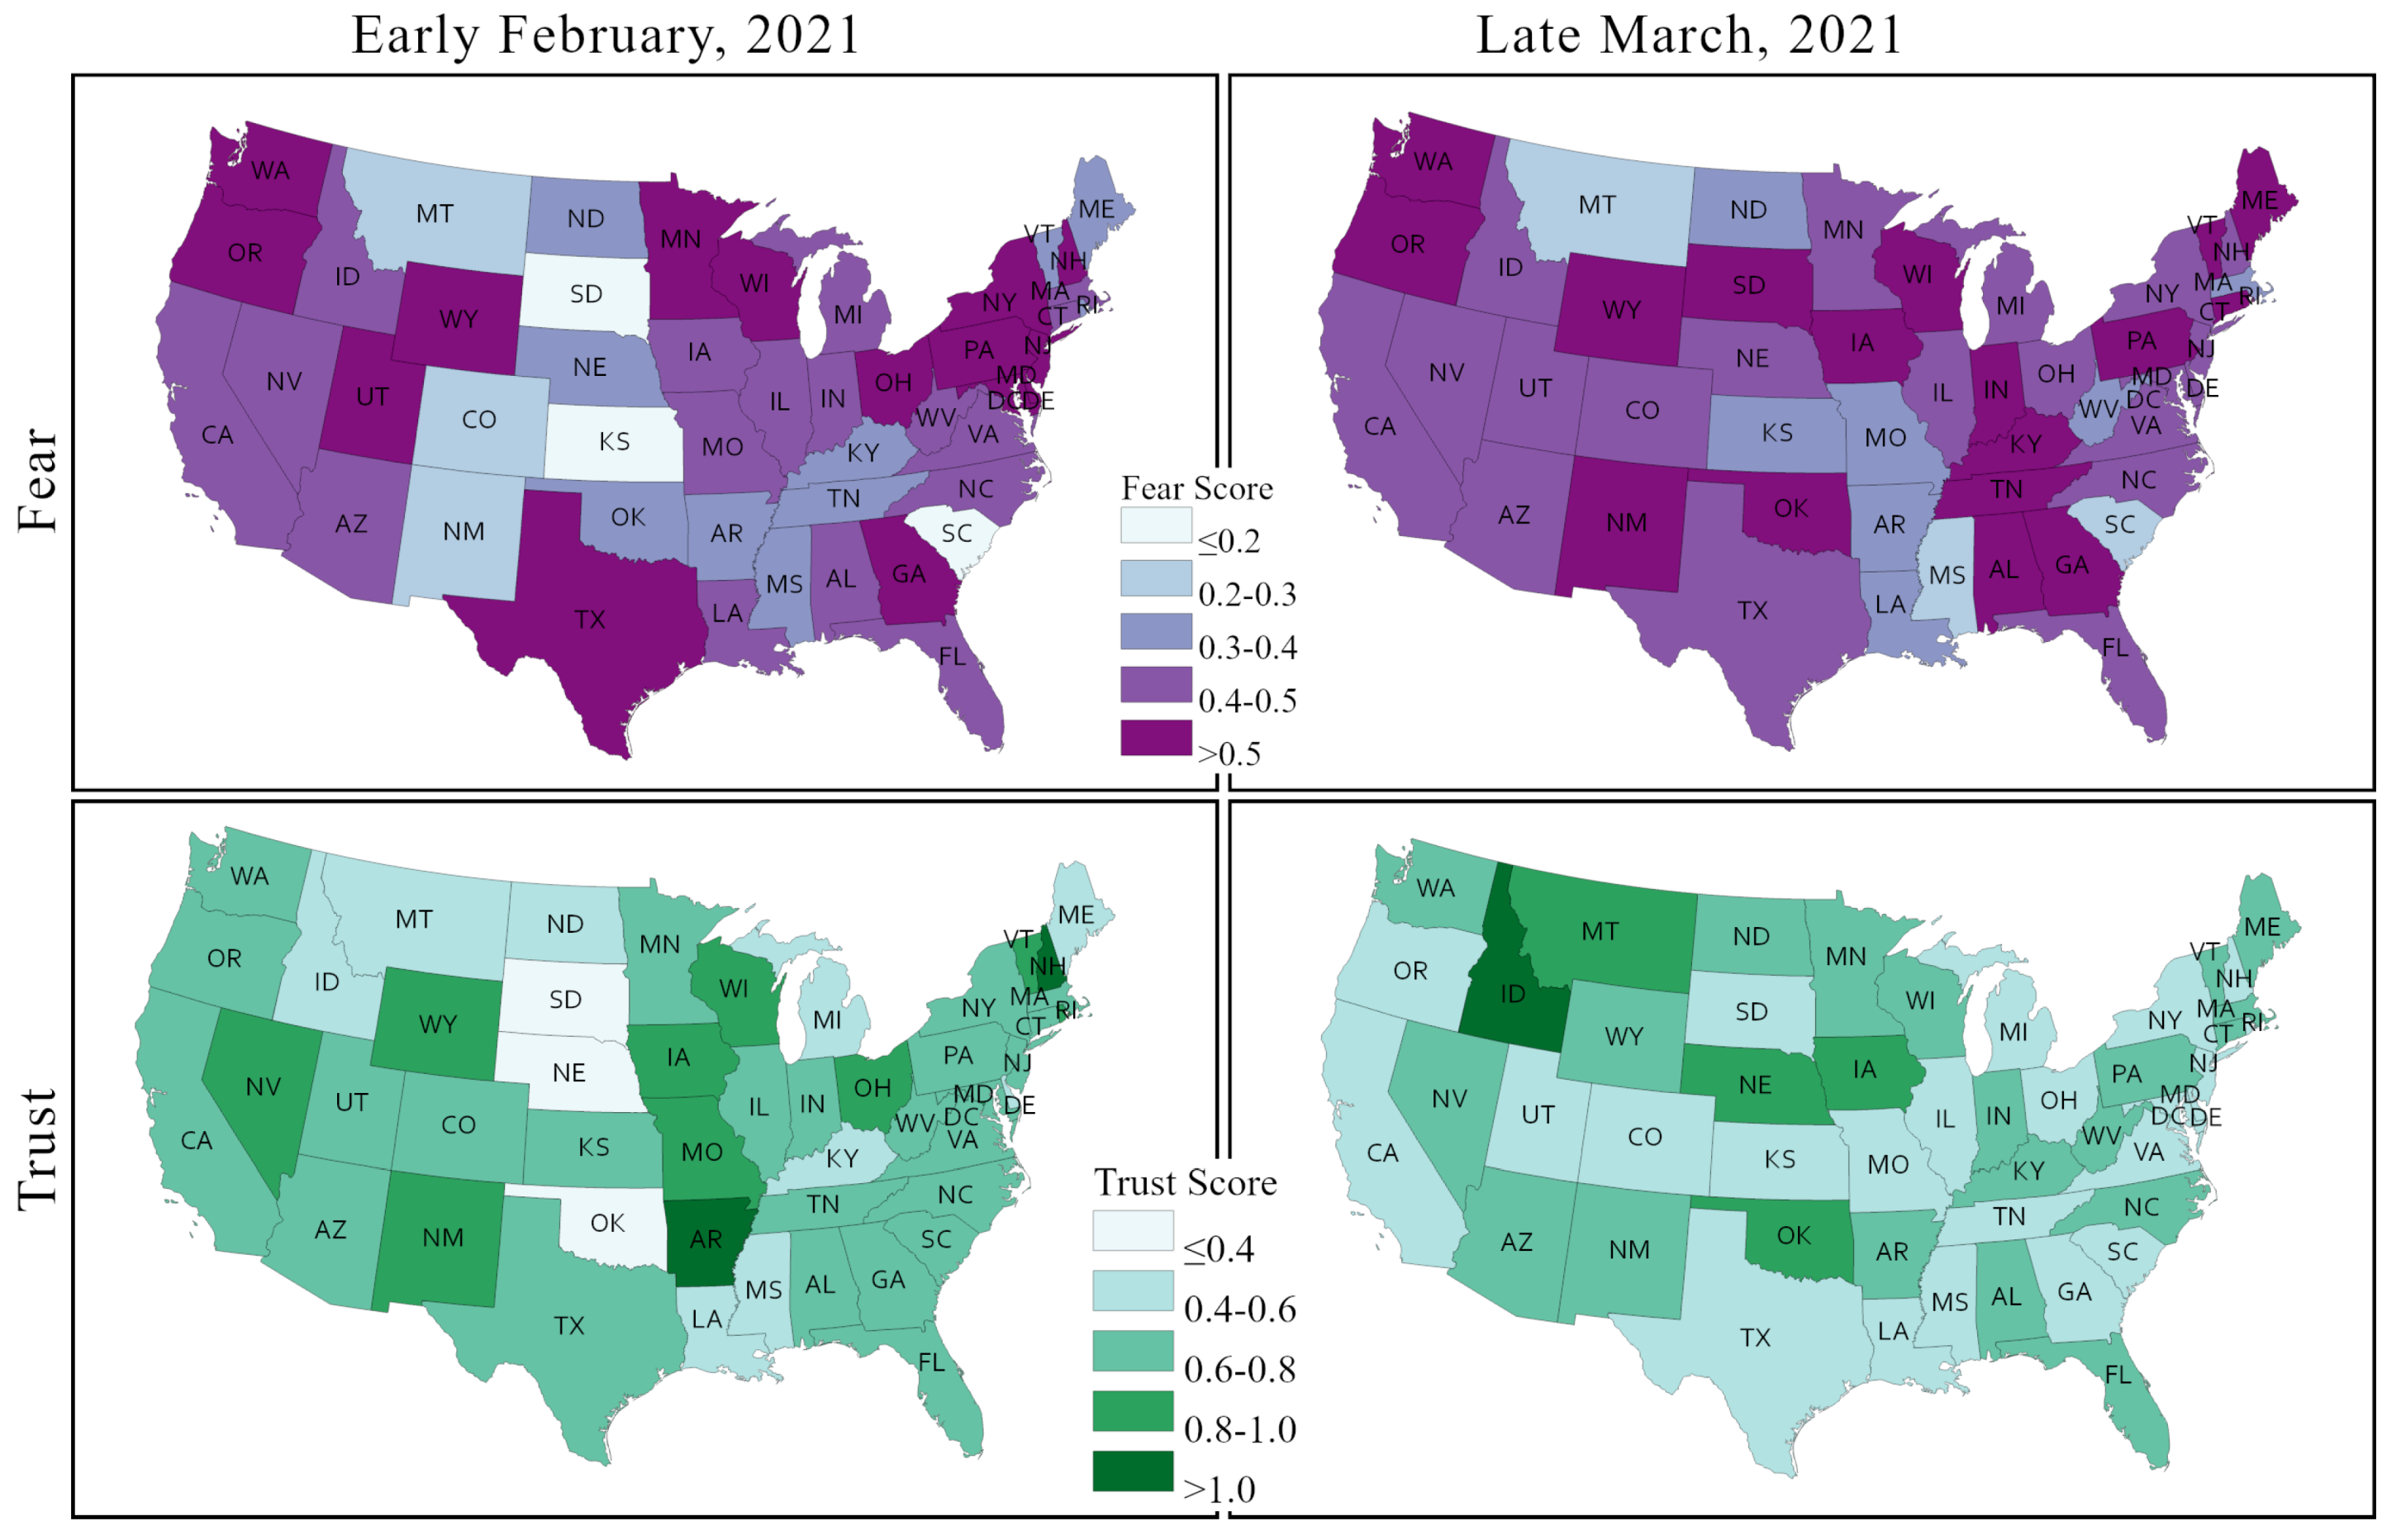
4.5. State-Wise Sentiment Analysis in the US
4.6. Discussion
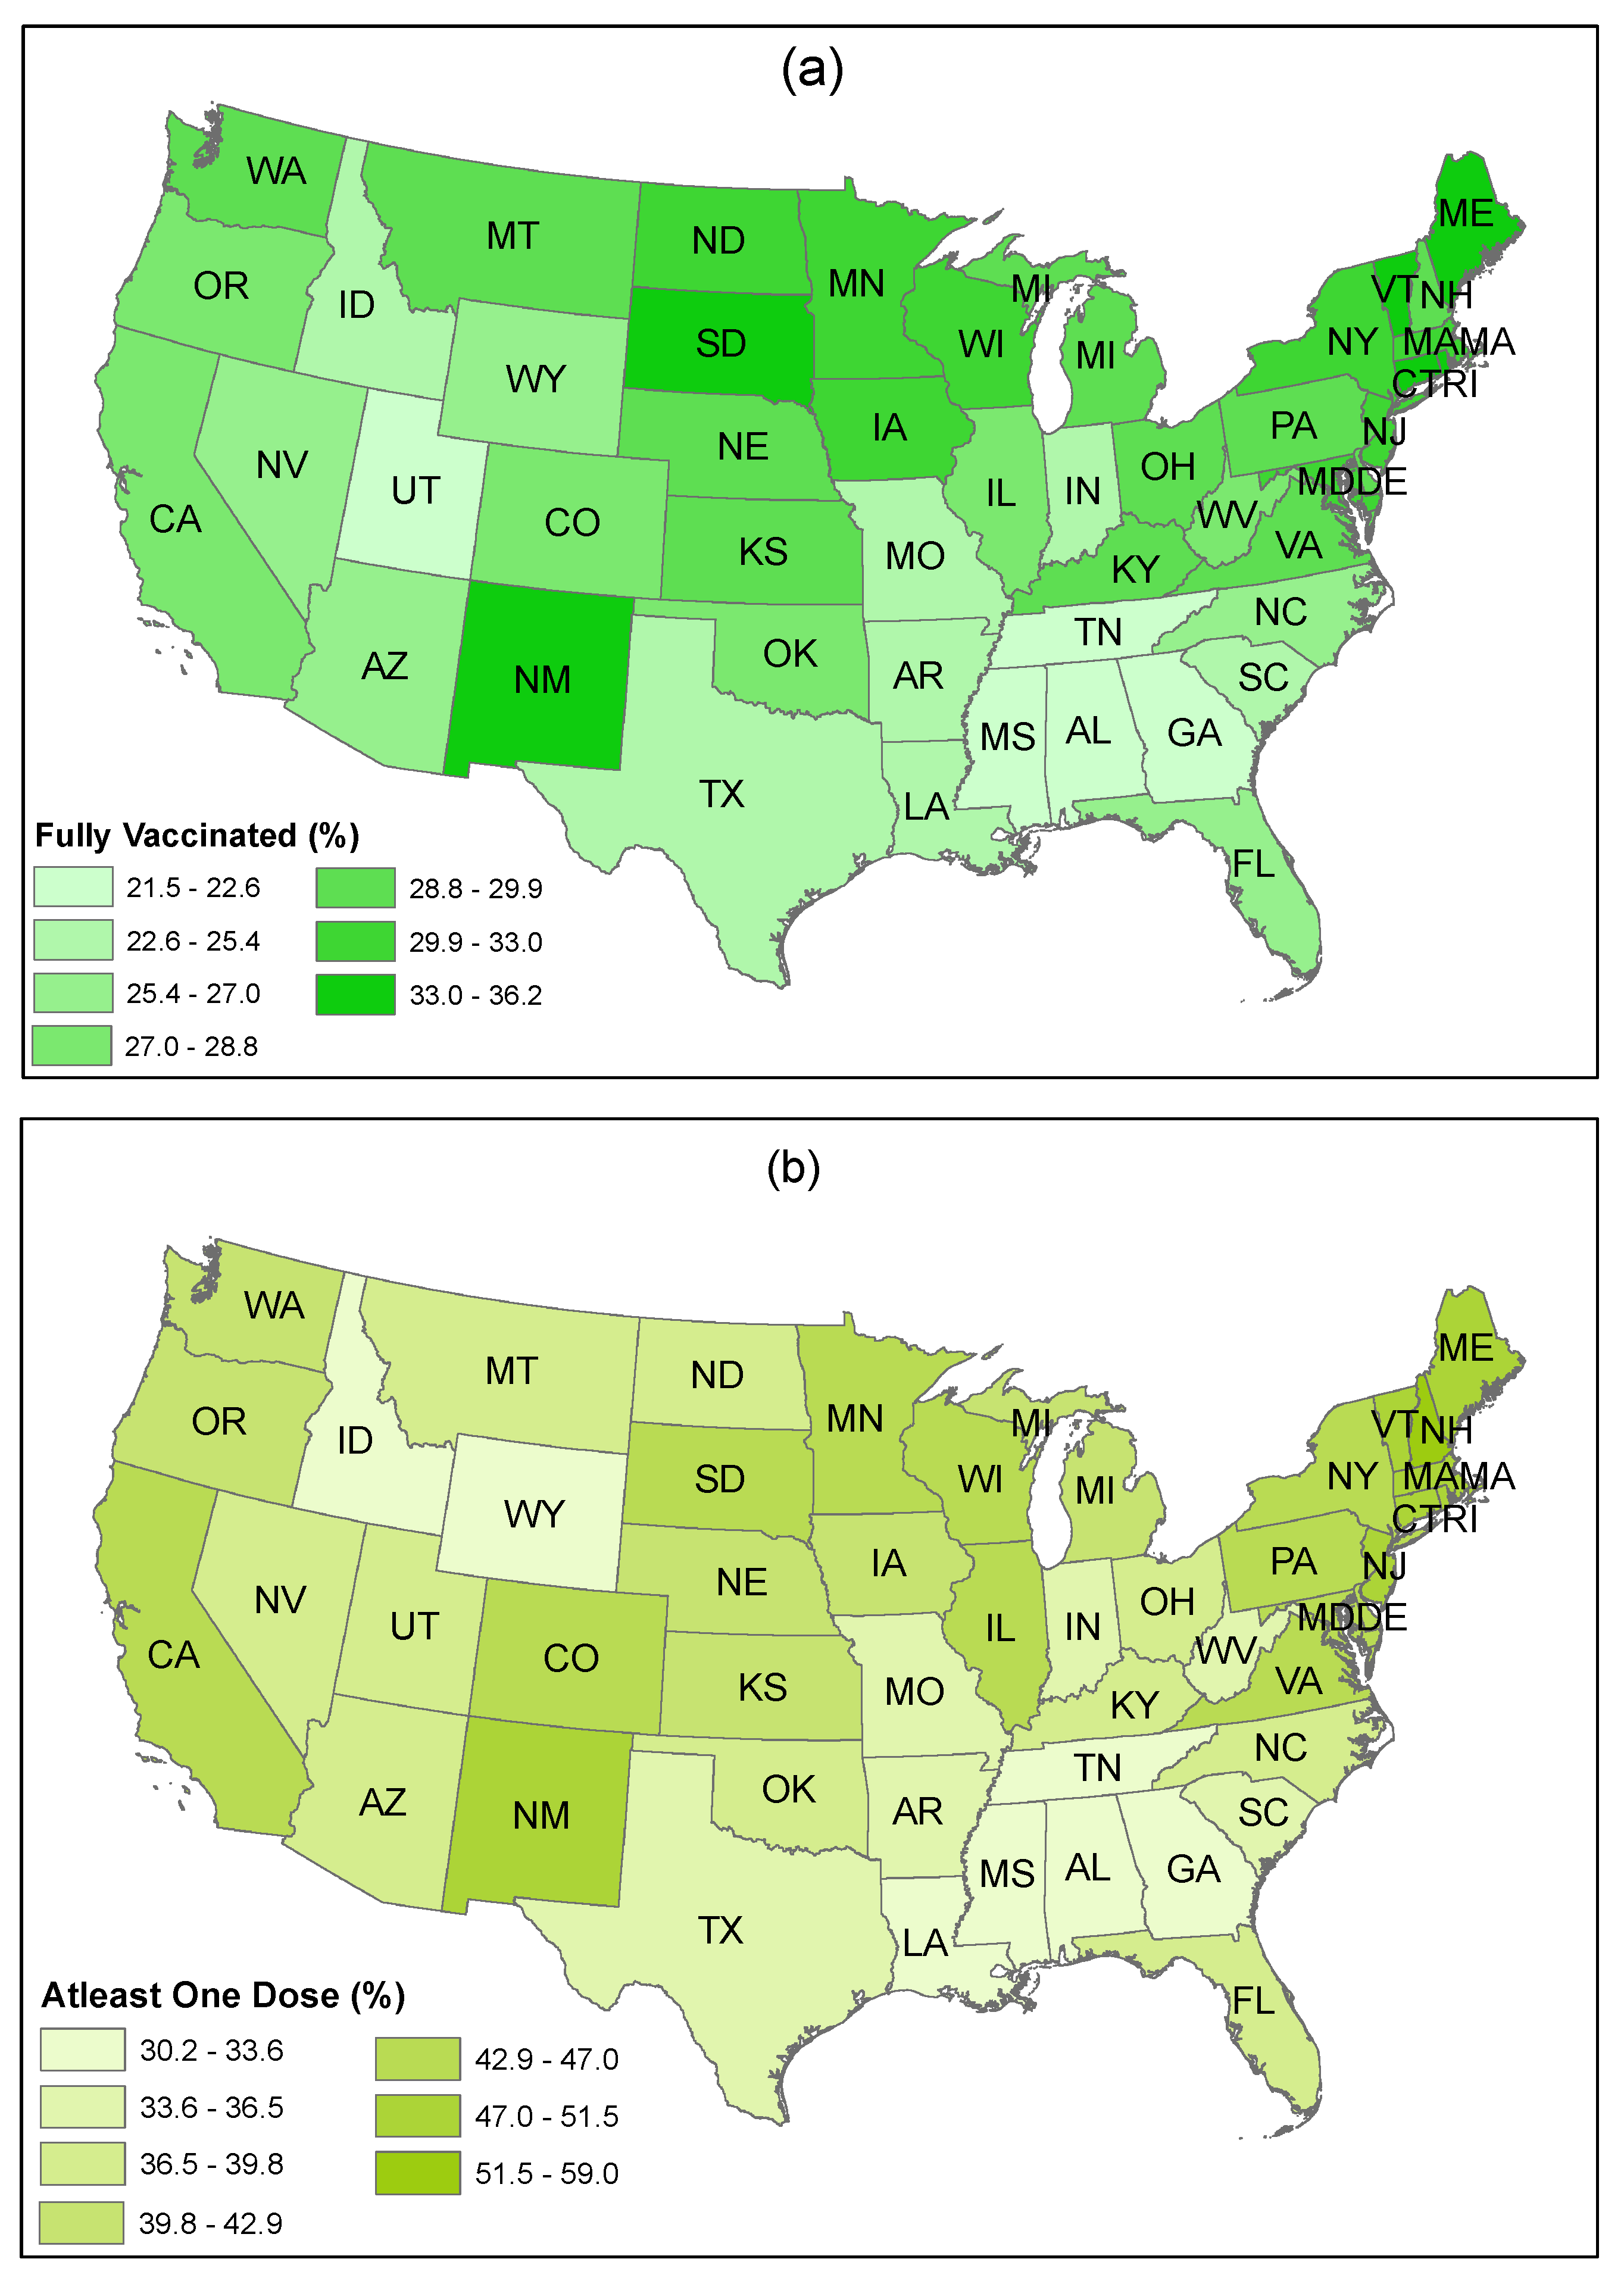
- Sentiments towards vaccination vary considerably across states and other place-based communities, like counties, and so do vaccination rates and hesitancy. We observed that less populous states and more sparsely populated states tend to have a higher vaccination rate; some of these states also have a strongly positive vaccination sentiment, but some also exhibit high vaccination hesitancy and less positive sentiments.
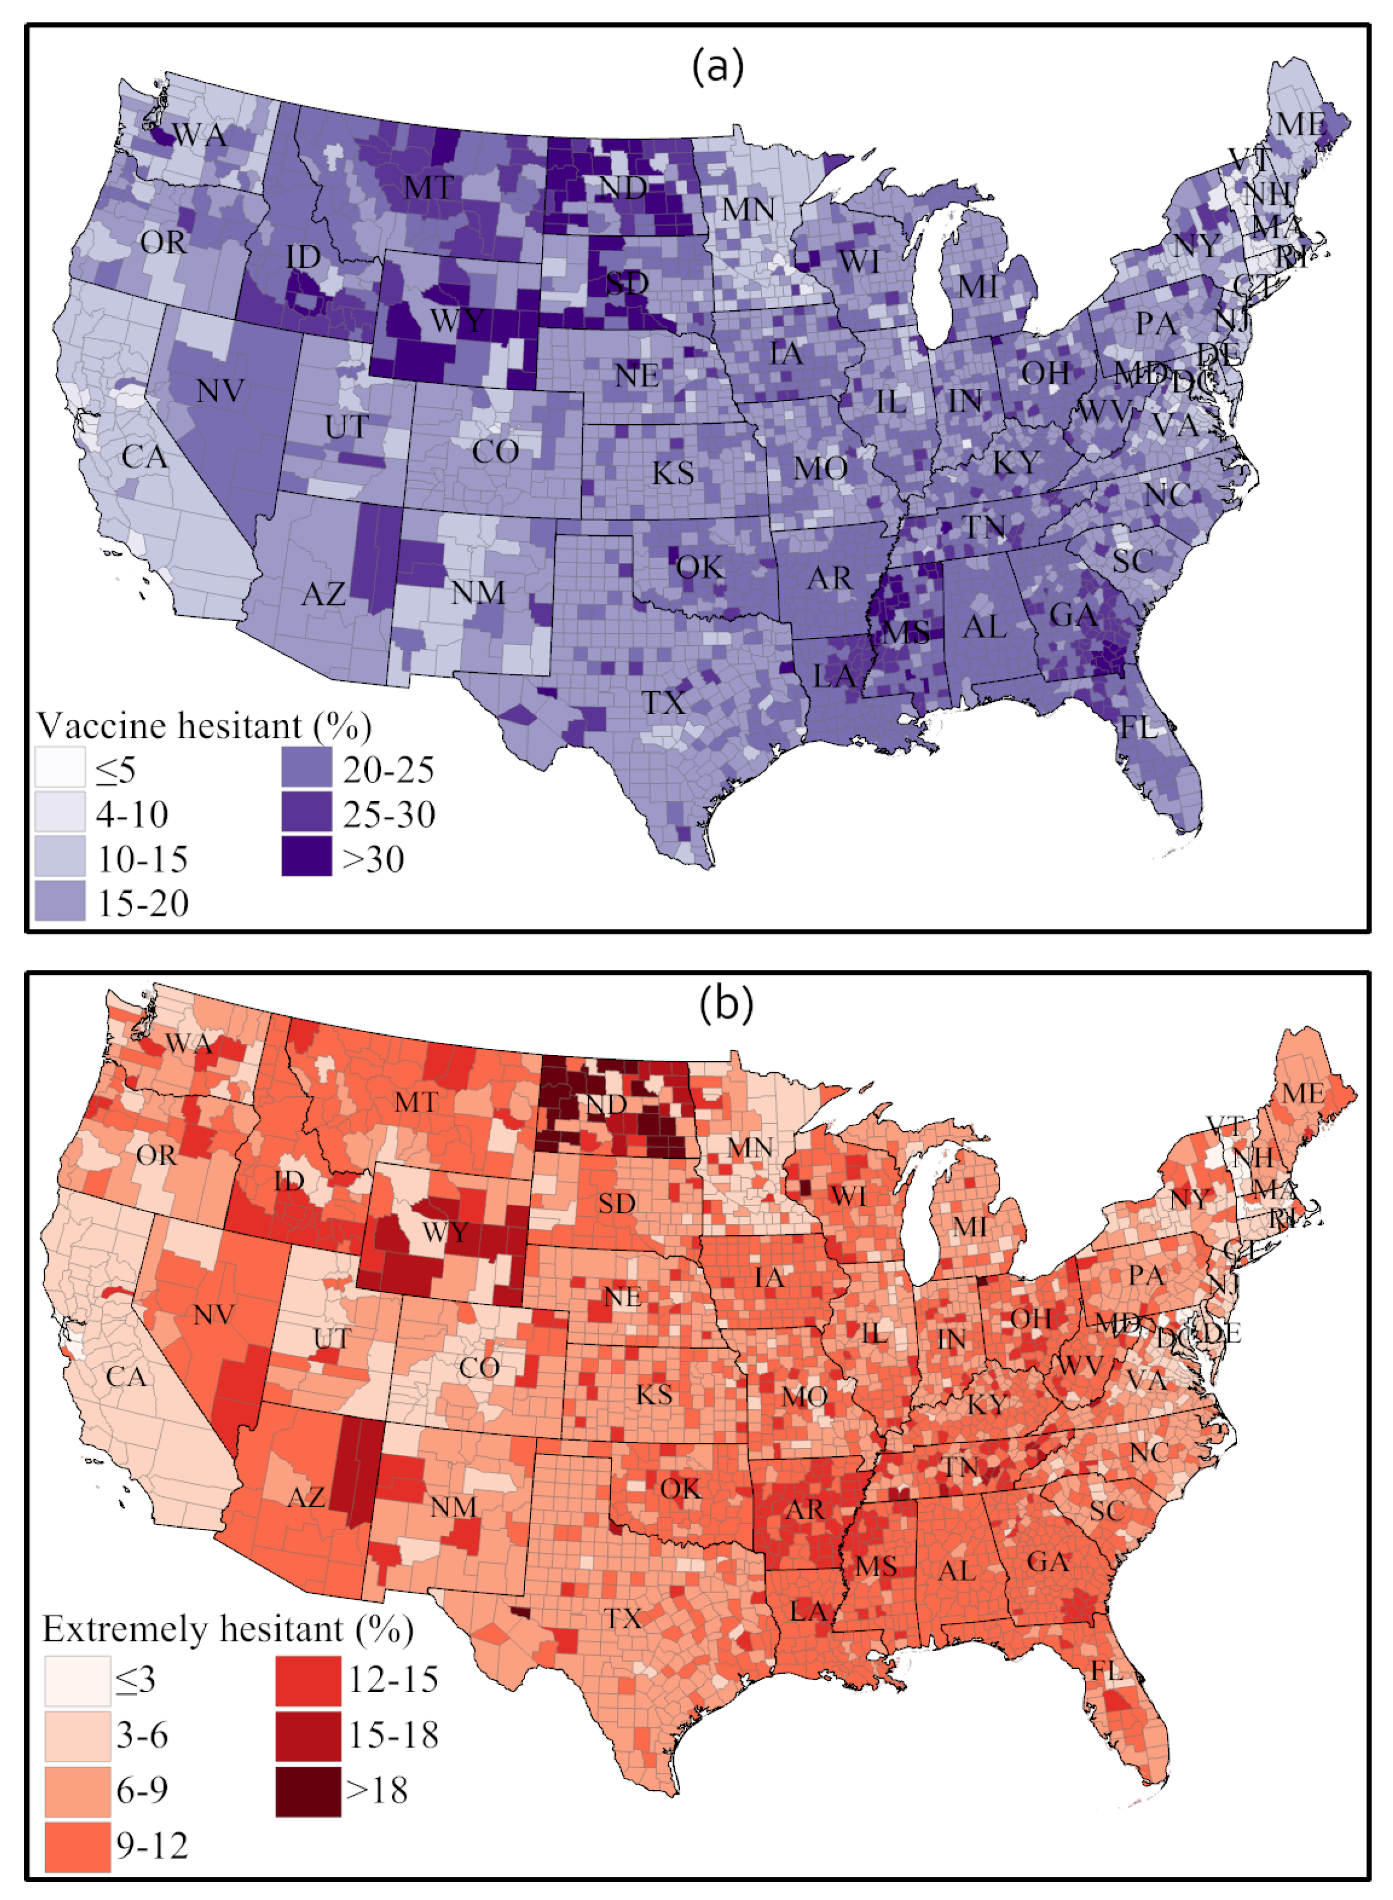
- The Northeast region has a higher vaccination acceptance than other regions of the US. The strongest vaccine hesitancy is found across a number of southern states, such as Alabama, Georgia, Mississippi, Tennessee, and Arkansas. The Midwest and the West show mixed vaccine acceptance scenarios. Notably, Wyoming and Idaho show lower vaccine acceptance. In contrast, California, New Mexico, Arizona, and Colorado show a higher vaccination acceptance. The HPS survey found that side effects, trust in vaccine and in authority, safety, and efficiency are the main reasons for lower vaccination acceptance in these states.
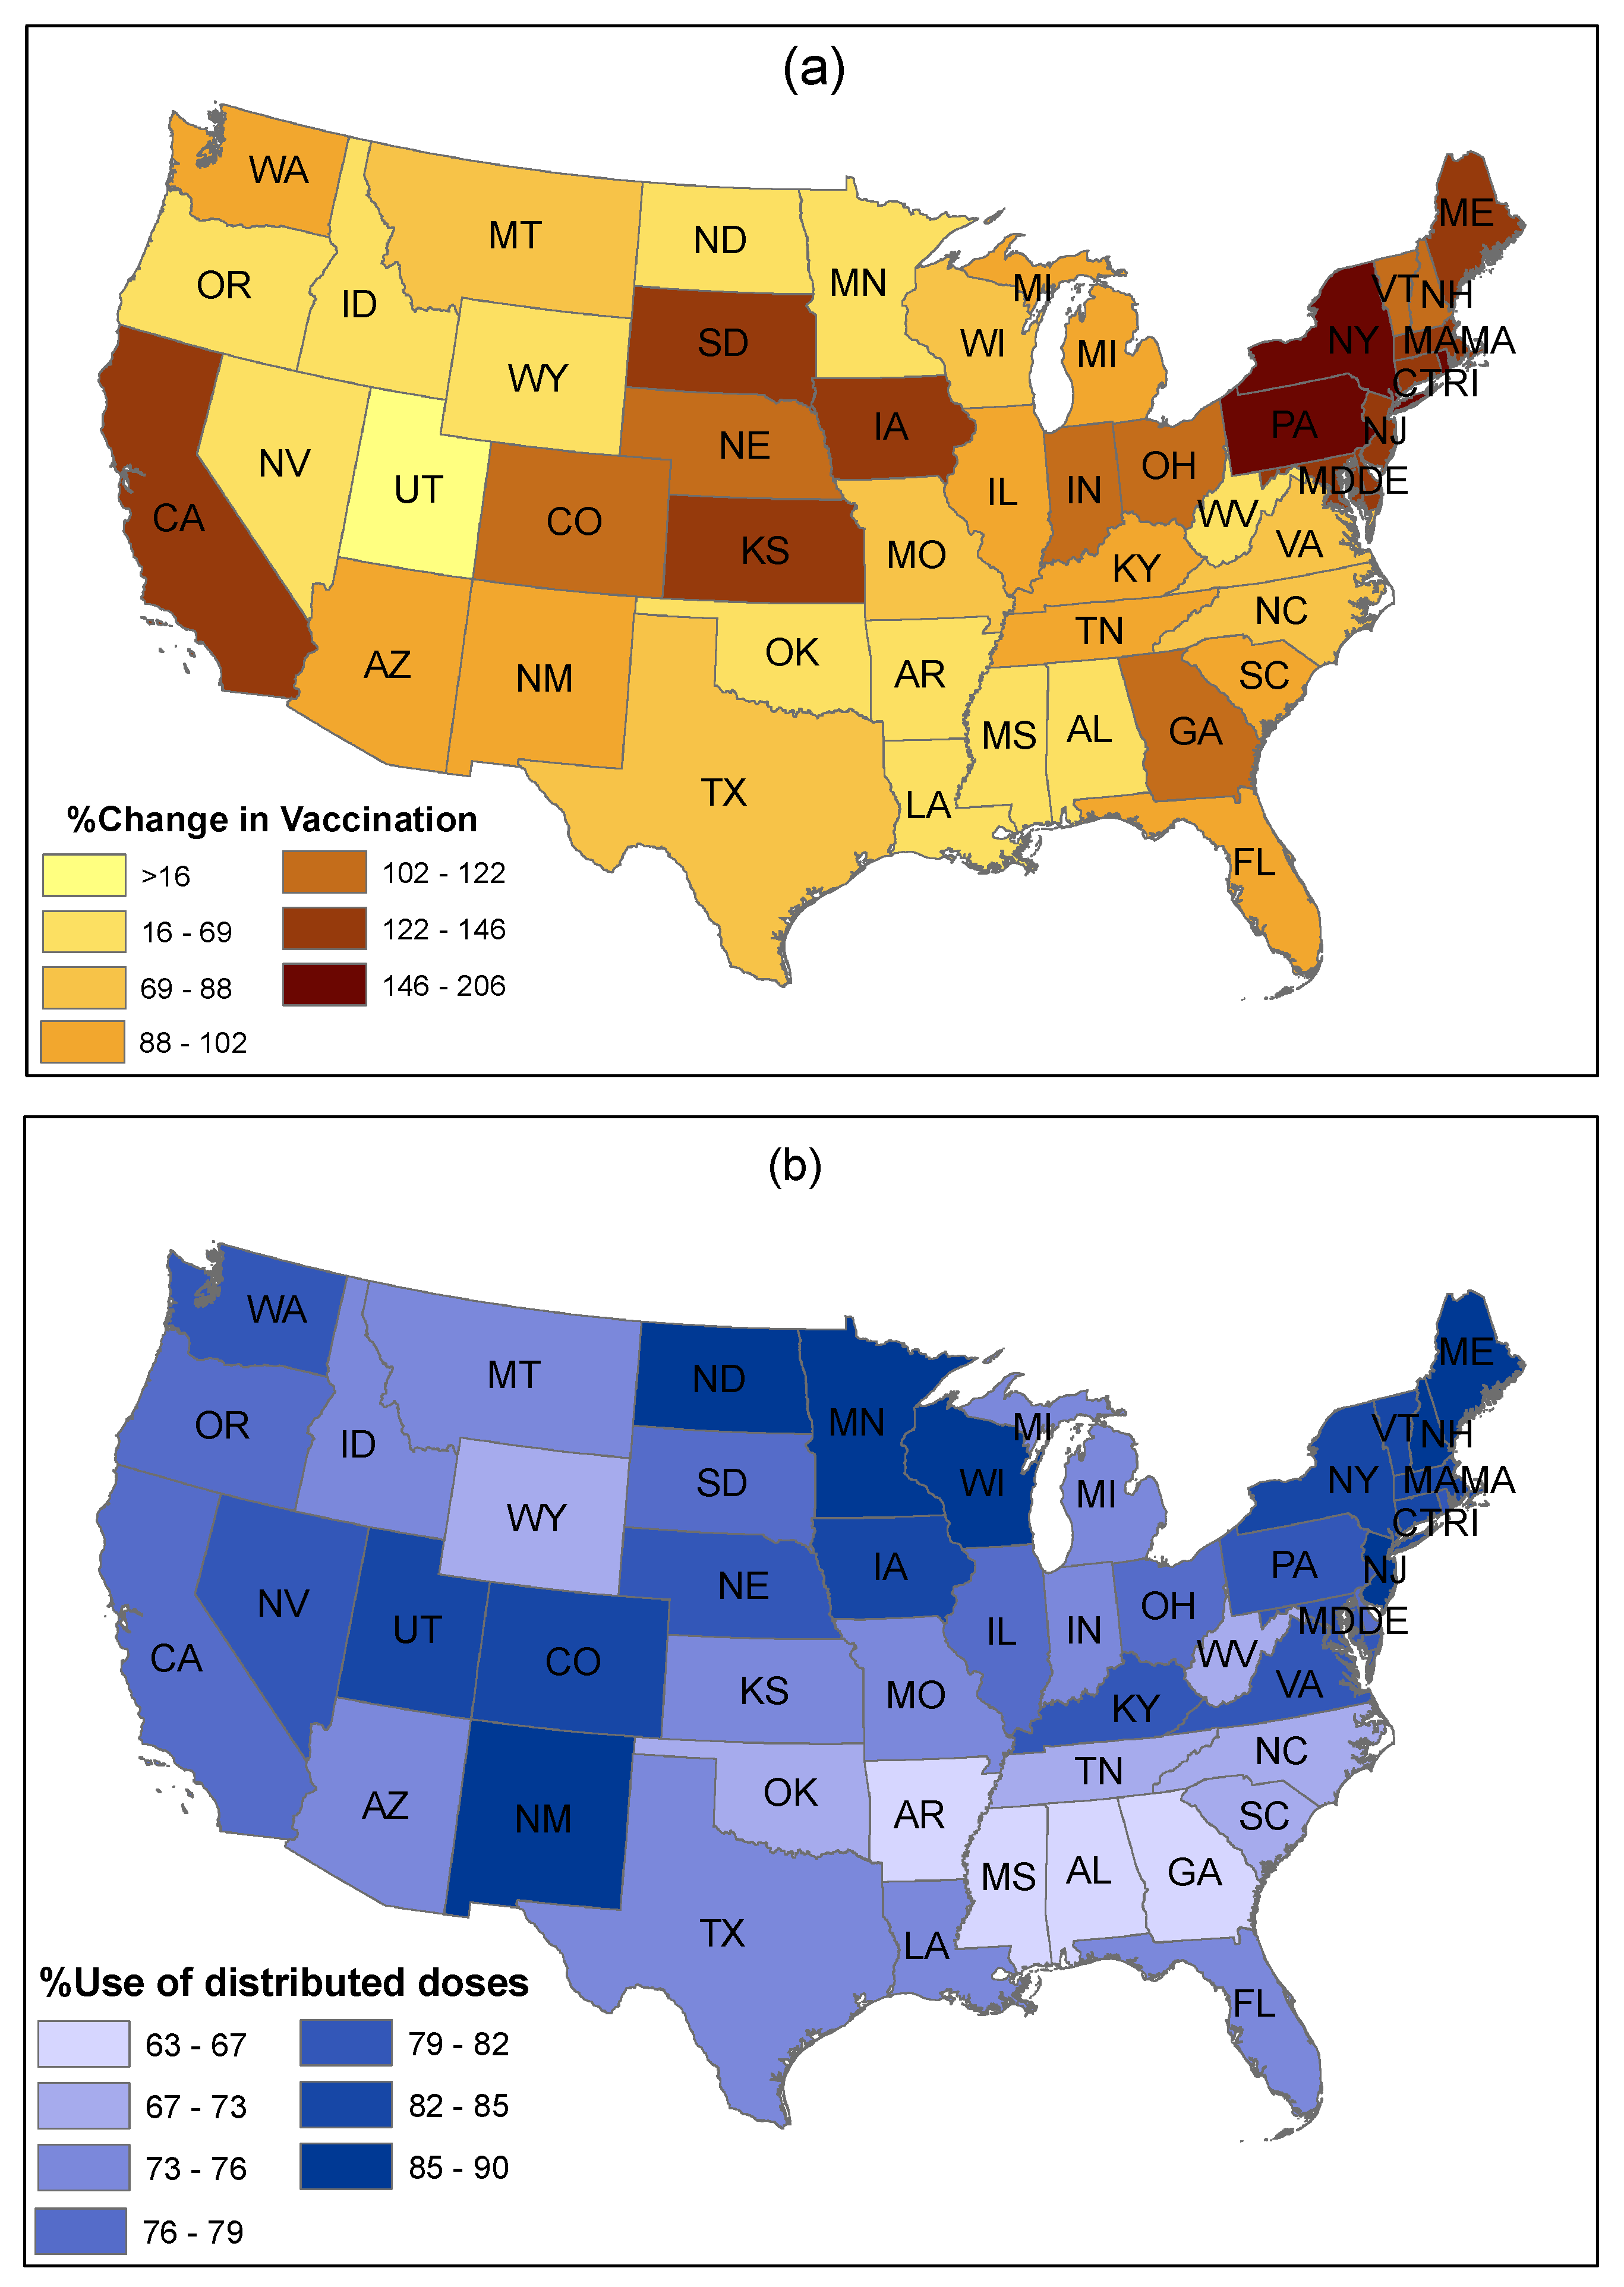
- Although positive sentiment declined and neutral sentiment increased in most states from February to March 2021, we found that most states improved their actual vaccine administration rate. We argued that this can be imputed to the increasing state-wise vaccine availability as time progresses.
- Among the specific negative sentiments isolated from the Twitter corpus (including fear, which was discussed explicitly, but also sadness, anger, and disgust), fear is the sentiment that strengthened the most over time in most states.
- The fear sentiment remained unchanged (between early February and late March) in populous states, like California, Texas, and New York), whereas a slight decline in trust sentiment was observed in these states.
- Changes in sentiments were very abrupt among less populous states in the central parts of the US, including Wyoming, South Dakota, Kansas, New Mexico, and Arkansas.
4.7. Limitations
- First, although researchers and policymakers have used Twitter data quite widely, Twitter posts may inadequately represents perceptions and opinions of the people from certain strata of society [18,67]. Many people (e.g., low-income and low-education people, and the elderly) do not have access to Twitter or shy away from social media, and therefore Twitter data may inaccurately characterize the sentiment towards vaccination in the population.
- Second, Twitter data are susceptible to bot activities [5]. Twitter bots are programmed to mimic daily Twitter users and share contents on a specific subject matter to spread news to the broader audience, which could be hoaxes and fakes and could alter the perceptions of actual Twitter users [68]. Moreover, voluntary inaccuracies and involuntary mistakes by users produce inaccurate data. Thus, the quality of Twitter data is reasonably affected by bot activities and user mistakes.
- Third, the sentiment scores extracted from Twitter posts using the Syuzhet package have some degree of inaccuracy for sentiment scores assigned to individual tweets, which may influence sentiment analysis. Such errors in sentiment scores are common across libraries and packages for textual and sentiment analytics, and the general expectation is that the overall sentiment scores remain fairly accurate subject to availability of sufficient data. Considering this issue, we used two more lexicon-based python libraries (e.g., Textblob and VADER) to validate the sentiment scores estimated using the Syuzhet package. However, future studies should consider fusing information from Twitter messages and sentiment propagation patterns to achieve better performance in analyzing Twitter data [69].
- Fourth, while our study demonstrated the unique value of Twitter posts to probe the sentiment of populations towards a current issue, such as vaccination, our work is preliminary, being based on two time frames only and on geo-location information that constrains the size of samples at a desirable spatial granularity, i.e., the state, the city, or the county. This work calls for further spatial-temporal monitoring at fine granularity over the long term.
- Fifth, this study explored the public sentiment towards the COVID-19 vaccines in the US and investigated the spatial and temporal changes in the sentiments. However, a study evaluating the key reasons for positive and negative sentiments would be desirable for targeted interventions of public agencies to increase vaccine uptake.
5. Policy Implications
- First, there is a significant opportunity for governments to improve vaccine distribution and delivery and perceptions surrounding these tasks. Our Twitter sentiment analysis and our review of associated information and multiple related surveys, demonstrated that the vaccine distribution and delivery process is one of the prominent reasons why people are unhappy or uncomfortable with vaccination. Therefore, federal and state governments should adapt their policies to both improve the distribution system and process, and also improve communications about the distribution and delivery process to address public concerns.
- Second, from the temporal sentiment analytics studying public sentiment changes from early February to late March 2021, we observed that simply giving more time did not help to improve public perceptions of COVID-19 vaccination. When vaccines became available to an increasingly large population in the US, it did not proportionately boost the vaccination rate [70]. Hence, the findings of our study imply that it would be beneficial for federal and state governments to take proactive actions to specifically attract vaccine hesitant segments of the population to be vaccinated. For example, the state of West Virginia offered $100 savings bonds to 16–35 years vaccinated adults. The state of Maryland offered $100 to all vaccinated state employees. In Connecticut, New Jersey, and Washington D.C., there are free-drink offers for vaccine takers [71]. An investment in such initiatives has the potential to break barriers and increase the COVID-19 vaccination rates by great margins.
- Third, from our application of the PSS framework and our thematic review of tweets, it is evident that people have hesitation and fear about the side effects of vaccination and have doubts about the effectiveness of the vaccines, which led to increasingly negative sentiment from early February to late March 2021. This scenario creates a need for governments to launch nationwide and statewide public awareness programs to educate and better inform people about vaccines, their side-effects, and effectiveness in a transparent and professional manner.It may be possible to learn from states where public sentiments show higher proportions of joy, trust and anticipation towards vaccines. Exceptional success stories need to be identified and disseminated through mass media to create a positive narrative and strengthen the positive sentiment towards vaccination. Moreover, sentiment analysis from this research can be associated with socioeconomic factors for further research to know how culture, income level, education level, and religious beliefs affect sentiment and public opinion variance towards COVID-19 vaccines.
- Fourth, some studies (e.g., [32]) observed a higher vaccine hesitancy among specific segments of society (e.g., Black/Hispanic population, less educated individuals, and rural residents). This appears to be supported by linguistic patterns in certain tweets with negative sentiment. Thus, targeted and multi-faceted efforts could be effective at increasing the acceptance of COVID-19 vaccines by these segments of society.
- Fifth, an important insight from our application of sentiment analytics and textual thematic reviews is that some segments of the population are hesitant to take COVID-19 vaccines because of a lack of trust based on the knowledge of the fast-tracked development and approval of the COVID-19 vaccine, whereas other vaccines, like Measles or Mumps, historically took significantly longer times to develop, test and approve and are, therefore, perceived to be safer and more effective.Governments and vaccine manufacturing companies need to proactively develop policies to publicize the reasons and the science behind the relatively rapid development and emergency approval of the use of COVID-19 vaccines via social media and supporting forms of mass communications. This could increase positive sentiment and public trust towards the vaccines.
- Sixth, government and corporate policies regarding news media and social media geared towards publicizing the vaccination of senior government officials, civic and business leaders, and other public and influential figures in society (e.g., celebrities idolized by hesitant cohorts of society) could provide great role models that could positively influence and motivate people to accept the COVID-19 vaccine [36]. We identified positive opinions on this topic in our textual thematic analysis of public tweets.
- Seventh, our analysis highlights the importance of using the PSS framework for generating insights on the collective public sentiment towards COVID-19 vaccines at both the federal as well as at the state levels. We found diverse changes between the national and local levels of aggregate public sentiment as shown in Figure 6, Figure 9 and Figure 11. Furthermore, the thematic analysis indicates that some segments of the population that are vaccine hesitant have a high degree of concern for their health, as opposed to other vaccine hesitant segments that display little concern regarding COVID-19 health issues.We posit that governments must, therefore, accommodate state and local level needs of the people, and also proactively cater to the opportunity to develop policies that support all segments of the citizenry, even if vaccine hesitant, in helping them safeguard their health by boosting natural immunity and by using methods they are most willing to accept.
- Eighth, there are two dimensions to this research: The first is the temporal and limited to the United States. This refers to the US specific sentiment analysis and public policy discussions, which is valuable despite much of the US population being vaccinated at this time. However, the second dimension of this research has long-term implications for all countries that are looking for ways to improve public policy and ensure better alignment and mass messaging. This research demonstrates an effective approach to near-real-time tracking of changes in public sentiment towards vaccines, and potential public policy strategies, which can be extended to many nations. Therefore, all of the public policy implications discussed above possess value beyond the current time period for which the data is analyzed, and are applicable and extensible to many other nations that continue to battle against waves of COVID infections, and a stream of COVID variants.
6. Conclusions and Future Work
Author Contributions
Funding
Institutional Review Board Statement
Informed Consent Statement
Data Availability Statement
Conflicts of Interest
Abbreviations
| COVID-19 | Coronavirus Disease 2019 |
| CDC | Centers for Disease Control and Prevention |
| NPIs | Non-pharmaceutical interventions |
| HPS | Household Pulse Survey |
| PSS | Public Sentiment Scenarios |
References
- CDC. US COVID-19 Cases and Deaths. 2021. Available online: https://covid.cdc.gov/covid-data-tracker/ (accessed on 7 July 2021).
- Worldometers. COVID-19 Coronavirus Pandemic. 2021. Available online: https://tinyurl.com/fe3bajs9 (accessed on 7 July 2021).
- Bell, S.; Clarke, R.; Mounier-Jack, S.; Walker, J.L.; Paterson, P. Parents’ and guardians’ views on the acceptability of a future COVID-19 vaccine: A multi-methods study in England. Vaccine 2020, 38, 7789–7798. [Google Scholar] [CrossRef]
- Samuel, J.; Ali, G.; Rahman, M.; Esawi, E.; Samuel, Y. COVID-19 public sentiment insights and machine learning for tweets classification. Information 2020, 11, 314. [Google Scholar] [CrossRef]
- Samuel, J.; Rahman, M.M.; Ali, G.G.M.N.; Samuel, Y.; Pelaez, A.; Chong, P.H.J.; Yakubov, M. Feeling Positive about Reopening? New Normal Scenarios from COVID-19 US Reopen Sentiment Analytics. IEEE Access 2020, 8, 142173–142190. [Google Scholar] [CrossRef]
- Wikipedia. Herd Immunity. Available online: https://en.wikipedia.org/wiki/Herd_immunity (accessed on 14 May 2021).
- Polack, F.P.; Thomas, S.J.; Kitchin, N.; Absalon, J.; Gurtman, A.; Lockhart, S.; Perez, J.L.; Pérez Marc, G.; Moreira, E.D.; Zerbini, C.; et al. Safety and Efficacy of the BNT162b2 mRNA Covid-19 Vaccine. N. Engl. J. Med. 2020, 383, 2603–2615. [Google Scholar] [CrossRef] [PubMed]
- Baden, L.R.; El Sahly, H.M.; Essink, B.; Kotloff, K.; Frey, S.; Novak, R.; Diemert, D.; Spector, S.A.; Rouphael, N.; Creech, C.B.; et al. Efficacy and Safety of the mRNA-1273 SARS-CoV-2 Vaccine. N. Engl. J. Med. 2021, 384, 403–416. [Google Scholar] [CrossRef]
- Apple, A.; Azimi, T.; Cordina, J. COVID-19 Vaccine: Are US Consumers Ready? 2020. Available online: https://tinyurl.com/4hx7mb6v (accessed on 14 May 2021).
- Robbins, R. Millions Are Skipping Their Second Doses of Covid Vaccines. 2021. Available online: tinyurl.com/mf8s37b5 (accessed on 14 May 2021).
- Goulet, K.; Jain, A.; Koslow, L.; Gjaja, M. The COVID-19 US Vaccine Sentiment Series: A Looming Slowdown in Demand. 2021. Available online: https://www.bcg.com/en-us/publications/2021/covid-19-us-vaccine-sentiment-series (accessed on 14 May 2021).
- CDC. COVID-19 Vaccinations in the United States. 2021. Available online: shorturl.at/nDG78 (accessed on 11 July 2021).
- U.S. Census Bureau. Week 28 Household Pulse Survey: April 14–April 26. 2021. Available online: bit.ly/3vToIFK (accessed on 14 May 2021).
- Borriello, A.; Master, D.; Pellegrini, A.; Rose, J.M. Preferences for a COVID-19 vaccine in Australia. Vaccine 2021, 39, 473–479. [Google Scholar] [CrossRef] [PubMed]
- Rahman, M.; Thill, J.C.; Paul, K.C. COVID-19 Pandemic Severity, Lockdown Regimes, and People’s Mobility: Early Evidence from 88 Countries. Sustainability 2020, 12, 9101. [Google Scholar] [CrossRef]
- Coudeville, L.; Gomez, G.; Jollivet, O.; Harris, R.; Thommes, E.; Druelles, S.; Chit, A.; Chaves, S.; Mahé, C. Exploring uncertainty and risk in the accelerated response to a COVID-19 vaccine: Perspective from the pharmaceutical industry. Vaccine 2020, 38, 7588–7595. [Google Scholar] [CrossRef]
- Rahman, M.; Paul, K.C.; Hossain, M.; NawazAli, G.; Thill, J.C. Machine Learning on the COVID-19 Pandemic, Human Mobility and Air Quality: A Review. IEEE Access 2021. Available online: https://ieeexplore.ieee.org/abstract/document/9427494 (accessed on 14 May 2021). [CrossRef]
- Rahman, M.M.; Ali, G.M.N.; Li, X.J.; Samuel, J.; Paul, K.C.; Chong, P.H.; Yakubov, M. Socioeconomic factors analysis for COVID-19 US reopening sentiment with Twitter and census data. Heliyon 2021, 7, e06200. [Google Scholar] [CrossRef] [PubMed]
- Karlsson, L.C.; Soveri, A.; Lewandowsky, S.; Karlsson, L.; Karlsson, H.; Nolvi, S.; Karukivi, M.; Lindfelt, M.; Antfolk, J. Fearing the disease or the vaccine: The case of COVID-19. Personal. Individ. Differ. 2021, 172, 110590. [Google Scholar] [CrossRef] [PubMed]
- Mercadante, A.R.; Law, A.V. Will They, or Won’t They? Examining Patients’ Vaccine Intention for Flu and COVID-19 using the Health Belief Model. Res. Soc. Adm. Pharm. 2020, 17, 1596–1605. [Google Scholar] [CrossRef] [PubMed]
- Schwarzinger, M.; Watson, V.; Arwidson, P.; Alla, F.; Luchini, S. COVID-19 vaccine hesitancy in a representative working-age population in France: A survey experiment based on vaccine characteristics. Lancet Public Health 2021, 6, e210–e221. [Google Scholar] [CrossRef]
- Glover, R.E.; Urquhart, R.; Lukawska, J.; Blumenthal, K.G. Vaccinating against covid-19 in people who report allergies. BMJ 2021, 372, n120. [Google Scholar] [CrossRef]
- Troiano, G.; Nardi, A. Vaccine hesitancy in the era of COVID-19. Public Health 2021, 194, 245–251. [Google Scholar] [CrossRef]
- MacDonald, N.E. Vaccine hesitancy: Definition, scope and determinants. Vaccine 2015, 33, 4161–4164. [Google Scholar] [CrossRef]
- Salmon, D.A.; Dudley, M.Z.; Glanz, J.M.; Omer, S.B. Vaccine hesitancy: Causes, consequences, and a call to action. Vaccine 2015, 33, D66–D71. [Google Scholar] [CrossRef] [PubMed]
- Wiysonge, C.S.; Ndwandwe, D.; Ryan, J.; Jaca, A.; Batouré, O.; Anya, B.P.M.; Cooper, S. Vaccine hesitancy in the era of COVID-19: Could lessons from the past help in divining the future? Hum. Vaccines Immunother. 2021, 1–3. [Google Scholar] [CrossRef]
- Sallam, M. COVID-19 vaccine hesitancy worldwide: A concise systematic review of vaccine acceptance rates. Vaccines 2021, 9, 160. [Google Scholar] [CrossRef]
- Thelwall, M.; Kousha, K.; Thelwall, S. COVID-19 Vaccine Hesitancy on English-Language Twitter. 2021. Available online: hdl.handle.net/2436/624008 (accessed on 14 May 2021).
- Lyu, H.; Wang, J.; Wu, W.; Duong, V.; Zhang, X.; Dye, T.D.; Luo, J. Social Media Study of Public Opinions on Potential COVID-19 Vaccines: Informing Dissent, Disparities, and Dissemination. arXiv 2020, arXiv:2012.02165. [Google Scholar]
- Piedrahita-Valdés, H.; Piedrahita-Castillo, D.; Bermejo-Higuera, J.; Guillem-Saiz, P.; Bermejo-Higuera, J.R.; Guillem-Saiz, J.; Sicilia-Montalvo, J.A.; Machío-Regidor, F. Vaccine Hesitancy on Social Media: Sentiment Analysis from June 2011 to April 2019. Vaccines 2021, 9, 28. [Google Scholar] [CrossRef] [PubMed]
- Ruiz, J.B.; Bell, R.A. Predictors of intention to vaccinate against COVID-19: Results of a nationwide survey. Vaccine 2021, 39, 1080–1086. [Google Scholar] [CrossRef] [PubMed]
- Fisher, K.A.; Bloomstone, S.J.; Walder, J.; Crawford, S.; Fouayzi, H.; Mazor, K.M. Attitudes toward a potential SARS-CoV-2 vaccine: A survey of US adults. Ann. Intern. Med. 2020, 173, 964–973. [Google Scholar] [CrossRef]
- Kreps, S.; Prasad, S.; Brownstein, J.S.; Hswen, Y.; Garibaldi, B.T.; Zhang, B.; Kriner, D.L. Factors associated with US adults’ likelihood of accepting COVID-19 vaccination. JAMA Netw. Open 2020, 3, e2025594. [Google Scholar] [CrossRef]
- Reiter, P.L.; Pennell, M.L.; Katz, M.L. Acceptability of a COVID-19 vaccine among adults in the United States: How many people would get vaccinated? Vaccine 2020, 38, 6500–6507. [Google Scholar] [CrossRef]
- Hussain, A.; Tahir, A.; Hussain, Z.; Sheikh, Z.; Gogate, M.; Dashtipour, K.; Ali, A.; Sheikh, A. Artificial Intelligence–Enabled Analysis of Public Attitudes on Facebook and Twitter toward COVID-19 Vaccines in the United Kingdom and the United States: Observational Study. J. Med. Internet Res. 2021, 23, e26627. [Google Scholar] [CrossRef] [PubMed]
- Griffith, J.; Marani, H.; Monkman, H. COVID-19 Vaccine Hesitancy in Canada: Content Analysis of Tweets Using the Theoretical Domains Framework. J. Med. Internet Res. 2021, 23, e26874. [Google Scholar] [CrossRef] [PubMed]
- Eibensteiner, F.; Ritschl, V.; Nawaz, F.A.; Fazel, S.S.; Tsagkaris, C.; Kulnik, S.T.; Crutzen, R.; Klager, E.; Völkl-Kernstock, S.; Schaden, E.; et al. People’s Willingness to Vaccinate Against COVID-19 Despite Their Safety Concerns: Twitter Poll Analysis. J. Med. Internet Res. 2021, 23, e28973. [Google Scholar] [CrossRef] [PubMed]
- Salathé, M.; Khandelwal, S. Assessing Vaccination Sentiments with Online Social Media: Implications for Infectious Disease Dynamics and Control. PLoS Comput. Biol. 2011, 7, e1002199. [Google Scholar] [CrossRef] [PubMed] [Green Version]
- Raghupathi, V.; Ren, J.; Raghupathi, W. Studying Public Perception about Vaccination: A Sentiment Analysis of Tweets. Int. J. Environ. Res. Public Health 2020, 17, 3464. [Google Scholar] [CrossRef]
- Thukraal, S. COVID-19 Vaccines: Social Media User Sentiments and Strategies to Encourage Administration. 2021. Available online: tinyurl.com/e7jc7vz7 (accessed on 14 May 2021).
- Khubchandani, J.; Sharma, S.; Price, J.H.; Wiblishauser, M.J.; Sharma, M.; Webb, F.J. COVID-19 vaccination hesitancy in the United States: A rapid national assessment. J. Community Health 2021, 46, 270–277. [Google Scholar] [CrossRef] [PubMed]
- Lucia, V.C.; Kelekar, A.; Afonso, N.M. COVID-19 vaccine hesitancy among medical students. J. Public Health 2020. [Google Scholar] [CrossRef]
- Rutten, L.J.F.; Zhu, X.; Leppin, A.; Ridgeway, J.L.; Swift, M.; Griffin, J.M.; St Sauver, J.L.; Virk, A.; Jacobson, R.M. Evidence-based strategies for clinical organizations to address COVID-19 vaccine hesitancy. In Mayo Clinic Proceedings; Elsevier: Amsterdam, The Netherlands, 2021; Volume 96, pp. 699–707. [Google Scholar] [CrossRef]
- McCabe, S.D.; Hammershaimb, E.A.; Cheng, D.; Shi, A.; Shyr, D.; Shen, S.; Cole, L.D.; Cataldi, J.R.; Allen, W.; Probasco, R.; et al. Unraveling Attributes of COVID-19 Vaccine Hesitancy in the US: A Large Nationwide Study. medRxiv 2021. Available online: https://www.medrxiv.org/content/10.1101/2021.04.05.21254918v1 (accessed on 14 May 2021).
- Ward, J.K.; Alleaume, C.; Peretti-Watel, P.; Seror, V.; Cortaredona, S.; Launay, O.; Raude, J.; Verger, P.; Beck, F.; Legleye, S.; et al. The French public’s attitudes to a future COVID-19 vaccine: The politicization of a public health issue. Soc. Sci. Med. 2020, 265, 113414. [Google Scholar] [CrossRef]
- Detoc, M.; Bruel, S.; Frappe, P.; Tardy, B.; Botelho-Nevers, E.; Gagneux-Brunon, A. Intention to participate in a COVID-19 vaccine clinical trial and to get vaccinated against COVID-19 in France during the pandemic. Vaccine 2020, 38, 7002–7006. [Google Scholar] [CrossRef]
- Wang, K.; Wong, E.L.Y.; Ho, K.F.; Cheung, A.W.L.; Chan, E.Y.Y.; Yeoh, E.K.; Wong, S.Y.S. Intention of nurses to accept coronavirus disease 2019 vaccination and change of intention to accept seasonal influenza vaccination during the coronavirus disease 2019 pandemic: A cross-sectional survey. Vaccine 2020, 38, 7049–7056. [Google Scholar] [CrossRef]
- Wang, K.; Wong, E.L.Y.; Ho, K.F.; Cheung, A.W.L.; Yau, P.S.Y.; Dong, D.; Wong, S.Y.S.; Yeoh, E.K. Change of willingness to accept COVID-19 vaccine and reasons of vaccine hesitancy of working people at different waves of local epidemic in Hong Kong, China: Repeated cross-sectional surveys. Vaccines 2021, 9, 62. [Google Scholar] [CrossRef] [PubMed]
- Wagner, A.L.; Huang, Z.; Ren, J.; Laffoon, M.; Ji, M.; Pinckney, L.C.; Sun, X.; Prosser, L.A.; Boulton, M.L.; Zikmund-Fisher, B.J. Vaccine hesitancy and concerns about vaccine safety and effectiveness in Shanghai, China. Am. J. Prev. Med. 2021, 60, S77–S86. [Google Scholar] [CrossRef] [PubMed]
- Goldman, R.D.; Marneni, S.R.; Seiler, M.; Brown, J.C.; Klein, E.J.; Cotanda, C.P.; Gelernter, R.; Yan, T.D.; Hoeffe, J.; Davis, A.L.; et al. Caregivers’ willingness to accept expedited vaccine research during the COVID-19 pandemic: A cross-sectional survey. Clin. Ther. 2020, 42, 2124–2133. [Google Scholar] [CrossRef] [PubMed]
- Leng, A.; Maitland, E.; Wang, S.; Nicholas, S.; Liu, R.; Wang, J. Individual preferences for COVID-19 vaccination in China. Vaccine 2021, 39, 247–254. [Google Scholar] [CrossRef]
- Rinker, T. Calculate Text Polarity Sentiment. 2019. Available online: https://tinyurl.com/33b94e48 (accessed on 14 May 2021).
- Misuraca, M.; Forciniti, A.; Scepi, G.; Spano, M. Sentiment Analysis for Education with R: Packages, methods and practical applications. arXiv 2020, arXiv:2005.12840. [Google Scholar]
- Saini, S.; Punhani, R.; Bathla, R.; Shukla, V.K. Sentiment analysis on twitter data using R. In Proceedings of the 2019 International Conference on Automation, Computational and Technology Management (ICACTM), London, UK, 24–26 April 2019; pp. 68–72. [Google Scholar]
- Saif, H.; He, Y.; Fernandez, M.; Alani, H. Contextual semantics for sentiment analysis of Twitter. Inf. Process. Manag. 2016, 52, 5–19. [Google Scholar] [CrossRef] [Green Version]
- Naldi, M. A review of sentiment computation methods with R packages. arXiv 2019, arXiv:1901.08319. [Google Scholar]
- Hutto, C.; Gilbert, E. VADER: A Parsimonious Rule-Based Model for Sentiment Analysis of Social Media Text. In Proceedings of the International AAAI Conference on Web and Social Media, Ann Arbor, MI, USA, 1–4 June 2014; Volume 8, pp. 216–225. [Google Scholar]
- Oyebode, O.; Orji, R. Social Media and Sentiment Analysis: The Nigeria Presidential Election 2019. In Proceedings of the 2019 IEEE 10th Annual Information Technology, Electronics and Mobile Communication Conference (IEMCON), Vancouver, BC, Canada, 17–19 October 2019; pp. 140–146. [Google Scholar] [CrossRef]
- Höchtl, J.; Parycek, P.; Schöllhammer, R. Big data in the policy cycle: Policy decision making in the digital era. J. Organ. Comput. Electron. Commer. 2016, 26, 147–169. [Google Scholar] [CrossRef]
- Samuel, J.; Holowczak, R.; Pelaez, A. The Effects of Technology Driven Information Categories on Performance in Electronic Trading Markets. J. Inf. Technol. Manag. 2017, 28, 1–14. [Google Scholar]
- Black, R.C.; Owens, R.J.; Wedeking, J.; Wohlfarth, P.C. The influence of public sentiment on Supreme Court opinion clarity. Law Soc. Rev. 2016, 50, 703–732. [Google Scholar] [CrossRef]
- Samuel, J.; Holowczak, R.; Benbunan-Fich, R.; Levine, I. Automating Discovery of Dominance in Synchronous Computer-Mediated Communication. In Proceedings of the 2014 47th Hawaii International Conference on System Sciences, Waikoloa, HI, USA, 6–9 January 2014; pp. 1804–1812. [Google Scholar]
- Li, S.; Liu, Z.; Li, Y. Temporal and spatial evolution of online public sentiment on emergencies. Inf. Process. Manag. 2020, 57, 102177. [Google Scholar] [CrossRef]
- Samuel, J. Information Token Driven Machine Learning for Electronic Markets: Performance Effects in Behavioral Financial Big Data Analytics. J. Inf. Syst. Technol. Manag. 2017, 14, 371–383. [Google Scholar] [CrossRef] [Green Version]
- Samuel, J.; Peleaz, A. Informatics in Information Richness: A Market Mover? An Examination of Information Richness in Electronic Markets. Inform. Inf. Richness Mark. Mov. 2017, 8, 35–40. [Google Scholar]
- Jones, S.P. Imperial College London Big Data Analytical Unit and YouGov Plc. In Imperial College London YouGov Covid Data Hub, v1. 0; YouGov Plc: London, UK, 2020. [Google Scholar]
- Nagar, R.; Yuan, Q.; Freifeld, C.C.; Santillana, M.; Nojima, A.; Chunara, R.; Brownstein, J.S. A case study of the New York City 2012–2013 influenza season with daily geocoded Twitter data from temporal and spatiotemporal perspectives. J. Med. Internet Res. 2014, 16, e236. [Google Scholar] [CrossRef] [Green Version]
- Çetinkaya, Y.M.; Toroslu, İ.H.; Davulcu, H. Developing a Twitter bot that can join a discussion using state-of-the-art architectures. Soc. Netw. Anal. Min. 2020, 10, 1–21. [Google Scholar] [CrossRef]
- Wang, L.; Niu, J.; Yu, S. SentiDiff: Combining textual information and sentiment diffusion patterns for Twitter sentiment analysis. IEEE Trans. Knowl. Data Eng. 2019, 32, 2026–2039. [Google Scholar] [CrossRef]
- Guttentag, S. What’s Causing Low COVID-19 Vaccine Uptake—Hesitancy, Lack of Access, or Both? 2021. Available online: tinyurl.com/ywn86pxv (accessed on 14 May 2021).
- Hubbard, K. Want Free Beer or a Chance at $1 Million? Get Your COVID-19 Vaccine. 2021. Available online: https://www.usnews.com/news/best-states/articles/2021-05-07/states-cities-and-companies-offer-incentives-to-get-covid-19-vaccine (accessed on 15 May 2021).
- Yue, L.; Chen, W.; Li, X.; Zuo, W.; Yin, M. A survey of sentiment analysis in social media. Knowl. Inf. Syst. 2019, 60, 617–663. [Google Scholar] [CrossRef]
- Stojanovski, D.; Strezoski, G.; Madjarov, G.; Dimitrovski, I. Twitter sentiment analysis using deep convolutional neural network. In International Conference on Hybrid Artificial Intelligence Systems; Springer: Berlin/Heidelberg, Germany, 2015; pp. 726–737. [Google Scholar]
- Hassan, A.; Abbasi, A.; Zeng, D. Twitter sentiment analysis: A bootstrap ensemble framework. In Proceedings of the 2013 International Conference on Social Computing, Alexandria, VA, USA, 8–14 September 2013; pp. 357–364. [Google Scholar]
- Garvey, M.D.; Samuel, J.; Pelaez, A. Would you please like my tweet?! An artificially intelligent, generative probabilistic, and econometric based system design for popularity-driven tweet content generation. Decis. Support Syst. 2021, 144, 113497. [Google Scholar] [CrossRef]
- Zhang, T.; Kishore, V.; Wu, F.; Weinberger, K.Q.; Artzi, Y. Bertscore: Evaluating text generation with bert. arXiv 2019, arXiv:1904.09675. [Google Scholar]
- Samuel, J.; Palle, R.; Soares, E. Textual Data Distributions: Kullback Leibler Textual Distributions Contrasts on GPT-2 Generated Texts with Supervised, Unsupervised Learning on Vaccine & Market Topics & Sentiment. SSRN 2021. [Google Scholar] [CrossRef]


| Study | Context | Data Source | Vaccine Acceptance (%) | Vaccine Hesitant (%) | Neutral (%) |
|---|---|---|---|---|---|
| [3] | England | Online survey | 34.3–55.8 | - | - |
| [19] | Finland | Online survey | 66.67 | - | - |
| [23] | Review study | Reviewed 15 articles | 86.1 (Student), 54.3–77.6 (general people) | - | - |
| [29] | USA | 57.65 | 42.35 | - | |
| [31] | USA | Online survey | 62.2 | 14.8 | 23 |
| [32] | USA | Cross-sectional survey | 57.6 | 10.8 | 31.6 |
| [33] | USA | Hypothetical scenarios | 56 | - | - |
| [34] | USA | Online survey | 69 | - | - |
| [35] | USA and UK | Facebook and Twitter | 56 (USA), 58 (UK) | 24 (USA), 22 (UK) | 18 (USA), 17 (UK) |
| [36] | Canada | 84.55 | 15.45 | - | |
| [37] | Twitter Polls | 82.8 | 8 | 6.8 |
| Proportion Test | Exact Binomial Test | |
|---|---|---|
| Null Hypothesis | −ve senti ≥ +ve senti | −ve senti ≥ +ve senti |
| Alt. Hypothesis | True p is less than 0.5 | True p is less than 0.5 |
| p-Value | 2.20 × 10 | 2.20 × 10 |
| Conclusion | Reject Null Hypothesis | Reject Null Hypothesis |
| Shapiro–Wilk Normality Test | ||
| Null Hypothesis | Normally distributed data | |
| Shapiro–Wilk statistic | 0.98387 | |
| p-Value | 2.20 × 10 | |
| Conclusion | Reject Null Hypothesis that data are normal | |
| Wilcoxon Signed Rank Test | ||
| Alt. Hypothesis: | True location is greater than 0 | |
| V | 6117396 | |
| p-Value | 2.2 × 10 | |
| Conclusion | Reject Null Hypothesis | |
| Proportion Test | Exact Binomial Test | |
|---|---|---|
| Null Hypothesis | −ve senti ≥ +ve senti | −ve senti ≥ +ve senti |
| Alt. Hypothesis | True p is less than 0.5 | True p is less than 0.5 |
| p-Value | 2.2 × 10 | 2.2 × 10 |
| Conclusion | Reject Null Hypothesis | Reject Null Hypothesis |
| Shapiro–Wilk Normality Test | ||
| Null Hypothesis | Normally distributed data | |
| Shapiro–Wilk statistic | 0.98343 | |
| p-Value | 2.20 × 10 | |
| Conclusion | Reject Null Hypothesis that data are normal | |
| Wilcoxon Signed Rank Test | ||
| Alt. Hypothesis: | True location is greater than 0 | |
| V | 16629414 | |
| p-Value | 2.20 × 10 | |
| Conclusion | Reject Null Hypothesis | |
| Proportion Test | Exact Binomial Test | |
|---|---|---|
| Null Hypothesis | Mar’21 +ve senti ≥ Feb’21 +ve senti | Mar’21 +ve senti ≥ Feb’21 +ve senti |
| Alt. Hypothesis | True p is less than 0.5 | True p is less than 0.5 |
| p-Value | 0.03262 | 0.03262 |
| Conclusion | Reject Null Hypothesis | Reject Null Hypothesis |
| Proportion Test | Exact Binomial Test | |
| Null Hypothesis | Feb’21 −ve senti ≥ Mar’21 −ve senti | Feb’21 −ve senti ≥ Mar’21 −ve senti |
| Alt. Hypothesis | True p is less than 0.5 | True p is less than 0.5 |
| p-Value | 0.01159 | 0.01158 |
| Conclusion | Reject Null Hypothesis | Reject Null Hypothesis |
| Key Reasons to Affect Vaccine Administration | Percentage |
|---|---|
| Concerned about possible side effects | 20.86 |
| Plan to wait and see if it is safe | 17.04 |
| Do not trust COVID-19 vaccines | 12.55 |
| Do not trust the government | 9.63 |
| Do not believe I need a vaccine | 8.32 |
| Do not know if a vaccine will work | 8.32 |
| Other people need it more right now | 7.11 |
| Do not like vaccines | 4.39 |
| Doctor has not recommended it | 2.54 |
| Concerned about the cost | 1.42 |
| Other | 7.15 |
| Did not report | 0.68 |
Publisher’s Note: MDPI stays neutral with regard to jurisdictional claims in published maps and institutional affiliations. |
© 2021 by the authors. Licensee MDPI, Basel, Switzerland. This article is an open access article distributed under the terms and conditions of the Creative Commons Attribution (CC BY) license (https://creativecommons.org/licenses/by/4.0/).
Share and Cite
Ali, G.G.M.N.; Rahman, M.M.; Hossain, M.A.; Rahman, M.S.; Paul, K.C.; Thill, J.-C.; Samuel, J. Public Perceptions of COVID-19 Vaccines: Policy Implications from US Spatiotemporal Sentiment Analytics. Healthcare 2021, 9, 1110. https://doi.org/10.3390/healthcare9091110
Ali GGMN, Rahman MM, Hossain MA, Rahman MS, Paul KC, Thill J-C, Samuel J. Public Perceptions of COVID-19 Vaccines: Policy Implications from US Spatiotemporal Sentiment Analytics. Healthcare. 2021; 9(9):1110. https://doi.org/10.3390/healthcare9091110
Chicago/Turabian StyleAli, G. G. Md. Nawaz, Md. Mokhlesur Rahman, Md. Amjad Hossain, Md. Shahinoor Rahman, Kamal Chandra Paul, Jean-Claude Thill, and Jim Samuel. 2021. "Public Perceptions of COVID-19 Vaccines: Policy Implications from US Spatiotemporal Sentiment Analytics" Healthcare 9, no. 9: 1110. https://doi.org/10.3390/healthcare9091110
APA StyleAli, G. G. M. N., Rahman, M. M., Hossain, M. A., Rahman, M. S., Paul, K. C., Thill, J.-C., & Samuel, J. (2021). Public Perceptions of COVID-19 Vaccines: Policy Implications from US Spatiotemporal Sentiment Analytics. Healthcare, 9(9), 1110. https://doi.org/10.3390/healthcare9091110