Article

Low-Tech Test for Mercury Detection: A New Option for Water Quality Assessment

by
Nadezhda S. Komova
,
Kseniya V. Serebrennikova
,
Anna N. Berlina
*,
Anatoly V. Zherdev
and
Boris B. Dzantiev
A.N. Bach Institute of Biochemistry, Research Center of Biotechnology of the Russian Academy of Sciences, Leninsky Prospect 33, 119071 Moscow, Russia
*
Author to whom correspondence should be addressed.
Chemosensors 2022, 10(10), 413; https://doi.org/10.3390/chemosensors10100413
Submission received: 8 September 2022 / Revised: 7 October 2022 / Accepted: 10 October 2022 / Published: 11 October 2022
(This article belongs to the Special Issue Chemosensors for Ion Detection)

Abstract

:
Mercury pollution is a global environmental problem, especially in low-resource areas where artisanal iron mining is taking place and industrialization is on the rise. Therefore, there is a demand for simple methods for the determination of toxic metals at low. In this study, an on-field membrane lateral flow test system for sensitive and specific detection of Hg2+ in natural waters matrix is proposed. For this purpose, mercaptosuccinic acid (MSA) conjugated with protein-carrier (bovine serum albumin) was pre-impregnated in the test zone of the strip and used as a capping agent for mercury complexation. Quantitative evaluation of the analyte was provided by the use of gold nanoparticles stabilized with Tween-20 as a detecting agent. The sensing principle relies on the formation of Au–Hg nanoalloy during the migration of a solution containing Hg2+ along the strip, followed by capture in the test zone with the formation of a colored complex. Under optimum conditions, the proposed lateral flow test exhibited the linear correlation between color intensity in the test zone from the concentration of Hg2+ in the range of 0.04–25 ng/mL. The total analysis time was 11 min, without the need for the usage of additional instrumentation. The detection limit was estimated to be 0.13 ng/mL, which is 45 times lower than the WHO guidelines. The applicability of the proposed lateral flow test was confirmed by the analysis of natural waters, with the recoveries ranging from 70 to 120%. Due to the high affinity of Au to Hg and the use of a capping agent for mercury complexing, the developed system demonstrates high selectivity toward Hg2+. Compared to existing analytical methods, the proposed approach can be easily implemented and is characterized by economy and high analytical performance.

Graphical Abstract

1. Introduction

To date, mercury pollution forms an important subject of environmental concern [1,2]. The risk of contamination results from the widespread use of mercury in industrial processes, as well as its physicochemical properties associated with high volatility, sorption capacity in the soil, and solubility of mercury vapor in precipitation. Excess intake of mercury compounds in the human body leads to dysfunction of the nervous, digestive, and immune systems, as well as damage to the lungs and kidneys. [3]. Due to the high toxicity of mercury, permissible levels of its safe content in environmental objects have been established. The permissible level of Hg2+ in drinking water varies from 0.5 ng/mL to 6 ng/mL according to the recommendations of organizations in various countries (USA [4], Canada, China, Russia [5]), and the WHO [6]. Such requirements are met by highly sensitive analytical techniques including chromatographic methods (gas chromatography, liquid chromatography), capillary electrophoresis, and spectroscopic methods (atomic absorption, inductively coupled plasma mass spectrometry, and cold vapor atomic absorption), which are described in detail in review articles [7,8].
Despite the good sensitivity and selectivity of these laboratory-based methods, the need for expensive equipment and time-consuming sample preparation limits their applicability for environmental monitoring. Presently, besides traditional methods, other cost-effective and simple approaches for Hg2+ sensing are being developed [9,10]. Among them, the development of semiportable electrochemical sensors where the stage of preliminary sample preparation is preserved deserves special attention as, due to the miniaturization of the signal reading device, as well as a sharp decrease in the amount of reagents used, the analysis procedure is simplified [11,12]. Furthermore, the growing interest in devices capable of detecting low concentrations without prior sample preparation and providing results at the sampling site is being met by colorimetric approaches [13]. Among colorimetric methods for heavy metal detection, the aggregation mechanism of noble metal nanoparticles is preferred [14]. The advantage of gold nanoparticles as a colorimetric detector is due to their ability to change the surface plasmon resonance (SPR) upon induced particle binding and aggregation, as well as their high absorption coefficient [15,16,17]. The course of a colorimetric reaction using gold nanoparticles is directly related to their SPR and depends on the particle size, shape, and functionalizing ligand [18]. Based on this concept, a significant number of scientific studies have been built, where gold nanoparticles functionalized with DNA oligonucleotides [19], peptides [20], tannins [21], as well as molecules containing a thiol group, for example, thioctic acid [22], 3-mercaptopropionate acid [23], 4-mercaptosuccinic acid [24], or 2-thiazoline-2-thiol [25], are obtained for the colorimetric detection of heavy metals. Another non-standard and less common approach for colorimetric detection, applicable only to the determination of Hg2+, is based on amalgamation between mercury and other metals, usually silver or gold [26]. Selectivity towards mercury ions is achieved due to the high affinity of the latter for metal nanoparticles, which results in the formation of nanoalloys [27]. This approach has been implemented in a number of systems for detecting Hg2+ using gold nanoparticles [28], gold nanorods [29], as well as paper-based devices using silver nanoparticles [30,31]. However, the sensitivity of the proposed approaches does not meet the requirements for determining Hg2+ in real samples.
Despite the simplicity and sufficient sensitivity of the described homogeneous approaches, membrane tests that allow the determination of the target analyte by immersing the test strip in the analyzed solution are an effective alternative tool for detecting metal ions. Furthermore, compared to the aggregation-based approach, the use of membrane tests can improve the readability of a weak signal due to the strong contrast between the colored test band and the clear membrane area. The labeled complexes are concentrated on the membranes, and interfering sample components are washed out of the binding zones, thus, providing additional sensitivity and selectivity. In membrane tests, conjugates of nanoparticles with such compounds as enzymes [32], aptamers [33], and metal-specific antibodies [34] are used as recognition molecules. In this case, the binding of metal ions in the test zone is provided by protein conjugates with chelating agents, among which EDTA derivatives are traditionally used [35,36].
Previously, we reported on the development and successful approbation of a lateral flow test for the rapid detection of Pb2+, where for the first time phenylboronic acid was used as a chelating agent, as well as an oligocytosine chain (polycytosine aptamer) as a receptor for the resulting complexes [33]. This combination of lateral flow aptasensor made it possible to achieve high analytical performance for the determination of lead ions in accordance with the WHO requirements in drinking water. Therefore, this paper presents a lateral flow test for the determination of Hg2+ in natural waters, which firstly combines the advantages of membrane formats of testing with specific ligand–receptor interactions based on low-cost reagents. The lateral flow test design was made using surfactant-stabilized gold nanoparticles (AuNPs) and mercaptosuccinic acid (MSA) as detecting and capping agents, respectively. The choice of AuNPs as a detecting agent is due to their high brightness, ease of synthesis, and functionalization of their surface. The sensing parameters, such as nanoparticle size, component concentrations, and analysis time, have been optimized, and selectivity to other metal ions was also evaluated. In addition, the analysis of natural waters showed good recoveries, indicating its practical relevance for the environmental monitoring of water quality.

2. Materials and Methods

2.1. Chemicals and Materials

Tetrachloroauric (III) acid (HAuCl4), 2-mercaptosuccinic acid (MSA), 4-mercaptobenzoic acid (MBA), bovine serum albumin (BSA), N-(3-Dimethylaminopropyl)-N′-ethylcarbodiimide hydrochloride (EDC), Tween-20, and Tween-80 were purchased from Sigma-Aldrich (St. Louis, MO, USA). Triton X-100 was produced by PanReac AppliChem (Barcelona, Spain). Sodium dodecylsulphate (SDS) and cetyltrimethylammonium bromide (CTAB) were obtained from MP Biomedicals (Eschwege, Germany). All salts for buffer solutions were sourced from Chimmed (Moscow, Russia). All chemicals were of analytical grade and used without further purification. The nitrocellulose membrane (CNPH-90), absorbent pad (AP045), and conjugate pad (PT-R7) were purchased from MDI membrane technologies (Ambala, India). Aqueous metal ions solutions (Hg2+, Cd2+, As3+, Cu2+, Pb2+, Sn2+, Sb3+, Ni2+, Ba2+, Ca2+, Mg2+, Co2+, Fe3+, and Pb2+) were obtained from the Center of Standardization of Samples and High-Purity Substances (St. Petersburg, Russia) and prepared by stepwise dilution of a 1000 ng/mL stock solution.

2.2. Instrumentation and Measurements

The sizes of AuNPs were characterized by transmission electron microscopy (TEM) using model JEM CX-100 microscope (Jeol, Japan) operated at an accelerating voltage of 80 kV. Prior to TEM measurements, a drop of the sample was placed on a copper grid. Absorption spectra were recorded with a UV-2450 spectrophotometer (Shimadzu, Japan). The shaker Intelli-Mixer (ELMI, Riga, Latvia) was exploited for the incubation of Tween-20-stabilized AuNPs. The Fourier transform infrared (FTIR) spectra were recorded in the range of 400–4000 cm−1 using a FT/IR-6700 FTIR spectrophotometer (JASCO, Tokyo, Japan) at room temperature. The Raman measurements were carried out on a Raman spectrometer Senterra (Bruker, Ettlingen, Germany) with a 10x microscope objective. Finally, SERS spectra were recorded at 785 nm excitation with laser power of 1 mW. The integration time was 4 s, and the spectra were collected over three scans.

2.3. Synthesis of BSA–MSA Conjugate

The conjugate was synthesized according to the protocol [37], where MSA was taken in excess and the molar ratio of hapten to protein was approximately 400:1. Then, 10 mg of MSA was dissolved in 2.25 mL 0.1 M citrate buffer pH 4.0, and a 450 μL aliquot was mixed with 200 μL BSA solution (10 mg/mL in water). Thereafter, 10 mg of EDC was added to the mixture. The reaction mixture was incubated with continuous stirring for 2 h at room temperature. The prepared conjugate was diluted two times with phosphate-buffered saline (PBS, pH 7.4, 10 mM) and purified three times through Amicon-30 membranes (Merck Millipore, Cork, Ireland) for 15 min at 6500× g.

2.4. Gold Nanoparticles Synthesis and Surface Modification

The synthesis of AuNPs of different sizes was carried out by the citrate-mediated reduction of HAuCl4 [38]. Briefly, gold nanoparticles were prepared as follows: 100 mL of 0.01% chloroauric acid was heated to boiling and various amounts of 1% sodium citrate solution (3.75 mL, 2 mL, and 1.5 mL) were added to obtain AuNPs. The reaction mixture was kept boiling for 15 min. The synthesized AuNPs were stored at 4 °C before use and preparation of Tween-20-stabilized AuNPs. Prior to stabilization step, fresh-synthesized AuNPs were centrifuged at 5000× g for 15 min and washed with Milli-Q water three times to remove unreacted products. The surface modification of the synthesized AuNPs was carried out according to a previously published technique [39,40] with slight modifications. 10 μL of 10% Tween-20 was added to 1 mL of synthesized AuNPs and the mixture was incubated for 1 h at room temperature. Finally, Tween-20-stabilized AuNPs were centrifuged for 15 min at 4500× g and re-suspended in 100 μL of deionized water. The obtained Tween-20-stabilized AuNPs remained stable for 3 months under proper conditions (+4 °C, glass).

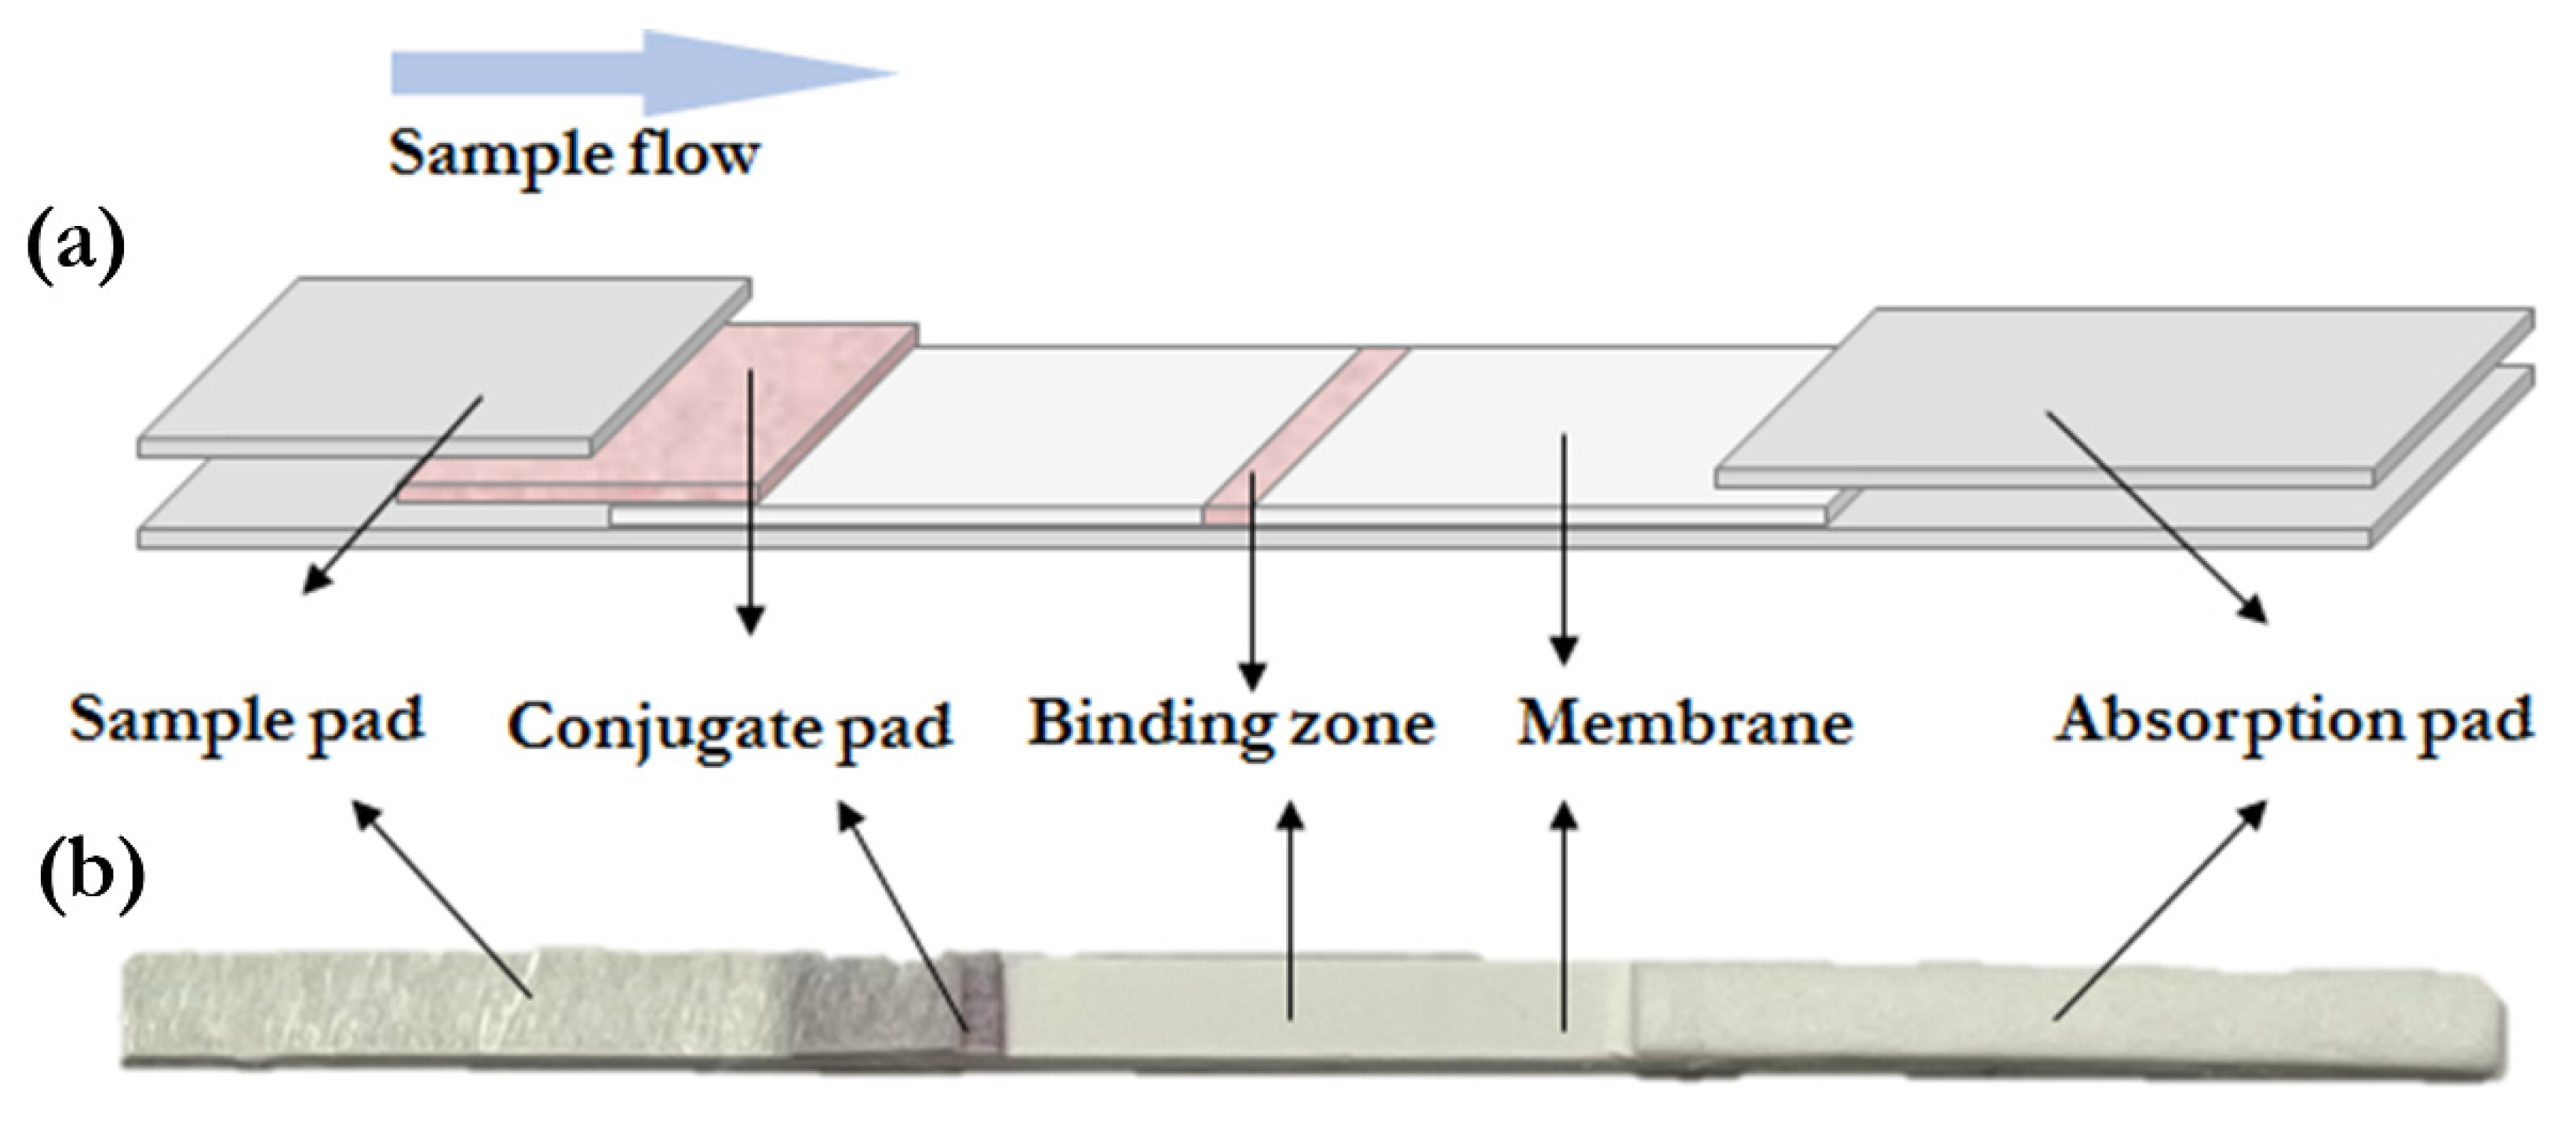
2.5. Fabrication of Lateral Flow Tests

The prepared lateral flow test illustrated in Scheme 1 consisted of the following porous constituents: the sample pad (to intake the analyzed mixture), conjugate pad (to release Tween-20–AuNPs conjugate), absorbent pad (to remove excess reagents and provide the movement of the sample by capillary forces), and nitrocellulose working membrane (the place containing the binding zone).
To form a test zone, a BSA–MSA conjugate (0.1; 0.2; 0.5; 1.0 mg/mL in 10 mM PBS) was applied to a nitrocellulose membrane using an IsoFlow dispenser (“Imagene Technology”, Hanover, NH, USA). Nitrocellulose membranes were dried at 37 °C for 3 h. The stock solution of Tween-20-stabilized AuNPs (OD 4.5) was absorbed onto a glass fiber conjugate pad.

2.6. Colorimetric Detection of Hg2+ Ion Using Lateral Flow Test

The determination of Hg2+ ions was carried out at room temperature. Solutions with different concentrations of Hg2+ ions were prepared in 0.1 M citrate buffer (pH 4.0) containing 1% Tween-20. To perform the colorimetric assay, test strips were immersed in 100 μL of Hg2+ solution and, after that, the test strips were allowed to dry on a horizontal surface at room temperature. The qualitative result was evaluated by the naked eye 11 min after the sample application. The digital images of the test zone were also acquired using a CanoScan 9000F scanner (“Canon”, Tokyo, Japan) and quantified by the TotalLab TL120 software package (Nonlinear Dynamics, Newcastle, UK).

2.7. Analysis of Real Water

Water samples were collected from different regions of the Russian Federation. According to ICP-MS data, all samples were reliably free of mercury. Before measurements, samples of spring and waterfall water were filtered through a syringe filter with a pore size of 0.2 μm (Sartorius, Göttingen, Germany) and acidified to a pH of about 5.0 with 1 M HNO3 in order to eliminate the matrix effect and achieve the optimal conditions for analysis. Then, the water samples were spiked with known concentrations of Hg2+ and analyzed by the developed test system.

2.8. ICP-MS Detection Technique

The elements to be analyzed by ICP-MS were as follows: Al, As, B, Ca, Cd, Co, Cr, Cu, Fe, Hg, I, K, Li, Mg, Mn, Na, Ni, P, Pb, Se, Si, Sn, Sr, V, and Zn. The content of chemical elements in water was determined using an Agilent 7700x ICP-MS spectrometer (Santa Clara, CA, USA). Multielement standard solutions IV-ICPMS-71A, IV-STOCK-10, CMS-3 (Inorganic Ventures, NJ, USA), 8500-6948 (Agilent, Santa Clara, CA, USA), GSO 7681-99, 7836-2000, 7620-99, 8004-93 (Ekroshim LLC, Saint Petersburg, Russia), 7018-93 (TsSOVV LLC, Moscow, Russia), and 7771-2000 (ECO-analytica LLC, Moscow, Russia) were used.

3. Results and Discussion

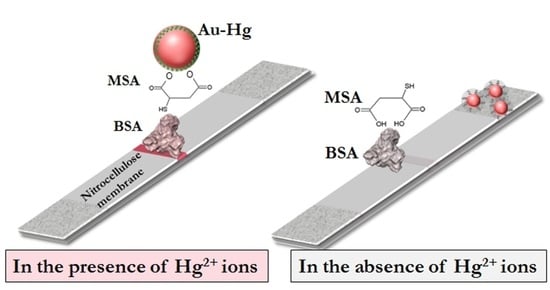
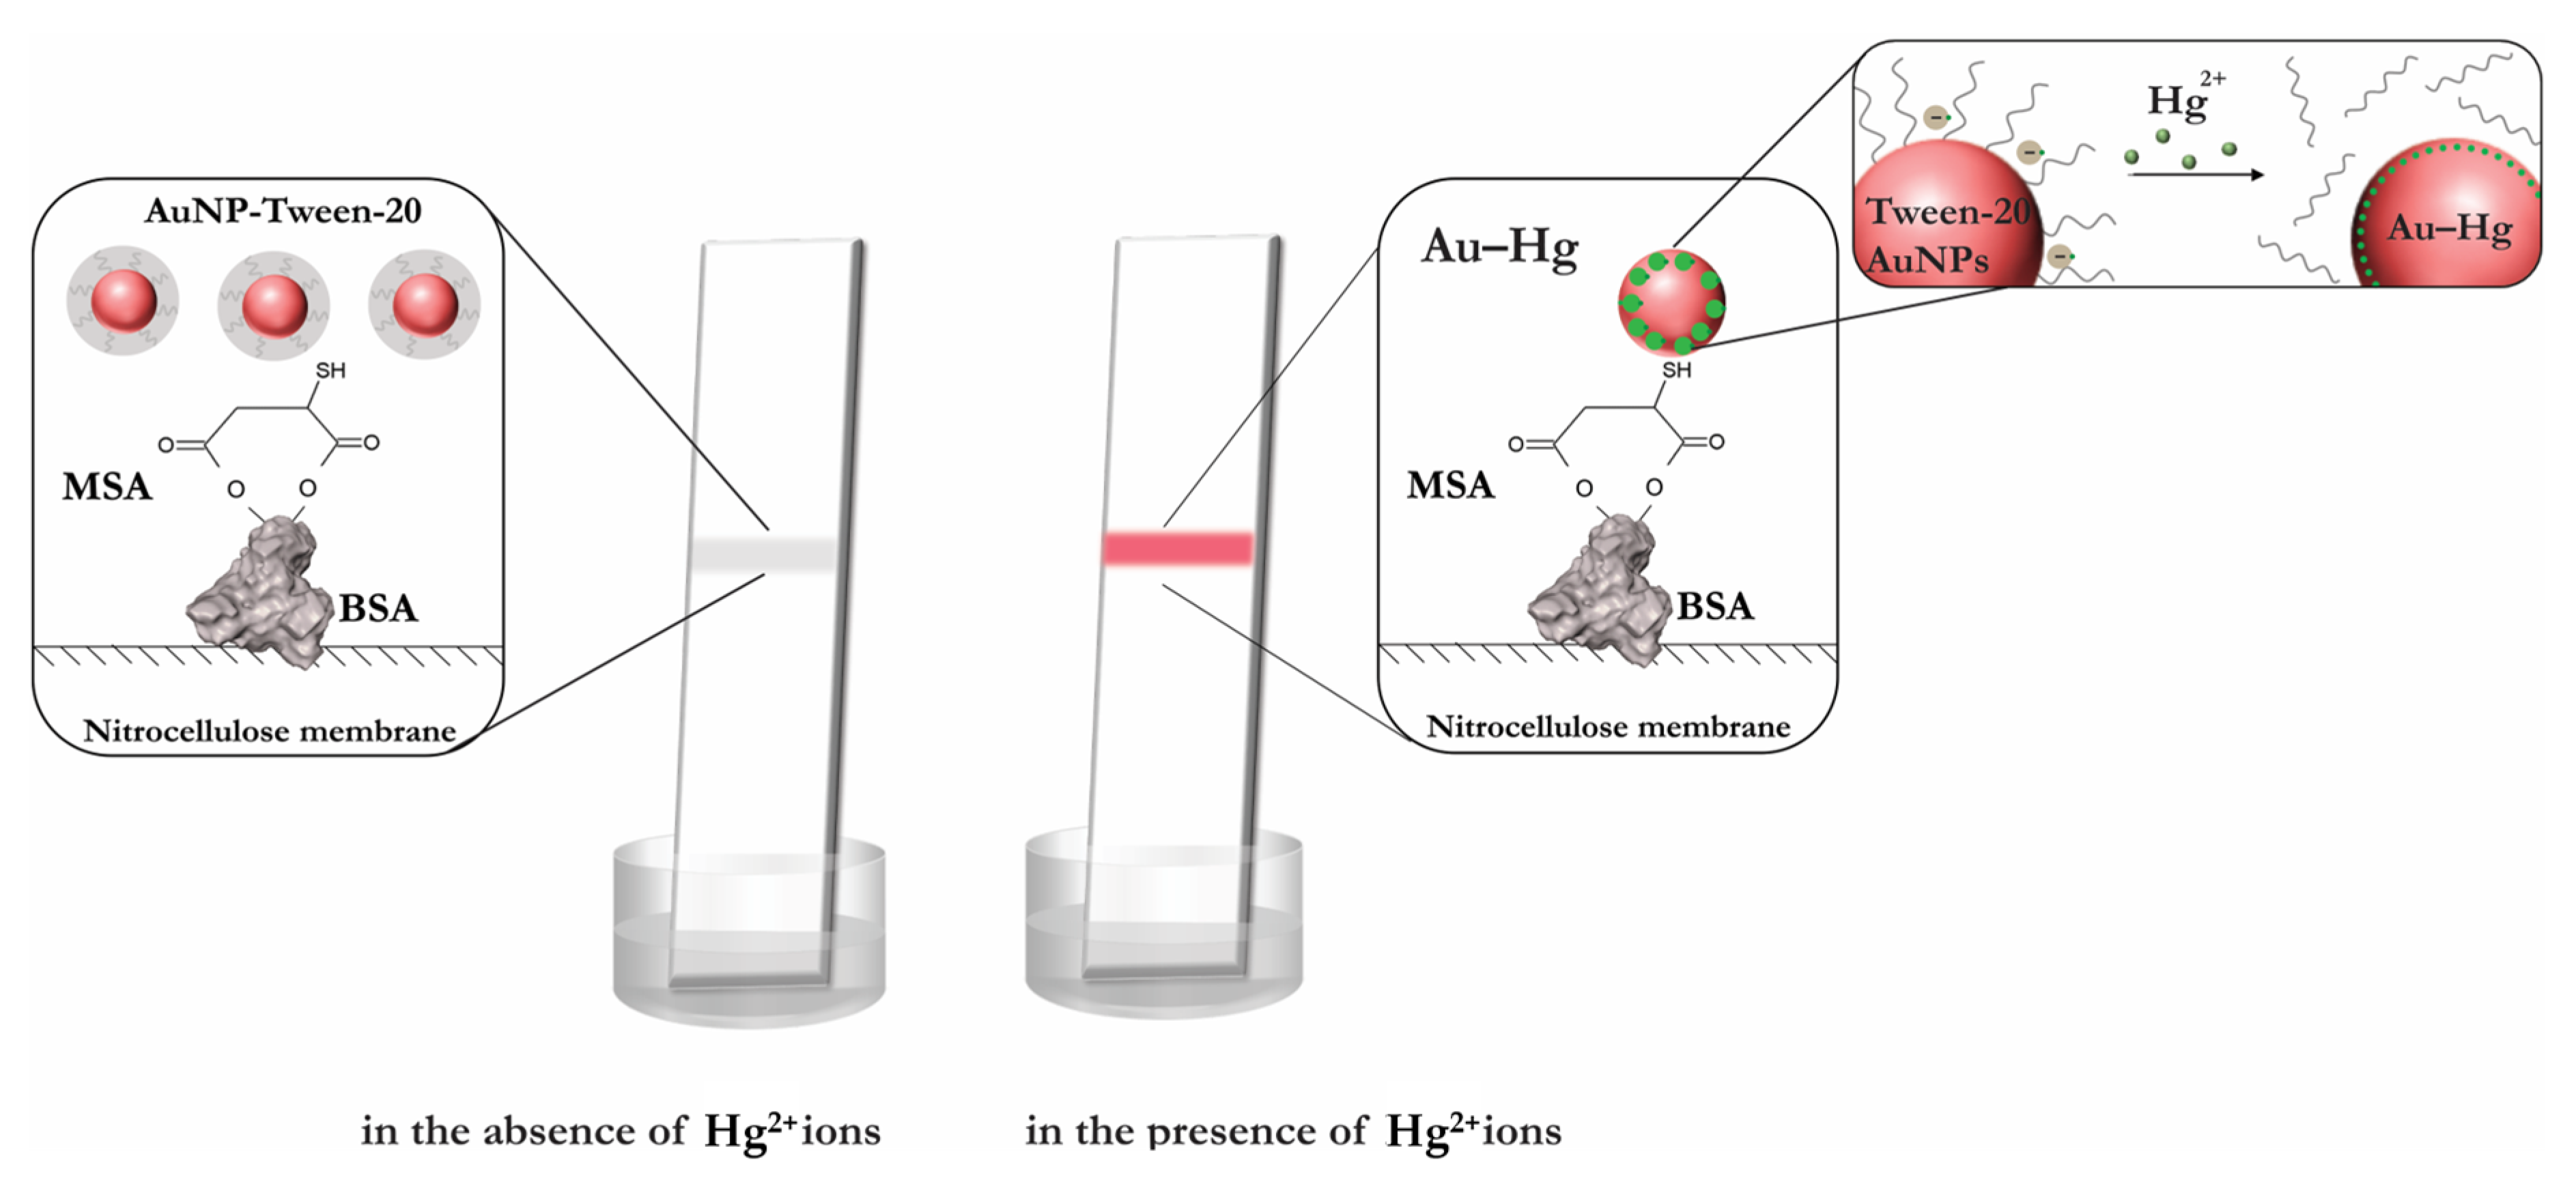
3.1. Principle of Hg2+ Sensing

The principle of Hg2+ determination using the lateral flow test is based on the reduction of mercury ions on the surface of AuNPs with the formation of Au–Hg nanoalloys [27,41]. The accumulation of AuNPs in the test zone of the strip occurs due to the metal-ligand coordination chemistry. The scheme of colorimetric Hg2+ sensing is displayed in Figure 1. In this study, citrate-capped AuNPs stabilized with Tween-20 were immobilized on a conjugate pad. The need to stabilize the nanoparticles is due to the fact that citrate-capped AuNPs in the absence of Hg2+ bind in the test zone of the strip due to the formation of Au–S bonds with BSA–MSA, resulting in a false positive response on the test strip. In turn, the modification of AuNPs with an excess of Tween-20 prevents the formation of the Au–S bond [42]. In this work, the stabilization of gold nanoparticles by Tween-20 molecules is not a ligand-substituting reaction, since weakly adsorbed oligo(ethylene glycol) fragments of Tween-20 only sterically protect the nanoparticles from aggregation, slowing down the removal of the negative charge from the surface upon interaction with the thiol group of mercaptosuccinic acid.
To initiate the detection process, the test strips were immersed in a solution containing a certain amount of Hg2+. During the migration of the analyzed solution along the test strip citrate ions on the AuNP surface provide the reduction of Hg2+ to Hg0 [43]. The transformation of Hg2+ to metallic mercury led to the formation of Au–Hg nanoalloys. The formed Au–Hg nanoalloys continued to move along the strip to the test zone, where they were captured by the BSA–MSA conjugate due to the high affinity of thiol groups of MSA toward Au–Hg [44]. The result of binding was the formation of a red band in the test zone of the strip. In the absence of Hg2+, Tween-20-stabilized AuNPs passed by the test zone of the strip due to the good surface stabilization of the nanoparticles.

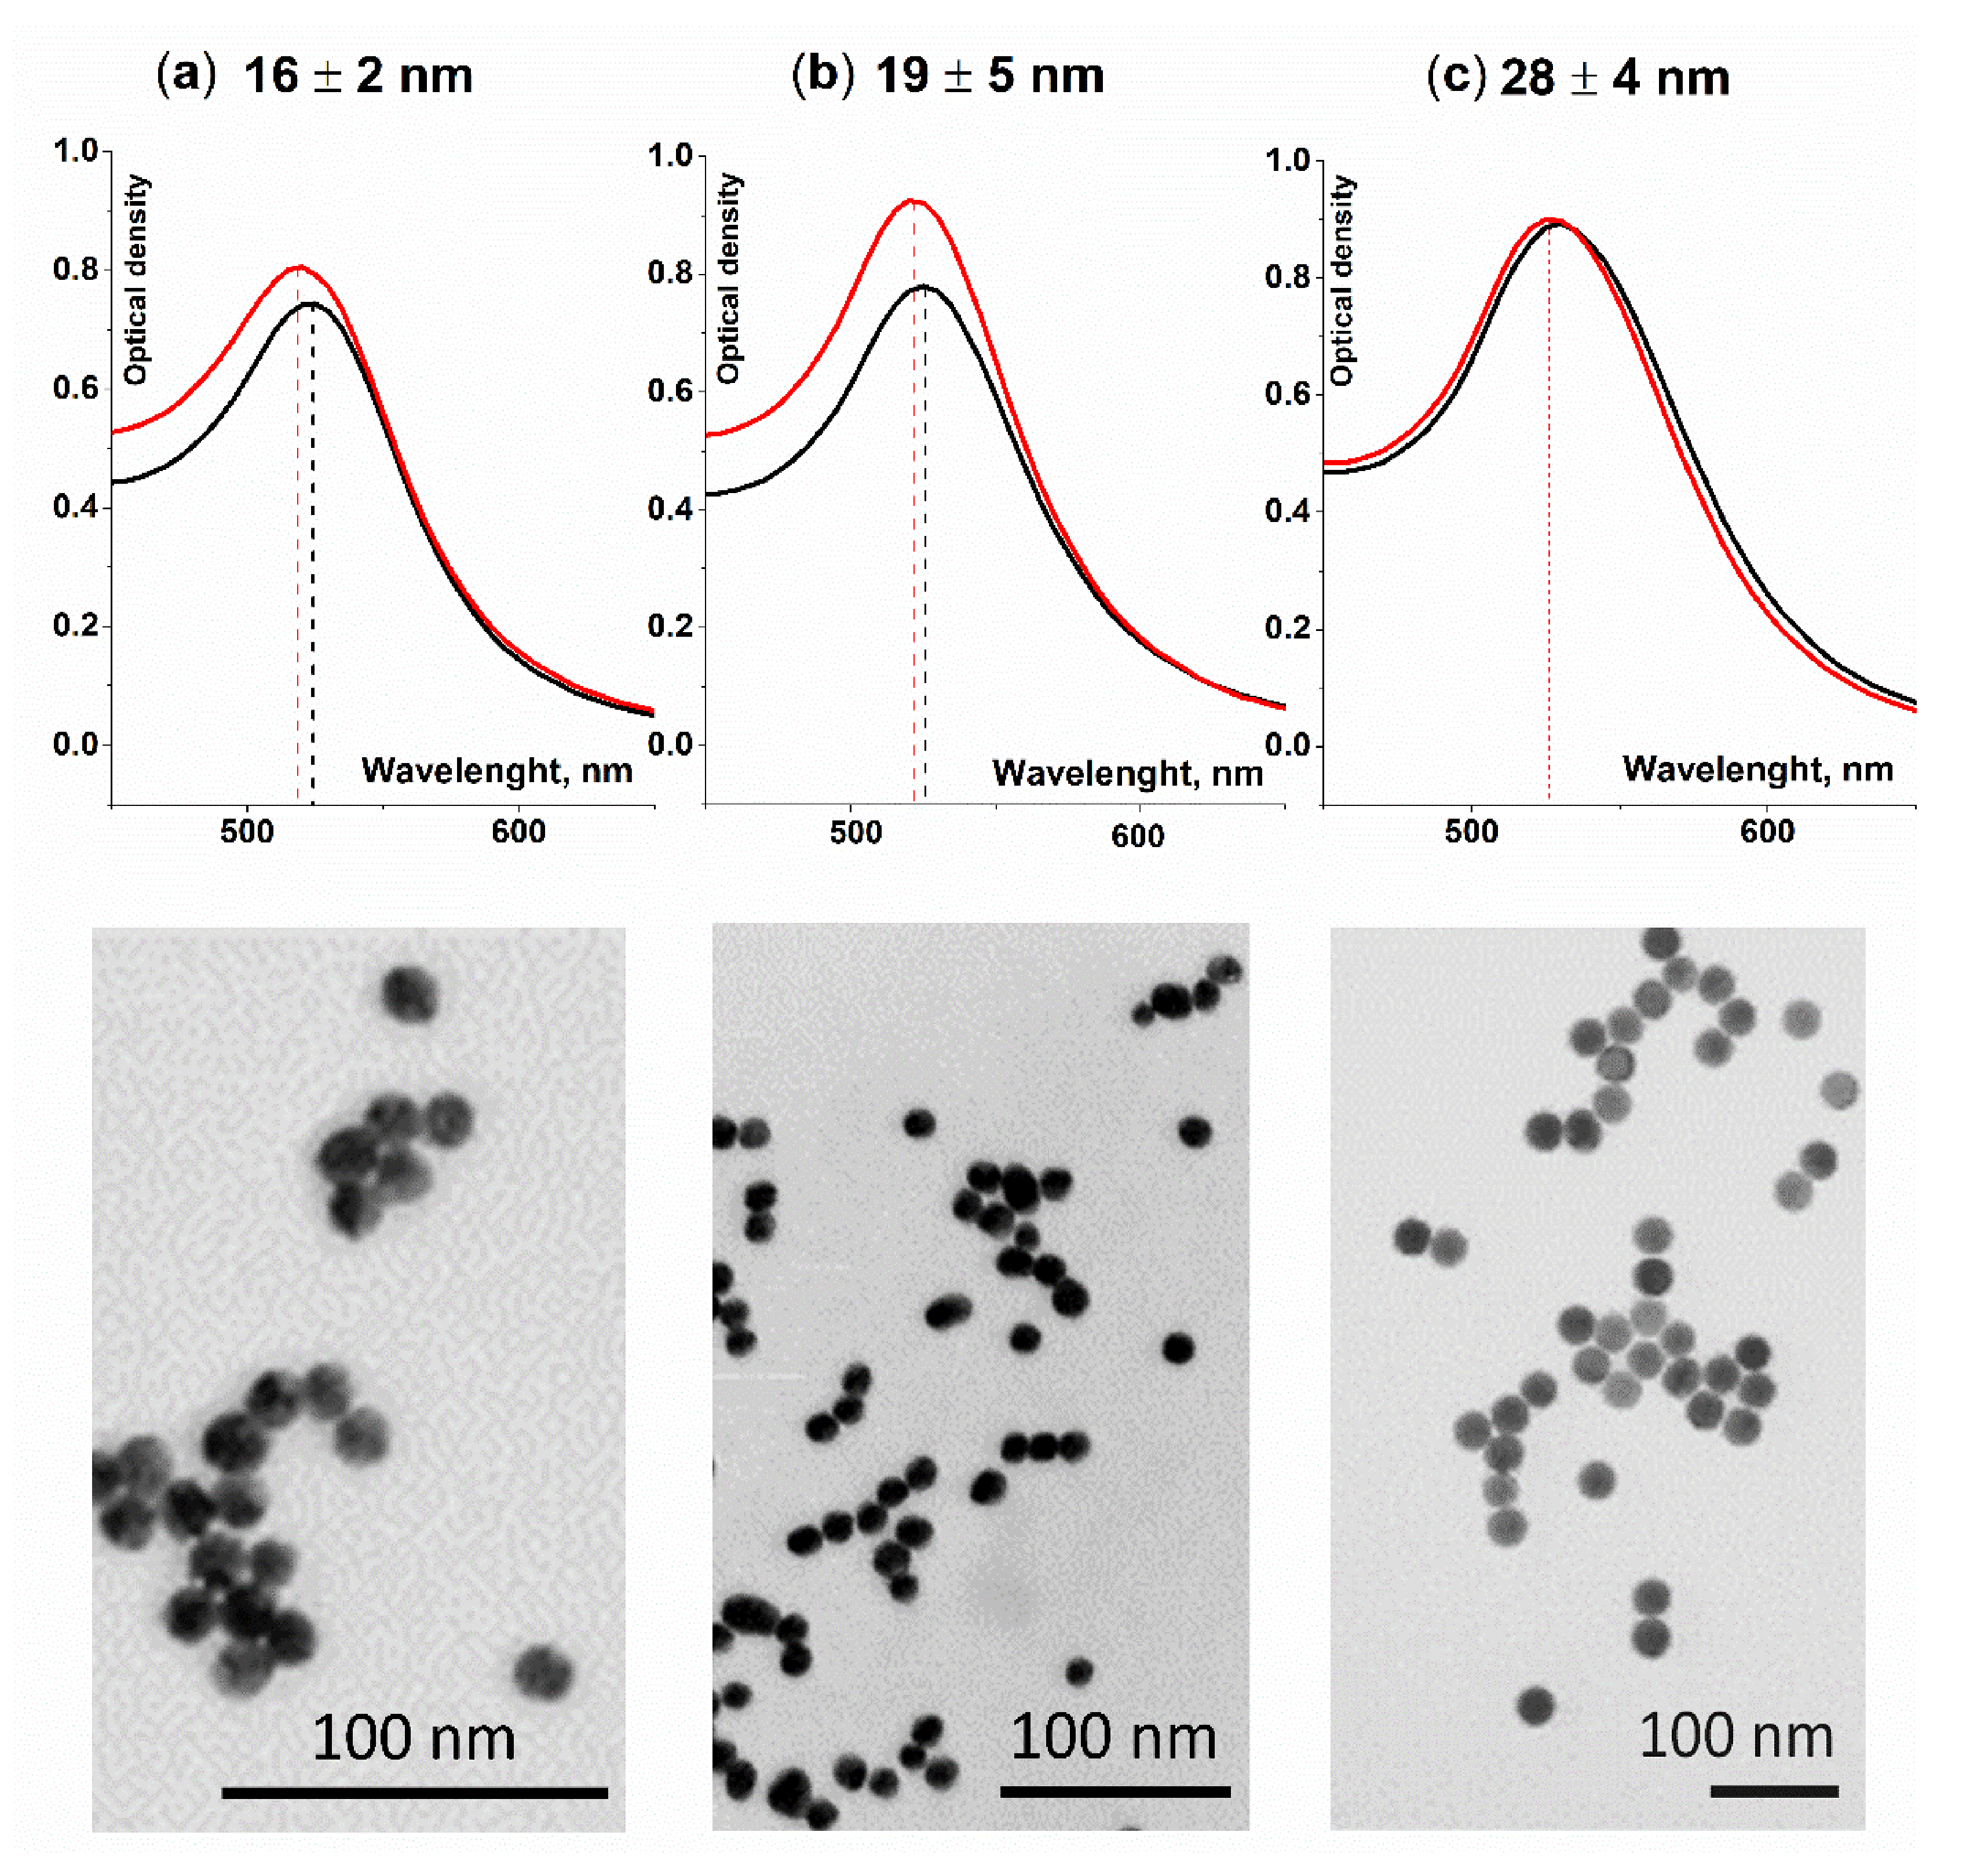
3.2. Characterization of Detecting Agent

To investigate the effect of nanoparticle size on detection performance, citrate-capped AuNPs with three different diameters were synthesized. The TEM images demonstrated a monodisperse distribution of spherical nanoparticles with average diameters of 16 ± 2, 19 ± 5, and 28 ± 4 nm (Figure 2). The AuNPs were further modified with Tween-20 to ensure stability and to prevent aggregation under acidic conditions [45,46], which are optimal for Au–Hg nanoalloy formation [47,48]. To confirm the success of the modification, the absorption spectra of the AuNPs after the addition of Tween-20 were collected. As follows from Figure 2b, the stabilized Tween-20 AuNPs show no significant shift (less than 4 nm), which indicates a lack of aggregates. Tween-20-stabilized AuNPs obtained by this method have good stability against conditions of high ionic strength, which was a necessary condition for the development of this approach.

3.3. Confirmation of Au–Hg Nanoalloy Formation

To confirm the reduction of Hg2+ on the AuNP surface, SERS spectra collected from the test zone of the lateral flow strip in the presence/absence of Hg2+ were obtained. It has previously been described that the formation of an Au–Hg nanoalloy can change the morphology of the nanoparticles and, consequently, reduce the SERS signal from a detectable molecule adsorbed on the AuNP surface [49,50,51]. In this study, AuNPs were modified with mercaptobenzoic acid (MBA) as a Raman reporter. For this purpose, 10 µL of a 5 mM MBA solution was added to 5 mL of citrate-capped AuNPs and incubated for 2 h at room temperature. After this, the conjugate was centrifuged at 4500× g for 15 min, and the precipitate was separated and redissolved in 100 µL of deionized water. For analysis, a test strip with pre-immobilized BSA–MSA conjugate in the test zone was immersed in a solution containing MBA-functionalized AuNPs in the presence or absence of Hg2+. In the absence of Hg2+, AuNPs bound in the test zone of the strip due to the high affinity of sulfhydryl groups to the gold surface and produced strong vibration bands at 1076 cm−1 and 1590 cm−1 in the SERS spectrum of MBA (Figure 3, red curve). In the presence of Hg2+, an Au–Hg nanoalloy first formed due to mercury reduction on the surface of AuNPs, which was then captured by the BSA–MSA in the test zone. Recording the SERS spectra in the test zone showed a decrease in signal intensity at 1076 cm−1 by almost a factor of 3 (Figure 3, green curve). The observed signal attenuation is associated with a change in the electromagnetic enhancement of AuNPs as a result of interaction with Hg2+. Thus, the detection mechanism based on Au–Hg formation allows for a lateral flow analysis of Hg2+ in water.

3.4. Synthesis and Characterization of BSA–MSA Conjugate

The synthesis of the BSA–MSA conjugate was carried out according to the carbodiimide method [37]. Here, MSA is a type of ligand (LH3) containing two carboxylic (–COOH) and one thiol functional group (–SH); however, three of these dissociating protons can be used in the modification of protein molecules [52]. At pH 2.0–3.0 MSA exists as LH3 and is successively deprotonated as pH increases. At a pH of about 3–4, the LH2− form an extent of 90% predominates [52], at which point the deprotonated carboxyl groups of MSA will bind to the amino groups of the protein, and the presence of a free thiol group will provide further formation of a complex with the metal. Therefore, first, the COOH-groups of the MSA were activated in the presence of EDC at pH 4.5, and then the intermediate was coupled to the primary amino groups of the carrier protein. The prepared BSA–MSA conjugate showed λmax at 280 nm in the absorption spectrum (Figure 4a), which corresponds to the absorption maximum of the carrier protein since the contribution of MSA to absorption was not detected due to the lack of functional groups in this spectral range. However, it makes possible to determine the content of the carrier protein in the resulting conjugate from the recorded absorption spectra, which was 6.4 mg/mL.
Due to the absence of chromophore groups in the structure of MSA in the UV-visible range, the characterization and confirmation of conjugate structure were supplemented by the investigation of the FTIR spectra of MSA–BSA. As follows from Figure 4b, the most pronounced characteristic IR peaks of pure MSA at 1680, 1420, 1300, and 671 cm–1 refer to C=O stretching vibrations, COO-symmetric vibrations, C–O stretching vibrations, and C–S vibrations [53]. The differences between the IR spectra of pure and conjugated MSA are obvious. Thus, the retention of the peak at 1172 cm–1 (C–S vibrations) in the IR spectrum of BSA–MSA, as well as the formation of a band at 1053 cm–1 (C–H stretching vibrations), [54] indicate the formation of a bond between the amino groups of BSA and carboxyl groups of MSA. The characteristic amide I and amide II bands of BSA (C=O and N–H stretching vibrations) at about 1640 cm−1 and 1532 cm−1, correspondingly, persisted after conjugation of the protein with MSA. Thus, the spectral data confirm the formation of conjugated bonds between carboxy groups of MSA and amino groups of BSA, as well as the presence of a free thiol group involved in the binding of the metal ions.

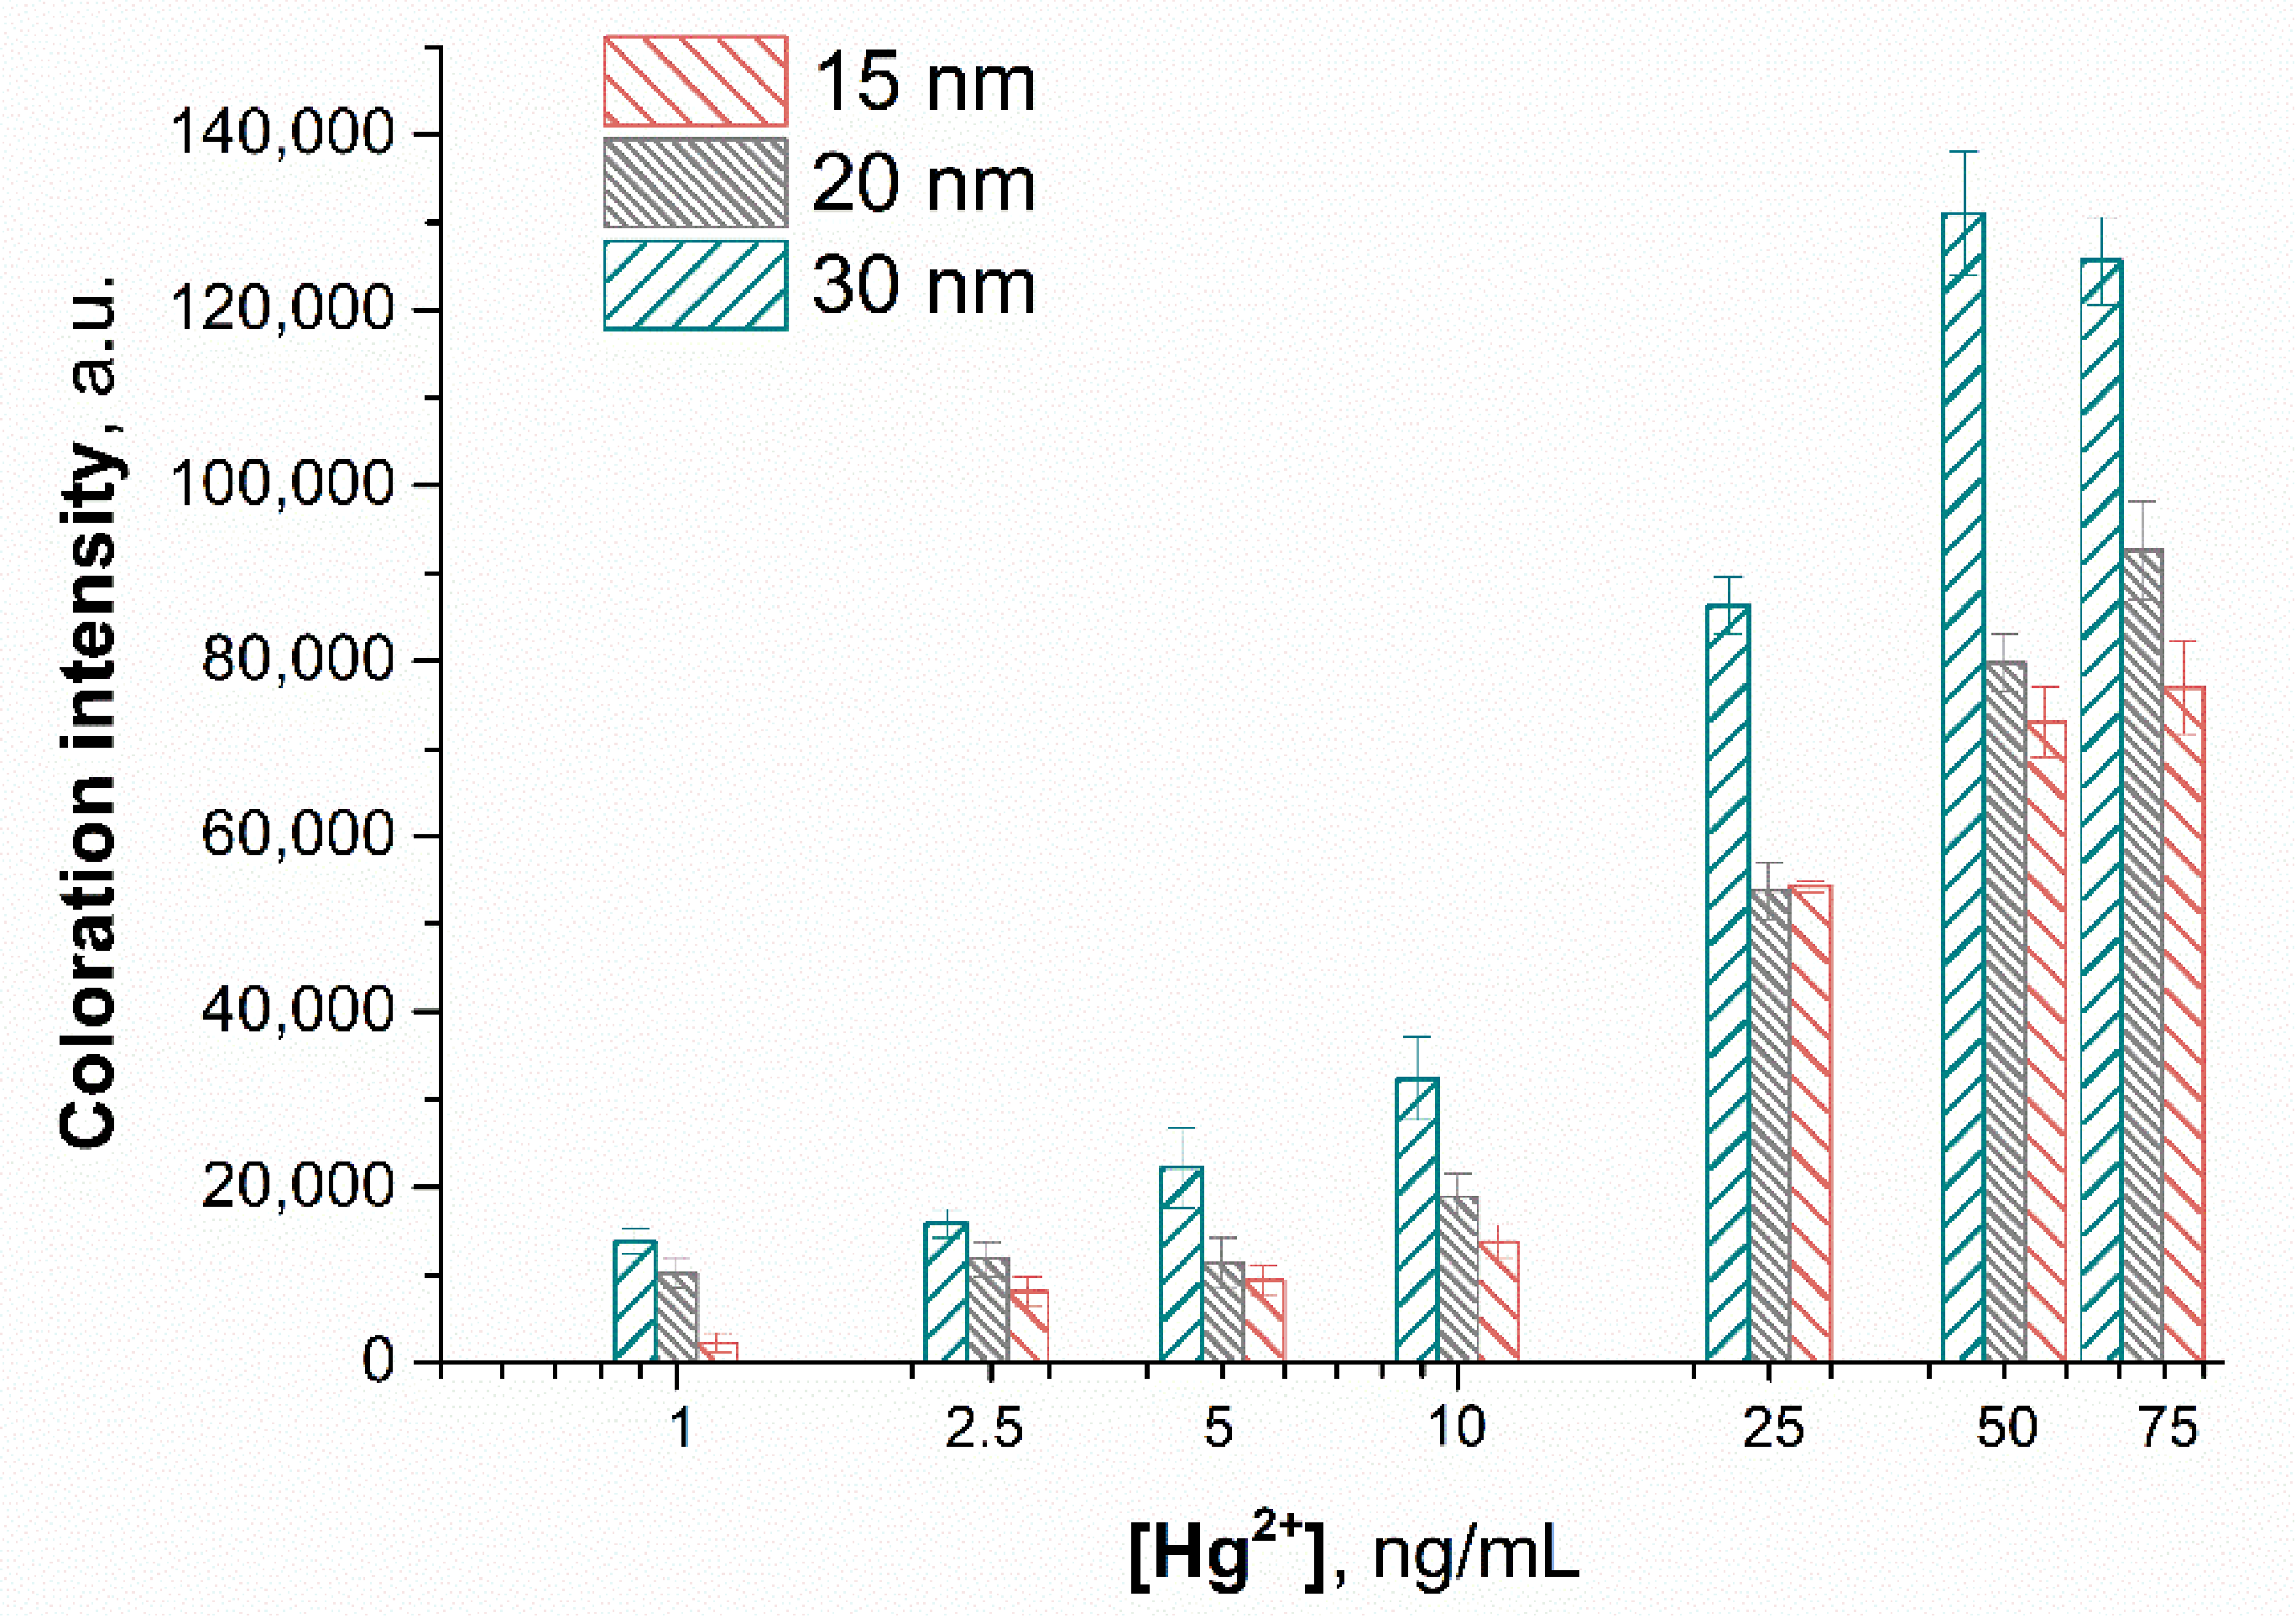
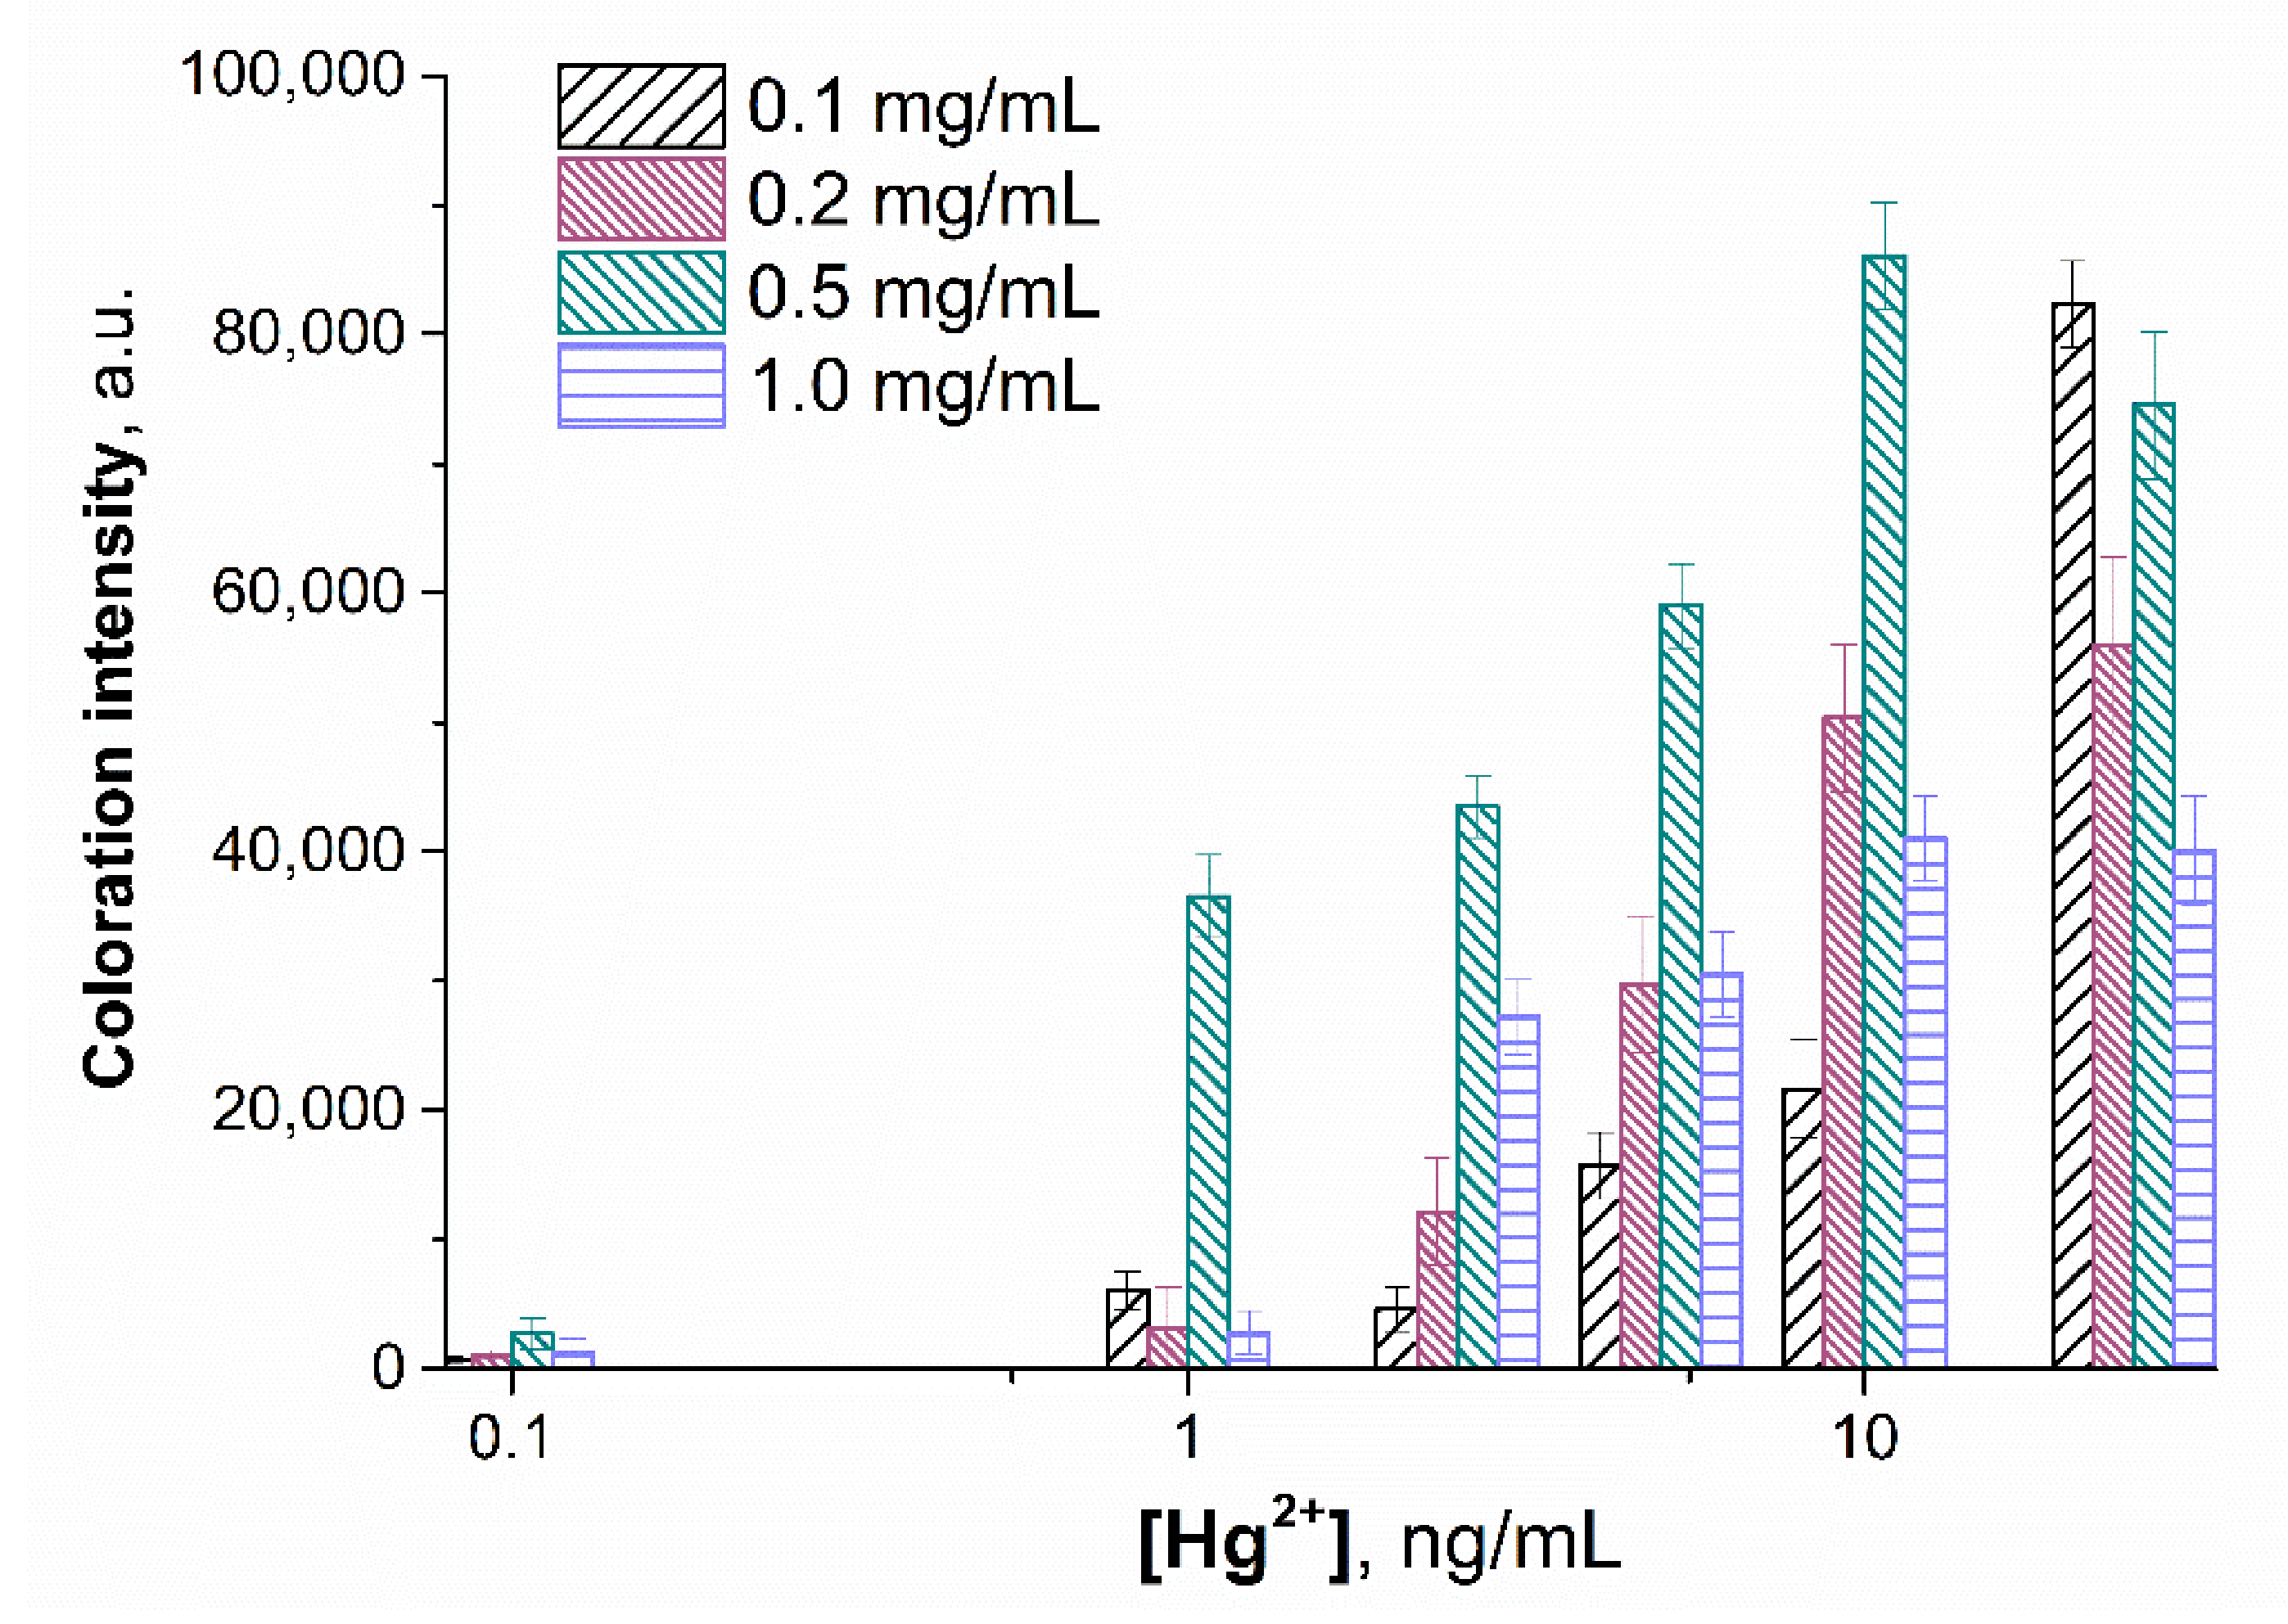
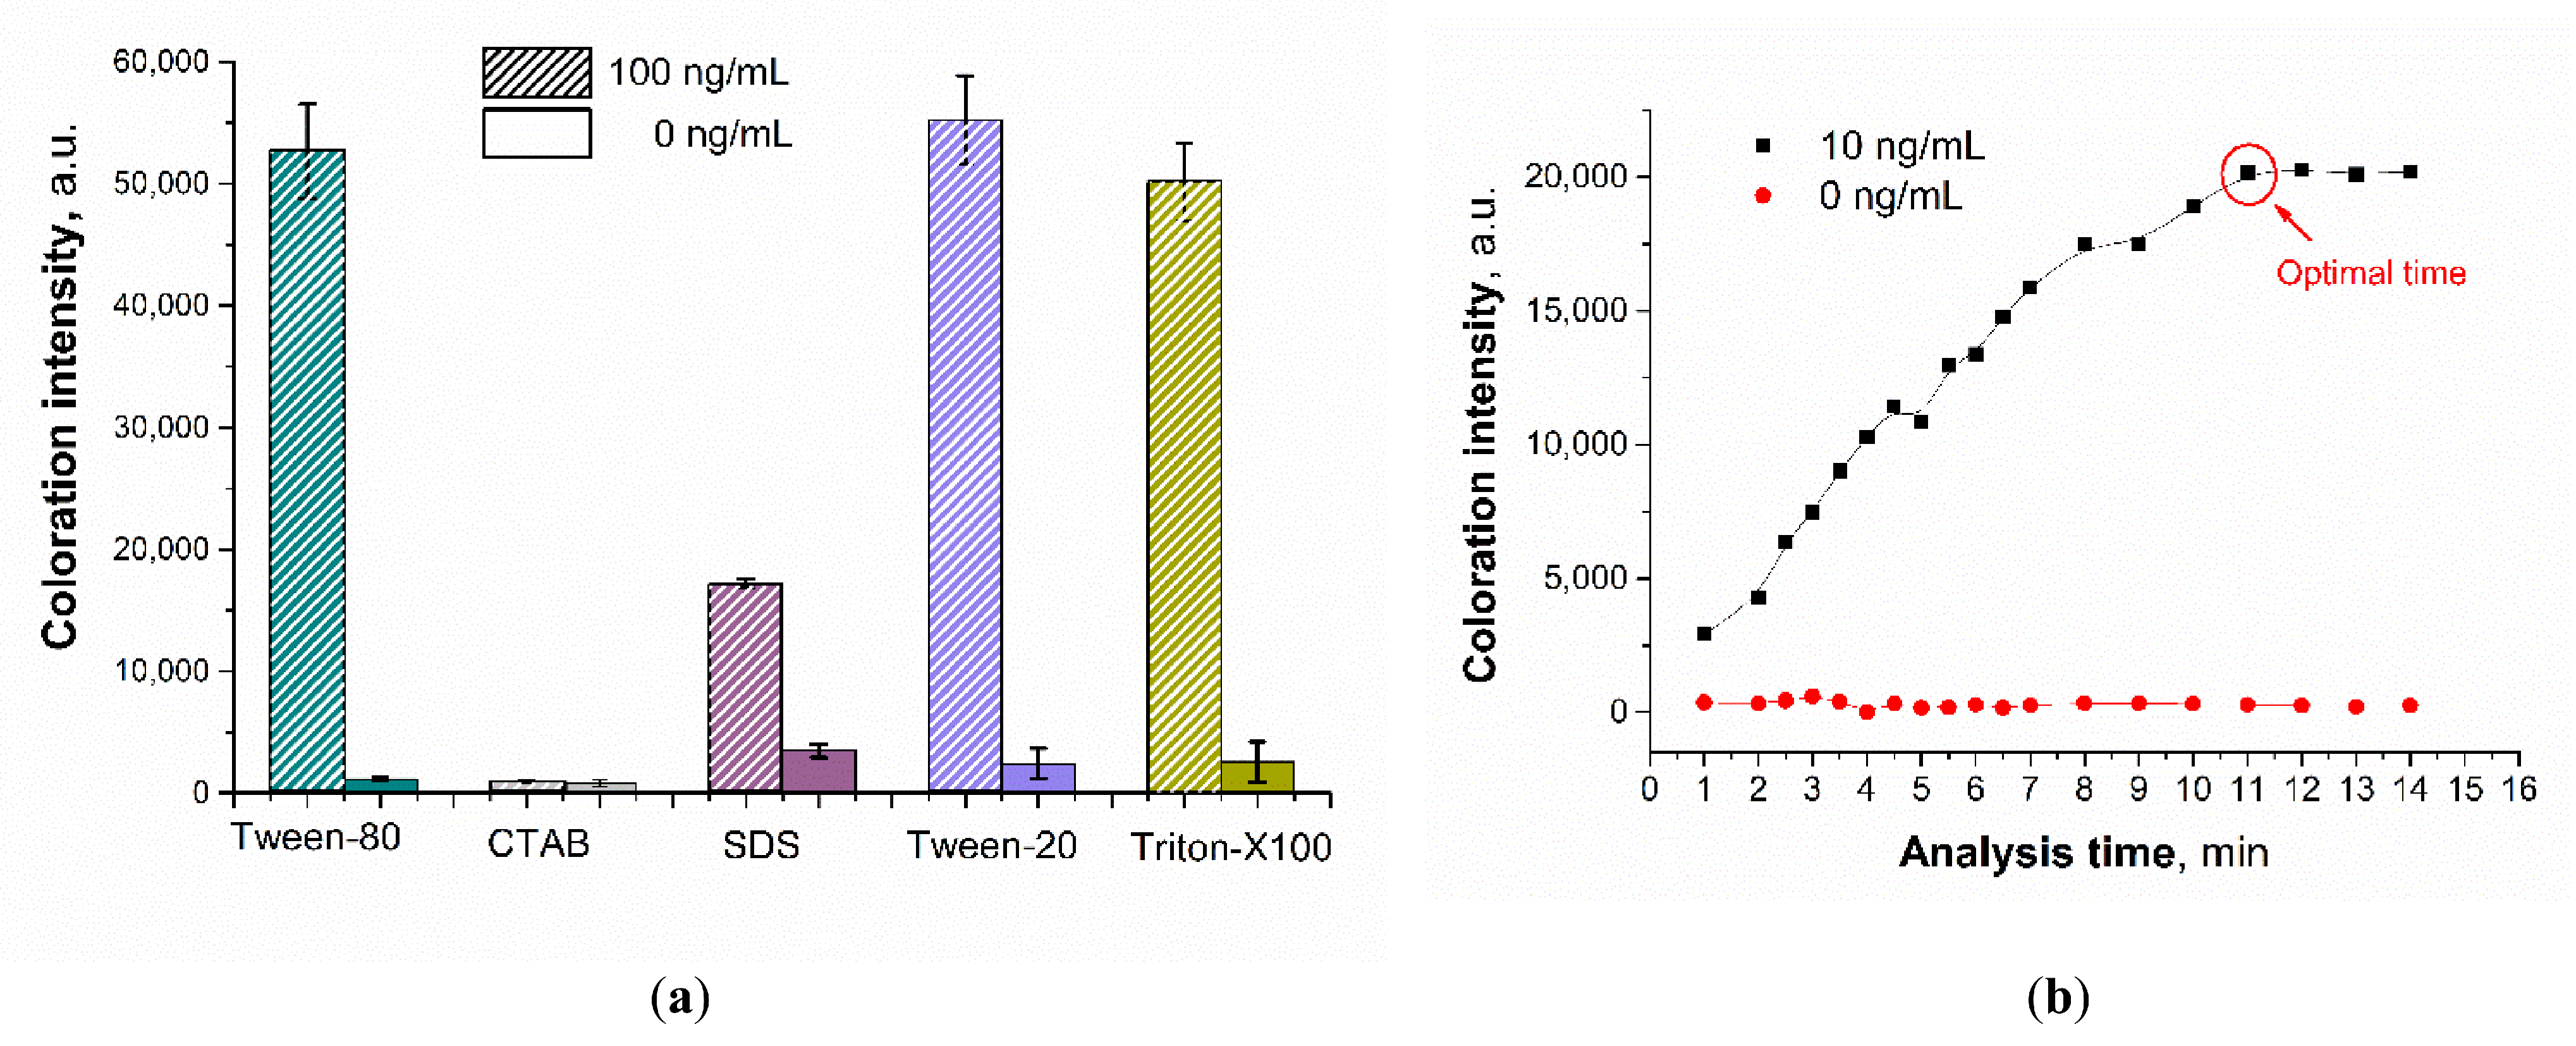
3.5. Optimization of the Sensing Parameters

The performance of the lateral flow test for Hg2+ detection was optimized through investigation of the following parameters: (i) the size of AuNPs, (ii) concentration of BSA–MSA applied to the test zone, (iii) composition of the running buffer, and (iv) the color development time. Previously, the importance of AuNP size for the analytical performance of lateral flow tests was noticed [55]. To study the effect of nanoparticle size, AuNPs with a diameter of 15, 20, and 30 nm were used to prepare the detecting agent. Comparison of the detection limits calculated from the calibration curves (Figure 5) showed that the detection limit is an order of magnitude lower (0.2 ng/mL) when using 30 nm AuNPs compared to smaller nanoparticles (4.4 ng/mL and 1.2 ng/mL for 15 nm and 20 nm AuNPs, respectively). In addition, the use of AuNPs with a diameter of 30 nm made it possible to significantly increase the signal intensity. Therefore, the study was continued with 30 nm AuNPs, which provided better sensitivity for Hg2+ detection.
Next, the concentration of BSA–MSA applied to the test zone varied from 0.1 to 1 mg/mL (Figure 6). The detection limit practically did not change up to 0.5 mg/mL of BSA–MSA; however, a further increase in the concentration of the capping agent caused a decrease in the color intensity of the test zone and, subsequently, an increase in the value of the detection limit. As shown in Figure 6, lateral flow strips containing 0.5 mg/mL of BSA–MSA generated the deepest coloration intensity in the test zone compared with those containing a smaller amount of conjugate with no significant difference in background signal. Based on the results obtained, 0.5 mg/mL of BSA–MSA was selected as the optimal concentration that provides the best analytical performance.
The choice of an appropriate detergent in the running buffer that ensures uniform sample migration across the membrane of the test strip, as well as leaching of the detection agent from the conjugate pad, while not interfering with its binding to the analyte, is an important step in optimizing the lateral flow test. In this study ionic (anionic SDS and cationic CTAB) and common non-ionic (Tween-20, Tween-80, Triton-X100) detergents were investigated and compared. When CTAB was added to the working buffer, the movement of the front of the reaction mixture through the membrane was hindered, resulting in the absence of a signal (Figure 7a). The addition of SDS to the running buffer resulted in a slow development of staining of the test zone and weak signal intensity after completion of the movement. In this case, it took 30 min after adding the sample for the color in the test zone to fully develop, compared to 10–15 min for other detergents. On the contrary, when using non-ionic surfactants, there was a good color intensity in the test zone in positive samples and no signal in the negative control. The common non-ionic detergents are Tweens with various chain lengths (20, 40, 60, 80, etc.) and Tritons. In our work, comparison of non-ionic surfactants was carried out using Tween-20, Tween-80, and Triton-X100. The use of Triton-X100 as a stabilizer can lead to the aggregation of nanoparticles when salt solutions with high ionic strength are applied [56], which increases the risk of a false positive signal in the binding zone. In the group of surfactants such as Tweens, chain length has a significant effect on the properties of nanoparticles (20, 40, 60, and 80). According to the previous studies, when comparing Tweens 20, 40, and 60 [57] as capping agents for AuNPs, an increase in the length of the detergent chain led to self-assembly of nanoparticles in the chain, as well as a change in the geometry of the molecule and the formation of clusters. Therefore, based on the experimental data and the data described in the literature [56,57], further studies were carried out with a running buffer containing Tween-20.
Before testing the performance of the lateral flow test, the dependence of the color intensity of the test zone on analysis time after the addition of 10 ng/mL Hg2+ was investigated and compared with a negative control. Figure 7b shows that saturation of the test zone was observed 11 min (as indicated in the figure) after the test strip was immersed in the analyzed sample. Thus, summarizing the results of the studies, the optimal conditions for Hg2+ detection are 30 nm AuNPs, 0.5 mg/mL BSA–MSA, acidic conditions with the addition of 1% Tween-20 to the analyzed solution, and an analysis time of 11 min.

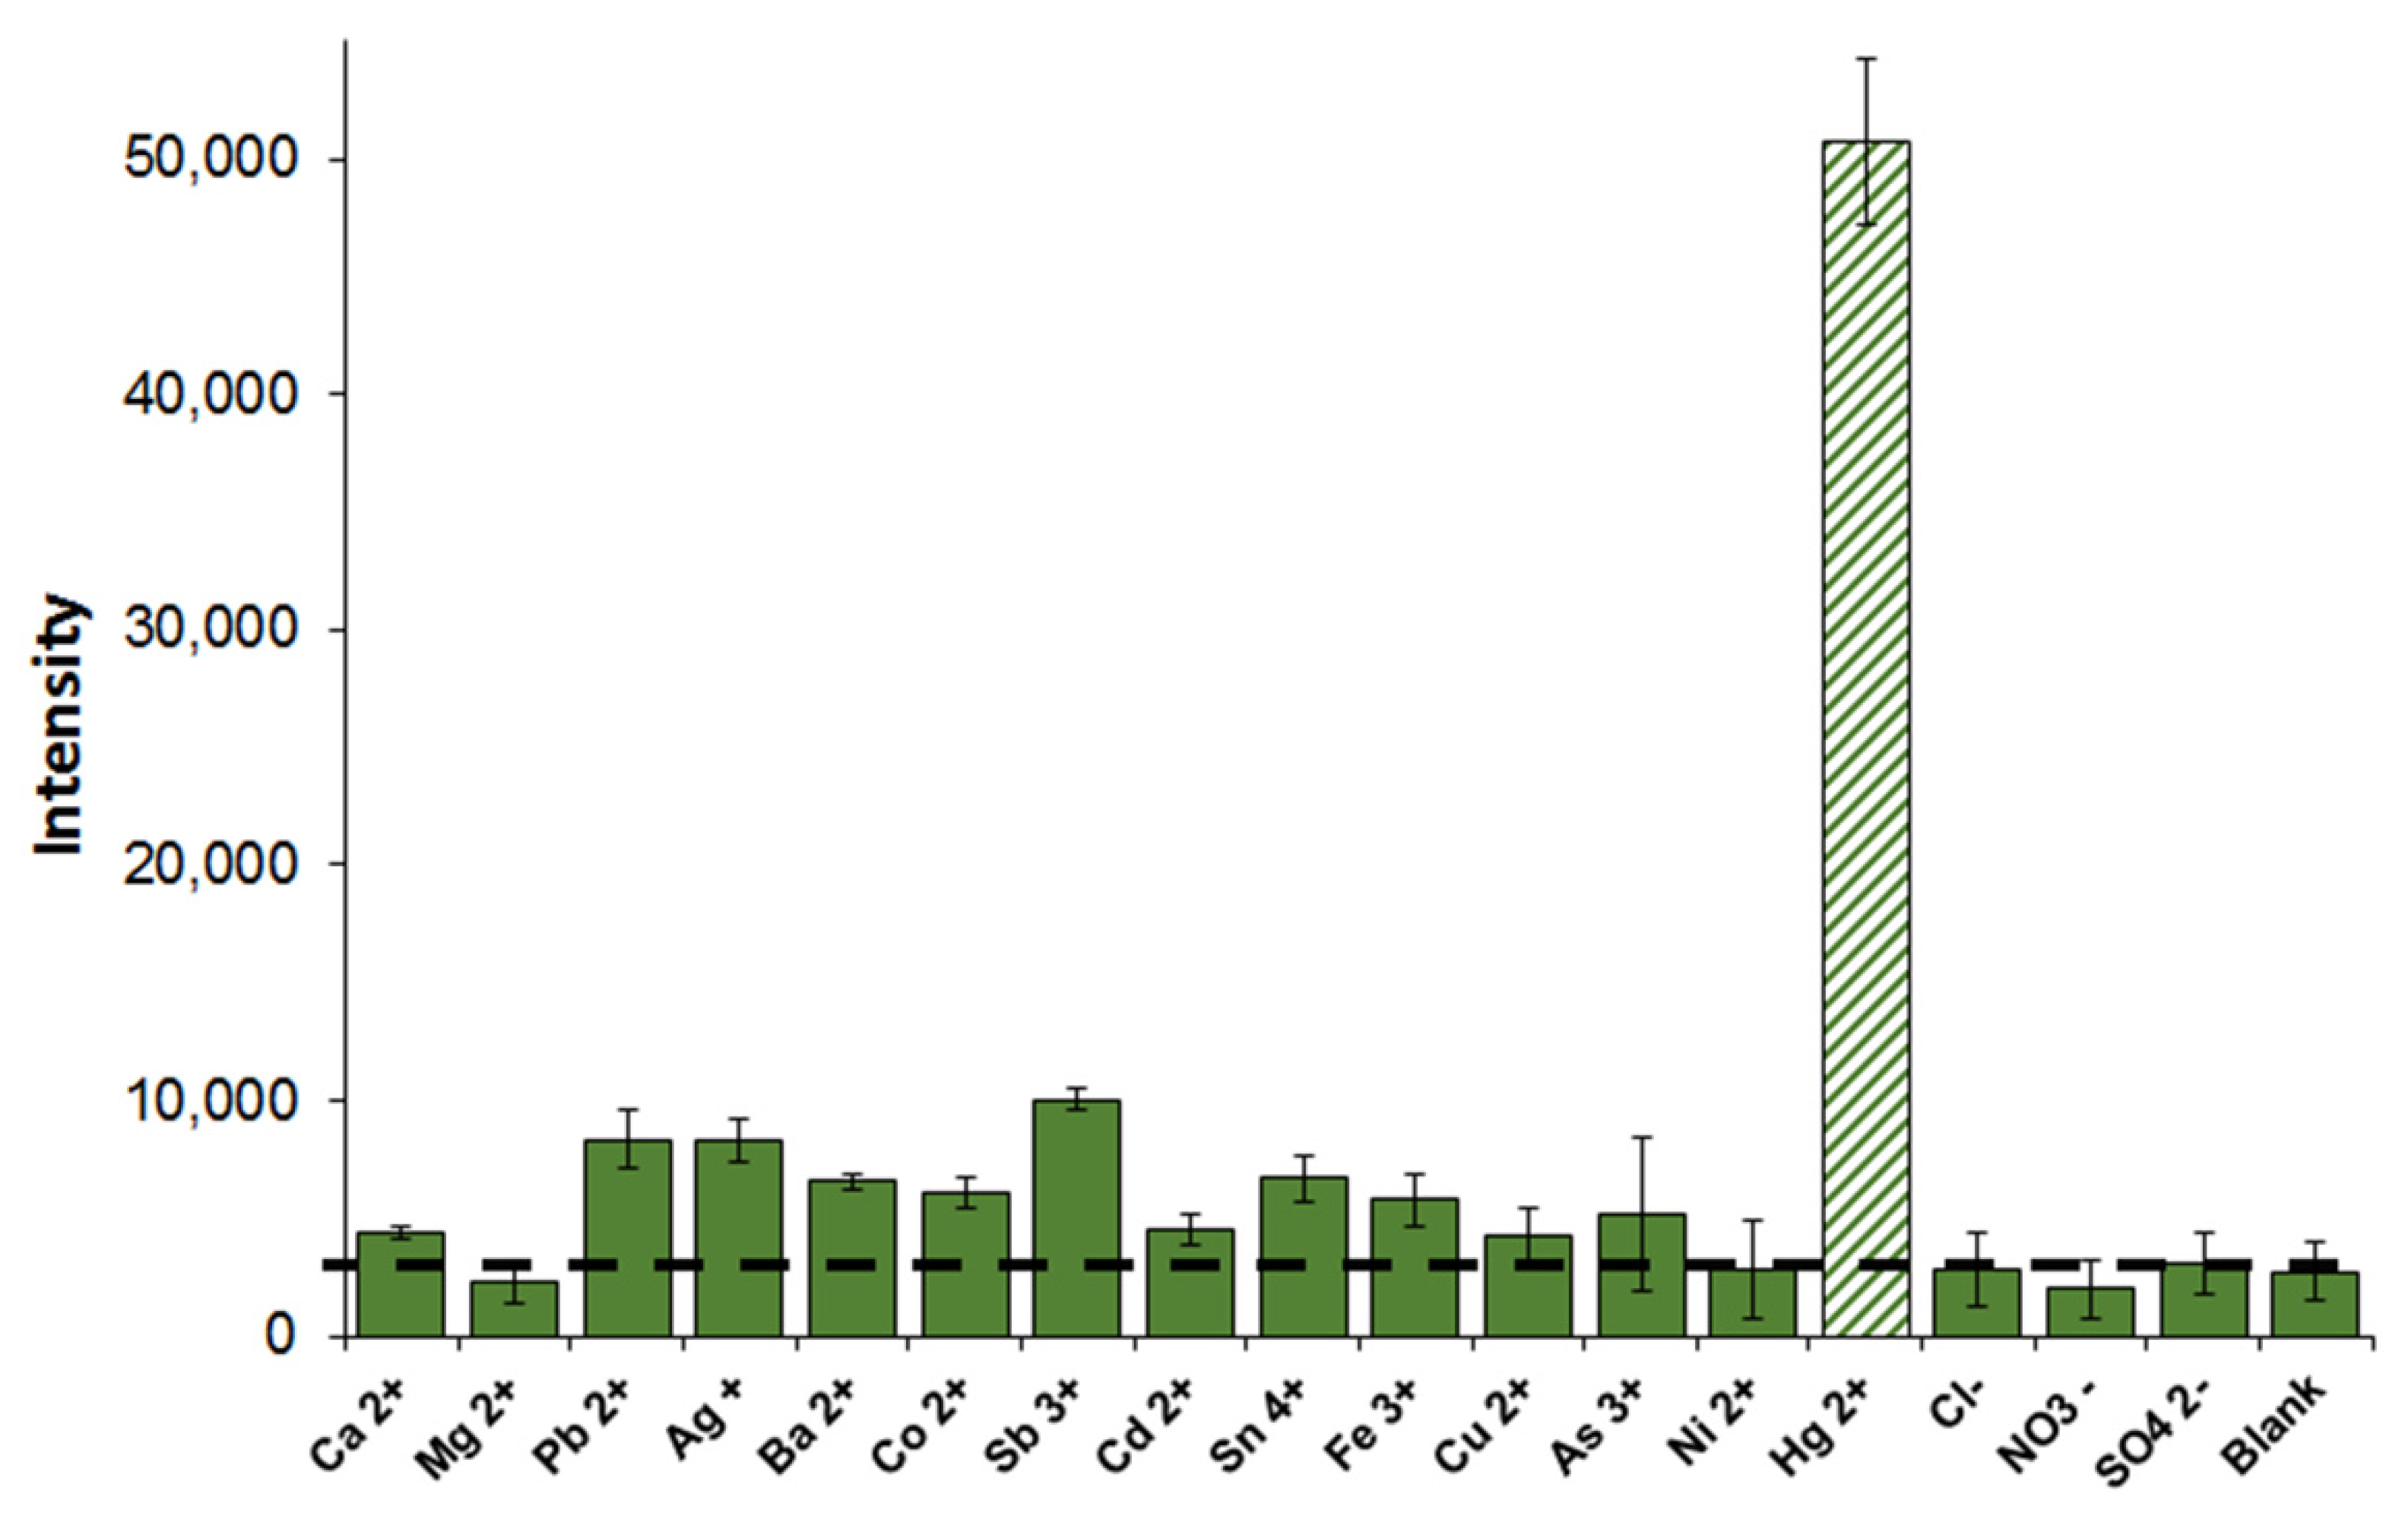
3.6. Sensitivity and Selectivity

Under the optimized conditions, sample solutions containing different concentrations of Hg2+ were tested. Figure 8 shows a calibration curve with a linear range of the color intensity (R2 0.985) in the concentration range from 0.04 to 25 ng/mL, which is described by the equation y = 514 + 2074x. The limit of detection of the proposed lateral flow test for the determination of Hg2+ ions was calculated by 3σ and amounted to 0.13 ng/mL (0.64 nM), which is lower than the value recommended by the WHO for drinking water [58]. Table 1 summarizes point-of-use membrane-based methods for the determination of Hg2+ in water. Among these assay formats, the proposed lateral flow test shows superior performance compared to almost all similar methods, with a detection limit well below the WHO-recommended mercury levels in drinking water. In addition, compared with instrumental methods [59,60], this lateral flow test eliminates multiple operation steps and the use of expensive equipment. Taken together, these advantages increase the practicality of the proposed test for the analysis of water samples. Thus, the linear dependence of this calibration curve in the range of low concentrations makes it possible to quantitatively determine Hg2+. However, once saturation is reached at higher concentrations (greater than 30 ng/mL), a semi-quantitative analysis can be performed (Figure 8, inset) by the presence of a colored band on the membrane, indicating a high concentration of Hg2+ in the sample.
At the next stage, the selectivity of the lateral flow test for the detection of Hg2+ in the presence of other metal ions was tested. The color intensity in the test zone was recorded after incubation with 100 ng/mL of Hg2+. At the same time, the color intensity in the test area was recorded after incubation of the test strips in a solution containing 100 ng/mL of other potentially toxic ions, such as Pb2+, Ag+, Ba2+, Co2+, Sb3+, Cd2+, Sn4+, Fe3+, Cu2+, As3+, and Ni2+, as well as ions present in high concentrations in water (Ca2+, Mg2+, Cl-, NO3-, and SO42−). As shown in Figure 9, no significant changes in color intensity are observed when other ions are analyzed by the lateral flow test. In contrast, in the presence of Hg2+, an average nine-fold increase in color intensity in the test zone was recorded, which confirms the high specificity of the lateral flow test. These results are attributed to the specificity of the Au–Hg interaction due to high binding energies resulting in Au–Hg nanoalloy formation [27,48], as well as the further formation of strong bonds between the thiol groups of MSA and the mercury.
The developed lateral flow test provides a number of advantages for out-of-lab mercury determination, such as rapidity (analysis takes 11 min) and ease of testing (by immersing the test strip in solution) in a small sample volume (100 µL) with a high analytical performance (detection limit is 0.13 ng/mL).

3.7. Water Sample Analysis

To study the applicability of the lateral flow test to the analysis of real water samples, spring and waterfall water was collected. According to the results of the standard reference method of ICP-MS (Table S1, Supplementary Materials), the selected samples did not contain Hg2+. Therefore, water samples were spiked with Hg2+ and analyzed by the proposed lateral flow test. Figure 10 displays the photo images of the test strips after application of different concentrations of Hg2+ ranging from 0 to 50 ng/mL. With an increase in the Hg2+ concentration, an increase in the color intensity in the test zone is observed, which makes it possible to perform a semi-quantitative analysis of real water samples. The red band is detected with the naked eye when the Hg2+ content of the water is as low as 1 ng/mL or 4.8 nM. Analytical recoveries were within acceptable limits of 113–120% and 70–100% (Table 2) for spring water and a waterfall, respectively. Thus, the proposed lateral flow test offers a promising tool for the simple and on-site determination of Hg2+ in real water samples.

4. Conclusions

In conclusion, this study combines the principles of ligand–metal interaction and Au–Hg nanoalloy formation into a rapid colorimetric lateral flow test format for the determination of mercury in water. Tween-20-stabilized AuNPs proved to be a selective detecting probe for Hg2+ over other interfering metal ions. The optimal conditions for assay performance, including the concentration of capping agent, the size of AuNPs in the detecting agent, running buffer, and analysis time were established. Due to the high specificity of the detecting agent and the high affinity of MSA for the metal, a superior sensitivity toward Hg2+ has been achieved, which exceeds the WHO requirements for a safe content of mercury in water. Compared to instrumental methods, this lateral flow test enables one-step on-field determination of Hg2+ without complex sample pretreatment and equipment. The high recovery rates from the spiked waterfall and spring water verify the effectiveness of the proposed lateral flow test and its potential for water quality monitoring and management in resource-limited areas.

Supplementary Materials

The following supporting information can be downloaded at: https://www.mdpi.com/article/10.3390/chemosensors10100413/s1, Table S1: ICP-MS test results of spring and waterfall water samples.

Author Contributions

Conceptualization, N.S.K., K.V.S. and A.N.B.; methodology, A.N.B.; software, N.S.K.; validation, N.S.K. and K.V.S.; formal analysis, N.S.K.; investigation, N.S.K. and K.V.S.; resources, N.S.K., K.V.S. and A.N.B.; data curation, A.N.B. and A.V.Z.; writing—original draft preparation, N.S.K.; writing—review and editing, K.V.S., A.N.B. and A.V.Z.; visualization, N.S.K.; supervision, B.B.D.; project administration, A.V.Z. and B.B.D.; funding acquisition, N.S.K. and B.B.D. All authors have read and agreed to the published version of the manuscript.

Funding

This work was financially supported by the Russian Science Foundation (Grant No. 22-23-00859).

Informed Consent Statement

Informed consent was obtained from all subjects involved in the study.

Data Availability Statement

Not applicable.

Acknowledgments

The measurements were carried out on the equipment of the Shared-Access Equipment Centre “Industrial Biotechnology” of Federal Research Center “Fundamentals of Biotechnology” Russian Academy of Sciences. Optical measurements were performed using core research facilities of Center of the Collective Equipment of the N.N. Semenov Federal Research Center for Chemical Physics (No. 506694). The authors are grateful to N.Y. Saushkin from Chemical Faculty, M.V. Lomonosov Moscow State University (Moscow, Russia) for the support with water samples analysis by ICP-MS.

Conflicts of Interest

The authors declare no conflict of interest.

References

  1. Gworek, B.; Dmuchowski, W.; Baczewska-Dąbrowska, A.H. Mercury in the terrestrial environment: A review. Environ. Sci. Eur. 2020, 32, 128. [Google Scholar] [CrossRef]
  2. Obrist, D.; Kirk, J.L.; Zhang, L.; Sunderland, E.M.; Jiskra, M.; Selin, N.E. A review of global environmental mercury processes in response to human and natural perturbations: Changes of emissions, climate, and land use. Ambio 2018, 47, 116–140. [Google Scholar] [CrossRef] [Green Version]
  3. Boening, D.W. Ecological effects, transport, and fate of mercury: A general review. Chemosphere 2000, 40, 1335–1351. [Google Scholar] [CrossRef]
  4. US EPA. National Primary Drinking Water Regulations. Esdat Environmental Database Management Software. 2009. Available online: https://www.esdat.net/Environmental%20Standards/US/Federal/US%20Federal%20MLCs.pdf (accessed on 7 September 2022).
  5. GOST. Mineral Natural Nutritious Waters. General Specifications; Standartinform Publication: Moscow, Russia, 2011; p. 70. [Google Scholar]
  6. World Health Organization. Guidelines for Drinking-Water Quality: Fourth Edition Incorporating the First and Second Addenda; World Health Organization: Geneva, Switzerland, 2022. [Google Scholar]
  7. Leopold, K.; Foulkes, M.; Worsfold, P. Methods for the determination and speciation of mercury in natural waters—A review. Anal. Chim. Acta 2010, 663, 127–138. [Google Scholar] [CrossRef] [PubMed]
  8. Yang, H.; Jian, R.; Liao, J.; Cui, J.; Fang, P.; Zou, Z.; Huang, K. Recent development of non-chromatographic atomic spectrometry for speciation analysis of mercury. Appl. Spectrosc. Rev. 2021, 57, 441–460. [Google Scholar] [CrossRef]
  9. Zou, C.; Liu, Z.; Wang, X.; Liu, H.; Yang, M.; Huo, D.; Hou, C. A paper-based visualization chip based on nitrogen-doped carbon quantum dots nanoprobe for Hg(II) detection. Spectrochim. Acta Part A Mol. Biomol. Spectrosc. 2022, 265, 120346. [Google Scholar] [CrossRef]
  10. Liu, Y.; Deng, Y.; Dong, H.; Liu, K.; He, N. Progress on sensors based on nanomaterials for rapid detection of heavy metal ions. Sci. China Chem. 2016, 60, 329–337. [Google Scholar] [CrossRef]
  11. Mandil, A.; Idrissi, L.; Amine, A. Stripping voltammetric determination of mercury(II) and lead(II) using screen-printed electrodes modified with gold films, and metal ion preconcentration with thiol-modified magnetic particles. Microchim. Acta 2010, 170, 299–305. [Google Scholar] [CrossRef]
  12. Moutcine, A.; Chtaini, A. Electrochemical determination of trace mercury in water sample using EDTA-CPE modified electrode. Sens. Bio-Sens. Res. 2018, 17, 30–35. [Google Scholar] [CrossRef]
  13. Lim, J.W.; Kim, T.-Y.; Woo, M.-A. Trends in sensor development toward next-generation point-of-care testing for mercury. Biosens. Bioelectron. 2021, 183, 113228. [Google Scholar] [CrossRef]
  14. Hyder, A.; Buledi, J.A.; Nawaz, M.; Rajpar, D.B.; Shah, Z.-u.-H.; Orooji, Y.; Yola, M.L.; Karimi-Maleh, H.; Lin, H.; Solangi, A.R. Identification of heavy metal ions from aqueous environment through gold, Silver and Copper Nanoparticles: An excellent colorimetric approach. Environ. Res. 2022, 205, 112475. [Google Scholar] [CrossRef] [PubMed]
  15. Kataria, R.; Sethuraman, K.; Vashisht, D.; Vashisht, A.; Mehta, S.K.; Gupta, A. Colorimetric detection of mercury ions based on anti-aggregation of gold nanoparticles using 3, 5-dimethyl-1-thiocarboxamidepyrazole. Microchem. J. 2019, 148, 299–305. [Google Scholar] [CrossRef]
  16. Tian, K.; Siegel, G.; Tiwari, A. A simple and selective colorimetric mercury (II) sensing system based on chitosan stabilized gold nanoparticles and 2,6-pyridinedicarboxylic acid. Mater. Sci. Eng. C 2017, 71, 195–199. [Google Scholar] [CrossRef]
  17. Anh, N.H.; Doan, M.Q.; Dinh, N.X.; Huy, T.Q.; Tri, D.Q.; Ngoc Loan, L.T.; Van Hao, B.; Le, A.-T. Gold nanoparticle-based optical nanosensors for food and health safety monitoring: Recent advances and future perspectives. RSC Adv. 2022, 12, 10950–10988. [Google Scholar] [CrossRef]
  18. Ali, S.; Chen, X.; Shi, W.; Huang, G.; Yuan, L.-m.; Meng, L.; Chen, S.; Xie, Z.; Chen, X. Recent Advances in Silver and Gold Nanoparticles-Based Colorimetric Sensors for Heavy Metal Ions Detection: A Review. Crit. Rev. Anal. Chem. 2021, 1–33. [Google Scholar] [CrossRef]
  19. Lee, J.-S.; Han, M.S.; Mirkin, C.A. Colorimetric Detection of Mercuric Ion (Hg2+) in Aqueous Media using DNA-Functionalized Gold Nanoparticles. Angew. Chem. Int. Ed. 2007, 46, 4093–4096. [Google Scholar] [CrossRef]
  20. Politi, J.; Spadavecchia, J.; Iodice, M.; de Stefano, L. Oligopeptide–heavy metal interaction monitoring by hybrid gold nanoparticle based assay. Analyst 2015, 140, 149–155. [Google Scholar] [CrossRef]
  21. Berlina, A.N.; Sharma, A.K.; Zherdev, A.V.; Gaur, M.S.; Dzantiev, B.B. Colorimetric Determination of Lead Using Gold Nanoparticles. Anal. Lett. 2015, 48, 766–782. [Google Scholar] [CrossRef]
  22. Su, D.; Yang, X.; Xia, Q.; Chai, F.; Wang, C.; Qu, F. Colorimetric detection of Hg2+ using thioctic acid functionalized gold nanoparticles. RSC Adv. 2013, 3, 24618–24624. [Google Scholar] [CrossRef]
  23. Yu, C.-J.; Tseng, W.-L. Colorimetric Detection of Mercury(II) in a High-Salinity Solution Using Gold Nanoparticles Capped with 3-Mercaptopropionate Acid and Adenosine Monophosphate. Langmuir 2008, 24, 12717–12722. [Google Scholar] [CrossRef]
  24. Komova, N.S.; Serebrennikova, K.V.; Berlina, A.N.; Pridvorova, S.M.; Zherdev, A.V.; Dzantiev, B.B. Mercaptosuccinic-Acid-Functionalized Gold Nanoparticles for Highly Sensitive Colorimetric Sensing of Fe(III) Ions. Chemosensors 2021, 9, 290. [Google Scholar] [CrossRef]
  25. Chadha, R.; Das, A.; Debnath, A.K.; Kapoor, S.; Maiti, N. 2-thiazoline-2-thiol functionalized gold nanoparticles for detection of heavy metals, Hg(II) and Pb(II) and probing their competitive surface reactivity: A colorimetric, surface enhanced Raman scattering (SERS) and x-ray photoelectron spectroscopic (XPS) study. Colloids Surf. A Physicochem. Eng. Asp. 2021, 615, 126279. [Google Scholar] [CrossRef]
  26. Jarujamrus, P.; Meelapsom, R.; Pencharee, S.; Obma, A.; Amatatongchai, M.; Ditcharoen, N.; Chairam, S.; Tamuang, S. Use of a Smartphone as a Colorimetric Analyzer in Paper-based Devices for Sensitive and Selective Determination of Mercury in Water Samples. Anal. Sci. 2018, 34, 75–81. [Google Scholar] [CrossRef] [Green Version]
  27. Mertens, S.F.L.; Gara, M.; Sologubenko, A.S.; Mayer, J.; Szidat, S.; Krämer, K.W.; Jacob, T.; Schiffrin, D.J.; Wandlowski, T. Au@Hg Nanoalloy Formation Through Direct Amalgamation: Structural, Spectroscopic, and Computational Evidence for Slow Nanoscale Diffusion. Adv. Funct. Mater. 2011, 21, 3259–3267. [Google Scholar] [CrossRef]
  28. Park, J.-H.; Byun, J.-Y.; Yim, S.-Y.; Kim, M.-G. A Localized Surface Plasmon Resonance (LSPR)-based, simple, receptor-free and regeneratable Hg2+ detection system. J. Hazard. Mater. 2016, 307, 137–144. [Google Scholar] [CrossRef]
  29. Jin, L.-H.; Han, C.-S. Eco-friendly colorimetric detection of mercury(II) ions using label-free anisotropic nanogolds in ascorbic acid solution. Sens. Actuators B Chem. 2014, 195, 239–245. [Google Scholar] [CrossRef]
  30. Apilux, A.; Siangproh, W.; Praphairaksit, N.; Chailapakul, O. Simple and rapid colorimetric detection of Hg(II) by a paper-based device using silver nanoplates. Talanta 2012, 97, 388–394. [Google Scholar] [CrossRef]
  31. Meelapsom, R.; Jarujamrus, P.; Amatatongchai, M.; Chairam, S.; Kulsing, C.; Shen, W. Chromatic analysis by monitoring unmodified silver nanoparticles reduction on double layer microfluidic paper-based analytical devices for selective and sensitive determination of mercury(II). Talanta 2016, 155, 193–201. [Google Scholar] [CrossRef]
  32. Hossain, S.M.Z.; Brennan, J.D. β-Galactosidase-Based Colorimetric Paper Sensor for Determination of Heavy Metals. Anal. Chem. 2011, 83, 8772–8778. [Google Scholar] [CrossRef]
  33. Berlina, A.N.; Komova, N.S.; Zherdev, A.V.; Dzantiev, B.B. Combination of phenylboronic acid and oligocytosine for selective and specific detection of lead(ii) by lateral flow test strip. Anal. Chim. Acta 2021, 1155, 338318. [Google Scholar] [CrossRef]
  34. Song, S.; Zou, S.; Zhu, J.; Liu, L.; Kuang, H. Immunochromatographic paper sensor for ultrasensitive colorimetric detection of cadmium. Food Agric. Immunol. 2018, 29, 3–13. [Google Scholar] [CrossRef] [Green Version]
  35. Liu, G.L.; Wang, J.F.; Li, Z.Y.; Liang, S.Z.; Wang, X.N. Immunoassay for cadmium detection and quantification. Biomed Env. Sci 2009, 22, 188–193. [Google Scholar] [CrossRef]
  36. He, H.; Liu, Z.; Yang, S.; Sun, C. Preparation of Anti-Cadmium-EDTA Complex Polyclonal Antibody and Its Application for Determination of Cadmium in Aqueous Solution. Anal. Lett. 2009, 42, 409–424. [Google Scholar] [CrossRef]
  37. Komova, N.S.; Serebrennikova, K.V.; Berlina, A.N.; Zherdev, A.V.; Dzantiev, B.B. Membrane analytical test system for highly sensitive determination of Hg2+ ions in natural waters. Limnol. Freshw. Biol. 2022, 5, 3. [Google Scholar] [CrossRef]
  38. Frens, G. Controlled Nucleation for the Regulation of the Particle Size in Monodisperse Gold Suspensions. Nat. Phys. Sci. 1973, 241, 20–22. [Google Scholar] [CrossRef]
  39. Liu, H.; Gan, Z.; Song, C.; Xu, B.; Guo, Z.; Zhou, X.; Chen, Z. Use of a smartphone for intelligent detection of cyromazine based on Tween 20 modified gold nanoparticles. Anal. Methods 2020, 12, 1469–1477. [Google Scholar] [CrossRef]
  40. Guo, Z.; Chen, G.; Zeng, G.; Li, Z.; Chen, A.; Yan, M.; Liu, L.; Huang, D. Ultrasensitive detection and co-stability of mercury(ii) ions based on amalgam formation with Tween 20-stabilized silver nanoparticles. RSC Adv. 2014, 4, 59275–59283. [Google Scholar] [CrossRef]
  41. Schopf, C.; Wahl, A.; Martín, A.; O’Riordan, A.; Iacopino, D. Direct Observation of Mercury Amalgamation on Individual Gold Nanorods Using Spectroelectrochemistry. J. Phys. Chem. C 2016, 120, 19295–19301. [Google Scholar] [CrossRef]
  42. Wang, M.; Chen, Z.; Jing, X.; Zhou, H.; Wang, Y.; Ye, J.; Chu, Q. Tween 20-capped gold nanoparticles for selective extraction of free low-molecular-weight thiols in saliva followed by capillary electrophoresis with contactless conductivity detection. J. Chromatogr. B 2021, 1176, 122756. [Google Scholar] [CrossRef]
  43. Ojea-Jiménez, I.; López, X.; Arbiol, J.; Puntes, V. Citrate-Coated Gold Nanoparticles As Smart Scavengers for Mercury(II) Removal from Polluted Waters. ACS Nano 2012, 6, 2253–2260. [Google Scholar] [CrossRef]
  44. Ajsuvakova, O.P.; Tinkov, A.A.; Aschner, M.; Rocha, J.B.T.; Michalke, B.; Skalnaya, M.G.; Skalny, A.V.; Butnariu, M.; Dadar, M.; Sarac, I.; et al. Sulfhydryl groups as targets of mercury toxicity. Coord. Chem. Rev. 2020, 417, 213343. [Google Scholar] [CrossRef] [PubMed]
  45. Wagers, K.; Chui, T.; Adem, S.M. Effect of pH on the Stability of Gold Nanoparticles and Their Application for Melamine Detection in Infant Formula. IOSR J. Appl. Chem. 2014, 7, 15–20. [Google Scholar] [CrossRef]
  46. Wang, A.; Ng, H.P.; Xu, Y.; Li, Y.; Zheng, Y.; Yu, J.; Han, F.; Peng, F.; Fu, L. Gold Nanoparticles: Synthesis, Stability Test, and Application for the Rice Growth. J. Nanomater. 2014, 2014, 451232. [Google Scholar] [CrossRef] [Green Version]
  47. Khani, H.; Rofouei, M.K.; Arab, P.; Gupta, V.K.; Vafaei, Z. Multi-walled carbon nanotubes-ionic liquid-carbon paste electrode as a super selectivity sensor: Application to potentiometric monitoring of mercury ion(II). J. Hazard. Mater. 2010, 183, 402–409. [Google Scholar] [CrossRef]
  48. Xu, D.; Yu, S.; Yin, Y.; Wang, S.; Lin, Q.; Yuan, Z. Sensitive Colorimetric Hg2+ Detection via Amalgamation-Mediated Shape Transition of Gold Nanostars. Front. Chem. 2018, 6, 566. [Google Scholar] [CrossRef]
  49. Chen, J.-L.; Yang, P.-C.; Wu, T.; Lin, Y.-W. Determination of mercury (II) ions based on silver-nanoparticles-assisted growth of gold nanostructures: UV–Vis and surface enhanced Raman scattering approaches. Spectrochim. Acta Part A Mol. Biomol. Spectrosc. 2018, 199, 301–307. [Google Scholar] [CrossRef]
  50. Kang, Y.; Zhang, H.; Zhang, L.; Wu, T.; Sun, L.; Jiang, D.; Du, Y. In situ preparation of Ag nanoparticles by laser photoreduction as SERS substrate for determination of Hg2+. J. Raman Spectrosc. 2017, 48, 399–404. [Google Scholar] [CrossRef]
  51. Kong, X.; Cheng, C.; Wang, Q.; Meng, M.; Chen, C.; Wang, X.; Huang, S.; Gan, W. Surface-enhanced Raman scattering of trace Hg2+ on a 4-mercaptobenzoic acid-modified nanoporous Au substrate. Opt. Mater. Express 2021, 11, 3015–3022. [Google Scholar] [CrossRef]
  52. Retnakumari, A.; Setua, S.; Menon, D.; Ravindran, P.; Muhammed, H.; Pradeep, T.; Nair, S.; Koyakutty, M. Molecular-receptor-specific, non-toxic, near-infrared-emitting Au cluster-protein nanoconjugates for targeted cancer imaging. Nanotechnology 2010, 21, 055103. [Google Scholar] [CrossRef]
  53. Arivarasan, A.; Bharathi, S.; Ezhilarasi, S.; Arunpandiyan, S.; Jayavel, R. Photovoltaic Performances of Yb Doped CdTe QDs Sensitized TiO2 Photoanodes for Solar cell Applications. J. Inorg. Organomet. Polym. Mater. 2019, 29, 859–868. [Google Scholar] [CrossRef]
  54. Askari, E. A Novel Approach to Facile Synthesis and Biosensing of the Protein-Regulated Graphene. Int. J. Electrochem. Sci. 2018, 13, 886–897. [Google Scholar] [CrossRef]
  55. Safenkova, I.; Zherdev, A.; Dzantiev, B. Factors influencing the detection limit of the lateral-flow sandwich immunoassay: A case study with potato virus X. Anal. Bioanal. Chem. 2012, 403, 1595–1605. [Google Scholar] [CrossRef]
  56. Zhou, H.; Zheng, L.; Jia, H. Facile control of the self-assembly of gold nanoparticles by changing the capping agent structures. Colloids Surf. A Physicochem. Eng. Asp. 2014, 450, 9–14. [Google Scholar] [CrossRef]
  57. Xu, S.; Yuan, H.; Xu, A.; Wang, J.; Wu, L. Rapid Synthesis of Stable and Functional Conjugates of DNA/Gold Nanoparticles Mediated by Tween 80. Langmuir 2011, 27, 13629–13634. [Google Scholar] [CrossRef] [PubMed]
  58. WHO. Guidelines for Drinking-Water Quality: Fourth Edition Incorporating the First and Second Addenda; WHO: Geneva, Switzerland, 2017. [Google Scholar]
  59. Gul, Z.; Ullah, S.; Khan, S.; Ullah, H.; Khan, M.U.; Ullah, M.; Ali, S.; Altaf, A.A. Recent Progress in Nanoparticles Based Sensors for the Detection of Mercury (II) Ions in Environmental and Biological Samples. Crit. Rev. Anal. Chem. 2022. [Google Scholar] [CrossRef]
  60. Saleh, T.A.; Fadillah, G.; Ciptawati, E.; Khaled, M. Analytical methods for mercury speciation, detection, and measurement in water, oil, and gas. TrAC Trends Anal. Chem. 2020, 132, 116016. [Google Scholar] [CrossRef]
  61. Yang, F.; Duan, J.; Li, M.; Wang, Z.; Guo, Z. Visual and On-site Detection of Mercury(II) Ions on Lateral Flow Strips Using DNA-functionalized Gold Nanoparticles. Anal. Sci. 2012, 28, 333–338. [Google Scholar] [CrossRef] [PubMed] [Green Version]
  62. Chao, C.-H.; Wu, C.-S.; Huang, C.-C.; Liang, J.-C.; Wang, H.-T.; Tang, P.-T.; Lin, L.-Y.; Ko, F.-H. A rapid and portable sensor based on protein-modified gold nanoparticle probes and lateral flow assay for naked eye detection of mercury ion. Microelectron. Eng. 2012, 97, 294–296. [Google Scholar] [CrossRef]
  63. Wu, Z.; Shen, H.; Hu, J.; Fu, Q.; Yao, C.; Yu, S.; Xiao, W.; Tang, Y. Aptamer-based fluorescence-quenching lateral flow strip for rapid detection of mercury (II) ion in water samples. Anal. Bioanal. Chem. 2017, 409, 5209–5216. [Google Scholar] [CrossRef] [PubMed]
  64. Liu, J.; Chen, L.; Chen, J.; Ge, C.; Fang, Z.; Wang, L.; Xing, X.; Zeng, L. An autonomous T-rich DNA machine based lateral flow biosensor for amplified visual detection of mercury ions. Anal. Methods 2014, 6, 2024–2027. [Google Scholar] [CrossRef]
  65. Yao, L.; Teng, J.; Zhu, M.; Zheng, L.; Zhong, Y.; Liu, G.; Xue, F.; Chen, W. MWCNTs based high sensitive lateral flow strip biosensor for rapid determination of aqueous mercury ions. Biosens. Bioelectron. 2016, 85, 331–336. [Google Scholar] [CrossRef]
  66. Azmi, N.A.; Ahmad, S.H.; Low, S.C. Detection of mercury ions in water using a membrane-based colorimetric sensor. RSC Adv. 2018, 8, 251–261. [Google Scholar] [CrossRef] [Green Version]
  67. Chen, G.-H.; Chen, W.-Y.; Yen, Y.-C.; Wang, C.-W.; Chang, H.-T.; Chen, C.-F. Detection of Mercury(II) Ions Using Colorimetric Gold Nanoparticles on Paper-Based Analytical Devices. Anal. Chem. 2014, 86, 6843–6849. [Google Scholar] [CrossRef]
Scheme 1. Fabrication structure of lateral flow test strip, showing (a) schematic representation of the test strip and (b) photo of the prepared test strip.
Chemosensors 10 00413 sch001
Figure 1. The working principle of the lateral flow test for Hg2+ detection.
Chemosensors 10 00413 g001
Figure 2. Absorbance spectra of AuNPs before (red line) and after (black line) stabilization of Tween-20 and TEM images. The AuNPs were synthesized using different amounts of reduction agent, as follows: (a) 3.75 mL of 1% sodium citrate solution, with an average particle size 16 ± 2 nm; (b) 2 mL of 1% sodium citrate solution, with an average particle size 19 ± 5 nm; (c) 1.5 mL of 1% sodium citrate solution, with an average particle size 28 ± 4 nm.
Chemosensors 10 00413 g002
Figure 3. The SERS spectra of Raman active probe in the absence (red curve) and presence (green curve) of 100 ng/mL Hg2+ (n = 3).
Chemosensors 10 00413 g003
Figure 4. The UV-spectrum of BSA–MSA (a) and FTIR spectra of pure BSA (black curve), MSA (red curve), and BSA–MSA (blue curve) (b).
Chemosensors 10 00413 g004
Figure 5. Effect of AuNPs size on the Hg2+ detection by lateral flow test. Error bars show the standard deviations from three replicate measurements.
Chemosensors 10 00413 g005
Figure 6. Effect of BSA–MSA concentration on Hg2+ detection by lateral flow test. Error bars show the standard deviation from three replicate measurements.
Chemosensors 10 00413 g006
Figure 7. (a) Dependence of the color intensity in the test zone on the addition of various detergents to the running buffer. Error bars show the standard deviation from three replicate measurements; (b) time dependence of color in the test zone after application of a blank and running buffer containing 10 ng/mL Hg2+.
Chemosensors 10 00413 g007
Figure 8. The linear range of the calibration curve for the determination of Hg2+ by lateral flow test. Inserts: Calibration curve of Hg2+ in the range of concentration 0–100 ng/mL (above) and a photo of lateral flow test strips after the detection of Hg2+ (below). Error bars show the standard deviation from three replicate measurements.
Chemosensors 10 00413 g008
Figure 9. The color intensity in the test zone in the presence of various metal ions. The concentration of each metal ion was 100 ng/mL. Error bars show the standard deviation from three replicate measurements.
Chemosensors 10 00413 g009
Figure 10. Photo images of test strips after application of water sample containing Hg2+ in the following concentrations: 0, 0.1, 1, 2.5, 5, 10, 25, and 50 ng/mL (left to right).
Chemosensors 10 00413 g010
Table 1. Comparison of membrane-based point-of-use techniques for Hg2+ detection in water.
MethodLOD, ng/mLTimeRef.
Lateral flow test using DNA-functionalized AuNPs1.25 min[61]
Lateral flow test using AuNPs functionalized with carboxylic modified protein200n/a[62]
Fluorescence-quenching lateral flow assay using aptamer-modified AuNPs0.1315 min[63]
Lateral flow assay using DNA-functionalized AuNPs160 min[64]
Lateral flow assay using nucleic acid-modified multi-walled carbon nanotubes0.0515 min[65]
Membrane-based colorimetric sensor using dithizone as chromophore30001 min[66]
Microfluidic paper-based assay using single-stranded DNA-modified AuNPs1040 min[67]
Lateral flow test using Tween-20-stabilized AuNPs0.1311 minThis work
Table 2. Determination of Hg2+ in water samples using the developed method.
SamplepHAdded, ng/mLFound, ng/mLRecovery, %
Spring water6.855.005.67 ± 0.09113.4
2.503.35 ± 0.20134.0
1.001.2 ± 0.1120.0
Waterfall water9.336.256.26 ± 0.06100.2
3.122.49 ± 0.0179.7
1.561.1 ± 0.170.5
Publisher’s Note: MDPI stays neutral with regard to jurisdictional claims in published maps and institutional affiliations.

