

Gas Sensors Based on Exfoliated g-C3N4 for CO2 Detection

 , ,
, , 
Abstract
:
1. Introduction
2. Materials and Methods
3. Computational Method
4. Results and Discussion
4.1. Material Characterization
4.2. Optical Properties
4.3. Optoelectronic Properties
4.4. Gas Sensing Tests
5. Conclusions
Author Contributions
Funding
Data Availability Statement
Acknowledgments
Conflicts of Interest
References
- Yadav, P.; Usha, K.; Singh, B. Chapter 10—Air Pollution Mitigation and Global Dimming: A Challenge to Agriculture under Changing Climate; Shanker, A.K., Shanker, C., Anand, A., Maheswari, M., Eds.; Academic Press: Cambridge, MA, USA, 2022; pp. 271–298. ISBN 978-0-12-816091-6. [Google Scholar]
- Sikorska, P.E. The need for legal regulation of global emissions from the aviation industry in the context of emerging aerospace vehicles. Int. Comp. Jurisprud. 2015, 1, 133–142. [Google Scholar] [CrossRef] [Green Version]
- Donarelli, M.; Ottaviano, L. 2d materials for gas sensing applications: A review on graphene oxide, mos2, ws2 and phosphorene. Sensors 2018, 18, 3638. [Google Scholar] [CrossRef] [PubMed] [Green Version]
- Liu, X.; Ma, T.; Pinna, N.; Zhang, J. Two-Dimensional Nanostructured Materials for Gas Sensing. Adv. Funct. Mater. 2017, 27, 1702168. [Google Scholar] [CrossRef]
- Mouloua, D.; Kotbi, A.; Deokar, G.; Kaja, K.; El Marssi, M.; EL Khakani, M.A.; Jouiad, M. Recent Progress in the Synthesis of MoS2 Thin Films for Sensing, Photovoltaic and Plasmonic Applications: A Review. Materials 2021, 14, 3283. [Google Scholar] [CrossRef] [PubMed]
- Zhu, B.; Zhang, L.; Xu, D.; Cheng, B.; Yu, J. Adsorption investigation of CO2 on g-C3N4 surface by DFT calculation. J. CO2 Util. 2017, 21, 327–335. [Google Scholar] [CrossRef]
- Hang, N.T.; Zhang, S.; Yang, W. Efficient exfoliation of g-C3N4 and NO2 sensing behavior of graphene/g-C3N4 nanocomposite. Sens. Actuators B Chem. 2017, 248, 940–948. [Google Scholar] [CrossRef]
- Zuo, H.W.; Lu, C.H.; Ren, Y.R.; Li, Y.; Zhang, Y.F.; Chen, W.K. Pt4 clusters supported on monolayer graphitic carbon nitride sheets for oxygen adsorption: A first-principles study. Wuli Huaxue Xuebao/Acta Phys. Chim. Sin. 2016, 32, 1183–1190. [Google Scholar] [CrossRef]
- Song, H.; Liu, L.; Wang, H.; Feng, B.; Xiao, M.; Tang, Y.; Qu, X.; Gai, H.; Huang, T. Adjustment of the band gap of co-doped KCl/NH4Cl/g-C3N4 for enhanced photocatalytic performance under visible light. Mater. Sci. Semicond. Process. 2021, 128, 105757. [Google Scholar] [CrossRef]
- Iqbal, W.; Qiu, B.; Lei, J.; Wang, L.; Zhang, J.; Anpo, M. One-step large-scale highly active g-C3N4 nanosheets for efficient sunlight-driven photocatalytic hydrogen production. Dalt. Trans. 2017, 46, 10678–10684. [Google Scholar] [CrossRef]
- Basharnavaz, H.; Habibi-Yangjeh, A.; Kamali, S.H. A first-principle investigation of NO2 adsorption behavior on Co, Rh, and Ir-embedded graphitic carbon nitride: Looking for highly sensitive gas sensor. Phys. Lett. Sect. A Gen. At. Solid State Phys. 2020, 384, 126057. [Google Scholar] [CrossRef]
- Liu, X.; Kang, W.; Zeng, W.; Zhang, Y.; Qi, L.; Ling, F.; Fang, L.; Chen, Q.; Zhou, M. Structural, electronic and photocatalytic properties of g-C3N4 with intrinsic defects: A first-principles hybrid functional investigation. Appl. Surf. Sci. 2020, 499, 143994. [Google Scholar] [CrossRef]
- Ji, Y.; Dong, H.; Lin, H.; Zhang, L.; Hou, T.; Li, Y. Heptazine-based graphitic carbon nitride as an effective hydrogen purification membrane. RSC Adv. 2016, 6, 52377–52383. [Google Scholar] [CrossRef]
- Wu, H.Z.; Liu, L.M.; Zhao, S.J. The effect of water on the structural, electronic and photocatalytic properties of graphitic carbon nitride. Phys. Chem. Chem. Phys. 2014, 16, 3299–3304. [Google Scholar] [CrossRef] [PubMed]
- Jia, L.; Zhang, H.; Wu, P.; Liu, Q.; Yang, W.; He, J.; Liu, C.; Jiang, W. Graphite-like C3N4-coated transparent superhydrophilic glass with controllable superwettability and high stability. Appl. Surf. Sci. 2020, 532, 147309. [Google Scholar] [CrossRef]
- Mohammadi, I.; Zeraatpisheh, F.; Ashiri, E.; Abdi, K. Solvothermal synthesis of g-C3N4 and ZnO nanoparticles on TiO2 nanotube as photoanode in DSSC. Int. J. Hydrogen Energy 2020, 45, 18831–18839. [Google Scholar] [CrossRef]
- Ravichandran, K.; Kalpana, K.; Mohamed Ibrahim, M.; Shantha Seelan, K. Effect of source material of g-C3N4 on the photocatalytic activity of ZnO/g-C3N4 thin film coated on stainless steel mesh substrate. Mater. Today Proc. 2020, 48, 207–215. [Google Scholar] [CrossRef]
- Mohamed, N.A.; Safaei, J.; Ismail, A.F.; Jailani, M.F.A.M.; Khalid, M.N.; Noh, M.F.M.; Aadenan, A.; Nasir, S.N.S.; Sagu, J.S.; Teridi, M.A.M. The influences of post-annealing temperatures on fabrication graphitic carbon nitride, (g-C3N4) thin film. Appl. Surf. Sci. 2019, 489, 92–100. [Google Scholar] [CrossRef]
- Kotbi, A.; Imran, M.; Kaja, K.; Rahaman, A.; Ressami, E.M.; Lejeune, M.; Lakssir, B.; Jouiad, M. Graphene and g-C3N4-Based Gas Sensors. J. Nanotechnol. 2022, 2022, 9671619. [Google Scholar] [CrossRef]
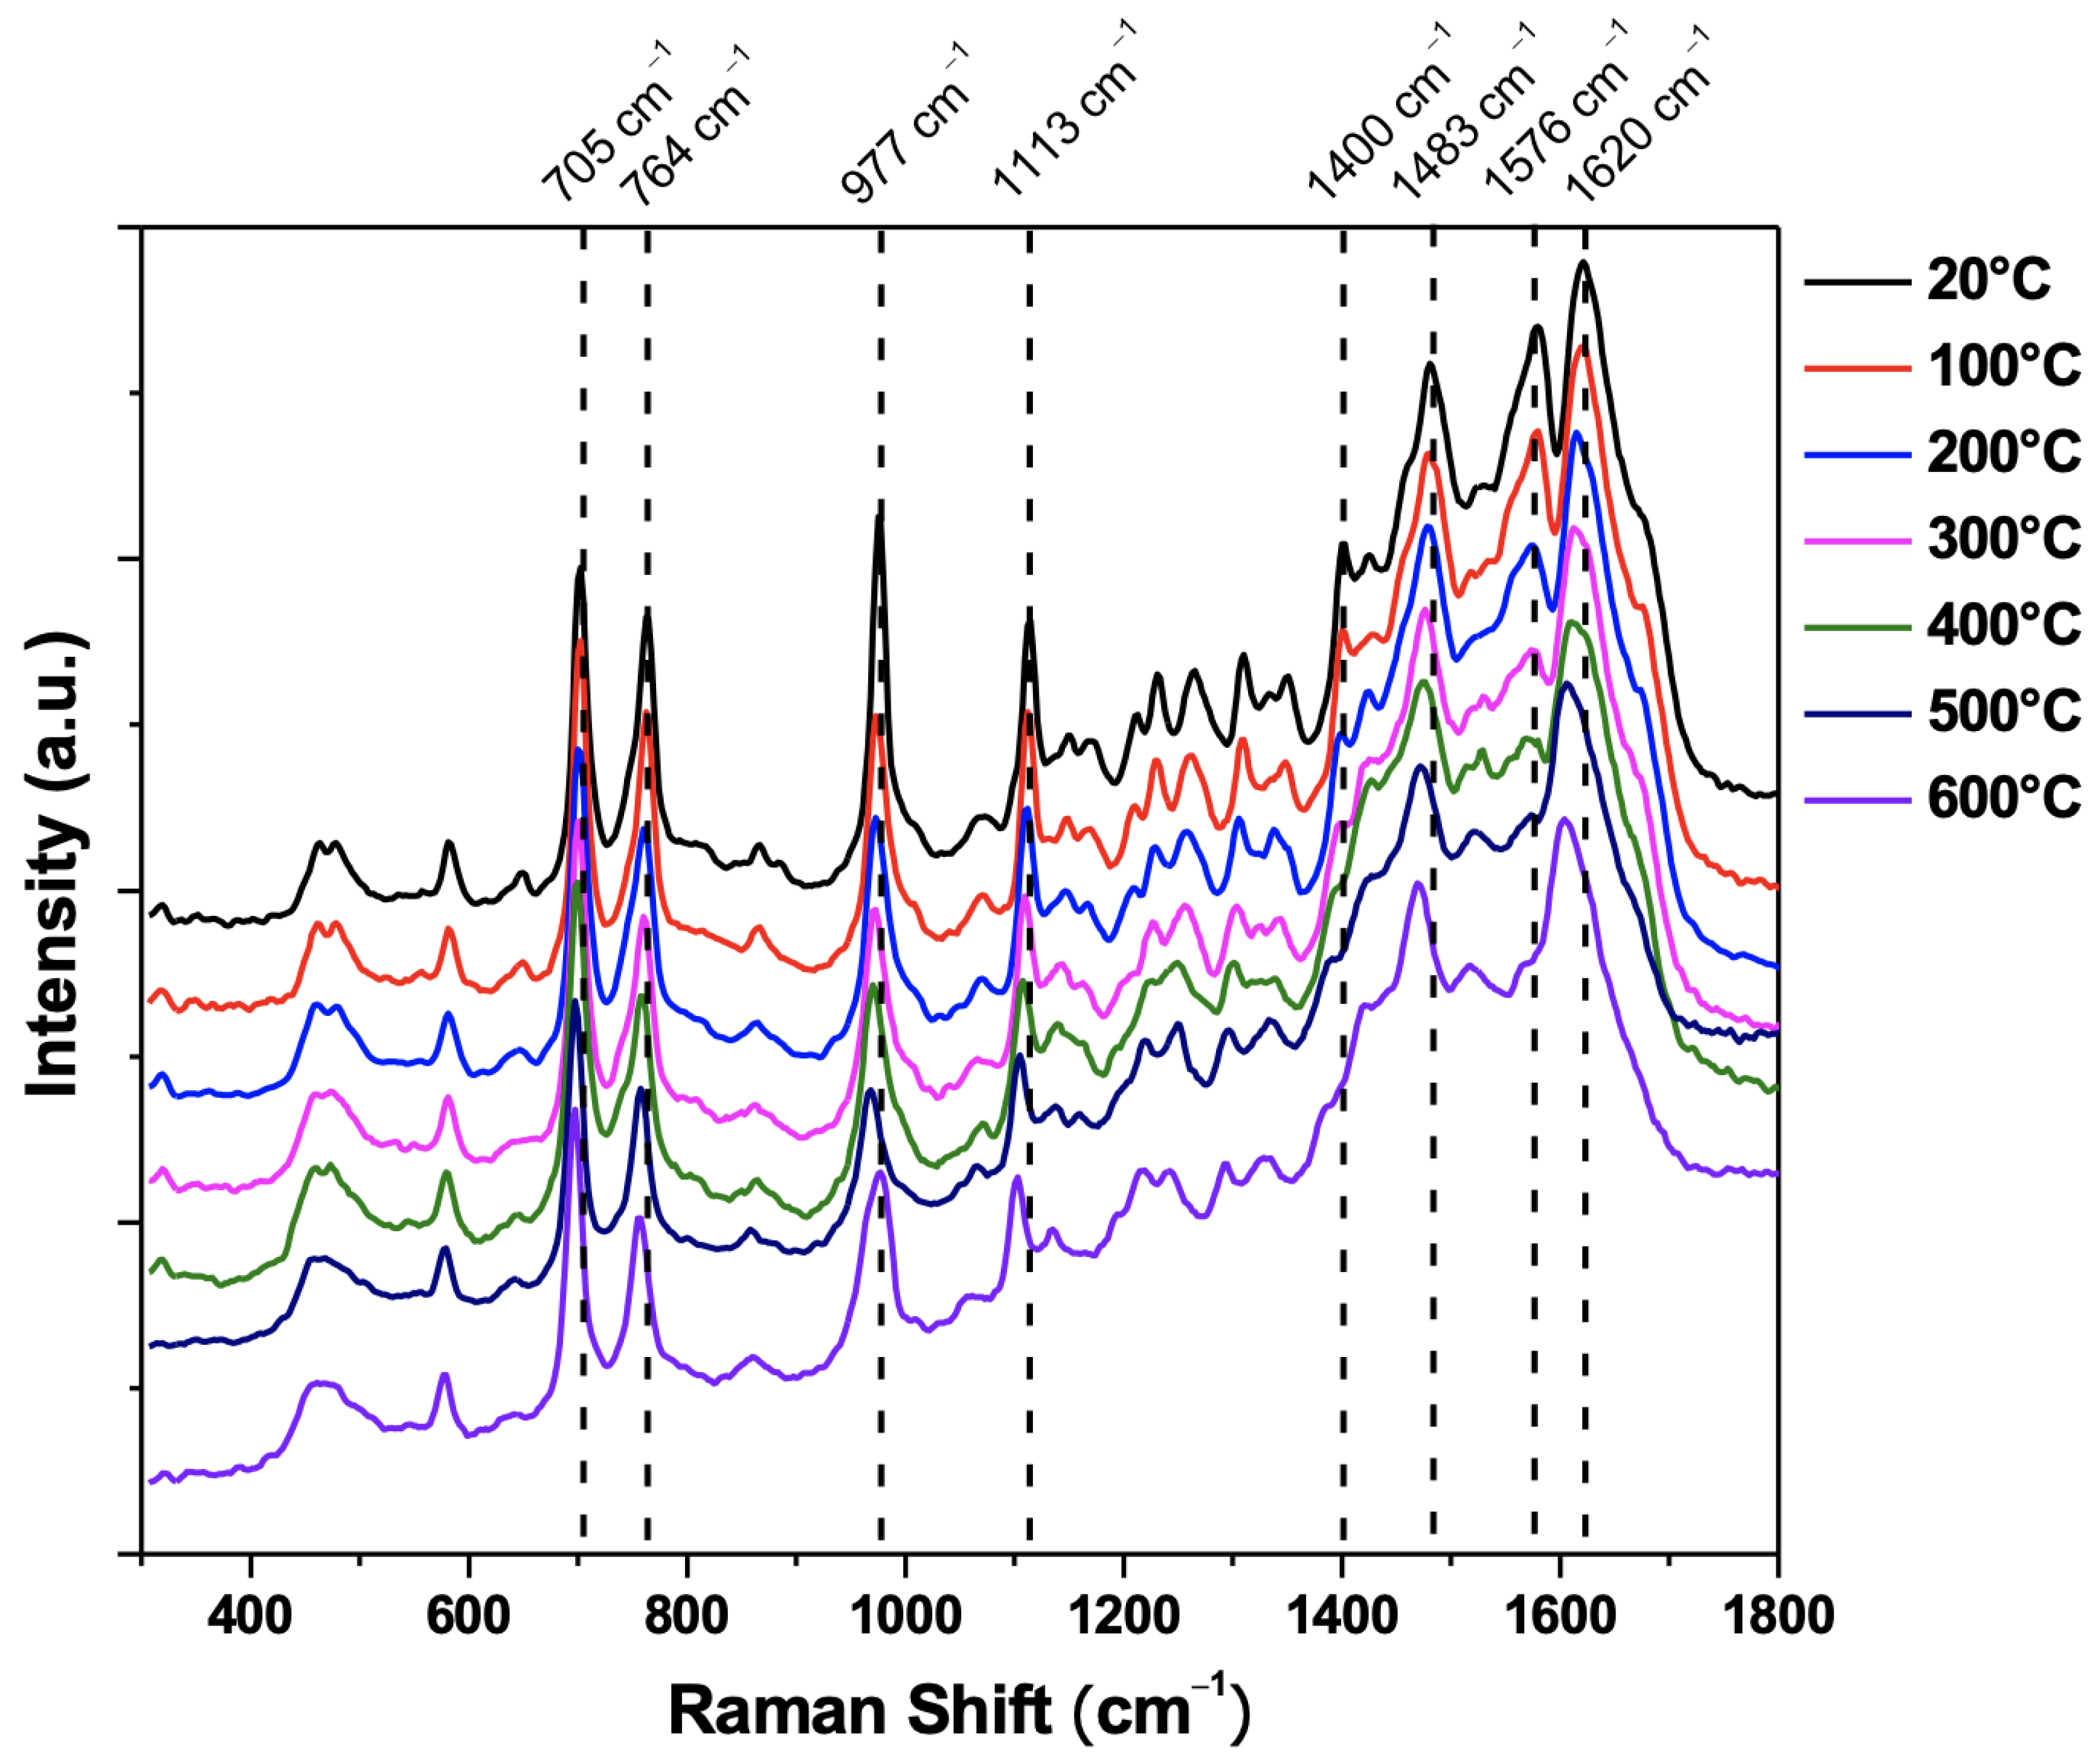
- Zinin, P.V.; Ming, L.-C.; Sharma, S.K.; Khabashesku, V.N.; Liu, X.; Hong, S.; Endo, S.; Acosta, T. Ultraviolet and near-infrared Raman spectroscopy of graphitic C3N4 phase. Chem. Phys. Lett. 2009, 472, 69–73. [Google Scholar] [CrossRef]
- Bormett, R.W.; Asher, S.A.; Witowski, R.E.; Partlow, W.D.; Lizewski, R.; Pettit, F. Ultraviolet Raman spectroscopy characterizes chemical vapor deposition diamond film growth and oxidation. J. Appl. Phys. 1995, 77, 5916–5923. [Google Scholar] [CrossRef]
- Lin, L.; Ou, H.; Zhang, Y.; Wang, X. Tri-s-triazine-Based Crystalline Graphitic Carbon Nitrides for Highly Efficient Hydrogen Evolution Photocatalysis. ACS Catal. 2016, 6, 3921–3931. [Google Scholar] [CrossRef]
- Wu, J.; Ji, X.; Yuan, X.; Zhao, Z.; Li, Y.; Wen, B.; Zhang, H.; Yu, D.; Zhao, Y.; Tian, Y. Regulating Polymerization in Graphitic Carbon Nitride To Improve Photocatalytic Activity. Chem. Mater. 2019, 31, 9188–9199. [Google Scholar] [CrossRef]
- Li, H.; Jin, C.; Wang, Z.; Liu, Y.; Wang, P.; Zheng, Z.; Whangbo, M.H.; Kou, L.; Li, Y.; Dai, Y.; et al. Effect of the intra- and inter-triazine N-vacancies on the photocatalytic hydrogen evolution of graphitic carbon nitride. Chem. Eng. J. 2019, 369, 263–271. [Google Scholar] [CrossRef]
- Ferrari, A.C.; Robertson, J.; Ferrari, A.C.; Robertson, J. Raman spectroscopy of amorphous, nanostructured, diamond-like carbon, and nanodiamond. Philos. Trans. R. Soc. Lond. Ser. A Math. Phys. Eng. Sci. 2004, 362, 2477–2512. [Google Scholar] [CrossRef] [PubMed]
- Ferrari, A.C.; Robertson, J. Interpretation of Raman spectra of disordered and amorphous carbon. Phys. Rev. B 2000, 61, 14095–14107. [Google Scholar] [CrossRef] [Green Version]
- Kotbi, A.; Hartiti, B.; Ridah, A.; Thevenin, P. Characteristics of CuInS2 thin films synthesizes by chemical spray pyrolysis. Opt. Quantum Electron. 2016, 48, 75. [Google Scholar] [CrossRef]
- Wang, H.; Zhang, X.; Xie, J.; Zhang, J.; Ma, P.; Pan, B.; Xie, Y. Structural distortion in graphitic-C3N4 realizing an efficient photoreactivity. Nanoscale 2015, 7, 5152–5156. [Google Scholar] [CrossRef]
- Pareek, S.; Quamara, J.K. Dielectric and optical properties of graphitic carbon nitride–titanium dioxide nanocomposite with enhanced charge seperation. J. Mater. Sci. 2018, 53, 604–612. [Google Scholar] [CrossRef]
- Dong, F.; Zhao, Z.; Xiong, T.; Ni, Z.; Zhang, W.; Sun, Y.; Ho, W. In Situ Construction of g-C3N4/g-C3N4 Metal-Free Heterojunction for Enhanced Visible-Light Photocatalysis. ACS Appl. Mater. Interfaces 2013, 5, 11392–11401. [Google Scholar] [CrossRef]
- Liu, J. Effect of phosphorus doping on electronic structure and photocatalytic performance of g-C3N4: Insights from hybrid density functional calculation. J. Alloys Compd. 2016, 672, 271–276. [Google Scholar] [CrossRef]
- Yu, W.; Xu, D.; Peng, T. Enhanced photocatalytic activity of g-C3N4 for selective CO2 reduction to CH3OH via facile coupling of ZnO: A direct Z-scheme mechanism. J. Mater. Chem. A 2015, 3, 19936–19947. [Google Scholar] [CrossRef]
- Li, L.; Huang, Z.; Li, Z.; Li, H.; Wang, A. Defect-rich porous g-C3N4 nanosheets photocatalyst with enhanced photocatalytic activity. J. Mater. Sci. Mater. Electron. 2021, 32, 6465–6474. [Google Scholar] [CrossRef]
- Liang, Q.; Li, Z.; Huang, Z.H.; Kang, F.; Yang, Q.H. Holey Graphitic Carbon Nitride Nanosheets with Carbon Vacancies for Highly Improved Photocatalytic Hydrogen Production. Adv. Funct. Mater. 2015, 25, 6885–6892. [Google Scholar] [CrossRef]
- Azofra, L.M.; MacFarlane, D.R.; Sun, C. A DFT study of planar: Vs. corrugated graphene-like carbon nitride (g-C3N4) and its role in the catalytic performance of CO2 conversion. Phys. Chem. Chem. Phys. 2016, 18, 18507–18514. [Google Scholar] [CrossRef] [PubMed]
- Ding, K.; Wen, L.; Huang, M.; Zhang, Y.; Lu, Y.; Chen, Z. How does the B,F-monodoping and B/F-codoping affect the photocatalytic water-splitting performance of g-C3N4? Phys. Chem. Chem. Phys. 2016, 18, 19217–19226. [Google Scholar] [CrossRef]
- Wang, Y.; Tian, Y.; Yan, L.; Su, Z. DFT Study on Sulfur-Doped g-C3N4 Nanosheets as a Photocatalyst for CO2 Reduction Reaction. J. Phys. Chem. C 2018, 122, 7712–7719. [Google Scholar] [CrossRef]
- Yao, Q.; Lu, M.; Du, Y.; Wu, F.; Deng, K.; Kan, E. Designing half-metallic ferromagnetism by a new strategy: An example of superhalogen modified graphitic C3N4. J. Mater. Chem. C 2018, 6, 1709–1714. [Google Scholar] [CrossRef]
- Zhang, X.; Xie, X.; Wang, H.; Zhang, J.; Pan, B.; Xie, Y. Enhanced photoresponsive ultrathin graphitic-phase C3N4 nanosheets for bioimaging. J. Am. Chem. Soc. 2013, 135, 18–21. [Google Scholar] [CrossRef]
- Meng, J.; Pei, J.; He, Z.; Wu, S.; Lin, Q.; Wei, X.; Li, J.; Zhang, Z. Facile synthesis of g-C3N4 nanosheets loaded with WO3 nanoparticles with enhanced photocatalytic performance under visible light irradiation. RSC Adv. 2017, 7, 24097–24104. [Google Scholar] [CrossRef] [Green Version]
- Liu, J.; Hua, E. High Photocatalytic Activity of Heptazine-Based g-C3N4/SnS2 Heterojunction and Its Origin: Insights from Hybrid DFT. J. Phys. Chem. C 2017, 121, 25827–25835. [Google Scholar] [CrossRef]
- Opoku, F.; Govender, K.K.; van Sittert, C.G.C.E.; Govender, P.P. Insights into the photocatalytic mechanism of mediator-free direct Z-scheme g-C3N4/Bi2MoO6(010) and g-C3N4/Bi2WO6(010) heterostructures: A hybrid density functional theory study. Appl. Surf. Sci. 2018, 427, 487–498. [Google Scholar] [CrossRef]
- Xu, L.; Huang, W.Q.; Wang, L.L.; Tian, Z.A.; Hu, W.; Ma, Y.; Wang, X.; Pan, A.; Huang, G.F. Insights into enhanced visible-light photocatalytic hydrogen evolution of g-C3N4 and highly reduced graphene oxide composite: The role of oxygen. Chem. Mater. 2015, 27, 1612–1621. [Google Scholar] [CrossRef]
- Liu, J.; Cheng, B.; Yu, J. A new understanding of the photocatalytic mechanism of the direct Z-scheme g-C3N4/TiO2 heterostructure. Phys. Chem. Chem. Phys. 2016, 18, 31175–31183. [Google Scholar] [CrossRef] [PubMed]
- Chen, X.; Zhou, C.; Zhao, W.; He, H.; Li, R.; Zou, W. Hybrid triazine-based graphitic carbon nitride and molybdenum disulfide bilayer with and without Li/Mg intercalation: Structural, electronic and optical properties. Comput. Mater. Sci. 2017, 134, 84–92. [Google Scholar] [CrossRef]
- Ruan, L.; Xu, G.; Gu, L.; Li, C.; Zhu, Y.; Lu, Y. The physical properties of Li-doped g-C3N4 monolayer sheet investigated by the first-principles. Mater. Res. Bull. 2015, 66, 156–162. [Google Scholar] [CrossRef]
- Deokar, G.; Casanova-Cháfer, J.; Rajput, N.S.; Aubry, C.; Llobet, E.; Jouiad, M.; Costa, P.M.F.J. Wafer-scale few-layer graphene growth on Cu/Ni films for gas sensing applications. Sens. Actuators B Chem. 2020, 305, 127458. [Google Scholar] [CrossRef]
- Zhang, Y.H.; Chen, Y.B.; Zhou, K.G.; Liu, C.H.; Zeng, J.; Zhang, H.L.; Peng, Y. Improving gas sensing properties of graphene by introducing dopants and defects: A first-principles study. Nanotechnology 2009, 20, 185504. [Google Scholar] [CrossRef] [Green Version]
- Dervieux, E.; Théron, M.; Uhring, W. Carbon Dioxide Sensing-Biomedical Applications to Human Subjects. Sensors 2022, 22, 188. [Google Scholar] [CrossRef]
- Li, W.; Zhang, Y.; Long, X.; Cao, J.; Xin, X.; Guan, X.; Peng, J.; Zheng, X. Gas Sensors Based on Mechanically Exfoliated MoS2 Nanosheets for Room-Temperature NO2 Detection. Sensors 2019, 19, 2123. [Google Scholar] [CrossRef] [Green Version]
- Presmanes, L.; Thimont, Y.; Chapelle, A.; Blanc, F.; Talhi, C.; Bonningue, C.; Barnabé, A.; Menini, P.; Tailhades, P. Highly sensitive sputtered zno:Ga thin films integrated by a simple stencil mask process on microsensor platforms for sub-ppm acetaldehyde detection. Sensors 2017, 17, 1055. [Google Scholar] [CrossRef]
- Presmanes, L.; Thimont, Y.; El Younsi, I.; Chapelle, A.; Blanc, F.; Talhi, C.; Bonningue, C.; Barnabé, A.; Menini, P.; Tailhades, P. Integration of P-Cuo thin sputtered layers onto microsensor platforms for gas sensing. Sensors 2017, 17, 1409. [Google Scholar] [CrossRef] [PubMed] [Green Version]
- Zhang, X.; Wang, Y.; Luo, G.; Xing, M. Two-Dimensional Graphene Family Material. Sensors 2019, 19, 2966. [Google Scholar] [CrossRef] [PubMed]


| System | Theoretical “DFT” Eg (eV) | Approximation | Experimental Eg (eV) |
|---|---|---|---|
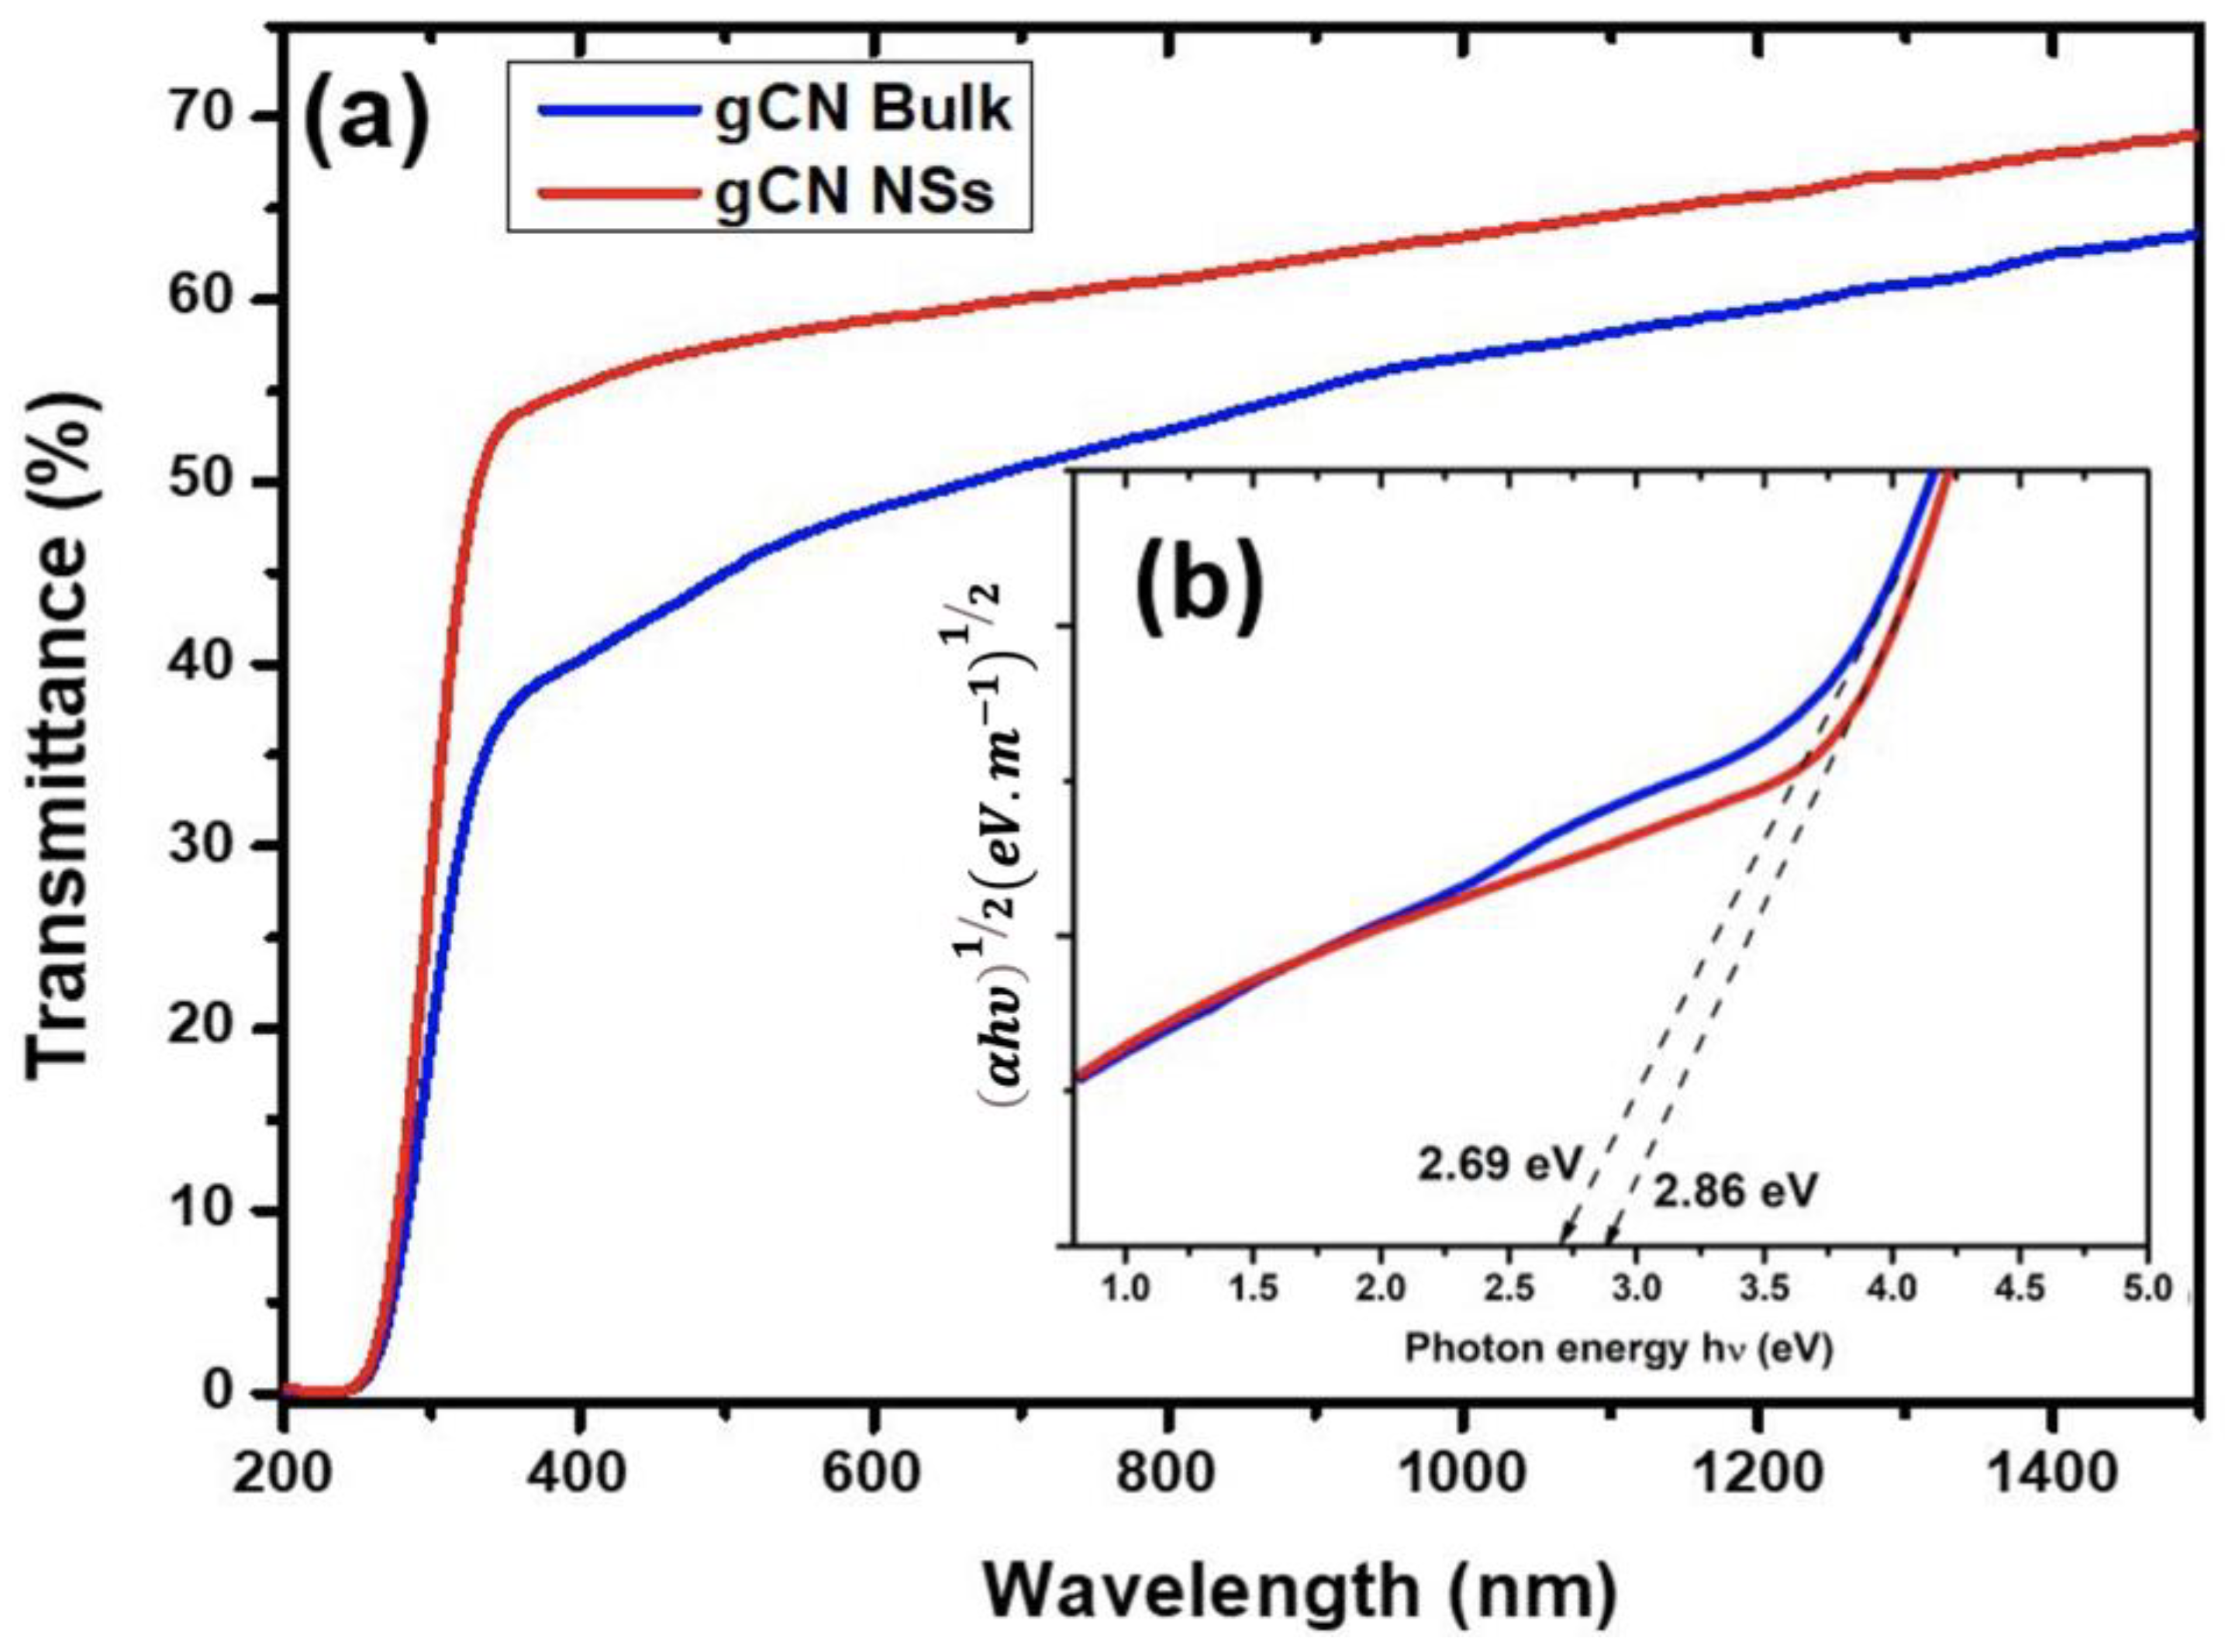
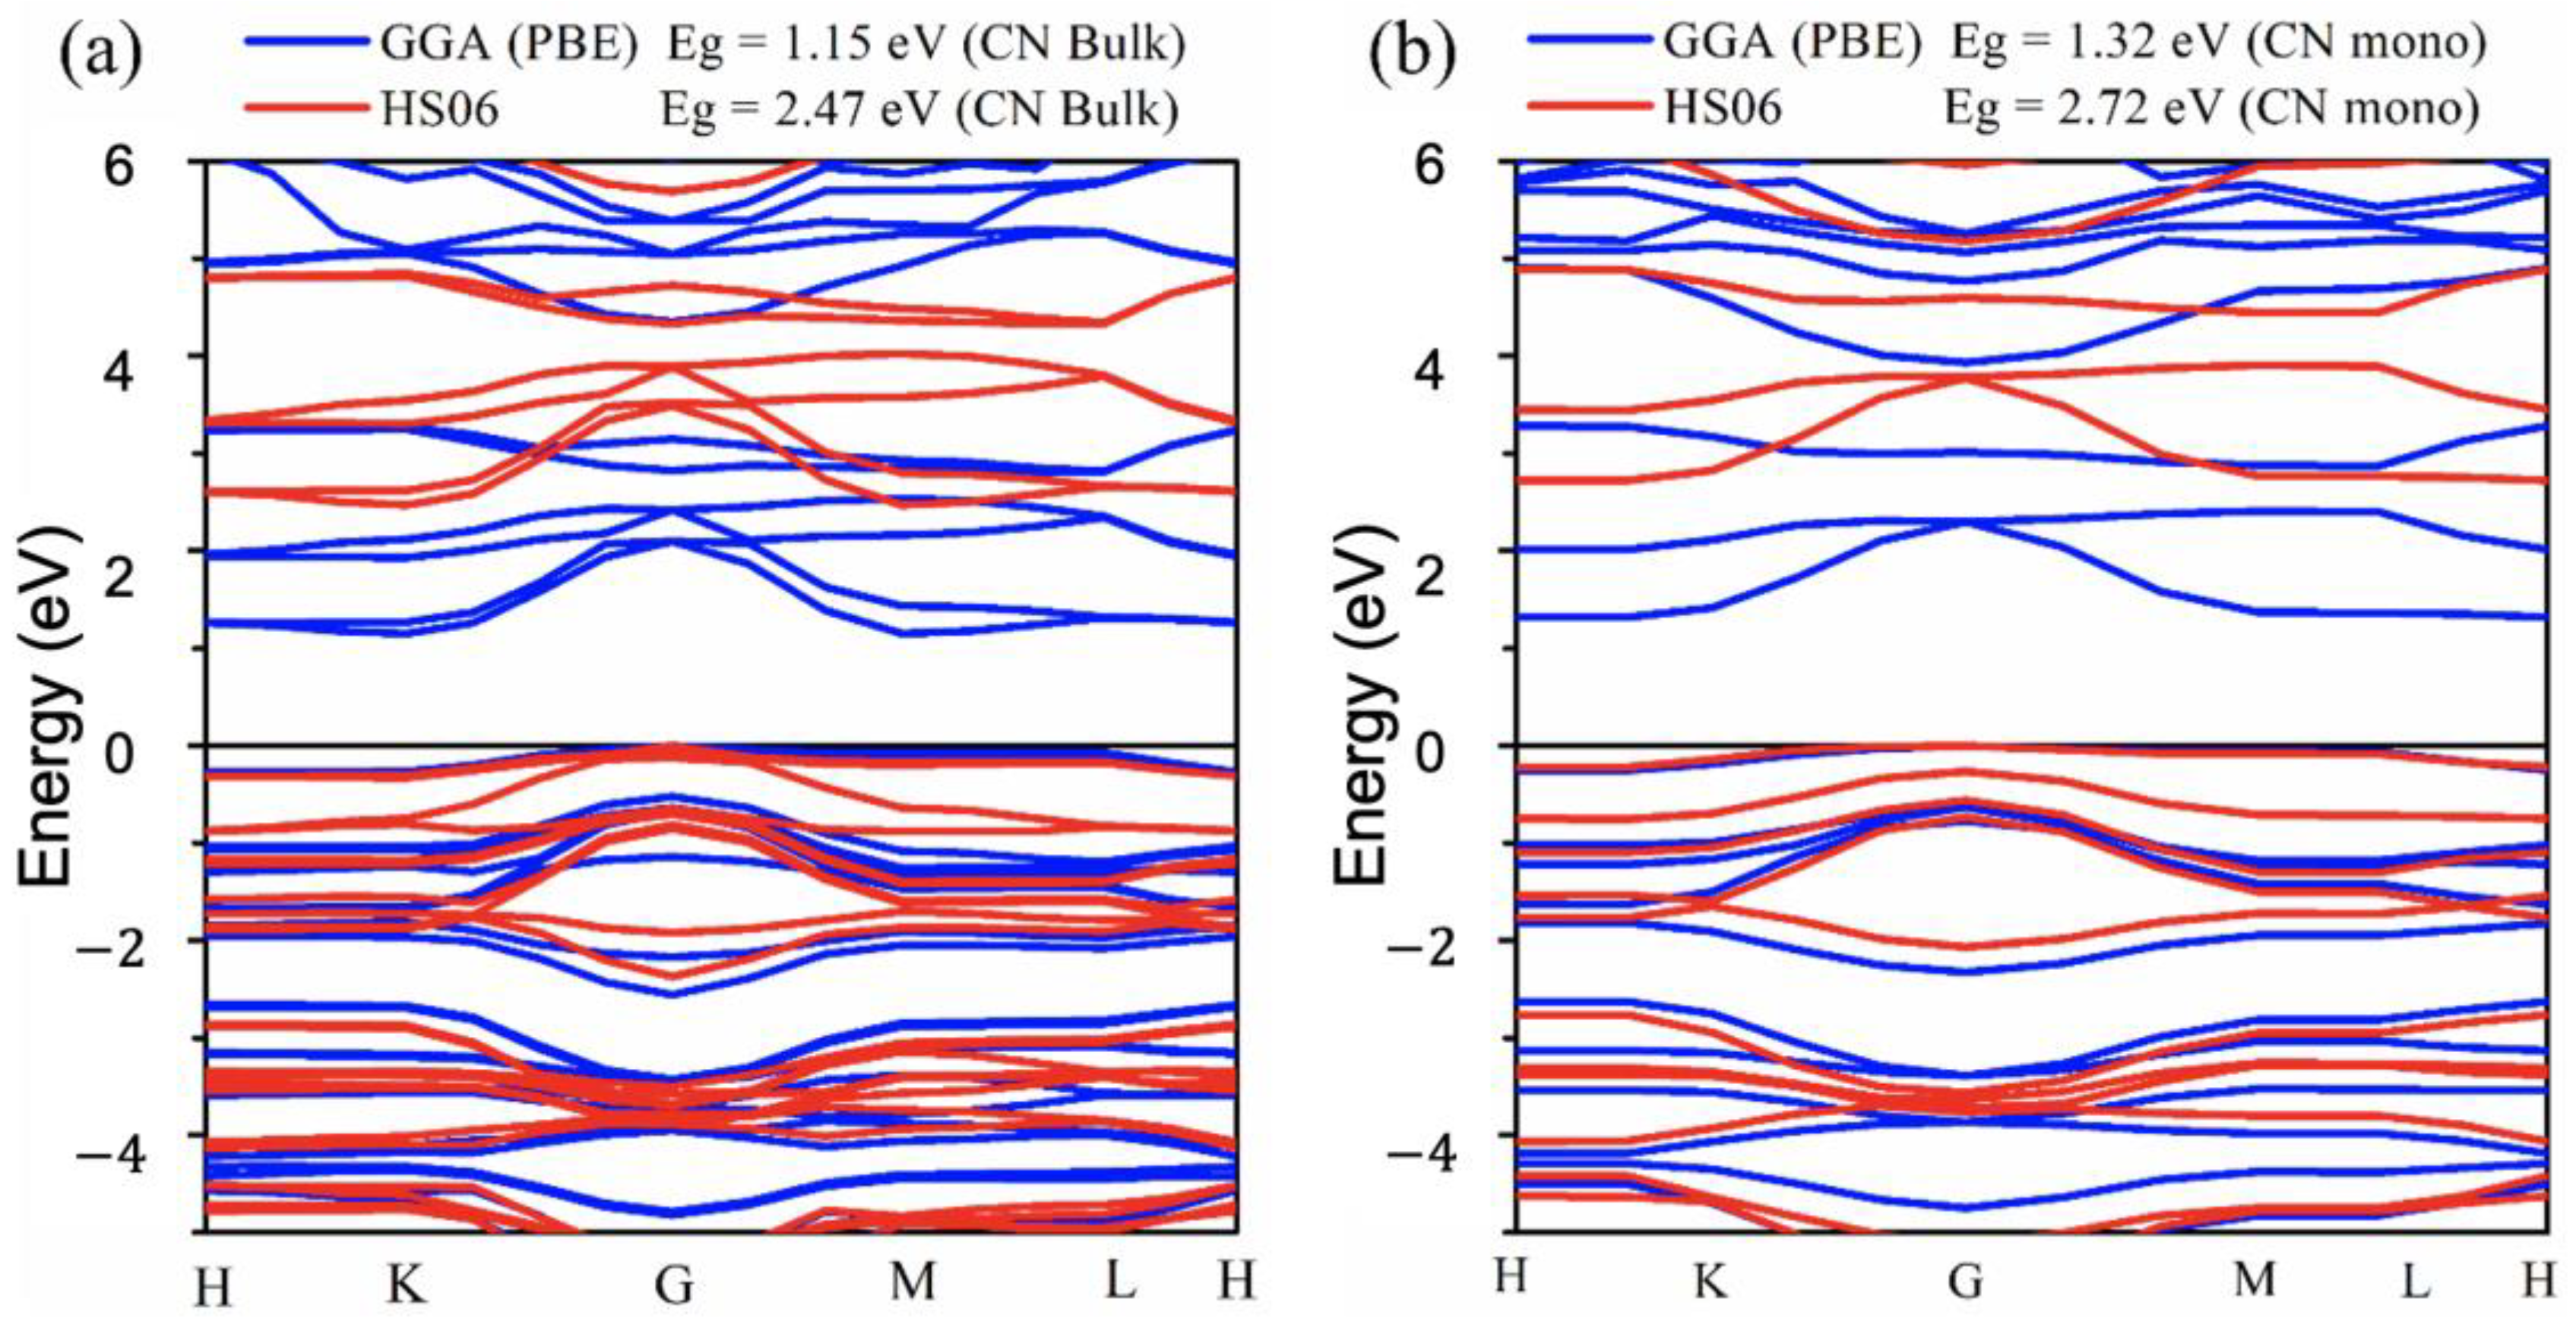
| gCN bulk | 1.36 [31]; 1.41 [32]; 1.15 [this work] | GGA-PBE | 2.51 [33]; 2.59 eV [34] |
| 2.73 [31]; 2.71 [6]; [35], | HSE06 | ||
| 2.68 [36]; 2.80 [37]; | 2.69 eV [this work] | ||
| 2.47 [this work] | |||
| gCN monolayer | 1.59 [38] | GGA-PBE | 2.70 [39], 2.71 [40] |
| 1.32 [this work] | |||
| 2.76 [41], 2.93 [42], 2.96 [43], 2.97 [38], | HSE06 | 2.86 eV [this work] | |
| 3.20 [44], 3.22 [45], 4.02 [46] | |||
| 2.72 [this work] |
| Before Optimization | Optimized Structure | |
|---|---|---|
| gCN-CO2 configuration |  | 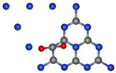 |
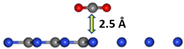 |  | |
| Angle (degree) | 180 | 179.42 |
| Bond length (Å) | 1.181 | 1.172/1.170 |
| Distance gCN–CO2 (Å) | 2.5 | 3.24 |
| Eads (eV) | −0.59 | |
Publisher’s Note: MDPI stays neutral with regard to jurisdictional claims in published maps and institutional affiliations. |
© 2022 by the authors. Licensee MDPI, Basel, Switzerland. This article is an open access article distributed under the terms and conditions of the Creative Commons Attribution (CC BY) license (https://creativecommons.org/licenses/by/4.0/).
Share and Cite
Kotbi, A.; Benyoussef, M.; Ressami, E.M.; Lejeune, M.; Lakssir, B.; Jouiad, M. Gas Sensors Based on Exfoliated g-C3N4 for CO2 Detection. Chemosensors 2022, 10, 470. https://doi.org/10.3390/chemosensors10110470
Kotbi A, Benyoussef M, Ressami EM, Lejeune M, Lakssir B, Jouiad M. Gas Sensors Based on Exfoliated g-C3N4 for CO2 Detection. Chemosensors. 2022; 10(11):470. https://doi.org/10.3390/chemosensors10110470
Chicago/Turabian StyleKotbi, Ahmed, Manal Benyoussef, El Mostafa Ressami, Michael Lejeune, Brahim Lakssir, and Mustapha Jouiad. 2022. "Gas Sensors Based on Exfoliated g-C3N4 for CO2 Detection" Chemosensors 10, no. 11: 470. https://doi.org/10.3390/chemosensors10110470