Article

Energy-Efficient Chemiresistive Sensor Array Based on SWCNT Networks, WO3 Nanochannels and SWCNT-Pt Heterojunctions for NH3 Detection against the Background Humidity

by
Alexey V. Romashkin
1,*,
Andrey V. Lashkov
1,
Victor V. Sysoev
2,*,
Nikolay S. Struchkov
1,
Evgeny V. Alexandrov
1 and
Denis D. Levin
1
1
Center for Probe Microscopy and Nanotechnology, National Research University of Electronic Technology, Moscow 124498, Russia
2
Department of Physics, Yuri Gagarin State Technical University of Saratov, Saratov 410054, Russia
*
Authors to whom correspondence should be addressed.
Chemosensors 2022, 10(11), 476; https://doi.org/10.3390/chemosensors10110476
Submission received: 7 October 2022 / Revised: 7 November 2022 / Accepted: 10 November 2022 / Published: 12 November 2022
(This article belongs to the Special Issue Gas Sensors for Monitoring Environmental Changes)

Abstract

:
Recently, promising results have been achieved in improving the sensitivity to ammonia in gas sensors through the use of structures composed of heterojunctions or nanochannels. However, their sensitivity is highly dependent on the background humidity under air conditions. The sensor structures which could ensure selective ammonia detection with a low detection limit, despite interference from changing background humidity, remain highly demanded. In this work, we consider sensing units containing (i) nanochannels formed by a continuous tungsten oxide nanolayer to appear in contact between single-walled carbon nanotubes (SWCNTs) and a Pt sublayer and (ii) SWCNT-Pt junctions in frames of mass-scale microelectronic technologies. SWCNTs were deposited by spray-coating on a thin WO3/Pt/W sublayer formed by a photolithographic pattern to be accompanied by satellite samples with just SWCNTs for reference purposes. We elucidate the specific differences that appeared in the response of sensors based on SWCNT-Pt junctions and WO3 nanochannels relative to satellite SWCNT samples with a similar SWCNT network density. Particularly, while a similar response to NH3 vapors mixed with dry air is observed for each sensor type, the response to NH3 is reduced significantly in the presence of background humidity, of 45 rel.%, especially in the case of WO3 nanochannel structures even at room temperature. A multisensor array based on the four various sensing structures involving SWCNT-Pt junctions, WO3 nanochannels, and their satellite-only-SWCNT ones allowed us to determine a correct ammonia concentration via utilizing the linear discriminant analysis despite the presence of background air humidity. Thus, such an energy-efficient multisensor system can be used for environmental monitoring of ammonia content, health monitoring, and other applications.

Graphical Abstract

1. Introduction

The ammonia vapors present a high demand for detection because of numerous applications linked to this analyte [1,2]. These vapors are extremely hazardous to heavily influence the eyes, lungs, and skin under direct contact causing nose and throat irritation combined with coughing and respiratory tract irritation [3]. Currently, the long-term, 8 h permissible concentration of NH3 for workers is 25 ppm [4]. At this level, the vapors substantially inhibit the immune system of animals and reduce their ability to eliminate infections [5]. At higher concentrations, in the range of 15–28% by volume, ammonia vapors are flammable in the air. Still, humans feel its odor at the threshold of ca. 6 ppm [6], which allows us to distinguish this danger organoleptically. However, the technical units are obviously needed for continuous monitoring of this toxic gas at the spots of interest, such as an industry’s emission, environmental monitoring, and human health. Therefore, to be effective for these applications, the sensors have to yield signals at lower detection limits combined with high stability of the response and small mass/volume parameters [4,7]. At the same time, the NH3 vapors are the most common ones to appear in compost areas where their concentration reaches ca. 4000 ppm [8], which heavily exceeds the noted permissions and requires sensor-based units capable of working instantly for automatic monitoring tasks. Furthermore, ammonia can react in the atmosphere with other substances, contributing to the particle’s aggregation, of which the most harmful are ones smaller than 2.5 microns in size. Thus, the detection threshold for particles, and hence ammonia, is reduced down to concentrations of ca. 30 ppb in the ambient air [7]. The other source of ammonia to be important for humans is meat or poultry, which is subject to metabolic spoiling under a microbe’s growth, damaging the organic matter [9], and last but not least, ammonia appears as a biomarker produced by a human body under various metabolic activities: its excessive presence in the exhaled breath, at concentrations higher than 1 ppm [10], indicates diseases related primarily to dysfunctions of liver and kidneys [11,12].
While the ammonia vapors could be well detected by analytical instrumentation such as chromatography [13], these techniques do not suit the requirements to have a compact device that yields “here and now” the corresponding information/signal. Therefore, the NH3 sensing units are intensively developed employing gas sensors of various principles.
Currently, sensors based on oxide materials with channels formed by continuous thin films are mostly wide-spread to allow one measuring NH3 concentrations of several ppm as a detection limit [14], and only recently, notable progress has been made in increasing the sensitivity of sensor structures, reaching a detection limit of less than 1 ppm through, for instance, using tungsten oxide as thin layers [15] or nanoflakes [16]. However, these sensors have a number of features that limit their usage: (i) a low selectivity to specific gases, (ii) degradation of the sensitive layer over time upon exposure to high concentrations of various gases and volatile organic compounds (VOCs), and (iii) advanced operating temperature of the sensor, 200 °C and higher, which require an extensive power consumption. Therefore, novel chemiresistive sensors based on nanomaterials matured from carbon-related structures [17], such as carbon nanotubes (CNTs), are intensively developed to operate at room temperature (RT) [18,19]. In addition, these structures have low electrical noise and compatibility with the microprocessor’s processing of the sensor signals in a real-time scale [20] to meet entirely all the challenges related, among others, to the Internet-of-Things paradigm [21].
In order to advance the gas-sensing performance of carbon structures, they are complemented with foreign additives for designing heterojunctions [22,23,24]. However, one of the negative properties of such sensors is a strong dependence on the sensor’s response to NH3 under humidity interference. In some cases, enhancing relative humidity (RH) from 25 rel.% to 64 rel.% might modify the sensor response by six times at the same ammonia concentration [18].
The most significant results in terms of the sensor response magnitude were achieved for structures containing heterojunctions based on materials that have a significant difference in the positions of energy levels in the band structure [18,19] though not all the heterojunctions contribute to advancing the sensor response [25]. From this viewpoint, the efficient approach is combining CNTs with metal oxides. For example, SWCNTs and WO3 differ by the type of conductivity: the edge of the SWCNT valence band, Ev, is located near the edge of the oxide conduction band, Ec, but with a fairly large difference between these levels. Therefore, this junction might significantly change the nature of the response of such a structure to various gases. CNT-SnO2 heterostructures are also shown to obtain enhanced sensor response [19]. However, tungsten oxide has significantly more predictable sensing performance yielding, for instance, a linear chemiresistive response to gaseous analytes both at low and high levels of background humidity [26] and higher responses to water vapors [27,28]. Therefore, in this work, we consider namely the combination of WO3 with SWCNTs. Thus far, reported data in the literature highlight that responses of sensors based on WO3/CNTs exceed those based on just WO3 at certain optimal ratios between the components in the composite. Furthermore, there are strong changes in sensor response in response to even minor deviations in optimal component ratios of such composite sensor layers. In addition, CNTs themselves also exhibit differences in sensor response depending on background humidity [29]. Thus, there is a necessity to fabricate heterostructures and nanochannels in a controlled manner on a nanoscale for obtaining sensors with specified characteristics.
One of the solutions can be using photolithography to deposit thin layers properly in specified areas on the substrate to provide the designed topology at the micro level. Together with utilizing nanostructures such as SWCNTs, this makes it possible to design nanosized junctions and channels already at the nanoscale level and fabricate sensor layers in a reproducible and controllable manner. Furthermore, this technology allows one easier placing a number of sensors as a multisensor array [30] on a single substrate with controlled parameters to advance a selectivity while detecting gases and their mixtures [31,32]. Herein, we propose sensors based on SWCNTs in combination with WO3 and Pt nanolayers, as well as their fabrication technology. The control of the stages of the technological process makes it possible to obtain structures that differ from each other in the gas sensitivity mechanisms. The manufacture of sensors with specified characteristics has a positive effect on their joint application as a part of a multisensor gas-analytical system, where significant differences in the behavior of sensor responses to gases are welcome to advance their selectivity to analytes. The developed multisensor array has been tested regarding the recognition of NH3 vapors against the background of humidity.

2. Materials and Methods

2.1. Fabrication of Structures under Study

Using magnetron sputtering and lift-off photolithography on glass substrates, 12 × 12 mm, the metallization regions, 20 × 20 µm, were formed as an array with a 30 µm period (Figure 1). The metallization areas consisted of successively deposited W/Pt/W layers, each 10 nm thick. The upper layer of tungsten (W) was oxidized to grow a tungsten oxide (WO3) by annealing in air at the temperature of ca. 380 °C in oven (Mikroterm-70, Spark-Don, Volgodonsk, Russia). This temperature has been found sufficient for the oxidation of tungsten, accounting for numerous literature data (see, for example, [33,34]), and has been further confirmed in the experiment. Another sample type was obtained in a similar way but with the top tungsten layer covering the entire substrate surface.
The use of structures with island metallization areas made it possible to target forming the nanojunctions of CNT-Pt and CNT-WO3, which is difficult to implement in composites due to the heterogeneity of the distribution of materials regarding each other, even at the micro level. The continuous WO3 layers, without making the Pt-sublayer periodic structure with island metallization areas, would not allow one yielding the WO3 nanochannels to form between the SWCNT and Pt layers. The vertically aligned WO3 nanochannels, whose length has been targeted by thickness of pristine continuous WO3 layer, are located between Pt sublayer and top SWCNT layer. The width of these WO3 nanochannels is controlled by SWCNT diameter (Figure 1, cross-section of SWCNT40-WO3 sample). Still, top non-continuous networked SWCNT layer does not inhibit access of NH3 or H2O molecules to the nanochannel. These nanochannels allowed us to reduce the operating temperature of the sensor down to RT due to the lower resistance of such an oxide nanochannel structure when compared to rather long microchannels between metal electrodes to be conventionally employed in the sensors.
Then, SWCNTs (P3-SWNT, Carbon Solutions, Riverside, CA, USA) were deposited by spray coating with a low aerosol flow density on the surface of six samples in four separate processes (Figure 1) employing own-designed pneumatic spray-coating system [35] from the N-methylpyrrolidone: water dispersion, of 3:7 ratio, with various volumes chosen for each process purposes. The dispersion’s output going from the spray nozzle was governed by managing the effective throughput via shifting a locking needle. The deposition was performed over the substrate heated up to 120 °C to be followed by treating the samples with formic acid of analytical grade purity in order to remove the residual solvent from the as-prepared SWCNT layer. For each of the structure types, the deposition process was individual. Together with the WO3/Pt/W layer-based structure under study, we have employed a pure glass substrate in the chamber as a reference during SWCNT’s deposition to prepare a satellite sample. In a separate process, to compare the effect of SWCNT network density on sensor response, two additional samples were fabricated on glass substrates, with a similar (called hereafter, rSWCNT54) and higher (called hereafter, rSWCNT174) network density than the above-described structures.
Contacts to sensors were fabricated with Ag paste followed by its drying under infra-red irradiation at 85–100 °C with the formation of wire leads at negligibly small, relative to the resistance of the sensor channel, contact resistance.

2.2. Material Characterization Methods

The layer non-uniformity and the SWCNT network density were estimated by atomic force microscopy (AFM) (Solver-Pro, NT-MDT, Zelenograd, Moscow, Russia) and via analyzing the SWCNT G-peak intensity, IG, in Raman maps. The Raman spectroscopy maps were acquired with the spectrometer (Centaur-UHR, Nano Scan Technology, Dolgoprudny, Russia) equipped with a laser, 532 nm wavelength [36]. The layer non-uniformity was estimated as a ratio of standard deviation of IG in the Raman map to the median value of IG.
Thus, six gas-sensing structures employing SWCNTs were prepared altogether for the study: (1) with a WO3 layer located only on Pt/W to form the SWCNT-Pt junction, called hereafter as SWCNT50-Pt, (2) with a continuous layer of WO3 formed over the entire surface of the substrate to form SWCNT-WO3 heterojunctions with WO3 nanochannels, called hereafter as SWCNT40-WO3; (3) two corresponding satellite samples with SWCNTs, called hereafter as sSWCNT50 and sSWCNT40, where the network density has been equal to 50 a.u. and 40 a.u., respectively, to be manufactured by spray deposition according to routes numbered by 1 and 2 in Figure 1; (4) two additional reference samples with varied SWCNT network densities, rSWCNT54 and rSWCNT174, where the network density is equal to 54 a.u. and 174 a.u., respectively, according to routes numbered by 3 and 4 in Figure 1. These sensors were measured simultaneously under all the test measurements as an array. The temperature coefficient of resistance (TCR) was evaluated for the fabricated structures as the averaged changes in the resistivity of each sample with a stepwise change of temperature by 10 °C in the range of 50–100 °C under dry airflow conditions.

2.3. Gas-Sensing Measurements

In order to measure the gas sensor response, the NH3 vapors were obtained by evaporating a measured micro-volume of 25% aqueous ammonia solution, of analytical grade, in a bottle, of 26 l volume to yield the basic concentrations of about 18 ppm, 40 ppm, 70 ppm, and 135 ppm. We have utilized dry or humid, 45 rel.%, air as the background carrier gas. The humidity level of 45% was chosen as rather typical one for ambient air humidity, close to the average value of 50–60% RH found in Europe [37]. At the same time, the former research showed that quite significant changes in the sensor response are observed for SWCNTs and composite structures of CNTs/WO3 at this range of background RH when compared to one in dry air [18,29]. The temperature of 30 °C, which is somewhat higher than RT of about 23–28 °C, was chosen to keep the sensors stable in all the measurements and to ensure its independence from environment temperature.
The NH3 exposures were independently monitored/registered with a commercial semiconductor sensor (TGS826 sensor , Figaro Engineering Inc., Minoo city, Osaka, Japan). Vapors were let into a chamber containing all the sensors with a 0.2 L/min flow rate to be managed by the gas-flow controller (MKS Instruments Inc., Burlington, MA USA).
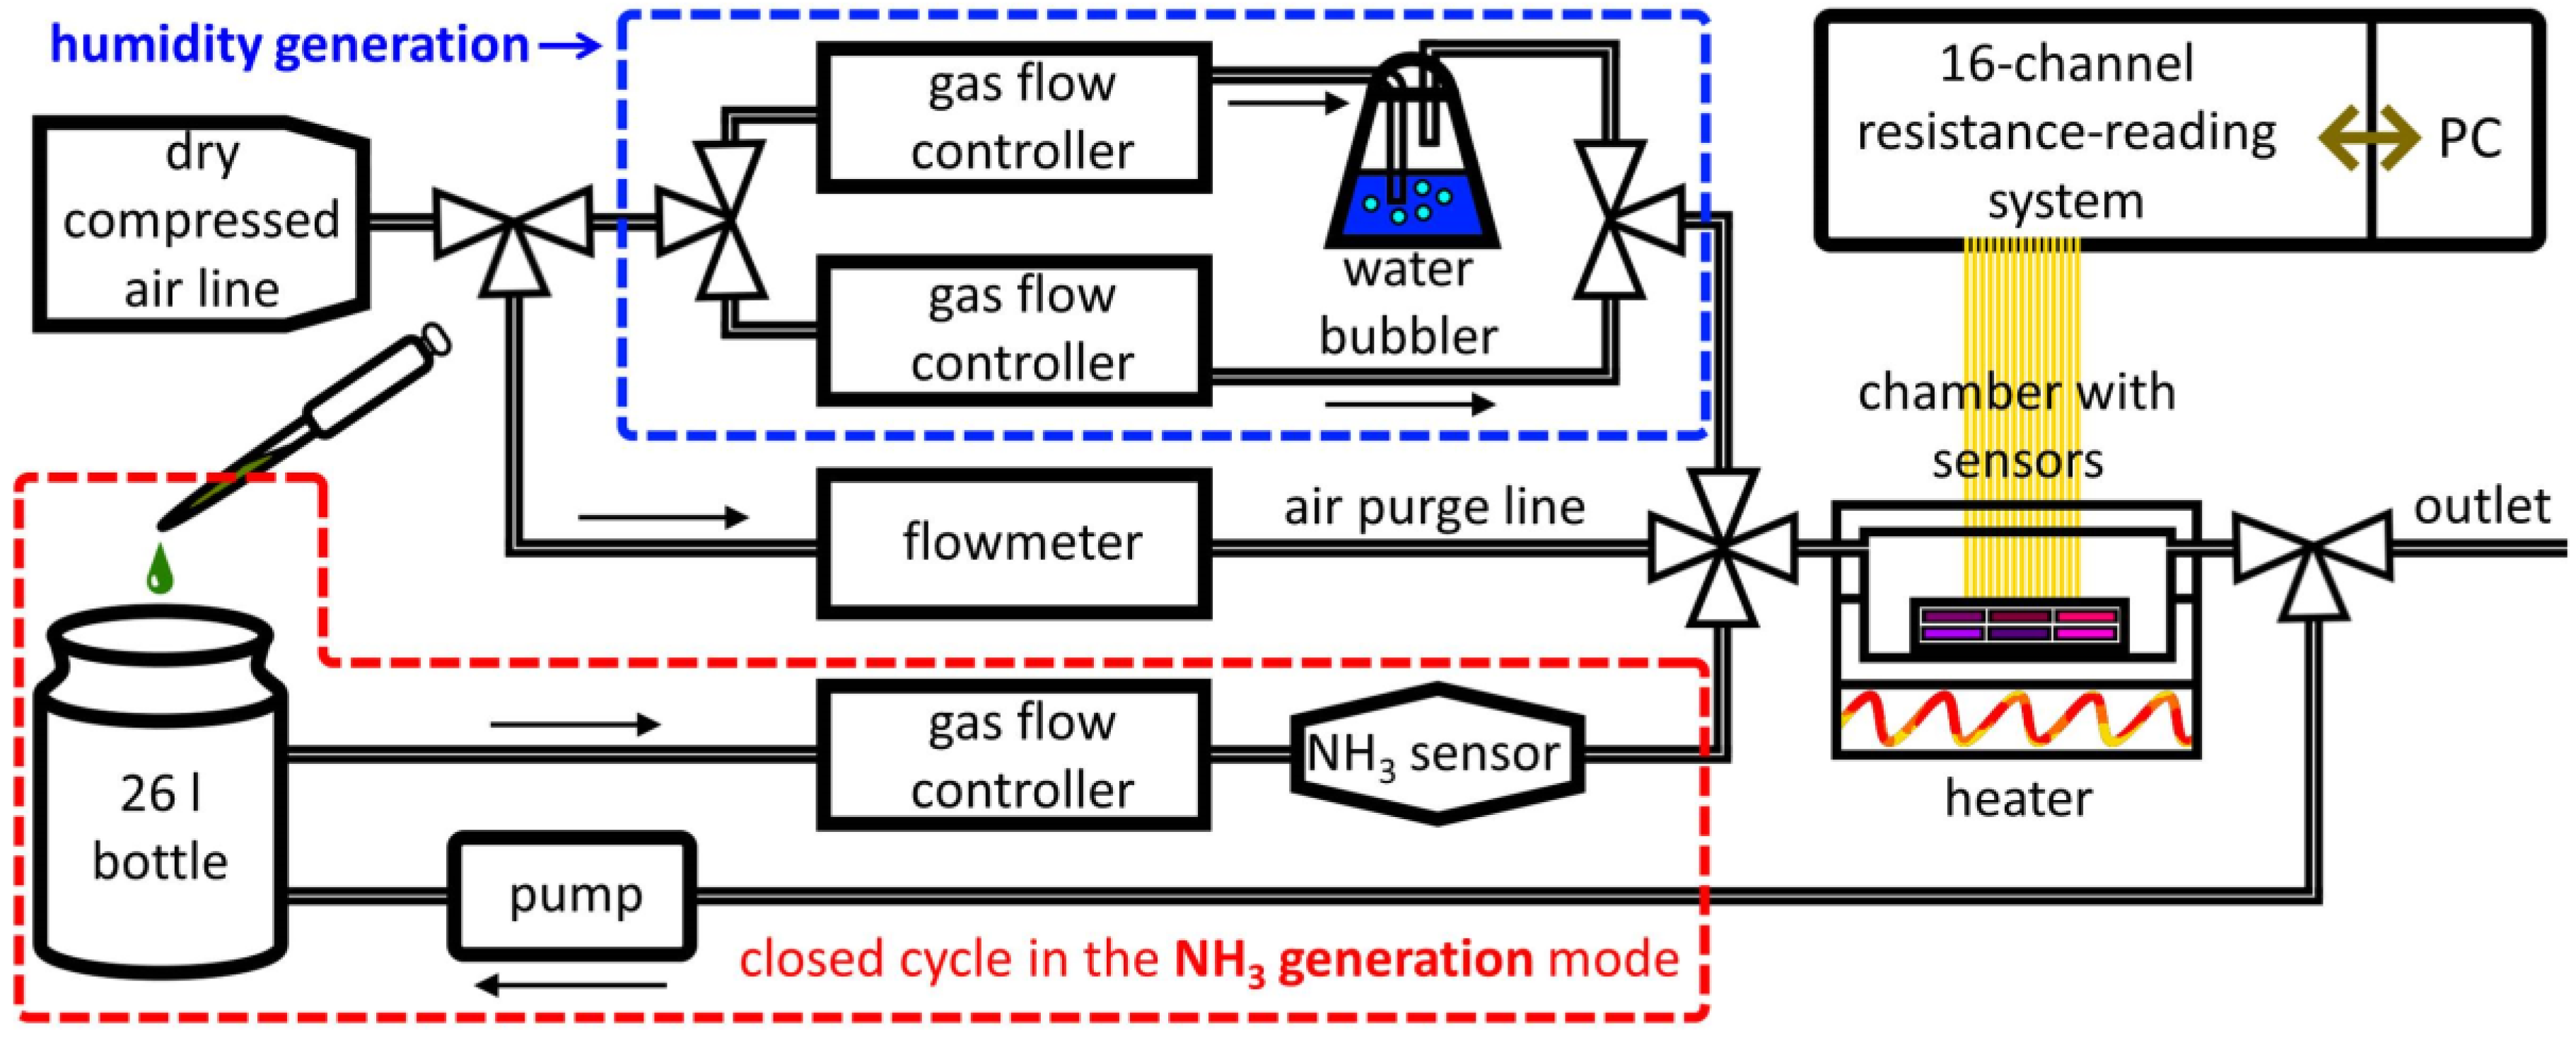
The sensor recovery was carried out by passing an analyte-free air flow at 2.5 L/min flow rate. The resistance of the sensors was measured with a 16-channel multiplexing system equipped with computer software, which provides data storage and a display as a graph on a real-time scale (IPS-16, Praktik-NTs, Zelenograd, Moscow, Russia). The sensor resistances were read in a sequential mode with a rate of 1 s per sensor. The measuring setup is shown in Figure 2. In order to deliver the prepared ammonia concentration, a closed supply cycle was used. Here, NH3 vapors were forwarded from the evaporation bottle to the measuring chamber containing the sensors and then returned by the pump (Figure 2, elements grouped by a red dotted line).
Prior the measuring, the samples were annealed at 100 °C in a dry air flow for 2 h to stabilize the properties and to remove any residuals following the sensor’s preparation.

2.4. Processing of Sensor Responses

Linear discriminant analysis (LDA) was applied to the resistance data sets from the multisensor array as a recognition algorithm in order to classify these vector data into clusters at the artificial coordinate system in accordance with the test gas mixtures as classes to be recognized [38]. We have considered six gas mixtures, namely 135 ppm and 40 ppm NH3 in dry air, 135 ppm NH3 in mixture with wet air, 45 rel.%, and air with RH = 0%, 13%, and 45%. For LDA processing, we have considered taking vector data sampling of 50 points measured under quasi-stationary conditions of the sensors upon exposure to each tested analyte at temperature of ca. 30 °C. The gas response of the sensor structures has been estimated as a relative change of resistance in percent, S = ∆R/R0, where ∆R is a resistance change upon sensor exposure to analytes at each measurement cycle, R0 is the resistance in the background (air) before each measuring cycle with a new analyte’s or its changed concentration exposure.
The limit of detection (LOD) was estimated by extrapolating the experimental data, which could be well fitted with a power function describing the dependence of the sensor response (%), S, on the ammonia concentration in dry air (ppm), C, as S = k·Cn, where k and n are the coefficients to be estimated by fitting.
While going to the S(C) range of low analyte’ concentration, the LOD value was derived at the point where the noise magnitude is equalized with the sensor response taken from the S(C) fitting function. At the same time, the noise magnitude was evaluated as 5 times of standard deviation, taken over a sampling of 50 resistance measurement points under dry background air according to methodology proposed previously for SWCNT-based sensors [39]. The approach proved to be viable and described the behavior of the sensor response quite well for sub-ppm concentrations down to 30 ppb as described elsewhere [29].

3. Results and Discussion

3.1. Characterization of the Sensor Structures Layers Parameters

Due to the oxidation of the top W layer, the overall height of the final WO3/Pt/W layer in SWCNT50-Pt and SWCNT40-WO3 sensors increased from ca. 35 nm to more than ca. 50 nm (Figure 3).
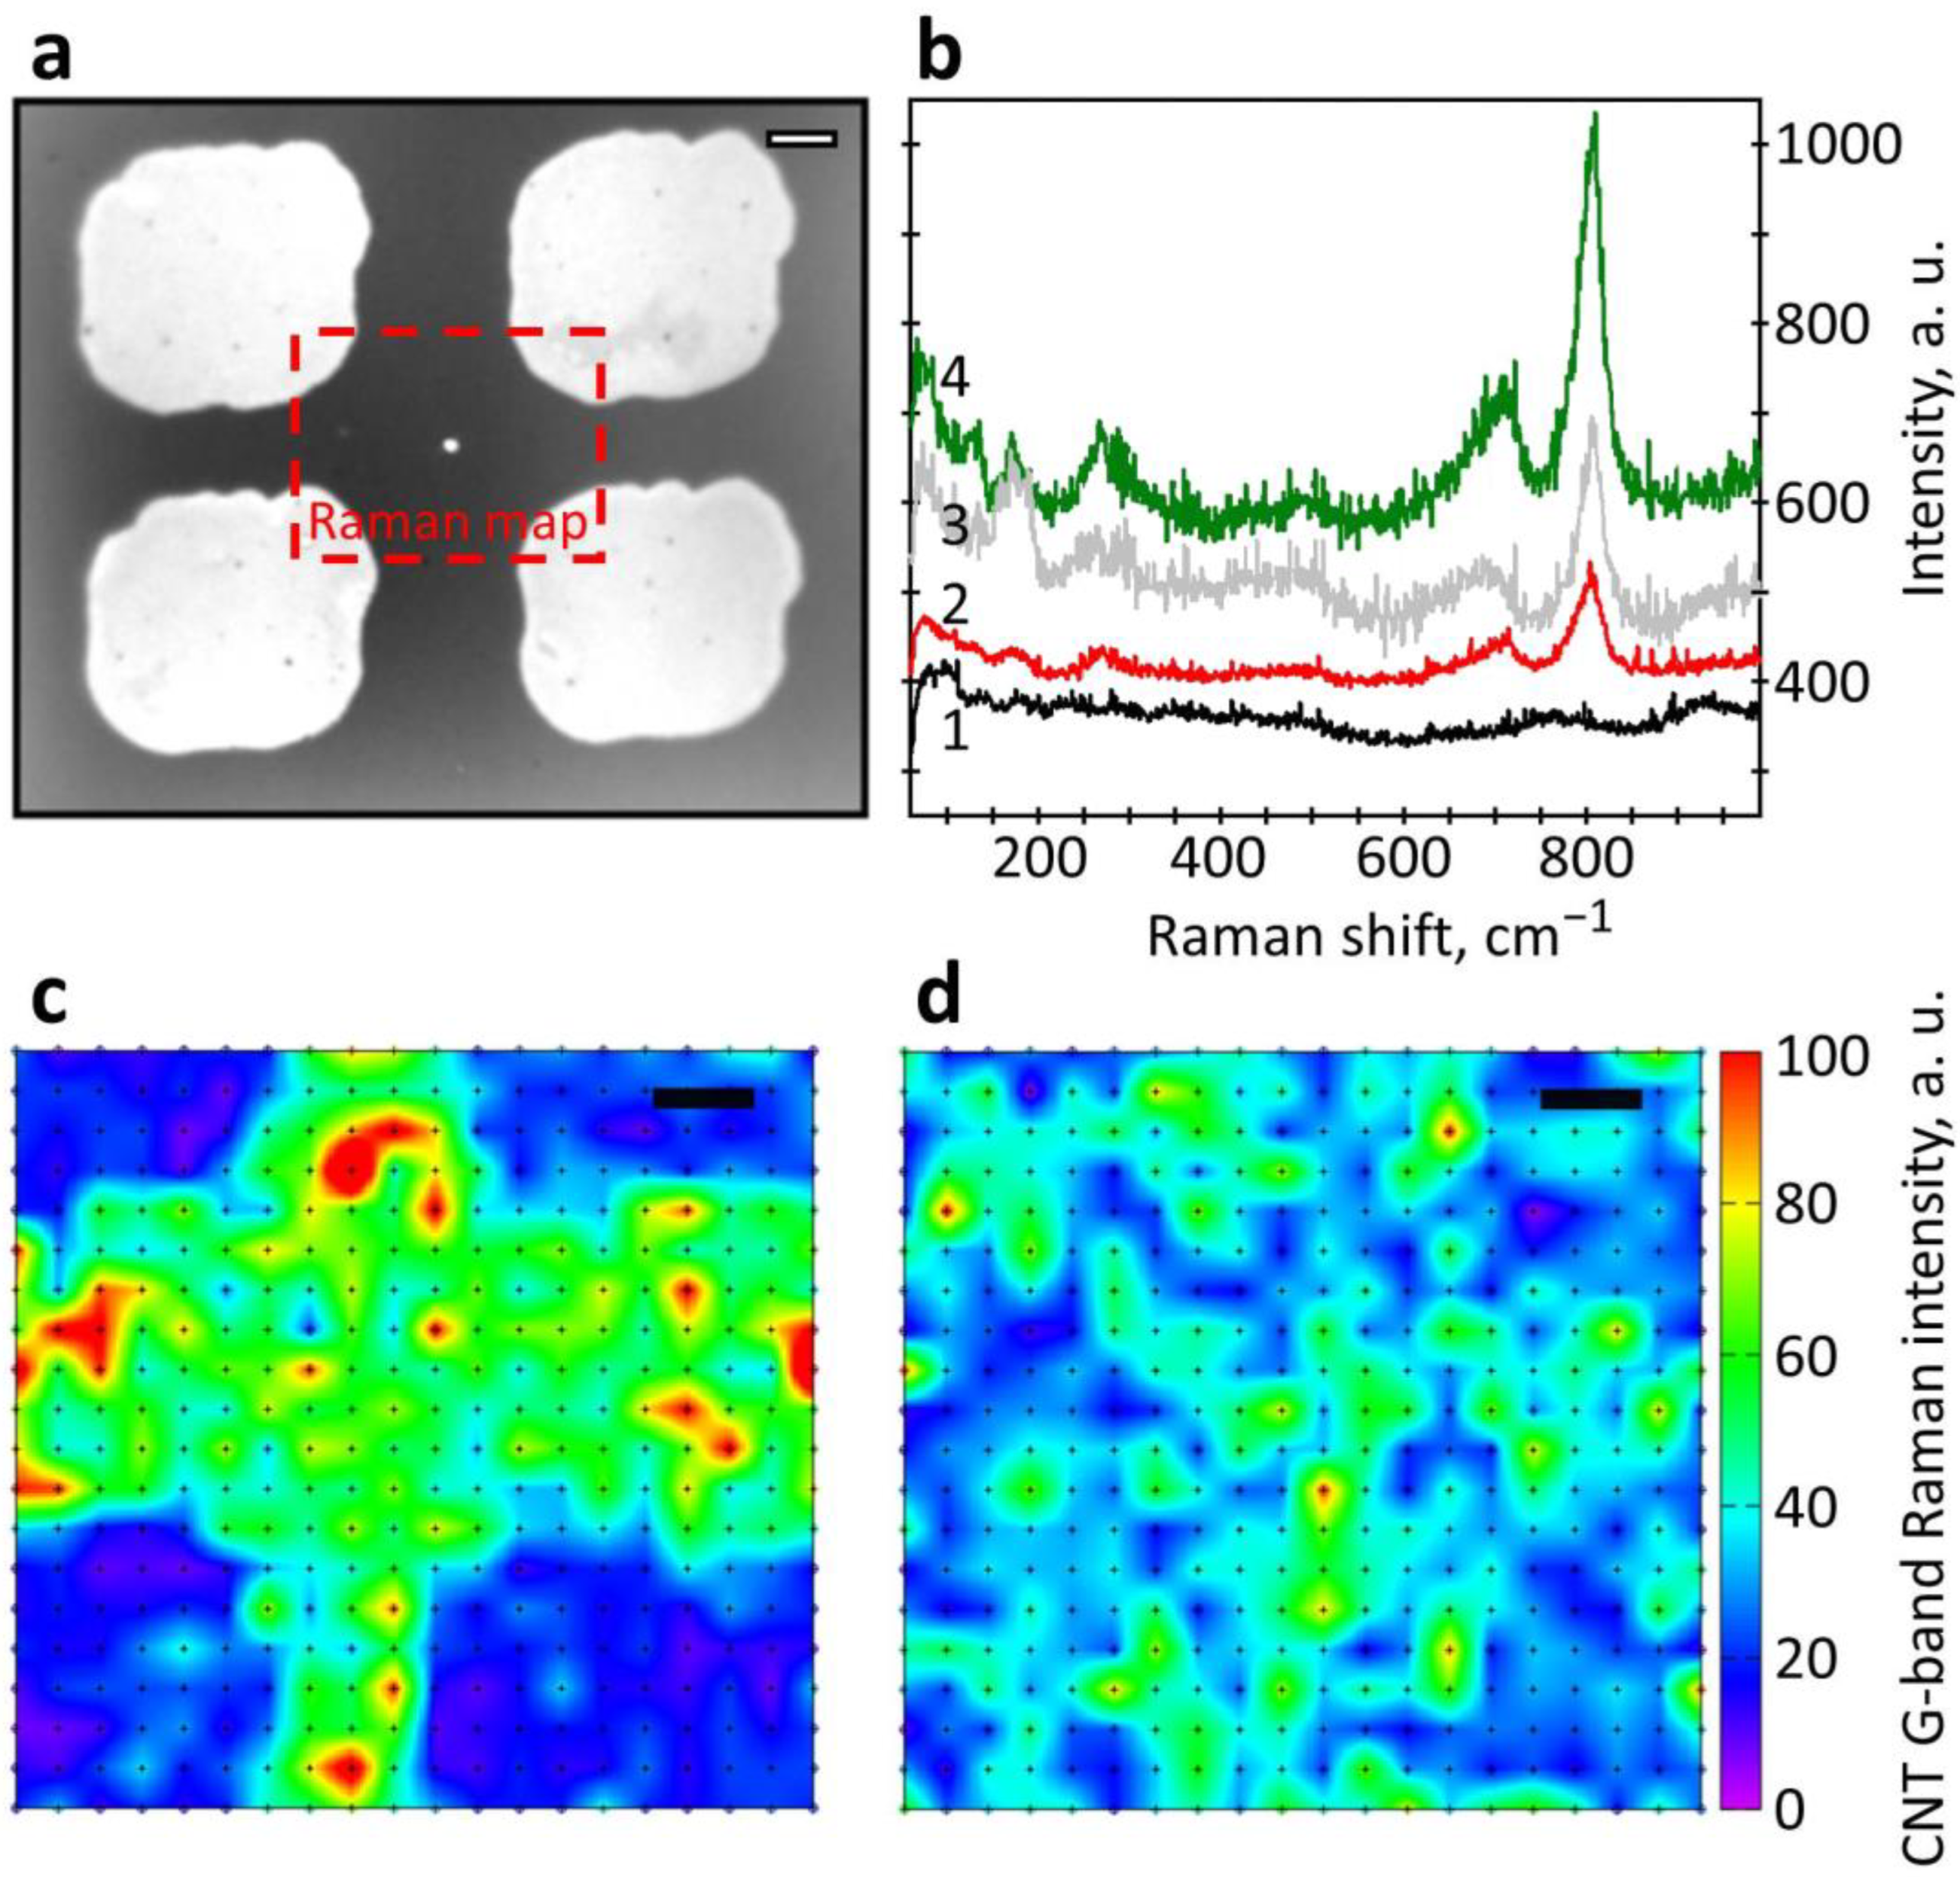
The appearance of WO3 with crystalline structure was indexed by measuring the Raman spectra via recording the corresponding peaks at 265 cm−1, 705 cm−1, and 805 cm−1 [40,41], as shown in Figure 4a,b. Figure 4a gives an optical image of the sensor layer taken with ×100 microscope objective where the marked area has been considered for taking the Raman map. Still, it is worth noting that the peaks were observed at the thin WO3 layer located on top of the Pt layer and were not registered at the thin WO3 layer located on the glass surface. This is due to enhancing Raman scattering from the oxide located over Pt islands in frames of so-called the surface-enhanced Raman scattering (SERS) effect [42]. The island-like structure of the Pt layer is characterized by the specific resistivity value of ca. 0.5 kΩ/Sq., which is almost 30 times higher than the known data for the bulk Pt and significantly more, 3–5 times than one observed for the layers with a thickness of 3–5 nm [43]. This effect appears at thicknesses being noticeably smaller than that of the thin Pt layer having an island-like structure [43] and smaller than ones in our structures, equal to 10 nm. After the oxidation process, the WO3 thickness was 20–25 nm (Figure 3c).
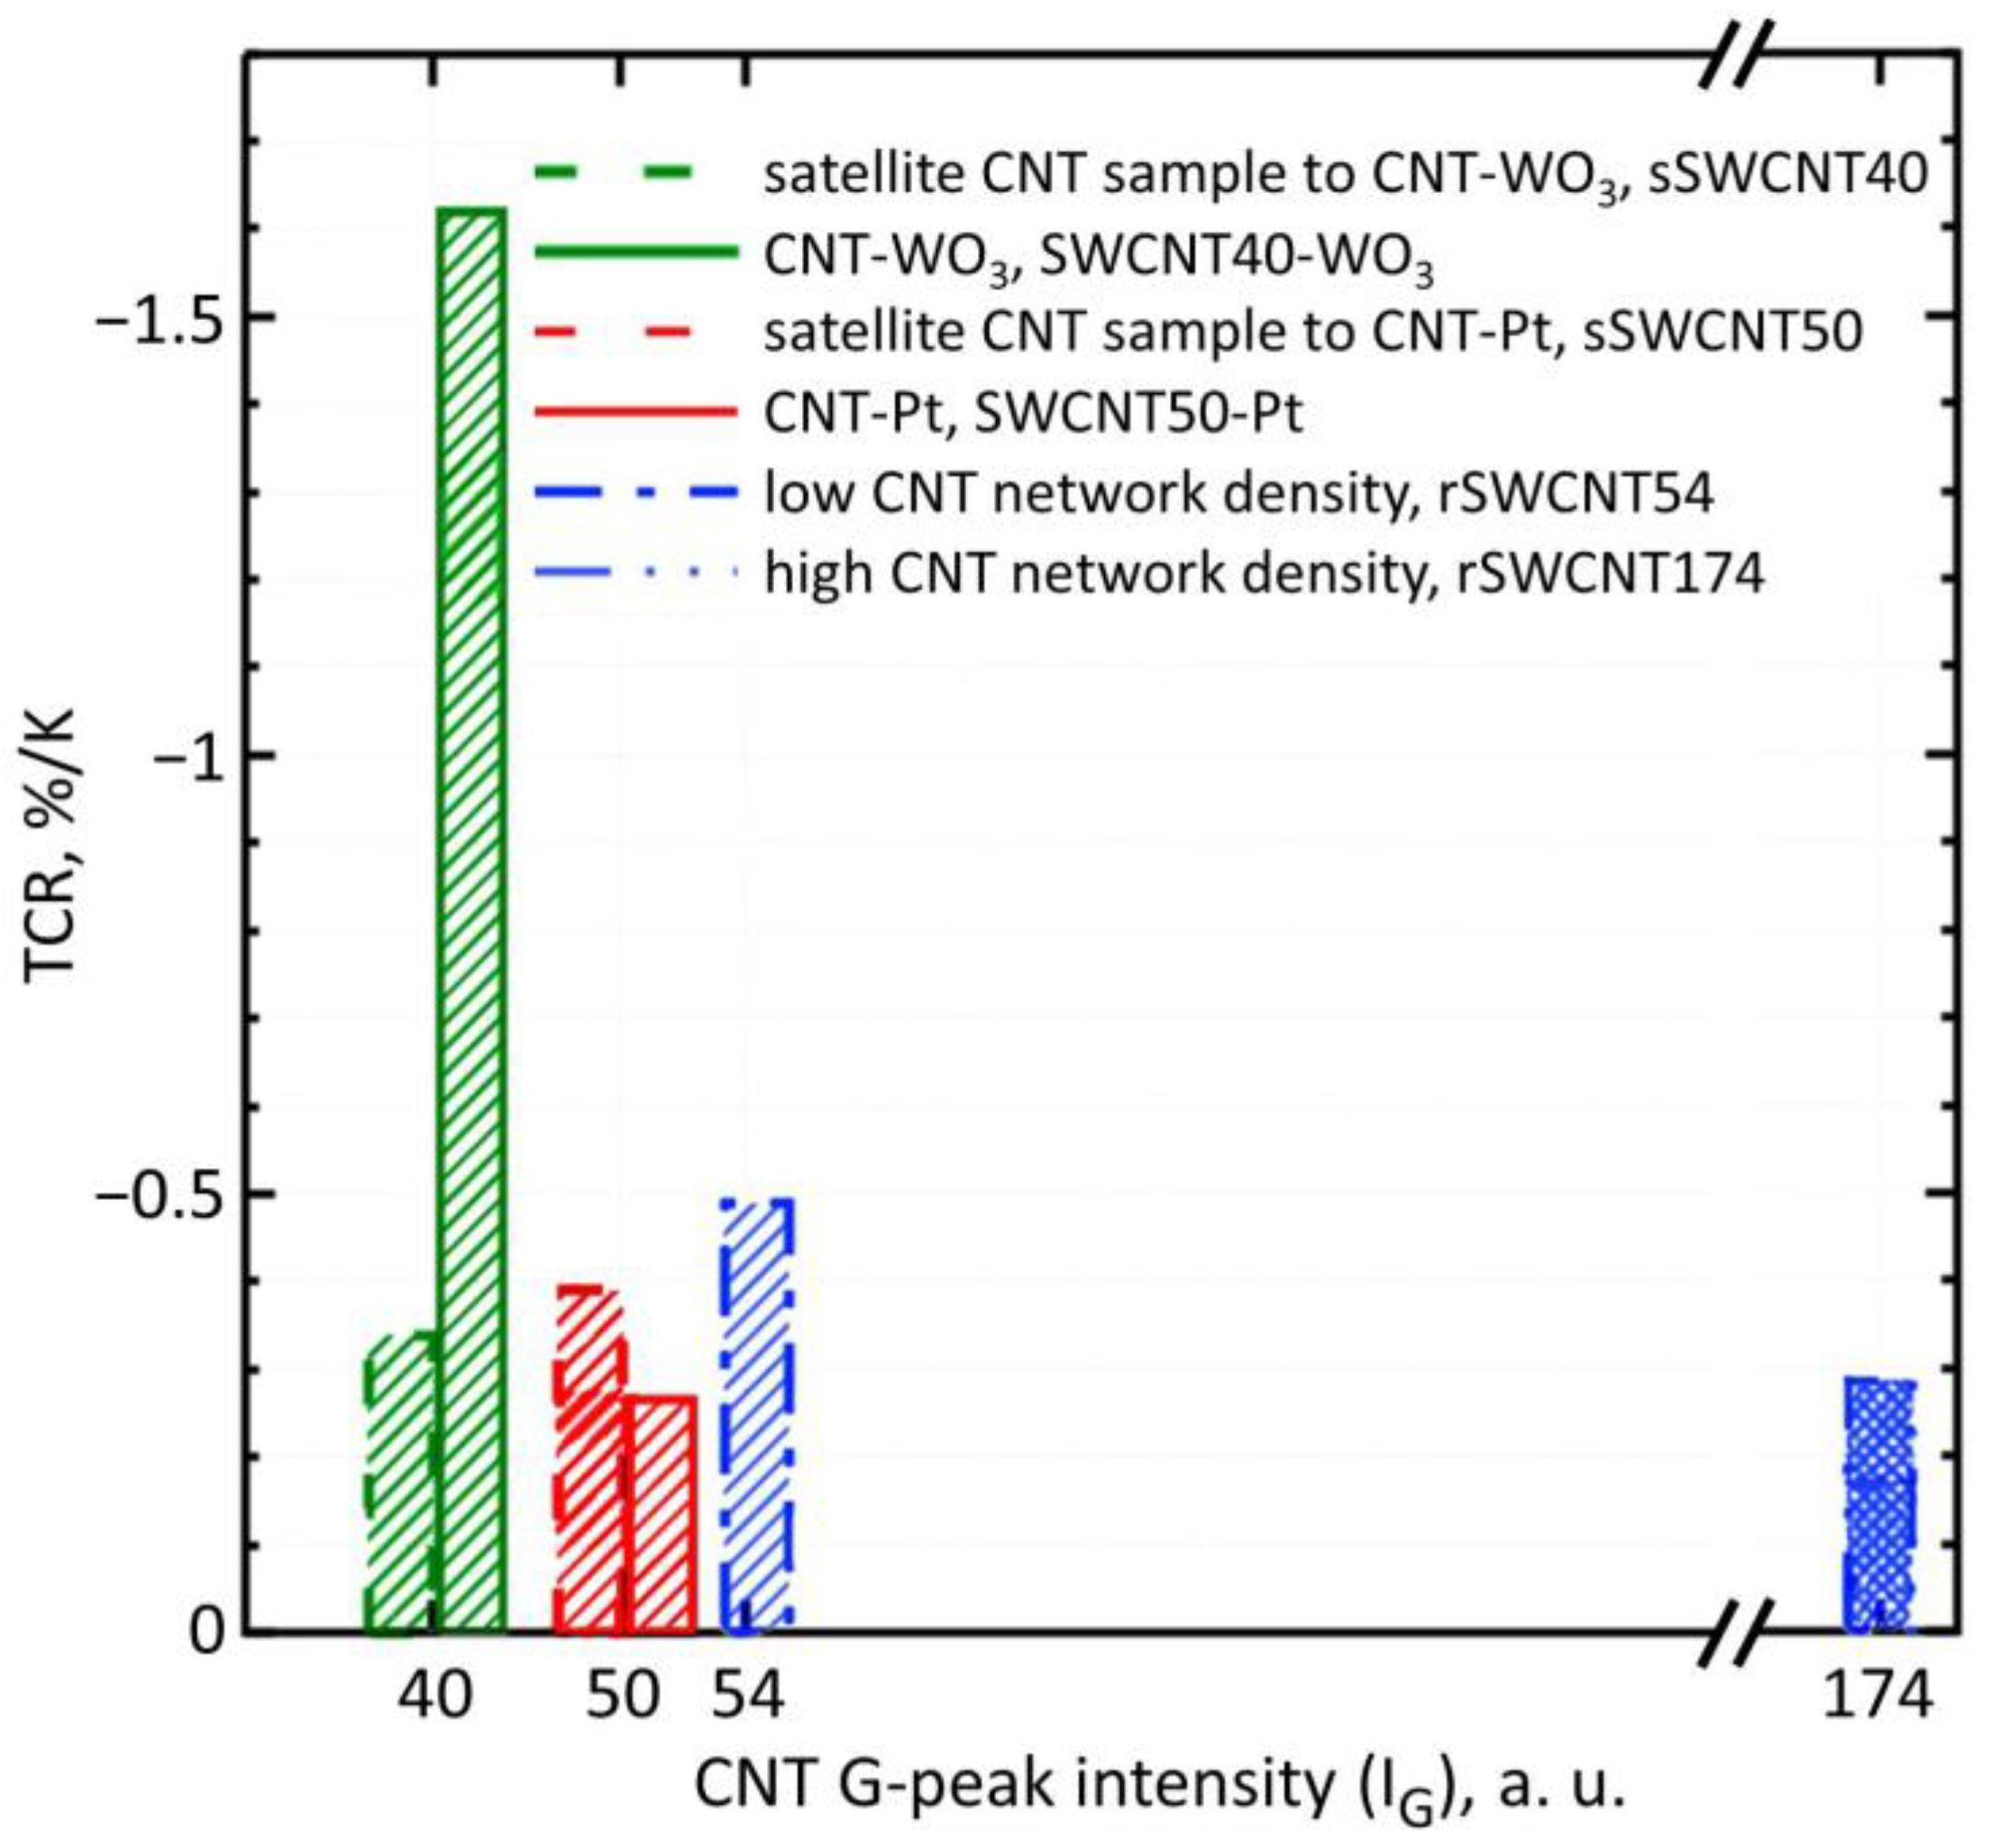
The resistance-to-temperature data have shown that TCR in SWCNT50-Pt structure is about −0.26%/K, while for the TCR of its satellite, sSWCNT50, the sample is about −0.39%/K, as plotted in Figure 5. In Figure 5, the values along the horizontal axis are the IG median values characterizing the CNT network density of the corresponding structure. This mean value of SWCNT network density can be visually evaluated by the prevailing color in the recorded color map, which displays the distribution of the G-peak intensity in Raman maps for two types of structures, as shown in Figure 4c,d. These values indicate that the SWCNT-Pt junction and the Pt sublayer have a significant influence on the resistance upon heating. TCR modulus of the SWCN50-Pt structure is lower than one of satellite sSWCNT50, which indicates the influence of both the SWCNT-WO3 junction and WO3, is negligible in the overall conducting channel for that structure type. Still, the TCR of WO3 is about −2.4%/K [44]. In the case of composite layers with a WO3 content of about 30–50%, as is partially the case for the SWCNT40-WO3 sample (Figure 1), where a part of the conductive channels is caused not only by oxide but also another material, the TCR modulus significantly reduces down to 1.5%/K [45]). The effect of this WO3 conducting channel on the overall conductance in the structure should enhance the TCR modulus value over that of pure SWCNTs. In addition, it should be noted that the resistivity of the SWCNT50-Pt structure was only 180 kΩ/Sq. against 1.8 MΩ/Sq. of the satellite, sSWCNT50, sample.
Thanks to the TCR measurement, it is possible to confirm the contribution of the SWCNT-Pt or SWCNT-WO3 junctions and, therefore, WO3 nanochannels to the resistance of the sensor layer. Despite the fact that the parameters of the SWCNT network, density and uniformity, for the pairs of structures, SWCNT50-Pt, sSWCNT50 and SWCNT40-WO3, sSWCNT40, are the same, the TCR of such structures significantly differs.

3.2. The Characterization of Gas-Sensing Performance of the Sensor Structures

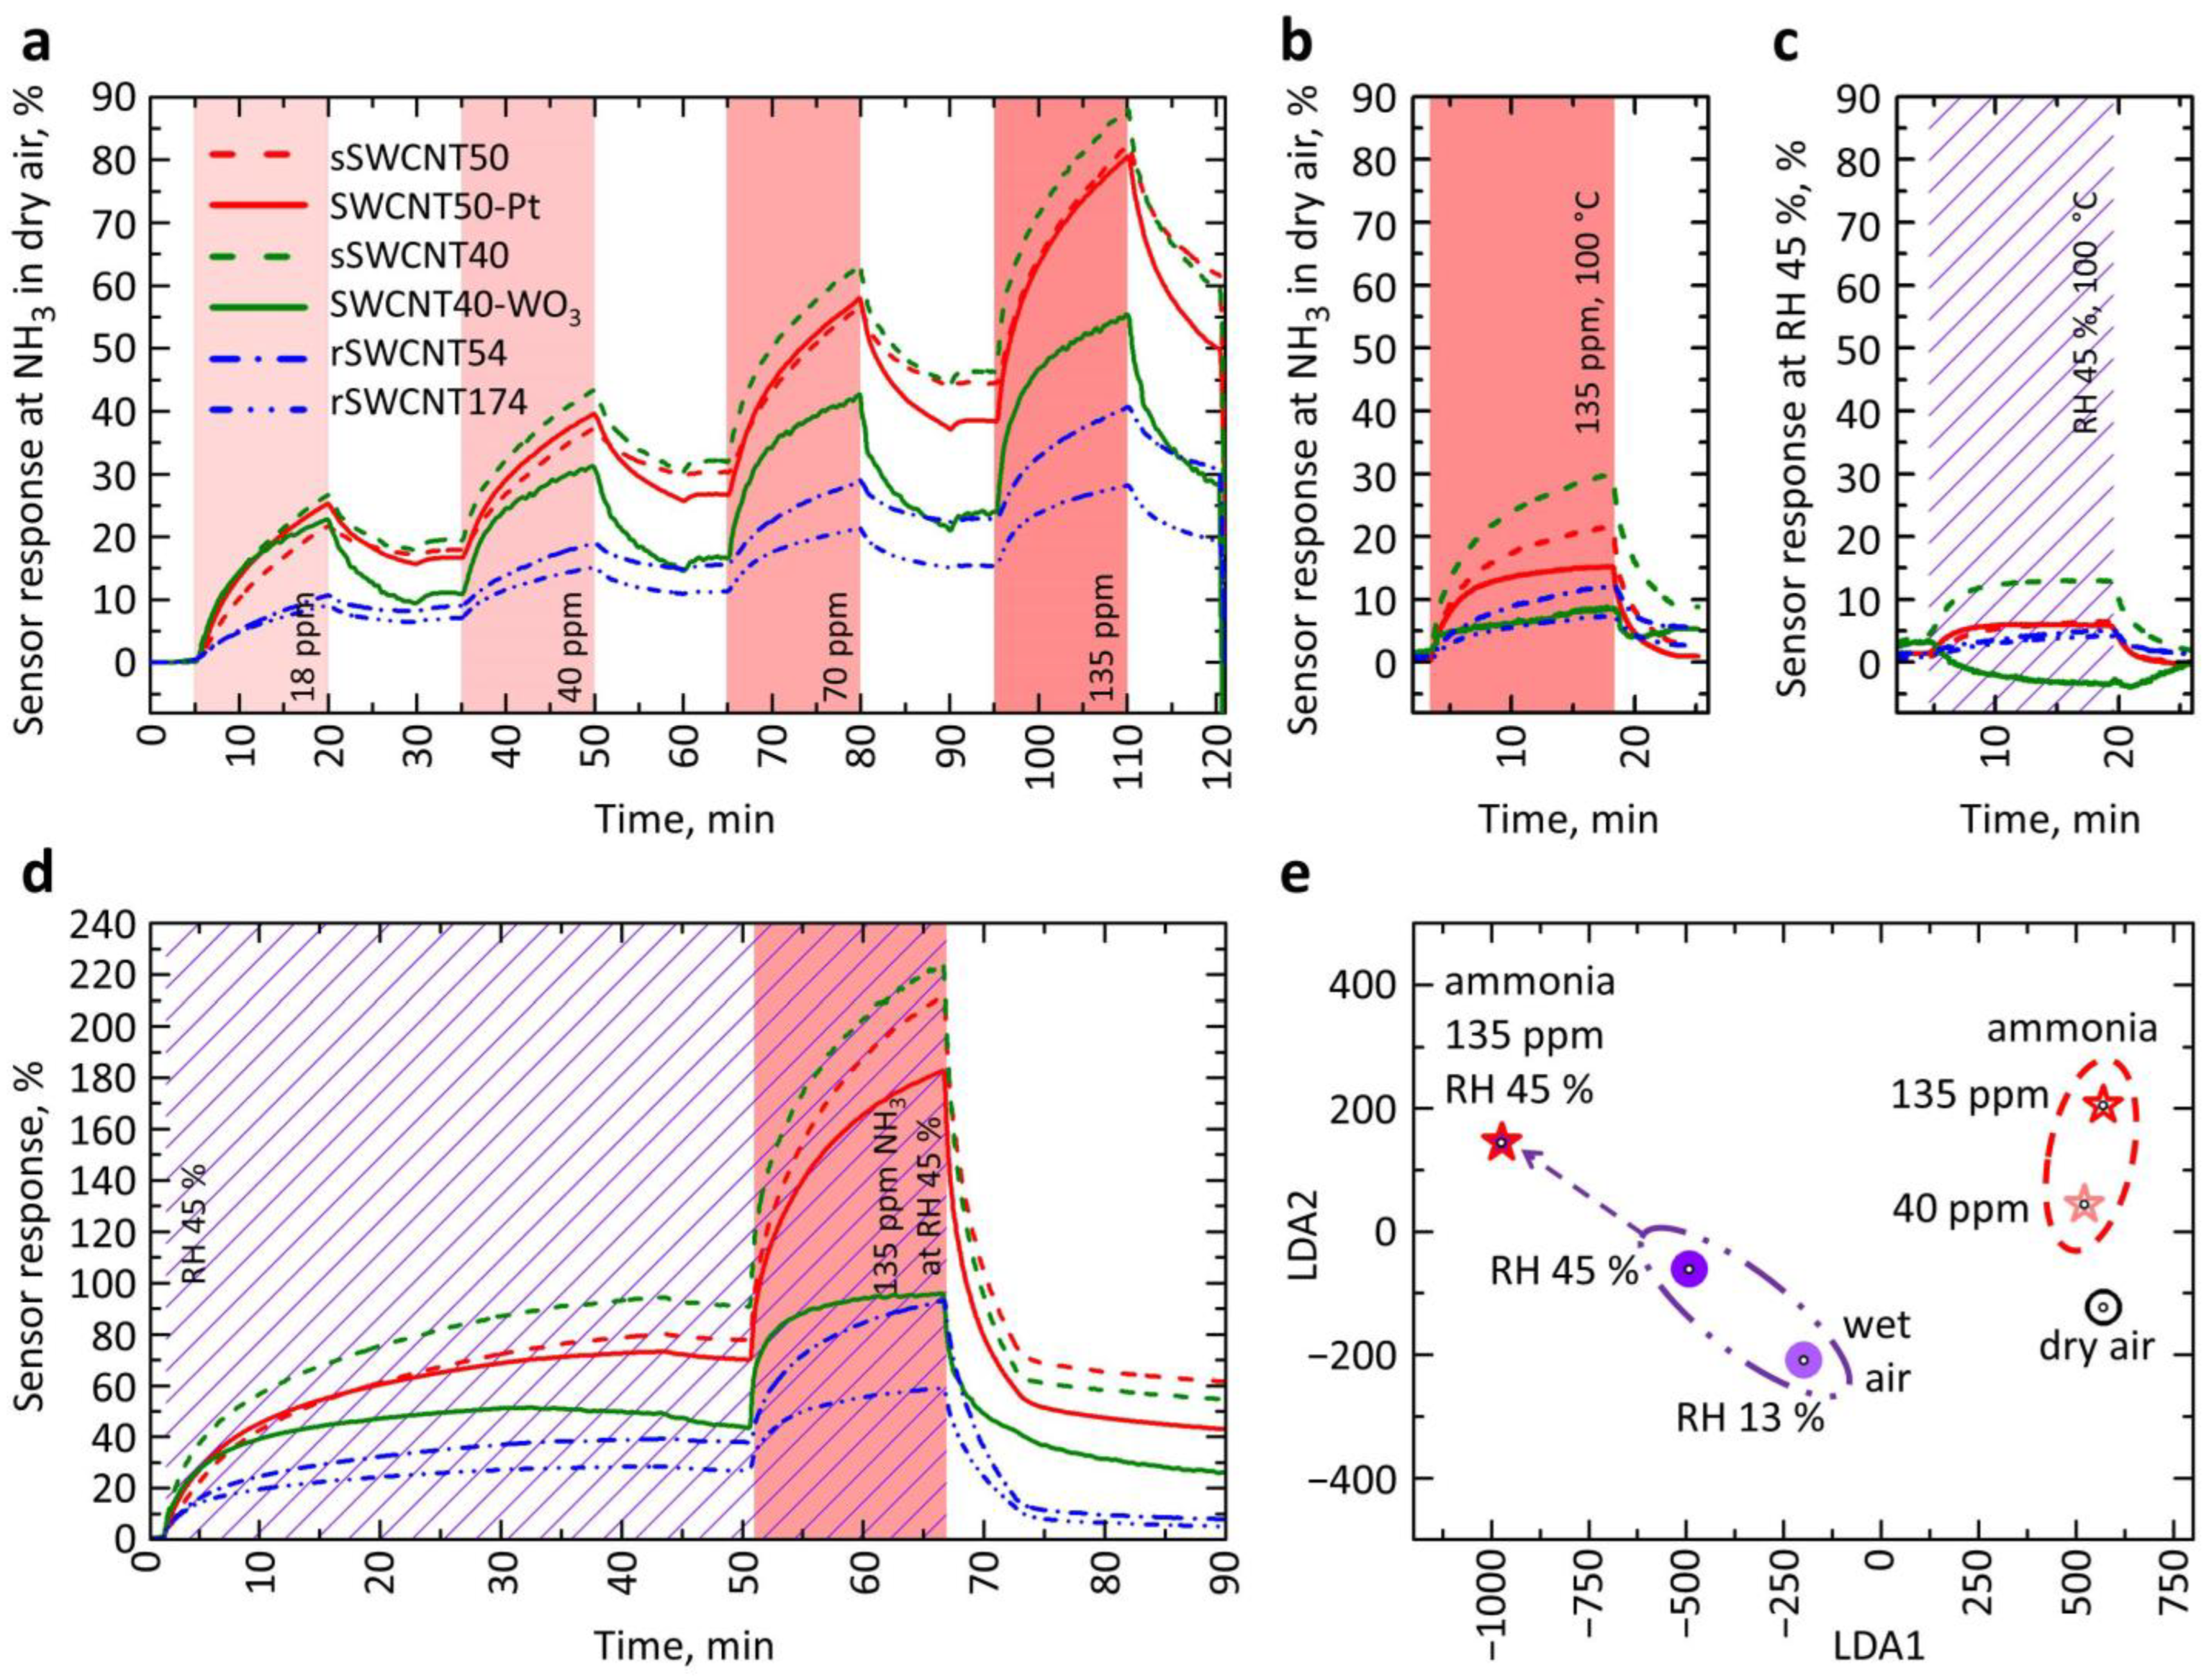
Despite the differences in TCR and resistance, SWCNT50-Pt and sSWCNT50 structures were found to exhibit almost the same sensor response to 135 ppm of NH3 at RT, about 30% and 25%, respectively (Figure 6a). From the literature data, the semiconducting SWCNTs make a major contribution to the sensor response [46]. Thus, we may suggest that the SWCNT50-Pt structure with a lower value of TCR modulus and, consequently, a smaller effect on the resulting resistance and TCR from semiconducting SWCNTs would also have a lower sensor response relative to the satellite, sSWCNT50, sample.
This might be explained via a partial shunting of the nanotubes with other conductance channels formed by the Pt layer with SWCNT-Pt junctions. Because a reduction of the sensor response is not observed, it can be concluded that the junction between SWCNTs and Pt has a significant effect on the sensor response. Still, the SWCNT-Pt junction is known to improve significantly, up to ca. 6–10% upon 150 ppm of NH3 exposure, the sensor response even when the metal-type CNTs are used [47,48]. This also explains that the rSWCNT174 sample with a high-density SWCNT network, but with a similar TCR, of ca. −0.27%/K and resistivity of ca. 80 kΩ/Sq. yields a lower sensor response to 135 ppm of NH3, equal to ~11%, than that of SWCNT-Pt structure.
Despite minor differences in the TCR, the sensor responses of satellite samples and reference samples (rSWCNT54) with similar network densities and with different SWCNT network densities (rSWCNT174) are significantly varied. With a decrease in the SWCNT network density, we have observed enhancing the sensor response. It seems this matures from a significant contribution of semiconducting SWCNTs [49] whose effective length, between SWCNT junctions, is increased at the overall conducting channel. It is worth noting that the effective length of SWCNTs is enlarged as (i) the network density and/or (ii) the non-uniformity of the SWCNT layer are reduced. The network’s non-uniformity of satellite SWCNT samples, being estimated equal to 0.42 for IG = 50 a.u., is lower than one of the additional samples, rSWCNT54, where the value was 0.65 for IG = 54 a.u., at the similar network density.
At the same time, the structures with a lower non-uniformity of the SWCNT network, even at a similar SWCNT network density, exhibit a significantly greater sensor response, which can be seen by comparing the responses of the sSWCNT50 and rSWCNT54 samples. The obtained responses to ammonia in dry air are significantly higher than in other studies with sensors based on an SWCNT network [29,46] both for satellite samples containing only SWCNTs sSWCNT40 and sSWCNT50 and for the SWCNT40-WO3 and SWCNT50-Pt structures, which are drawn in Figure S1. For comparison purposes, Figure S1 shows how the sensor response varies s with the NH3 concentration for all the studied sensors and the literature data. The deposition of SWCNTs for the SWCNT-Pt structure occurs with some non-uniformity: a lower SWCNT network density was found in the WO3/Pt/W regions, in contrast to uniformity over the entire surface for the SWCNT50-WO3 sample. Nevertheless, the non-uniformity of the SWCNT network itself over glass regions for both structures of the SWCNT-Pt and the SWCNT-WO3 is similar to 0.46. Thus, some differences in SWCNT deposition for SWCNT50-Pt and SWCNT40-WO3 structures cannot explain the differences observed in their gas-sensing responses.
The sensor response of the SWCNT-Pt structure measured in forward to 135 ppm of NH3, as exemplary exposure, has significantly decreased to 14.5% when the operating temperature has raised from RT up to 100 °C (Figure 6b). At the same time, the satellite sample, sSWCNT50, demonstrated under the heating the sensor response to be only slightly lower, equal to 21%, than one at 30 °C. The sensor response of the rSWCNT54 sample, having a low network density, IG = 54 a.u., resistivity of ~1 MΩ/Sq. and TCR of −0.49%/K has also slightly reduced from 14% at 30 °C to 11% at 100 °C. This indicates that the contribution of SWCNT-Pt junctions to the sensor response decreases with increasing temperature, which is similar to the behavior of other heterojunctions [19] because the effect of the Schottky barrier in the SWCNT-Pt junction is diminished. On the other hand, the SWCNT40-WO3 structure does not exhibit significant differences in sensor response to NH3 relative to its satellite sample, sSWCNT40, at 30 °C (Figure 6a). At the same time, the SWCNT-WO3 structure has a higher TCR modulus (Figure 5) and higher resistivity than the satellite sample, to be 8.5 MΩ/Sq. versus 1.2 MΩ/Sq.
It is rather well known that WO3 does not yield a noticeable sensor response to NH3 at RT but being heated to 100–150 °C the WO3 nanostructures could exhibit a significant sensor response as a decrease in resistance, for instance, yielding the response to 120 ppm NH3 at 150 °C equal to 75%, and at 50 °C, −25% [40]. However, our measurements demonstrated a decrease in the sensor response of the SWCNT-WO3 structure to NH3 vapors at a temperature of 100 °C. We guess the lower sensor response, 6.5%, at 100 °C is due to the opposite reaction of SWCNTs and WO3 materials to the analyte. The sensor response of the satellite, sSWCNT40, the sample under similar conditions is 28.6%. Thus, it can be assumed that the negative sensor response, as a resistance reduction, of the WO3 nanochannel might be about 22% (6.5% minus 28.6%). In the absence of doping, the estimated response is sufficiently high for WO3 [40,50]. This is due to the small width, length, and thickness of the channel, which is equal to the film thickness of ca. 25 nm. In the structures where the channel is given as a continuous oxide film, the response is lower at 100 °C by a few orders [51]. Although the estimate of the WO3 response in the SWCNT40-WO3 structure under study is still lower than the best response known from the literature for this material, the fabricated structure exhibits a substantially lower response time, being of ca. 10 min, when compared, for instance, to WO3 nanoflakes [16]) where the characteristic time has been observed equally to ca. 100 min.
The SWCNT50-Pt and SWCNT40-WO3 structures exhibit a higher initial sensor response rate compared to the satellite samples and saturate earlier when exposed to NH3. This effect is more pronounced when exposed to NH3 vapor against the background of air with RH = 45% (Figure 6a,d). The reason for such behavior seems to come from the significant influence of small contact areas on the sensor response. As a result, sensors based on SWCNT-Pt and SWCNT-WO3 junctions exhibit not only increasing the speed of the sensor response but also yield some selectivity to a particular gas mixture. The chemiresistive response of the WO3 layer to humidity is known to be quite high even at RT; as reported elsewhere [28], there might be observed a drop in resistance by 50%. At the same time, the sensor response of satellite samples and additional samples with SWCNTs to wet air of 45 rel.% is characterized by increasing the resistance (called frequently as a positive sensor response) both under 30 °C and 100 °C.
Thus, the chemiresistive effect in the SWCNT-WO3 structure is contributed by two oppositely-directed responses of SWCNTs and WO3. Based on the difference in the responses of the SWCNT-WO3 structure and the satellite sample, it can be concluded that WO3 changes its resistance in humidity, of 45 rel.%, by 40% at 30 °C (85–45%, Figure 6d) and by 15% at 100 °C (10%–(−5%), Figure 6c). The sensor response of the satellite SWCNT sample also goes down from 85% to 10% under the heating (Figure 6c,d). It is worth noting that the sensor response of SWCNTs decreases more than one of WO3; therefore, the effect of the WO3 channel on the overall resistance is more pronounced when the sample is heated. As a result, the response of the SWCNT-WO3 structure to H2O vapors is lower than that of the satellite sample at 30 °C. For comparison, the sensor response’s dependence on H2O vapor concentration is drawn in Figure S2a for all the SWCNT-based structures under study at RT compared to known literature data. The typical sensor response transients, response, and recovery, recorded upon exposure to H2O at various concentrations, 13%, 30%, 45%, and 55% RH, in the dry air background under RT are displayed in Figure S2b. At 100 °C, the contribution of the WO3 channel to the sensor layer conductance becomes decisive, and the resistance of the SWCNT-WO3 structure in water vapors reduces (Figure 6c).

3.3. The Analysis of the Gas-Selectivity of Manufactured Multisensor Array

It should be recognized that the structures with heterojunctions studied in this work do not demonstrate a significant enhancement of the sensor response when compared to other published results [18,19]. At the same time, significant differences were observed in the behavior of the sensor response of these structures, even at RT. For example, the sensor responses of SWCNT50-Pt and SWCNT40-WO3 structures to NH3 vapors in dry air are the same, but the sensor responses of these structures recorded in wet air, of 45 rel.% differ significantly in comparison to their satellite SWCNT samples. Therefore, combining the sensors under study into a multisensor array makes it possible to selectively recognize the presence of NH3 against the air under varied humidity interference (Figure 6a,d).
Following the LDA processing of the multisensor vector signals collected from the sensors, we have built the five-dimensional LDA space accounting for the classes related to testing analytes. The two-dimensional cross-section of this space is displayed in Figure 6e. As one can see, there is a reliable separation of multisensor vector signals versus gas mixtures into clusters, even when taking only four sensor structures, SWCNT-Pt, SWCNT-WO3, and their satellite samples, when combining them into the multisensory array. This manifests itself in the form of large distances between centers of gravity characterizing all the clusters, much larger than the radius of the cluster corresponding to each mixture of gases in Figure 6e, which was about 3 a.u., is marked on the graph with small black circles. These circles are developed under the assumption of normal distribution of signals, at 0.9 confidence, within each class. This allows us to conclude that it is possible to reliably recognize both the humidity and different concentrations of ammonia even in the presence of background air humidity.
Thus, the specific behavior of these sensors upon exposure to the vapors was sufficient to recognize different concentrations of NH3 against the background of dry and wet, 45 rel.%, air and to recognize the wet air containing various levels of humidity, RH = 0%, 13%, and 45%. The mutual arrangement of clusters corresponding to various gas mixtures eliminates the possibility of incorrect recognition during a “transition” from clusters related to one vapor concentration to another one, from air to ammonia in dry air, and to ammonia in air containing water vapors. Compared to other works, where the difference between the sensing structures composing the on-chip multisensor array is designed via changing, for instance, a surface filter of varied thickness [52], or varied sensor layer thickness [38], the proposed multisensor array provides higher selectivity, which could be valued via distance between gravity centers of the analyte-related clusters in the LDA space, to NH3 in air, even containing various content of humidity. It should be noted that the multisensor array, which includes structures with just SWCNTs and SWCNT-Pt while leaving out the SWCNT-WO3 structure, provides a lower selective signal though it still ensures the recognition of the gas mixtures. At the same time, the array composed of four sensors that do not include SWCNT-WO3 or SWCNT-Pt structures could not allow us to obtain a selectivity since it contains only pure SWCNT-based samples which do not deliver a specific behavior of the sensor response to the analytes. In addition, based on the measurements carried out at 30 °C and 100 °C, in order to further increase the selectivity of the multisensor array, different temperature operation modes implemented by the temperature gradient on the substrate can be set for the sensors [53], which can also advance the response speed of the sensors and reduce their recovery time.

3.4. Evaluation of Sensor Detection Limits

As described above, the LOD value was evaluated taking the methodology proposed previously for SWCNT-based sensors [39], where LOD was estimated to be 3 ppb. With this purpose, the observed experimental data (Figure 6a) have been fit by a power function to describe the dependence of the sensor response (Figure S1). These data, as well as the results of the LOD evaluation, are shown in Table 1. It should be noted that the NH3-sensing results obtained for the SWCNT50-Pt, sSWCNT50 structures, and even for the SWCNT40-WO3 structure, given that it has a significantly higher channel resistance and TCR, are better than the data known from the literature for sensors based on SWCNTs.
This can be explained by the rather high sensitivity of sensor structures based on low-density SWCNT networks in combination with the low noise that these structures exhibit. In general, for all types of sensors under this study, the estimated LOD is at an acceptable level for the analysis of ammonia in ambient air (less than 30 ppb, [7]). This allows us to conclude that the studied set of gas sensors, together with the fact that it also provides a sufficiently reliable recognition of ammonia against the background of air humidity, could be used in electronic devices for environmental monitoring.

4. Conclusions

In summary, the lift-off photolithography of the W/Pt/W sublayer, subsequent oxidation of the upper tungsten layer, and controlled spray deposition of SWCNTs make it possible to form gas-sensor structures based on SWCNT-Pt junctions. We have observed the SERS effect while characterizing WO3 on the island sublayer of Pt. The TCR modulus of the SWCNT-Pt structure is found to be significantly lower than that of the satellite SWCNT one, but the sensor response to NH3 vapors in dry air differs very slightly for these sensors at RT. It seems that the influence of the SWCNT-Pt junction on the sensor response is equally important as the effect of the SWCNT network and semiconducting SWCNTs in it. At the same time, the sensor response of the SWCNT-Pt structure to NH3 is less than one of the satellite SWCNT samples at 100 °C. This behavior is associated with a decrease in the influence of the heterojunctions on the resulting response of the SWCNT-Pt structure under heating. Furthermore, the response of the SWCNT-Pt structure to NH3 vapors in wet air, of RH = 45%, is lower than that of its satellite SWCNT sample, even at 30 °C. The deposition of SWCNTs onto a WO3 layer placed over the entire surface of a glass substrate with Pt/W regions makes it possible to form SWCNT-WO3 junctions and, thereby, WO3 nanochannels. The TCR modulus of such a structure is much higher than that of the satellite SWCNT sample due to the contribution of WO3 nanochannels to the overall conductance. The sensor response of the SWCNT-WO3 structure to ammonia is comparable to that of the satellite structure at 30 °C. When the sensors are heated to 100 °C, the SWCNT40-WO3 structure has a lower response relative to the satellite sSWCNT40 sample as a result of increasing the effect of the WO3 nanochannels that reduces the sensor resistance in NH3. The response of an SWCNT-WO3 structure to ammonia in wet air of 45 rel.% is significantly lower than that of a satellite SWCNT sample. This is only partially explained by the significant response of WO3, which, unlike SWCNTs, reduces its resistance in water vapors even at RT. In other words, the effect cannot be reduced only to a simple algebraic sum of multidirectional responses of CNTs and WO3 for this mixture of gases, but it can also be partially explained by a change in the properties of the substrate surface at which SWCNT networks located: from hydrophilic glass to more hydrophobic WO3.
As a result, a specific difference in the sensor response for SWCNT-Pt and even more pronounced for the SWCNT-WO3 structure with respect to SWCNTs was realized even at RT. This makes it possible to manufacture a multisensor array based on a set of just four sensors (SWCNT-Pt, SWCNT-WO3, and their satellite samples only with SWCNTs) which allows one using LDA to recognize different concentrations of NH3 against the background of humidity at various levels. Still, a multisensor array based only on SWCNTs samples does not allow this. Such a multisensor array with an estimated detection limit at the ppb range can be used in devices for NH3 monitoring in the environment, health monitoring, and other applications.

Supplementary Materials

The following supporting information can be downloaded at: https://www.mdpi.com/article/10.3390/chemosensors10110476/s1, Figure S1: The dependencies of sensor responses on NH3 concentration for SWCNT-based structures under study at dry air background at RT, in comparison to the reference literature data. The experimental results are indicated by dots, the lines are built under fitting with a power function to the experimental data. The parameters of the fitting functions for sensors under study are given in Table 1; Figure S2: The responses of sensor structures to H2O vapors. (a) The dependencies of sensor responses on relative humidity content in air for SWCNT-based structures under study at RT, in comparison to the reference literature data. The experimental results are indicated by dots, the lines designate fitting with a power function to experimental data. (b) Changes in the sensor response magnitudes in time at exposing to water vapors of various concentrations, 13%, 30%, 45%, 55% RH, at RT, at dry air background and in the process of sensors recovering in a dry air flow. The shaded areas show the analyte’s exposure time intervals. References [29,46] are cited in the supplementary materials.

Author Contributions

Conceptualization, A.V.R. and A.V.L.; data curation, A.V.R. and A.V.L.; formal analysis, A.V.R., A.V.L. and N.S.S.; funding acquisition, A.V.R., A.V.L. and V.V.S.; investigation, A.V.R. and A.V.L.; methodology, A.V.R., N.S.S., E.V.A. and D.D.L.; project administration, A.V.R. and A.V.L.; resources, A.V.L., V.V.S. and D.D.L.; software, A.V.L., supervision, V.V.S.; writing—original draft, A.V.R., A.V.L. and V.V.S.; writing—review and editing, A.V.R., A.V.L. and V.V.S. All authors have read and agreed to the published version of the manuscript.

Funding

This work was supported by RFBR, project number 19-38-60034 (A.V.L.), to metal-oxide sub-layer formation by photolithography, sensor response study, LDA; and was carried out with the financial assistance of the Ministry of Education and Science in the framework of state task FSMR-2020-0017 (A.V.R., N.S.S., E.V.A., D.D.L.), to development, carbon nanotube spray-deposition, Raman spectroscopy, AFM and TCR measurements. V.V.S. thanks Russian Science Foundation, grant no. 22-29-00793, for a partial support.

Institutional Review Board Statement

Not applicable.

Informed Consent Statement

Not applicable.

Data Availability Statement

All relevant data are contained within the article; further data are available from the corresponding author under request.

Conflicts of Interest

The authors declare no conflict of interest.

References

  1. Timmer, B.; Olthuis, W.; Van Den Berg, A. Ammonia sensors and their applications—A review. Sens. Actuators B Chem. 2005, 107, 666–677. [Google Scholar] [CrossRef]
  2. Kwak, D.; Lei, Y.; Maric, R. Ammonia gas sensors: A comprehensive review. Talanta 2019, 204, 713–730. [Google Scholar] [CrossRef] [PubMed]
  3. Goswami, P.; Gupta, G. Recent progress of flexible NO2 and NH3 gas sensors based on transition metal dichalcogenides for room temperature sensing. Mater. Today Chem. 2022, 23, 100726. [Google Scholar] [CrossRef]
  4. Kalita, A.; Hussain, S.; Malik, A.H.; Subbarao, N.V.V.; Iyer, P.K. Vapor phase sensing of ammonia at the sub-ppm level using a perylene diimide thin film device. J. Mater. Chem. C 2015, 3, 10767–10774. [Google Scholar] [CrossRef]
  5. Targowski, S.P.; Klucinski, W.; Babiker, S.; Nonnecke, B.J. Effect of ammonia on in vivo and in vitro immune responses. Infect. Immun. 1984, 43, 289–293. [Google Scholar] [CrossRef] [Green Version]
  6. Devos, M.; Patte, F.; Rouault, J.; Laffort, P.; Van Gemert, L.J. Standardized Human Olfactory Thresholds; Oxford University Press: Oxford, UK, 1990. [Google Scholar]
  7. Petrus, M.; Popa, C.; Bratu, A.M. Ammonia concentration in ambient air in a Peri-urban area using a laser photoacoustic spectroscopy detector. Materials 2022, 15, 3182. [Google Scholar] [CrossRef]
  8. Wang, Y.-C.; Han, M.-F.; Jia, T.-P.; Hu, X.-R.; Zhu, H.-Q.; Tong, Z.; Lin, Y.-T.; Wang, C.; Liu, D.-Z.; Peng, Y.-Z.; et al. Emissions, measurement, and control of odor in livestock farms: A review. Sci. Total Environ. 2021, 776, 145735. [Google Scholar] [CrossRef]
  9. Shaalan, N.M.; Ahmed, F.; Saber, O.; Kumar, S. Gases in food production and monitoring: Recent advances in target chemiresistive gas sensors. Chemosensors 2022, 10, 338. [Google Scholar] [CrossRef]
  10. Tang, X.; Debliquy, M.; Lahem, D.; Yan, Y.; Raskin, J.-P. A review on functionalized graphene sensors for detection of ammonia. Sensors 2021, 21, 1443. [Google Scholar] [CrossRef]
  11. Bevc, S.; Mohorko, E.; Kolar, M.; Brglez, P.; Holobar, A.; Kniepeiss, D.; Podbregar, M.; Piko, N.; Hojs, N.; Knehtl, M.; et al. Measurement of breath ammonia for detection of patients with chronic kidney disease. Clin. Nephrol. 2017, 88, S14–S17. [Google Scholar] [CrossRef]
  12. Das, S.; Pal, S.; Mitra, M. Significance of exhaled breath test in clinical diagnosis: A special focus on the detection of diabetes mellitus. J. Med. Biol. Eng. 2016, 36, 605–624. [Google Scholar] [CrossRef] [PubMed] [Green Version]
  13. Michalski, R.; Pecyna-Utylska, P.; Kernert, J. Determination of ammonium and biogenic amines by ion chromatography. A review. J. Chromatogr. A 2021, 1651, 462319. [Google Scholar] [CrossRef] [PubMed]
  14. Gupta, P.; Maurya, S.; Pandey, K.N.; Verma, V. Metal-oxide based ammonia gas sensors: A review. Nanosci. Nanotechnol.-Asia 2021, 11, 270–289. [Google Scholar] [CrossRef]
  15. Chou, T.C.; Chang, C.H.; Lee, C.; Liu, W.C. Ammonia sensing characteristics of a tungsten trioxide thin-film-based sensor. IEEE Trans. Electron Devices 2018, 66, 696–701. [Google Scholar] [CrossRef]
  16. Büyükköse, S. Highly selective and sensitive WO3 nanoflakes based ammonia sensor. Mater. Sci. Semicond. Process. 2020, 110, 104969. [Google Scholar] [CrossRef]
  17. Luo, W.; Zhao, T.; Li, Y.; Wei, J.; Xu, P.; Li, X.; Wang, Y.; Zhang, W.; Elzatahry, A.A.; Alghamdi, A.; et al. A micelle fusion-aggregation assembly approach to mesoporous carbon materials with rich active sites for ultrasensitive ammonia sensing. J. Am. Chem. Soc. 2016, 138, 12586–12595. [Google Scholar] [CrossRef]
  18. Duong, V.; Nguyen, C.; Luong, H.; Nguyen, D.; Nguyen, H. Ultralow-detection limit ammonia gas sensors at room temperature based on MWCNT/WO3 nanocomposite and effect of humidity. Solid State Sci. 2021, 113, 106534. [Google Scholar] [CrossRef]
  19. Nguyet, Q.T.M.; Van Duy, N.; Manh Hung, C.; Hoa, N.D.; Van Hieu, N. Ultrasensitive NO2 gas sensors using hybrid heterojunctions of multi-walled carbon nanotubes and on-chip grown SnO2 nanowires. Appl. Phys. Lett. 2018, 112, 153110. [Google Scholar] [CrossRef]
  20. Chiou, J.-C.; Wu, C.-C. A wearable and wireless gas-sensing system using flexible polymer/multi-walled carbon nanotube composite films. Polymers 2017, 9, 457. [Google Scholar] [CrossRef] [Green Version]
  21. Kumar, N.; Prajesh, R. Selectivity enhancement for metal oxide (MOX) based gas sensor using thermally modulated datasets coupled with golden section optimization and chemometric techniques. Rev. Sci. Instrum. 2022, 93, 064702. [Google Scholar] [CrossRef]
  22. Norizan, M.N.; Abdullah, N.; Halim, N.A.; Demon, S.Z.N.; Mohamad, I.S. Heterojunctions of rGO/metal oxide nanocomposites as promising gas-sensing materials—A review. Nanomaterials 2022, 12, 2278. [Google Scholar] [CrossRef] [PubMed]
  23. Bannov, A.G.; Popov, M.V.; Brester, A.E.; Kurmashov, P.B. Recent advances in ammonia gas sensors based on carbon nanomaterials. Micromachines 2021, 12, 186. [Google Scholar] [CrossRef] [PubMed]
  24. Liu, Y.; Xiao, S.; Du, K. Chemiresistive gas sensors based on hollow heterojunction: A review. Adv. Mater. Interfaces 2021, 8, 2002122. [Google Scholar] [CrossRef]
  25. Lei, G.; Lou, C.; Liu, X.; Xie, J.; Li, Z.; Zheng, W.; Zhang, J. Thin films of tungsten oxide materials for advanced gas sensors. Sens. Actuators B Chem. 2021, 341, 129996. [Google Scholar] [CrossRef]
  26. Ma, N.; Suematsu, K.; Yuasa, M.; Kida, T.; Shimanoe, K. Effect of water vapor on Pd-loaded SnO2 nanoparticles gas sensor. ACS Appl. Mater. Interfaces 2015, 7, 5863–5869. [Google Scholar] [CrossRef] [PubMed]
  27. Tischner, A.; Maier, T.; Stepper, C.; Köck, A. Ultrathin SnO2 gas sensors fabricated by spray pyrolysis for the detection of humidity and carbon monoxide. Sens. Actuators B Chem. 2008, 134, 796–802. [Google Scholar] [CrossRef]
  28. Qian, J.; Peng, Z.; Shen, Z.; Zhao, Z.; Zhang, G.; Fu, X. Positive impedance humidity sensors via single-component materials. Sci. Rep. 2016, 6, 25574. [Google Scholar] [CrossRef] [Green Version]
  29. Rigoni, F.; Freddi, S.; Pagliara, S.; Drera, G.; Sangaletti, L.; Suisse, J.-M.; Bouvet, M.; Malovichko, A.M.; Emelianov, A.V.; Bobrinetskiy, I.I. Humidity-enhanced sub-ppm sensitivity to ammonia of covalently functionalized single-wall carbon nanotube bundle layers. Nanotechnology 2017, 28, 255502. [Google Scholar] [CrossRef]
  30. Sysoev, V.V.; Strelcov, E.; Kolmakov, A. Multisensor micro-arrays based on metal oxide nanowires for electronic nose applications. In Metal Oxide Nanomaterials for Chemical Sensors; Integrated Analytical Systems; Carpenter, M., Mathur, S., Kolmakov, A., Eds.; Springer: New York, NY, USA, 2013; pp. 465–502. [Google Scholar] [CrossRef]
  31. Potyrailo, R.A. Multivariable sensors for ubiquitous monitoring of gases in the era of internet of things and industrial internet. Chem. Rev. 2016, 116, 11877–11923. [Google Scholar] [CrossRef]
  32. Jeong, S.-Y.; Kim, J.-S.; Lee, J.-H. Rational design of semiconductor-based chemiresistors and their libraries for next-generation artificial olfaction. Adv. Mater. 2020, 32, 2002075. [Google Scholar] [CrossRef]
  33. Gulbransen, E.A.; Andrew, K.F. Kinetics of the oxidation of pure tungsten from 500 to 1300 C. J. Electrochem. Soc. 1960, 107, 619. [Google Scholar] [CrossRef]
  34. Manciu, F.S.; Enriquez, J.L.; Durrer, W.G.; Yun, Y.; Ramana, C.V.; Gullapalli, S.K. Spectroscopic analysis of tungsten oxide thin films. J. Mater. Res. 2010, 25, 2401–2406. [Google Scholar] [CrossRef]
  35. Polikarpov, Y.A.; Romashkin, A.V.; Struchkov, N.S.; Levin, D.D. High uniform carbon nanotube thin films spray deposition on substrates with patterned structures having height difference. In Proceedings of the 2019 IEEE Conference of Russian Young Researchers in Electrical and Electronic Engineering, St. Petersburg, Russia, 28–31 January 2019; pp. 1980–1985. [Google Scholar] [CrossRef]
  36. Romashkin, A.V.; Polikarpov, Y.A.; Silakov, G.O.; Alexandrov, E.V. Spray deposited thin uniform NiO/Spiro-OMeTAD composite hole transport layer with top carbon nanotube electrode. J. Phys. Conf. Ser. 2021, 2086, 012097. [Google Scholar] [CrossRef]
  37. Frick, C.; Steiner, H.; Mazurkiewicz, A.; Riediger, U.; Rauthe, M.; Reich, T.; Gratzki, A. Central European high-resolution gridded daily data sets (HYRAS): Mean temperature and relative humidity. Meteorol. Z. 2014, 23, 15–32. [Google Scholar] [CrossRef]
  38. Rabchinskii, M.K.; Varezhnikov, A.S.; Sysoev, V.V.; Solomatin, M.A.; Ryzhkov, S.A.; Baidakova, M.V.; Stolyarova, D.Y.; Shnitov, V.V.; Pavlov, S.S.; Kirilenko, D.A.; et al. Hole-matrixed carbonylated graphene: Synthesis, properties, and highly-selective ammonia gas sensing. Carbon 2021, 172, 236–247. [Google Scholar] [CrossRef]
  39. Rigoni, F.; Tognolini, S.; Borghetti, P.; Drera, G.; Pagliara, S.; Goldoni, A.; Sangaletti, L. Enhancing the sensitivity of chemiresistor gas sensors based on pristine carbon nanotubes to detect low-ppb ammonia concentrations in the environment. Analyst 2013, 138, 7392–7399. [Google Scholar] [CrossRef]
  40. Kolhe, P.S.; Mutadak, P.; Maiti, N.; Sonawane, K.M. Synthesis of WO3 nanoflakes by hydrothermal route and its gas sensing application. Sens. Actuators A Phys. 2020, 304, 111877. [Google Scholar] [CrossRef]
  41. Diaz-Reyes, J.; Delgado-Macuil, R.J.; Dorantes-García, V.; Perez-Benitez, A.; Balderas-Lopez, J.A.; Ariza-Ortega, J.A. Physical properties characterization of WO3 films grown by hot-filament metal oxide deposition. Mater. Sci. Eng. B 2010, 174, 182–186. [Google Scholar] [CrossRef]
  42. Lee, C.; Robertson, C.S.; Nguyen, A.H.; Kahraman, M.; Wachsmann-Hogiu, S. Thickness of a metallic film, in addition to its roughness, plays a significant role in SERS activity. Sci. Rep. 2015, 5, 1–10. [Google Scholar] [CrossRef] [Green Version]
  43. Avrekh, M.; Monteiro, O.R.; Brown, I.G. Electrical resistivity of vacuum-arc-deposited platinum thin films. Appl. Surf. Sci. 2000, 158, 217–222. [Google Scholar] [CrossRef]
  44. Wang, Z.; Su, J.; Qi, H.; Pan, P.; Jiang, M. Porous nanocrystalline WO3 thin films: Fabrication, electrical and optical properties. Surf. Innov. 2021, 9, 214–221. [Google Scholar] [CrossRef]
  45. Sastry, D.N.; Revanasiddappa, M.; Basavaraja, C.; Suresh, T.; Raghavendra, S.C. DC conductivity studies of doped polyaniline tungsten oxide nanocomposites. Indian J. Eng. Mater. Sci. 2013, 20, 435–442. [Google Scholar]
  46. Abdellah, A.; Abdelhalim, A.; Horn, M.; Scarpa, G.; Lugli, P. Scalable spray deposition process for high-performance carbon nanotube gas sensors. IEEE Trans. Nanotechnol. 2013, 12, 174–181. [Google Scholar] [CrossRef]
  47. Penza, M.; Rossi, R.; Alvisi, M.; Cassano, G.; Signore, M.A.; Serra, E.; Giorgi, R. Pt- and Pd-nanoclusters functionalized carbon nanotubes networked films for sub-ppm gas sensors. Sens. Actuators B Chem. 2008, 135, 289–297. [Google Scholar] [CrossRef]
  48. Vu, T.D.; Cong, T.N.; Huu, B.L.; Duc, C.N.; Huu, L.N. Surface-modified carbon nanotubes for enhanced ammonia gas sensitivity at room temperature. J. Nanosci. Nanotechnol. 2019, 19, 7447–7451. [Google Scholar] [CrossRef]
  49. Abdelhalim, A.; Winkler, M.; Loghin, F.; Zeiser, C.; Lugli, P.; Abdellah, A. Highly sensitive and selective carbon nanotube-based gas sensor arrays functionalized with different metallic nanoparticles. Sens. Actuators B Chem. 2015, 220, 1288–1296. [Google Scholar] [CrossRef]
  50. Xiong, Y.; Zhu, Z.; Guo, T.; Li, H.; Xue, Q. Synthesis of nanowire bundle-like WO3-W18O49 heterostructures for highly sensitive NH3 sensor application. J. Hazard. Mater. 2018, 353, 290–299. [Google Scholar] [CrossRef]
  51. Ani, A.; Poornesh, P.; Antony, A.; Shchetinin, I.V.; Nagaraja, K.K.; Chattopadhyay, S.; Vinayakumar, K.B. Impact of Ag on the limit of detection towards NH3-sensing in spray-coated WO3 thin-films. Sensors 2022, 22, 2033. [Google Scholar] [CrossRef]
  52. Sysoev, V.V.; Kiselev, I.; Trouillet, V.; Bruns, M. Enhancing the gas selectivity of single-crystal SnO2:Pt thin film chemiresistor microarray by SiO2 membrane coating. Sens. Actuators B Chem. 2013, 185, 59–69. [Google Scholar] [CrossRef]
  53. Sysoev, V.V.; Kiselev, I.; Frietsch, M.; Goschnick, J. Temperature gradient effect on gas discrimination power of a metal-oxide thin-film sensor microarray. Sensors 2004, 4, 37–46. [Google Scholar] [CrossRef]
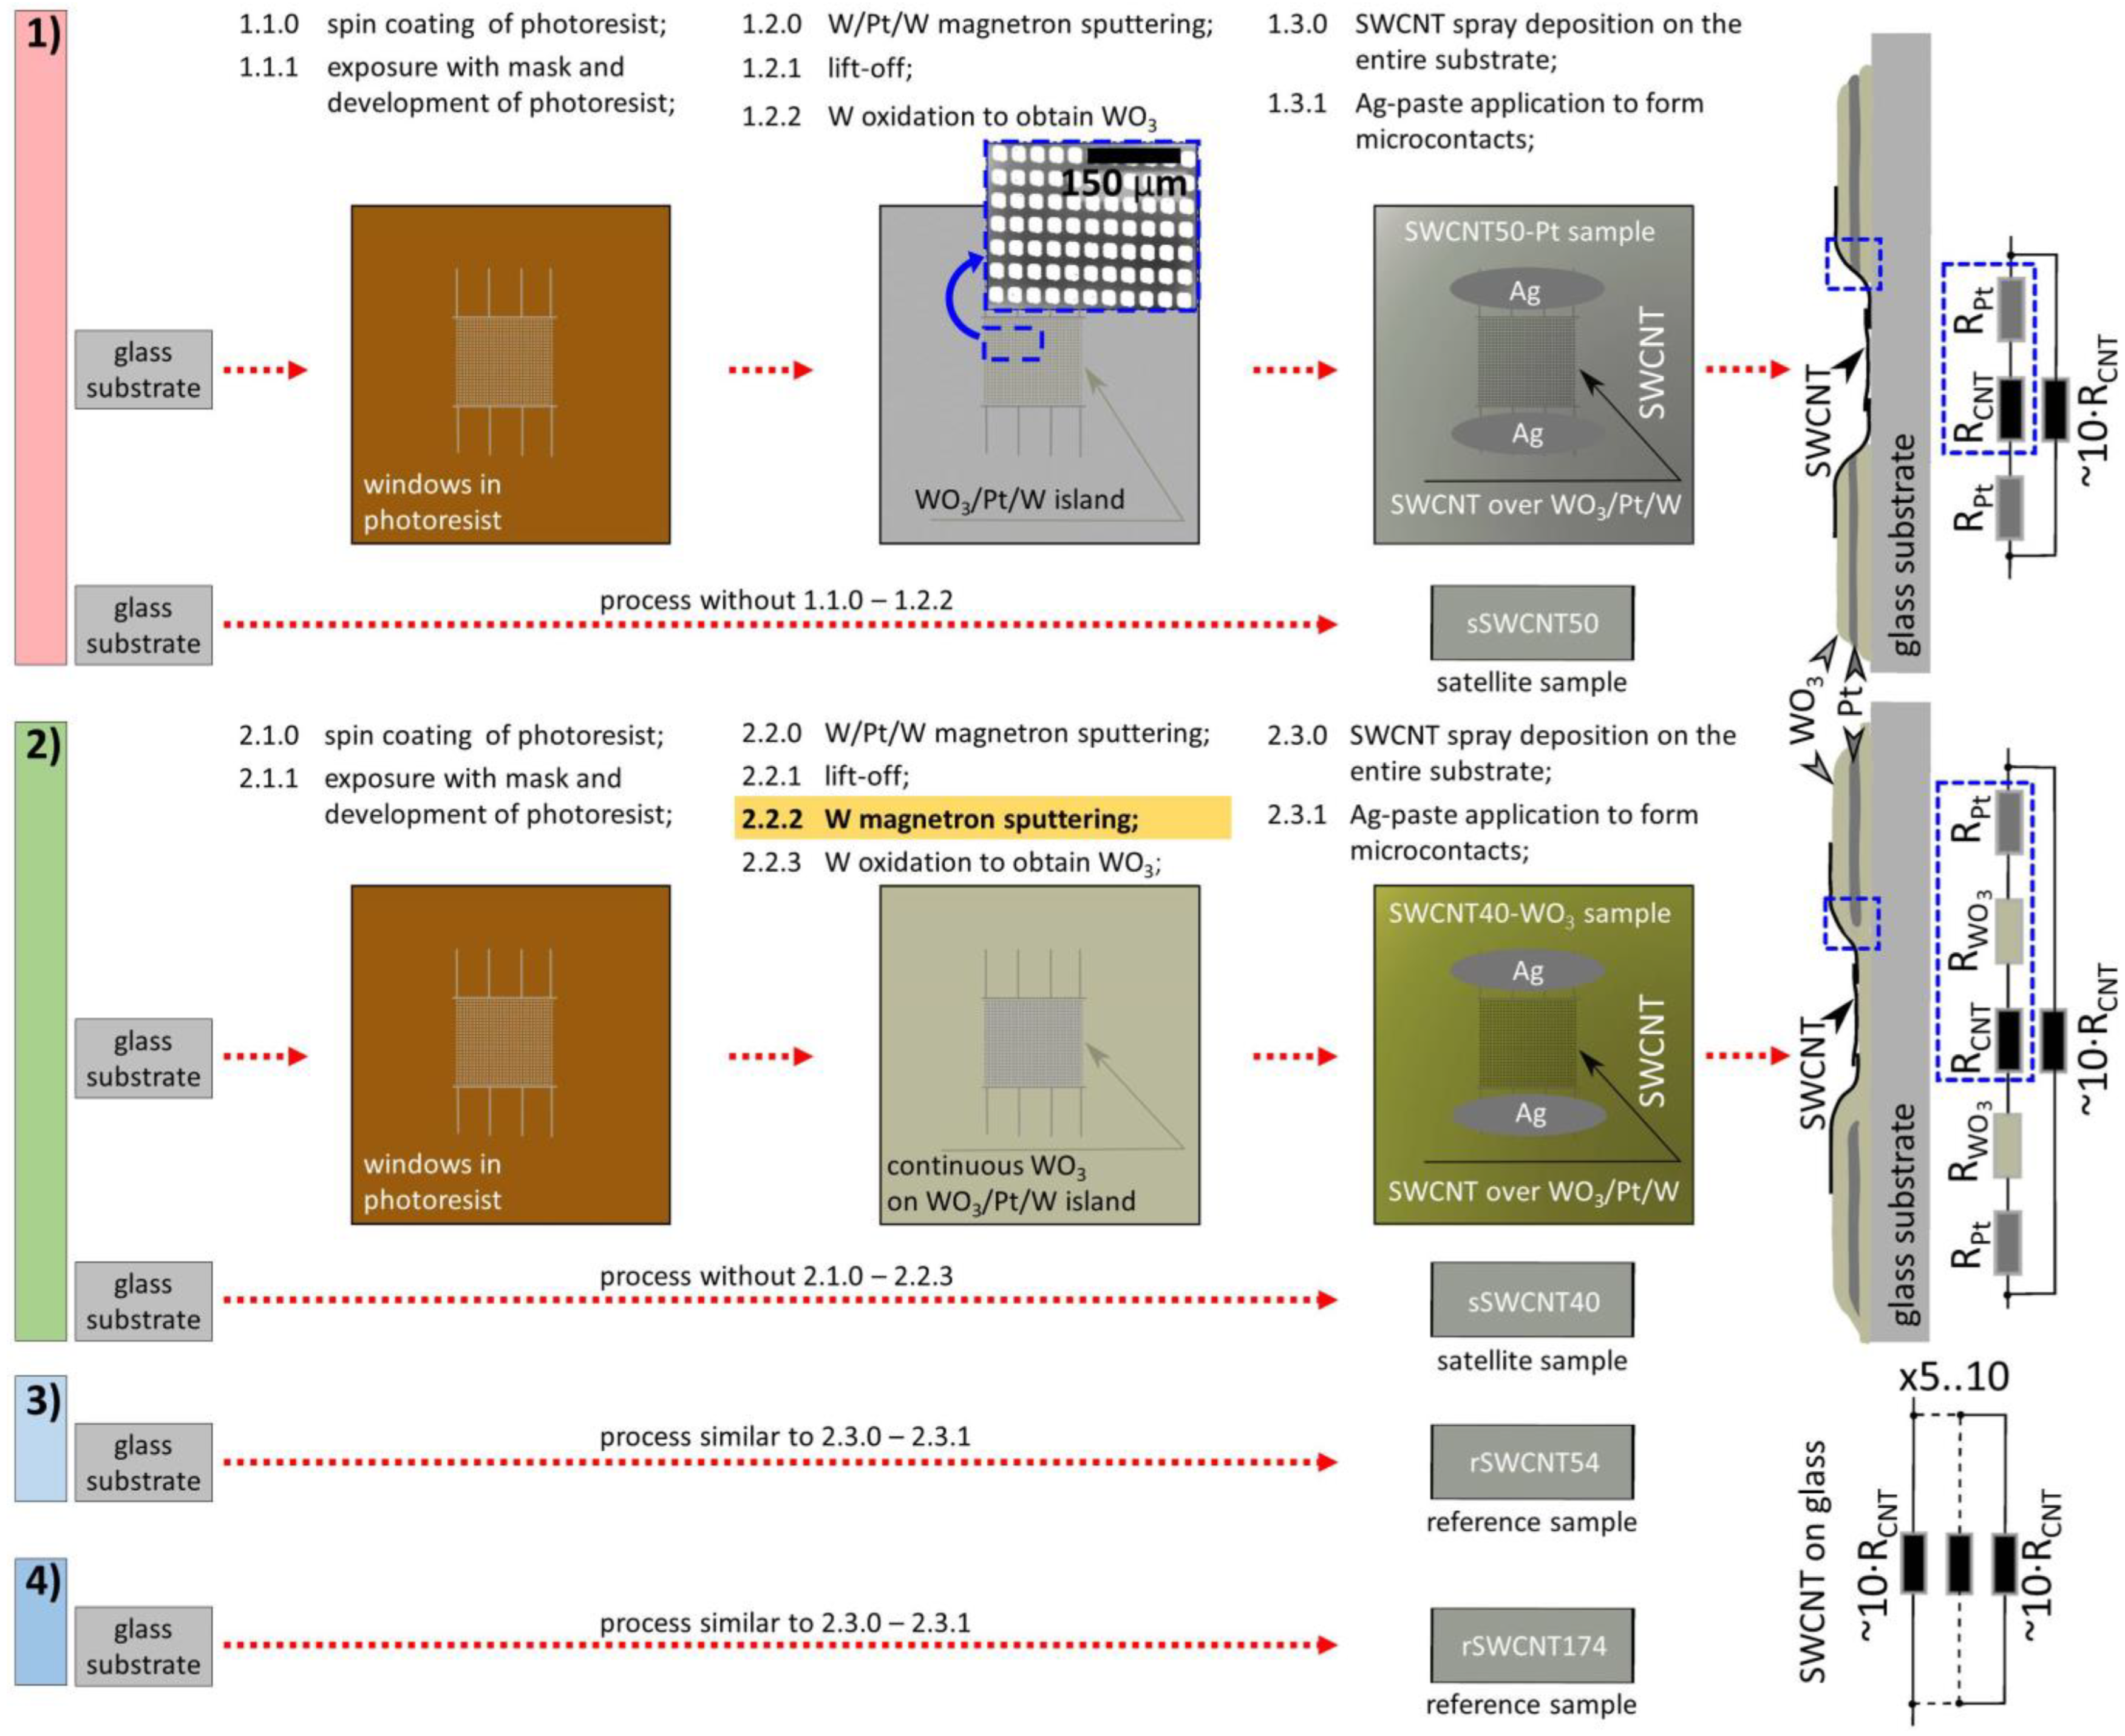
Figure 1. The scheme and technology routs to produce the gas-sensing structures under the study via employing SWCNT layer deposited over WO3/Pt/W sublayer formed with lift-off photolithography and over the pure glass substrates. In the right, the cross-section and equivalent circuit schemes of the structures are given.
Chemosensors 10 00476 g001
Figure 2. The gas-supply setup to feed the multisensor array under study for exposing to H2O an NH3 vapors of various concentrations. The sealed chamber containing the sensors is equipped with built-in heater. Data collection is carried out by a resistance measurement unit equipped with multiple relays to be managed by a personal computer (PC).
Chemosensors 10 00476 g002
Figure 3. The exploring of sensor structures under study with atomic force microscopy: (a) AFM image of SWCNT-Pt structure (SWCNT50-Pt); (b) AFM image of SWCNT-WO3 structure (SWCNT40-WO3); (c) cross-sections of edge of initial metal W/Pt/W area and of “1”, “2” lines marked at 1a,b corresponding to profiles of SWCNT50-Pt and SWCNT40-WO3 structures.
Chemosensors 10 00476 g003
Figure 4. The characterization of the sensor structures under study with Raman spectroscopy: (a) optical image of WO3/Pt/W areas on glass substrate of SWCNT50-Pt and SWCNT40-WO3 structures; (b) Raman spectra related to thin WO3 layer, of 7–15 nm, on glass area (1), thin WO3 on Pt/W, SWCNT50-Pt (2), WO3 continuous film, ca. ~25 nm, on glass, SWCNT40-WO3 (3), WO3 continuous film on Pt/W, SWCNT40-WO3 (4); (c,d) G-peak Raman maps for SWCNT50-Pt (c) and SWCNT40-WO3 (d) structures. The scale bar is 5 μm.
Chemosensors 10 00476 g004
Figure 5. Temperature coefficient of resistance (TCR) for all the SWCNT-based sensor structures under study.
Chemosensors 10 00476 g005
Figure 6. Sensor responses of SWCNT-based structures under study to NH3: (a) dry air background, RT; (b) dry air background, 100 °C; (c) wet air, RH = 45%, 100 °C; (d) NH3 at wet air background, RH = 45%, RT; (e) LDA processing of the vector signal from the multisensor array composed of the four sensor structures: SWCNT50-Pt, SWCNT40-WO3, their satellite samples of sSWCNT50, and sSWCNT40; the 2D cross-section related to two primary components of 5D LDA space is shown, points represent the vector signals.
Chemosensors 10 00476 g006
Table 1. The sensing characteristics of the sensor structures under study.
StructureNoise, 5·σ, kΩ 1R0, kΩ 2Power Law of S(C)LOD Estimation, Ppb
SWCNT40-WO36.56382405.2·C0.484.8
sSWCNT403.35211605.1·C0.587.1
SWCNT50-Pt0.1381815.1·C0.560.6
sSWCNT500.75218403.5·C0.640.9
rSWCNT540.7639572.0·C0.615.1
rSWCNT1740.115872.6·C0.492.4
1 σ is standard deviation of resistance, sampling of 50 points, in air prior exposing to NH3, 40 ppm concentration. 2 R0 is the resistance of samples in air before NH3 exposure.
Publisher’s Note: MDPI stays neutral with regard to jurisdictional claims in published maps and institutional affiliations.