Abstract
Some short-chain fatty acids with a pungent or unpleasant odor are important components of human body odor. These malodors severely threaten human health. The antagonists of malodors would help to improve odor perception by affecting the interaction between odors and their receptors. However, the traditional odor detection and analysis methods, such as MOS, electrochemical, conductive polymer gas sensors, or chromatography-mass spectrometry are not suitable for screening the antagonists since they are unable to detect the ligand efficacy after odor-receptor binding. In this study, RT-PCR results showed that HL-1 cardiomyocytes endogenously express the olfactory receptor 558 (Olfr558) which can be activated by several malodorous short-chain fatty acids. Therefore, an in vitro HL-1 cardiomyocyte-based olfactory biosensor (HCBO-biosensor) was developed by combining cardiomyocytes and microelectrode array (MEA) chips for screening the potential antagonists of the Olfr558. Firstly, it showed that the biosensor specifically responded to ligands of Olfr558 through odor stimulation experiments. Then, an odor response model of HL-1 cardiomyocytes was constructed by a ligand of Olfr558 (isovaleric acid). The response feature of the in vitro HCBO-biosensor to individual odors and mixtures with a potential antagonist (citral or β-damascenone) were extracted and compared. Finally, the Olfr558-inhibited efficiency was indirectly detected by comparing the half-maximal inhibitory concentration of isovaleric acid. The results showed that β-damascenone greatly inhibited Olfr558 while citral showed no significant inhibitory effect. In conclusion, we built a novel screening method for the antagonists of Olfr558 based on HL-1 cardiomyocytes and the MEA chip which will assist odor-related companies to develop novel antagonists of Olfr558.
1. Introduction
Human body odor has complex compositions. Malodorous substances are formed by the microbiota metabolizing sweat gland secretions [1]. Some of the short-chain fatty acids (SFAs) are important components of unpleasant body odor, such as butyric acid (BTA, with a rancid, butter-like odor) and isovaleric acid (IVA, with a rancid, cheese-like odor) [2]. Long-term exposure to malodors is hazardous to human health. Unpleasant odors have been reported to cause headaches or weariness, reduce immunoglobulin A levels, increase blood pressure, or induce anxiety [3,4,5]. Deodorants have been developed to eliminate the presence of malodors in the environment [6]. They achieve their functions by inhibiting the activities of bacteria, suppressing perspiration, or masking malodors [7,8]. Among them, the development of deodorants through odor masking-based methods mainly relies on biological olfactory. Conventional gas sensors focus on measuring the chemical properties of the sample gas rather than the odor properties [9]. Several novel methods based on machine learning or pattern recognition have been developed for detecting mixture odors [10,11,12]. They displayed a high accuracy of odor-detection, but they lacked biological sensory evaluations and were incapable of detecting the inhibition of olfactory receptors by deodorants. The perceptual interaction between odor is mainly evaluated by trained panels independently or assisted by gas chromatography-mass spectrometry instruments [13,14]. However, it would take a long time to train odor experts.
For decades, biosensors based on the principle of biological olfactory have been proposed for use in odor detection. In the mammal olfactory system, each olfactory sensory neuron expressing one specific olfactory receptor is located in the olfactory mucosa [15,16]. Different odorants are encoded by combinations of olfactory receptors [17]. After ligand odorants bind with receptors, it induces a biological response, including agonism and antagonism. The capacity of a molecule to induce a specific physiological response is called ligand efficacy [18,19]. Odors can activate or antagonize some odorant receptors. Antagonism or inhibition are considered to be important encoding strategies to encode the perception of mixtures [20], which has the potential to guide the development of novel and effective deodorants. Through mimicking the biological sense of smell, olfactory receptor proteins were extracted as bio-sensitive elements and combined with a secondary conductor for sensitivity and the specific detection of ligand odorants and their antagonists [21,22]. Nevertheless, the process of preparing olfactory receptor proteins is complicated [23]. Several studies have suggested detecting the olfactory epithelium or olfactory bulb signal for the evaluation of odor interactions, although they cannot reveal the efficacy of odor on specific receptors [24,25].
Previous studies have found the ectopic expression of odor receptors in non-olfactory tissues [26,27]. Cardiomyocytes, which can spontaneously generate extracellular field potentials (EFPs) and pulsate [28], express several taste receptors and odor receptors [29,30]. Due to their electrical and mechanical properties, they have been proposed for use as a gustatory sensitive element in combination combined with a microelectrode array (MEA) chip for the detection of gustatory substances [31]. HL-1 cardiomyocytes, derived from a mouse atrial tumor cell line, are immortalized cardiomyocyte cell lines [28]. They not only have electrical and mechanical properties similar to those of primary cardiomyocytes, but they can also be passaged in culture which allows easy detection of the EFPs of cardiomyocytes by the transducer, as well as simplifying the preparation process. It has been shown that mouse cardiomyocytes express the odor receptor 558 (Olfr558) and 544 (Olfr544) [32,33], where Olfr558 is a homolog of the human olfactory receptor 51E1 (OR51E1) [33]. Previous studies have suggested that the ligands of Olfr558 are some short-and medium-chain fatty acids such as IVA, BTA, and nonanoic acids (NAA, with a fatty odor and coconut aroma) [33,34]. They induce negative inotropic and negative chronotropic effects in cardiac myocytes upon binding to the odor receptors in cardiomyocytes [33].
Here, we present a novel method for the Olfr558 inhibition efficiency assay. First, the expression of the odorant receptor in HL-1 cardiomyocytes was verified by RT-PCA. Next, HL-1 cardiomyocytes were cultured on MEA microarrays as bio-sensitive elements for detecting the efficacy of odors to Olfr558, which constituted an in vitro HL-1 cardiomyocyte-based olfactory biosensor (HCBO-biosensor). The concentration gradient response and the specificity of the sensor for Olfr558 ligands were verified by acetic acid (ACA), propionic acid (PPA), BTA, and NAA. Finally, an odor response model was constructed using IVA. The inhibition efficiency of citral and β-damascenone against Olfr558 was assayed indirectly according to the change of a half-maximal inhibitory concentration (IC50) of IVA in the presence of those potential inhibitors. The in vitro olfactory biosensor based on HL-1 cardiomyocyte has potential application for screening potential antagonists of Olfr558.
2. Materials and Methods
2.1. Reagents and Materials
Claycomb basal medium, Gelatin, Paraformaldehyde, Dulbecco’s Modified Eagle Medium (DMEM), Fetal bovine serum (FBS), Bovine Serum Albumin (BSA), norepinephrine, L-glutamine, penicillin/streptomycin, fibronectin bovine plasma, monoclonal anti-α-actinin, and HL-1 cardiomyocytes were obtained from Sigma-Aldrich (St Louis, MO, USA). Odorant solutions were diluted into different concentrations with the culture medium 5 min before use. Neonatal ICR mice aged 1~3 days were purchased from Zhejiang Academy of Medical Sciences.
2.2. MEA Chips Fabrication and Electrophysiological Recording System
The fabrication procedure referred to our previous works [24,31]. In brief, the MEA chip was fabricated by MEMS technology and consisted of a three-layer structure of insulating/metal/insulating layers. A 4-inch quartz glass wafer (Pyrex Corning 7740 glass, SGP Inc., Cudahy, CA, USA) was used as the first insulating layer. The second photoresist pattern was developed on the glass substrate by spin-coating a positive photoresist and UV-lighting under a metal layer mask. Further magnetron sputtering deposited 20 nm of Cr and 300 nm of Au. The metal layer pattern was realized by the lift-off technique. Plasma-enhanced chemical vapor deposition was used to achieve the insulating layer clusters of Si3N4 (~1 μm) as the third layer. Finally, the metal-exposing of the MEA electrode sites and the electrode interface pads was achieved by reactive ion etching (RIE). The fabricated chip was cut out and bonded to the adapter printed circuit board (PCB). The electrical connection of the chip to the PCB was achieved by gold wires. Custom acrylic plate-cell cavities were fixed to the surface of the MEA chip (Figure 1a). The electrical distribution of the electrodes on the chip surface under the microscope was shown in Figure 2e. The data from the MEA chip were collected and recorded by MEA2100-Systems (Harvard Bioscience, Inc., Holliston, MA, USA). In all experiments, the sampling frequency of the device was 10,000 Hz. The raw signal was processed in real-time by a Butterworth low-pass filter at 100 Hz.

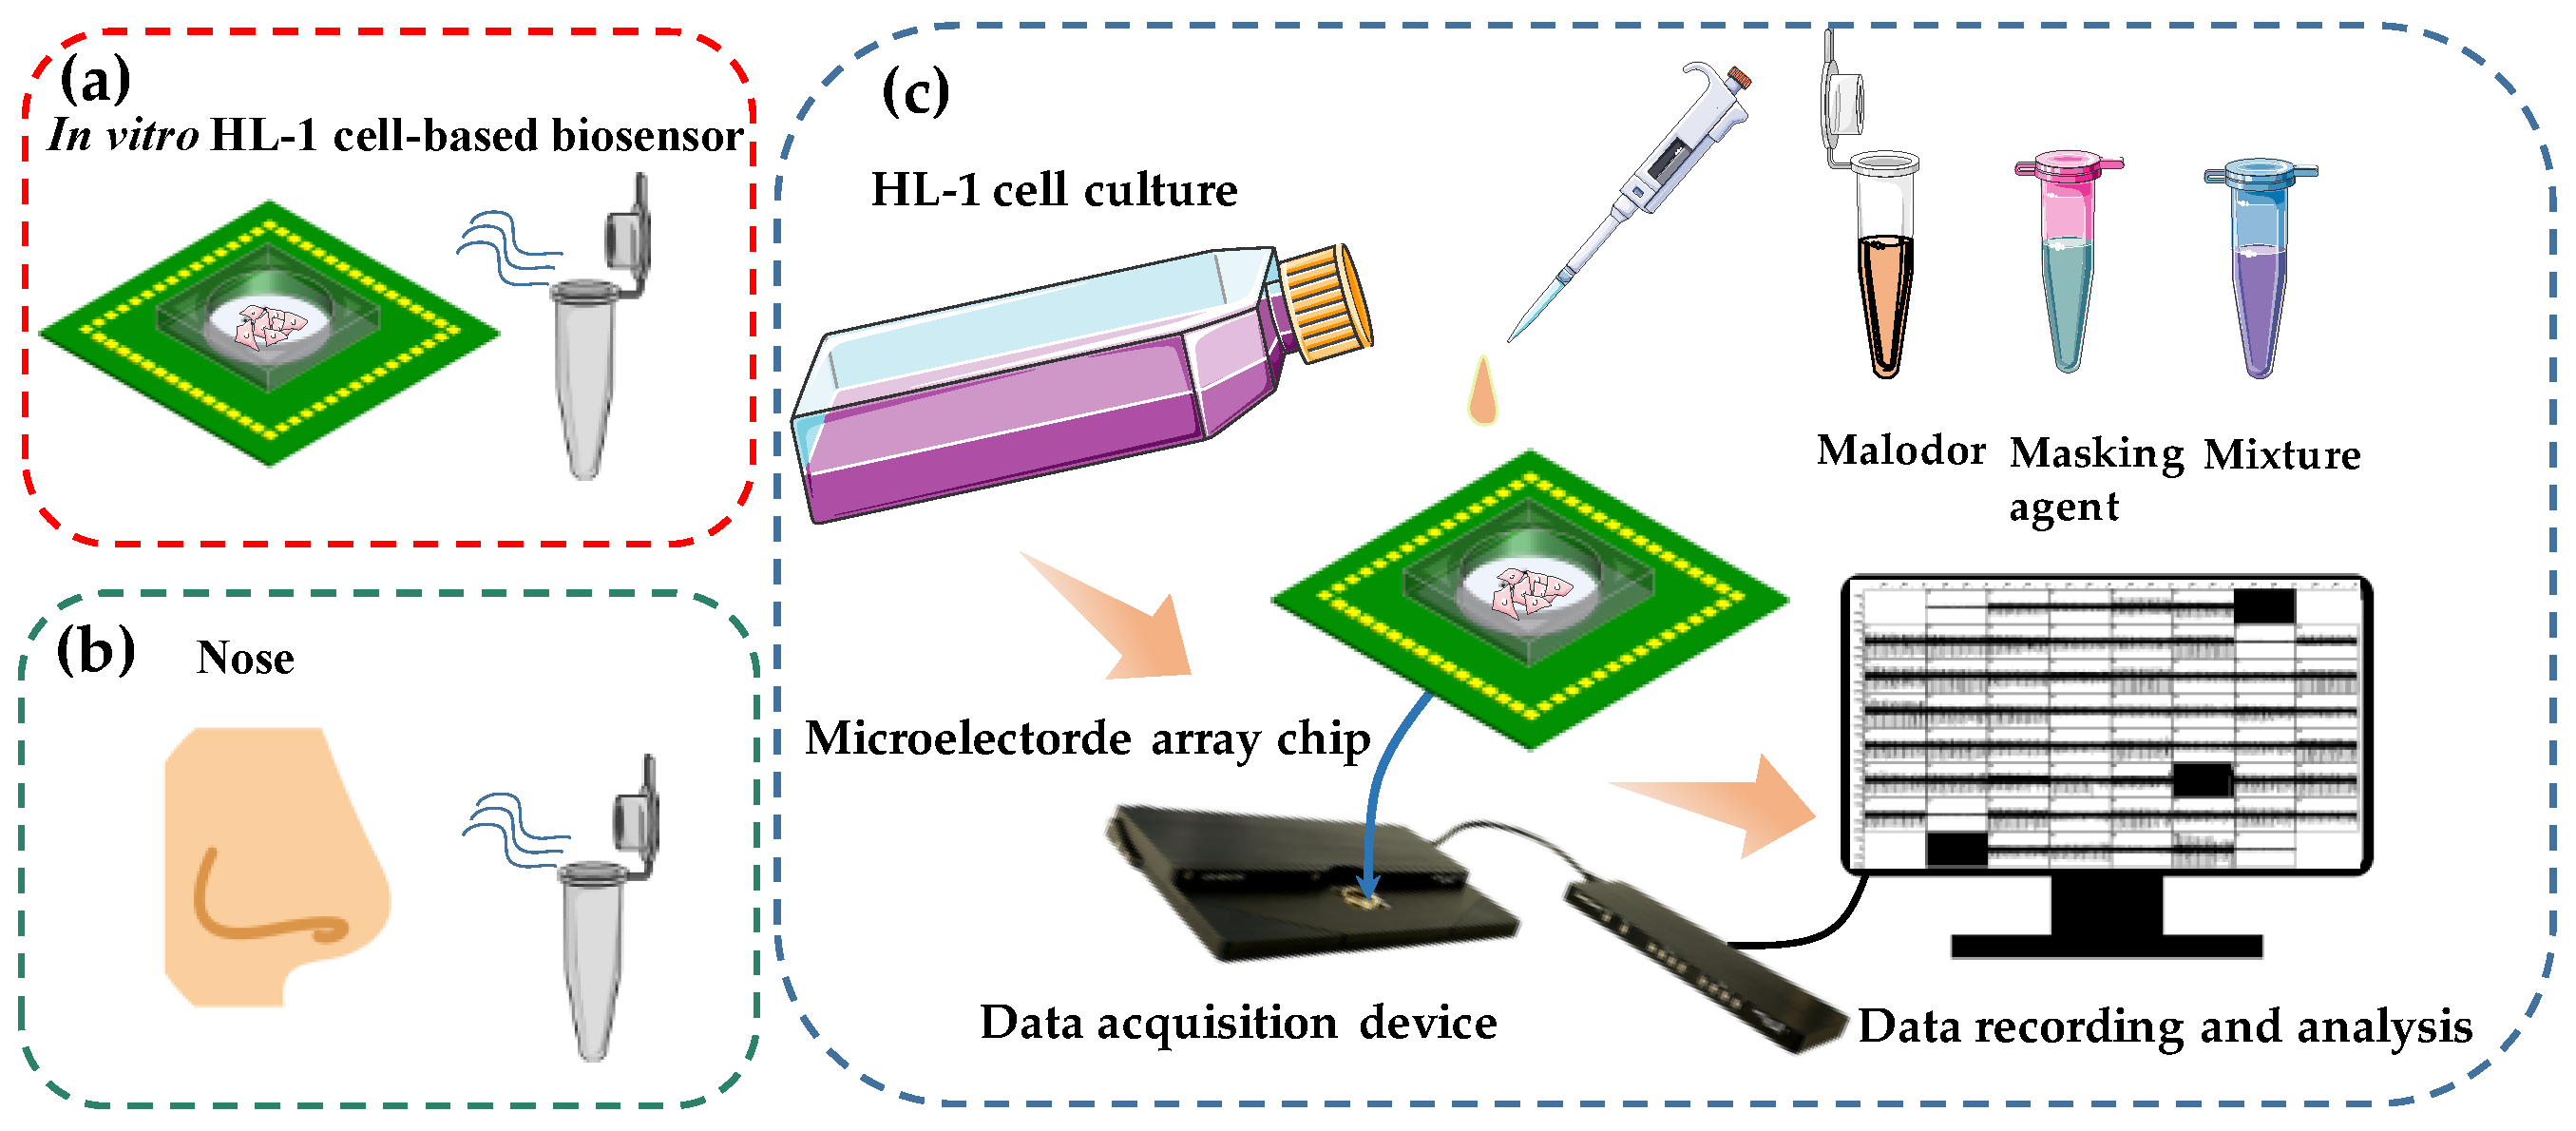
Figure 1.
Schematic diagram of in vitro HCBO-biosensor. (a) Schematic diagram of the HCBO-biosensor for odor detection, (b) Schematic diagram of human sniffing odor. (c) Construction of the HCBO-biosensor. HL-1 cardiomyocytes were cultured in an MEA chip. Odor detection was performed by adding odor reagent dropwise to the cell sensor and recording the potential signal of HL-1 cardiomyocytes through a signal acquisition system. The efficiency of Olfr558-inhibited was indirectly examined by comparing the change in IC50 of a standard ligand in the presence and absence of potential inhibitors.
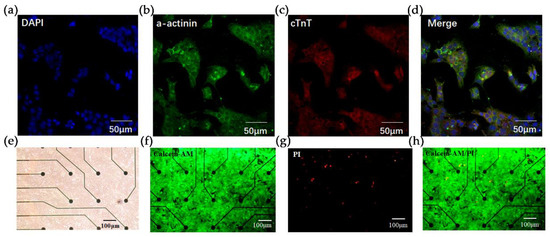
Figure 2.
Fluorescence characterization of HL-1 cardiomyocytes and live/dead staining. Immunostaining with (a) DAPI (blue), (b) anti-a-actinin (green), (c) anti-Cardiac muscle troponin T (cTnT) staining (red). Scale bar = 50 um. (d) Merge view of (a–c). (e) Bright-field view of HL-1 cardiomyocytes cultured in MEA microarrays. Scale bar = 100 um. (f–h) Live/dead staining of HL-1 cells in the microarray. Live cells were stained with Calcein-AM (green) and dead cells are stained with PI (red). Scale bar = 100 um.
2.3. Culture of HL-1 Cells and Primary Cardiomyocytes
Surgical instruments were autoclaved, dried, and UV-sterilized one day prior to the cardiomyocyte extraction. Prior to the start of cell inoculation, fibronectin was dissolved into 0.02% gelatin to a final concentration of 5 μg/mL, and each MEA chip was encapsulated with 500 μL fibronectin overnight in a 4 °C refrigerator. A 50 mL volume of HL-1 culture medium was prepared with the following materials: 43.5 mL Claycomb basal medium, 5 mL FBS, 0.5 mL norepinephrine (10 mM), 0.5 mL L-glutamine (200 mM), and 0.5 mL penicillin/streptomycin. The prepared medium was stored away from light. HL-1 cells maintained at high cell density were thawed from liquid nitrogen and then cultured in T25 flasks (Thermo Fisher Scientific, Waltham, MA, USA) in a humidified incubator at 37% with 5% CO2. The culture medium in the T25 flasks was changed every 24 h. For passaging, HL-1 cardiomyocytes were detached using Trypsin-EDTA 0.05% (Sigma-Aldrich, St Louis, MO, USA) at a 1:3 split ratio when reaching 100% confluence. Then, HL-1 cells were inoculated into the wells of the sensor chip. The medium was changed every 24 h and odor stimulation experiments were performed on the second day.
The experimental procedure for primary cardiomyocytes extraction and isolation was referred to in our previous work [31]. Ventricular tissues were isolated from neonatal ICR mice and further transferred into 20 mL glass sample bottles containing 2 mL of Hanks solution. Tissues were cut into pieces and then enzymatically digested by trypsin/collagenase type II mixture 12 times. The cell suspension was centrifuged at 800 rpm for 5 min. The supernatant was removed and the cells were carefully resuspended in 2 mL of DMEM containing 10% FBS. Cardiomyocytes were purified by two steps of differential plating for 45 min each. Primary cardiomyocytes were maintained in a cell incubator at 37 °C with 5% CO2. The culture medium was changed every 24 h. All protocols were in accordance with the Institutional Animal Care and Use Committee (IACUC) of Zhejiang University.
2.4. Immunocytochemical Staining
Cultured HL-1 cardiomyocytes were washed with phosphate buffer solution (PBS) and then fixed with 4% paraformaldehyde for 30 min at room temperature. After three times-washing with PBS, the HL-1 cells were permeabilized with 0.3% Triton X-100 for 10 min and then incubated with 3% BSA for 30 min at 37 °C. Following this, the HL-1 cells were incubated with mouse monoclonal anti-α-actin and rabbit monoclonal anti-cTnT at 4 °C for 12 h. After 3 times-washing with PBS, the HL-1 cells were treated with secondary antibodies (goat anti-mouse Alexa Fluor® 488 and goat anti-rabbit Alexa Fluor® 647) for 2 h at room temperature. Cells were then washed three times with PBS, stained with DAPI, and mounted on glass slides for confocal microscopy.
2.5. Live/Dead Staining
Live/dead cell staining was conducted using calcein-AM (0.3 mg L−1, Thermo Fisher Scientific, Waltham, MA, USA) for live cells and propidium iodide (PI, 0.5 mg L−1) for dead cells. After drug treatment, the HL-1 cells on MEA chips were co-stained with Calcein-AM and PI. Images were taken with an inverted fluorescence microscope (NIB900, Nexcope, Ningbo, China).
2.6. Quantitative Reverse Transcription-PCR Analysis on the HL-1 Cells and Cardiomyocytes
The total RNAs were extracted from the HL-1 cells and mouse primary cardiomyocytes using the TaKaRa MiniBEST Universal RNA Extraction Kit (TaKaRa, 9767, TAKARA BIO Inc., Kusatsu City, Japan), respectively. RNAs were reverse-transcribed into cDNAs by using a PrimeScript™ 1st Strand cDNA Synthesis Kit (TaKaRa, 6110A). A real-time quantitative PCR (qPCR) was performed using the iQ™ SYBR Green Supermix kit (Bio-Rad, 170-8884, Bio-Rad Laboratories Inc., Hercules, CA, USA) in a CFX 96 Real-Time System (Bio-Rad Laboratories Inc.). Specific primers for the Olfr558 gene, Olfr78 gene, Olfr544 gene, and Adrβ2 were purchased from Sangon Biotech (Table 1). The expression levels of the target genes were normalized to the levels of an endogenous control (the β-actin housekeeping gene). The relative gene expression levels were calculated using the “2 − ΔΔCT” method [35] and three independent biological replicates were analyzed using Adrβ2 as a reference.

Table 1.
Primer gene fragments.
2.7. Odor Preparation and Stimulation
In this study, all odor reagents were purchased from Sigma Aldrich (Shanghai, China) Trading Co. Concentrations of 2 × 10⁻² M, 2 × 10⁻³ M, 2 × 10⁻⁴ M, 2 × 10⁻⁵ M, 2 × 10⁻⁶ M, and 2 × 10⁻⁷ M ACA, PPA, BTA, and NAA were used to examine the specificity and sensitivity of the odor response of the in vitro HCBO-biosensor. The odor was diluted into 2 M by DMSO. After a series of dilution operations with PBS, six concentration gradients of the diluted solutions to be tested were obtained. In practice, 10 uL of the liquid to be tested was added to the biosensor containing 1 mL of the medium by pipetting, and the actual test solubility was 10−2 times the nominal concentration. The stimulation interval between trials was approximately 120 s. In the Olfr558-inhibited efficiency detection experiments, IVA was used to construct an odor response model. The two potential masking agents used to compare the Olfr558-inhibited efficiency were CIT and DMO. Firstly, the dose–response curve of IVA was examined by the HCBO-biosensor. Six concentrations of IVA ranging from 10−4 M to 10−9 M were added to the MEA chip, each at an interval of about 120 s. Then, after one set of experiments, a new medium was used to replace the old medium that was mixed with the odor solution. Finally, six concentrations of IVA were added sequentially after first adding 10−7 M to the potential masking agent solution.
2.8. Data Process and Analysis
Low-pass filtering of HL-1 cell-raw EFPs was conducted in MATLAB (R2019b, Mathworks, Middlesex County, NJ, USA) and Excel (version 2016, Microsoft Co., Ltd., Redmond, WA, USA). Similar to the processing of neuronal extracellular potentials, the waveforms of the EFPs of the myocardium were obtained by setting thresholds to identify their peaks and valleys. The relative changes in amplitude and the average firing rate of the cardiomyocyte EFPs were obtained regarding the values from control groups by Equations (1) and (2), respectively,
where and denoted the amplitude of EFPs in the presence of the odor and the blank control, respectively. and denoted the frequency of cardiomyocyte EFPs in the presence of the odor, as well as the blank control, respectively. The frequency of potentiation was calculated by Equation (3), where Count was the number of HL-1 cardiomyocytes firing within 60 s after stimulation and the time duration of a bin was equal to 60 s.
2.9. Statistical Analysis and IC50 Calculation
All results and error bars are expressed as mean ± SEM. Prism 9.0 (GraphPad Software Inc., San Diego, CA, USA) was used for statistical analysis. One-way ANOVA tests were performed to check for significant differences between all groups. The statistical significance was accepted at p < 0.05. In all statistical plots, ns = no significance, * p < 0.05, ** p < 0.005, *** p < 0.0005, and **** p < 0.0001. For concentration gradient experiments, the IC50 values were calculated after non-linear fitting of the data by the four parameters method.
3. Results and Discussion
3.1. Construction of the In Vitro HCBO-Biosensor
Inspired by the biological olfactory system, we constructed a HCBO-biosensor. In the mammal olfactory system, the odor is encoded by binding combinatorial olfactory receptors which are located in the olfactory epithelium [17]. Previous studies have reported that OR51E1 is expressed in human cardiomyocytes. Olfr558 which is expressed in mouse cardiomyocytes is an orthologous receptor of OR51E1. It was activated by some short- and medium-chain fatty acids such as BTA, IVA, and NAA [33,34]. Partial ligands of Olfr558 are key malodorous components of human sweat and foot odor [1,2]. Meanwhile, HL-1 cardiomyocytes are capable of generating EFPs and being passaged. To detect the efficacy of odorants to olfactory receptors we cultured HL-1 cardiomyocytes on MEA chips to establish an HL-1 cardiomyocyte-based olfactory biosensor by mimicking the odor detection process in the olfactory epithelium (Figure 1a,b). The MEA chip mimics the human nose, while the cell culture chamber with HL-1 cells in the middle mimics the human olfactory epithelium. Potential signals from the HL-1 cardiomyocytes were recorded by a commercial data acquisition device and then processed offline (Figure 1c). The Olfr558-inhibited efficiency of potential inhibition agents would be indirectly detected by comparing the change in the IC50 values of the standard ligand, both in the presence and absence of potential antagonists.
3.1.1. Characterization and Identification of HL-1 Cardiomyocytes
To verify the successful construction of the HCBO-biosensor we first characterized and identified the HL-1 cells using immunofluorescence staining. Cardiac Troponin T (cTnT) and α-actinin are important proteins in cardiomyocytes. HL-1 cardiomyocytes were immunostained with anti-cTnT and anti-α-actinin [36]. As shown in Figure 2a–d, cells labeled by DAPI clearly expressed α-actinin and cTnT which suggested that HL-1 cardiomyocytes were successfully cultured. Further, we explored the growth of HL-1 cells on the MEA chip. Post-two days of culture, the HL-1 cardiomyocytes spread over the surface of the chip (Figure 2e). Live/dead staining was used to verify the survival of cardiomyocytes. Under fluorescence microscopy, live cells fluoresce in green and dead cells fluoresce in red. In Figure 2f–h, the green fluorescence on the sensor surface was visibly larger than the area covered by red fluorescence, indicating that the MEA chip had no significant toxic effect on cell growth.
3.1.2. RT-PCR Analysis of Odor Receptors on Mouse Cardiomyocytes
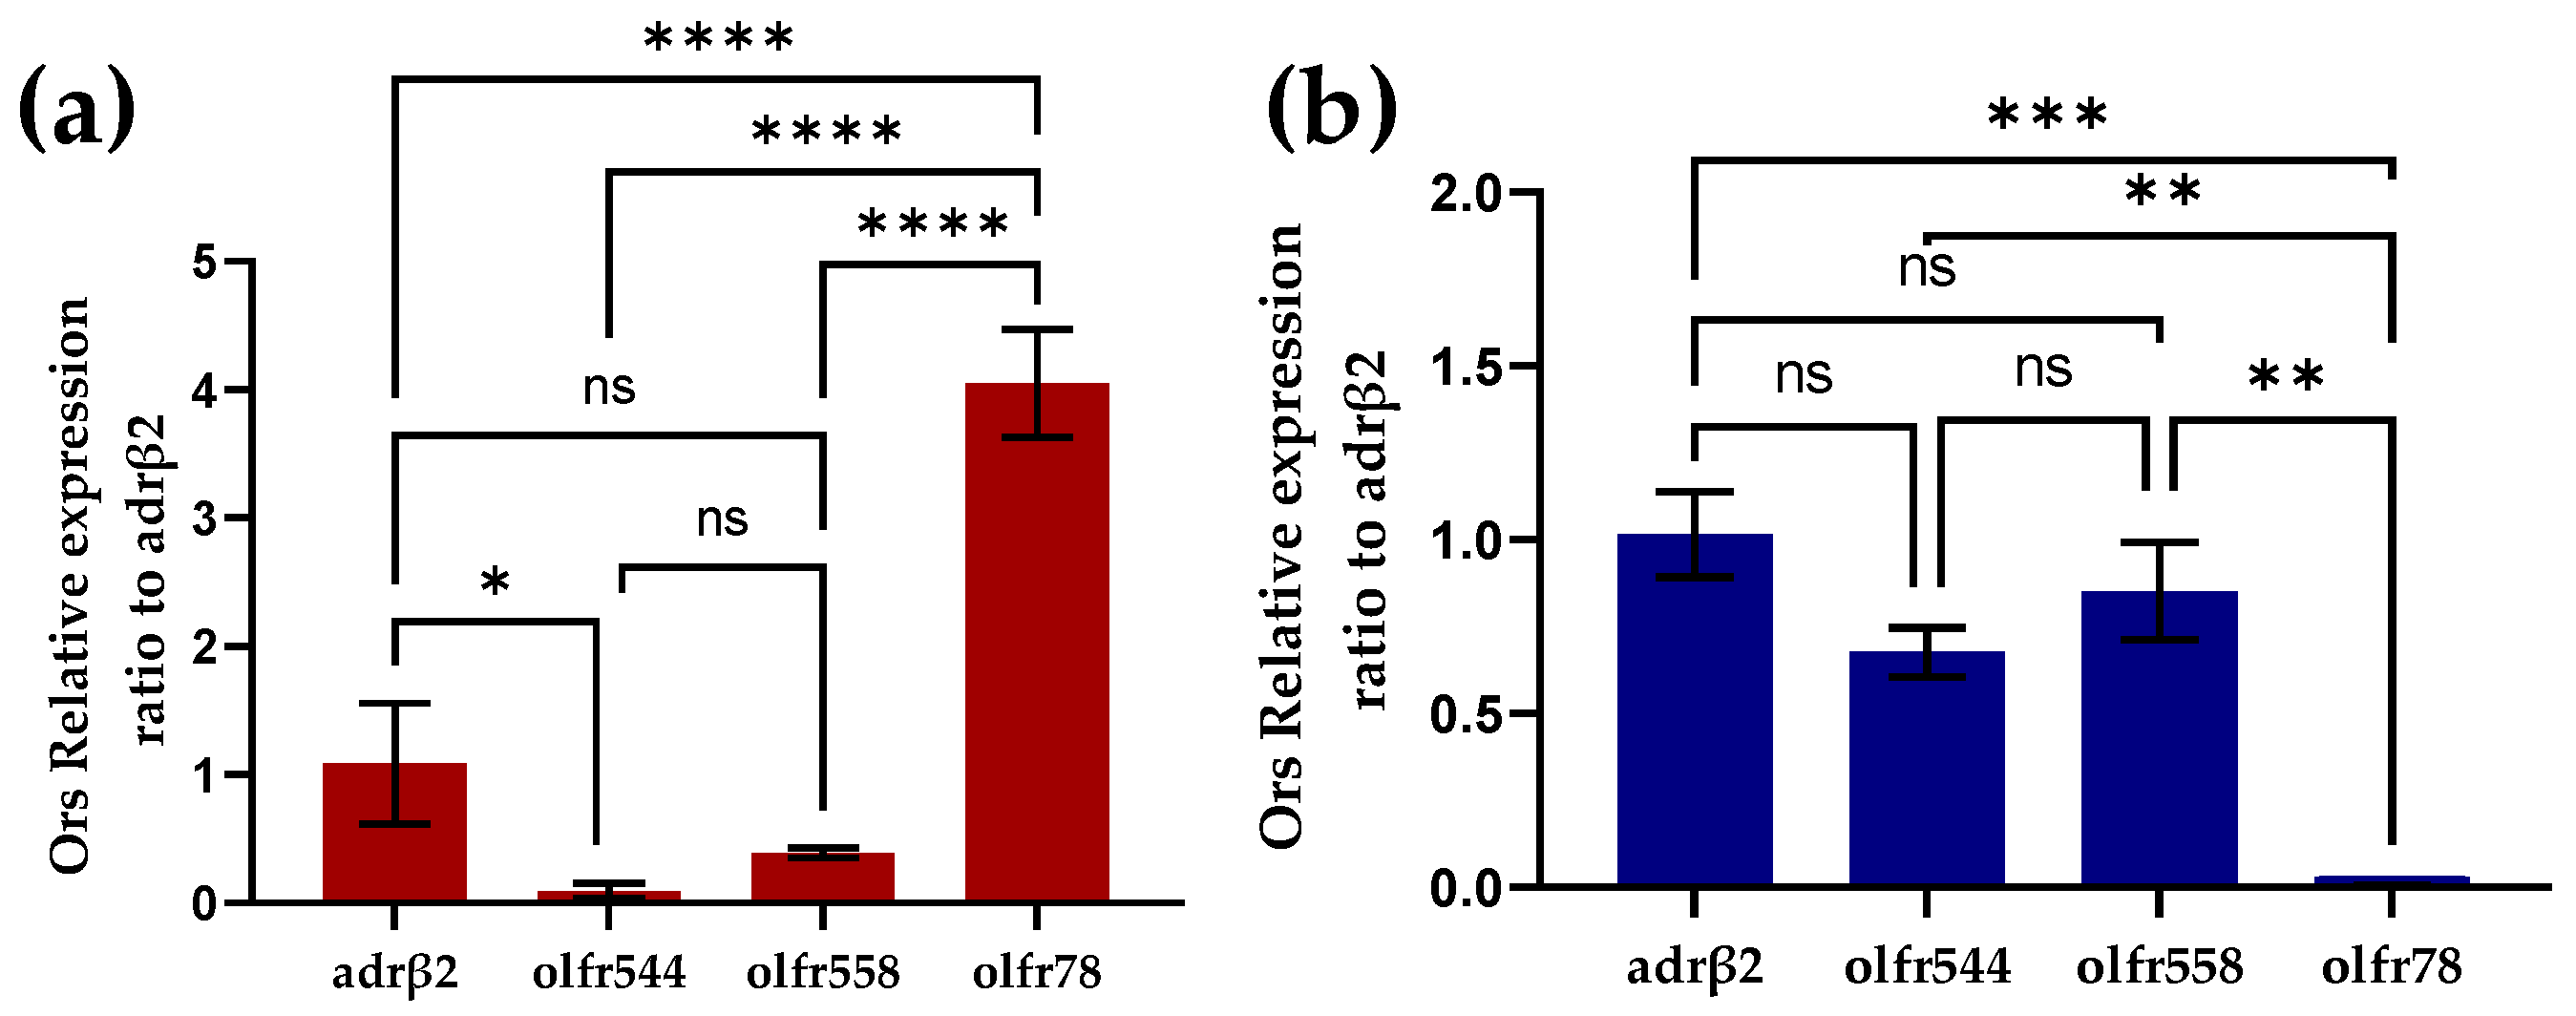
To investigate the expression of odor receptors in cardiomyocytes we performed RT-PCR experiments in primary mouse cardiomyocytes and HL-1 cardiomyocytes, respectively. In primary mouse cardiomyocytes, a large amount of Olfr78 was expressed and Olfr558 was not significantly different from olfr544 in expression (Figure 3a). Like primary cardiomyocytes, Olfr558 and olfr544 were similarly not noticeably different in expression in the HL-1 cardiomyocytes. However, olfr78 was barely expressed in the HL-1 cardiomyocytes. Previous studies have shown that olfactory receptors olfr78, olfr544, and Olfr558 are ectopically expressed in the heart [32,33,37]. However, olfr78 was shown to be expressed in the smooth muscle cells of numerous arterioles of the heart [37]. The detection of olfr78 in primary heart cultures might be because heart cultures did not contain only cardiomyocytes. In contrast, HL-1 cardiomyocytes are purified cell lines without interference from other cells, which also reduces the interfering factor of the biosensor.

Figure 3.
Identification of olfactory receptors on cardiomyocytes by RT-PCR. (a) Identification of olfactory receptors on primary mouse heart cultures by RT-PCR (n = 3). (b) Identification of olfactory receptors on HL-1 cardiomyocytes by RT-PCR (n = 3).
3.2. Detection and Analysis of the HCBO-Biosensor
3.2.1. Concentration-Dependent Response to Ligands of Olfr558
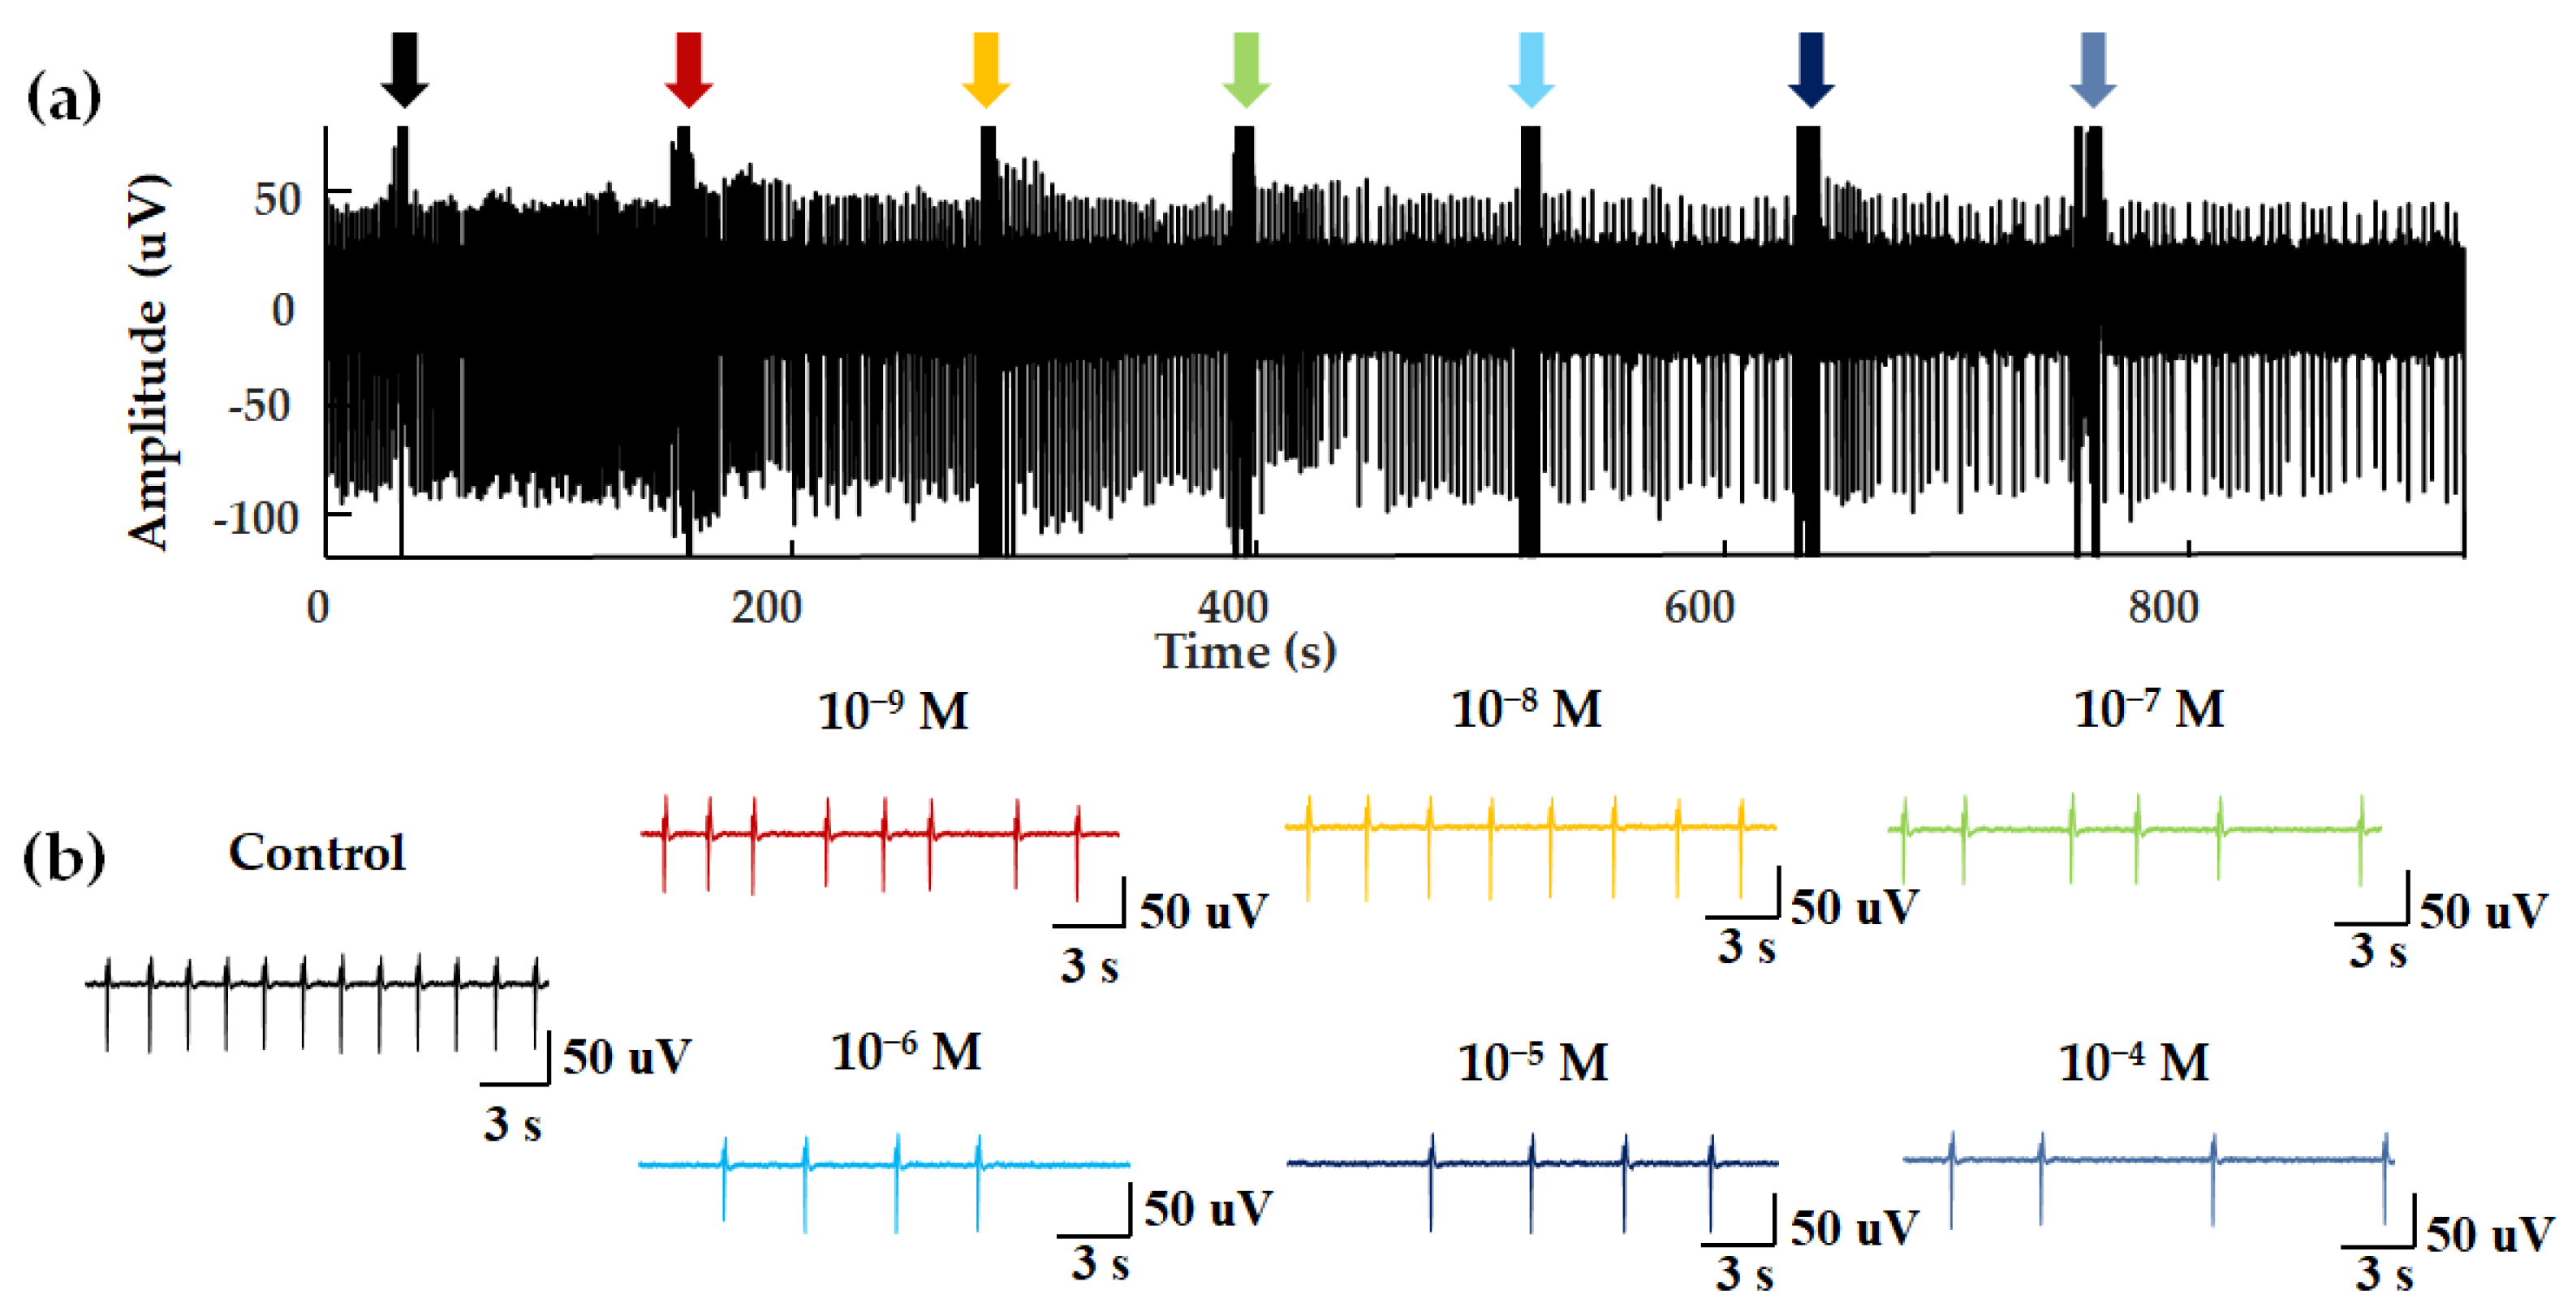
In a previous study, ligands of Olfr558 were shown to induce the negative inotropic effects and negative chronotropic effects on cardiomyocytes [33]. Negative inotropes decrease the contractility of the heart and negative chronotropic effects cause a decrease in heart rate [33]. To test the properties of the HCBO-biosensor for odor detection, we performed odor stimulation experiments with ligands of Olfr558 and observed whether negative chronotropic effects occurred. NAA and BTA were validated as ligands for Olfr558. Figure 4 shows the extracellular potential signal of HL-1 cardiomyocytes during NAA stimulation. In a blank control test, PBS was added into the HCBO-biosensor (Figure 4a, black arrow). Compared to the control group, there was a decreasing trend in the frequency of EFPs with the addition of NAA (Figure 4).
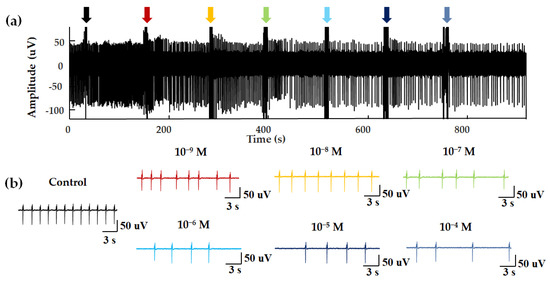
Figure 4.
EFPs for concentration–dependent experiments. (a) NAA was added dropwise to the biosensor at an interval of approximately 120 s. The seven arrows show the disturbance signal of the fluid perturbation caused by the moment of liquid addition. (b) EFPs within 20 s after different concentrations of odor stimulation.
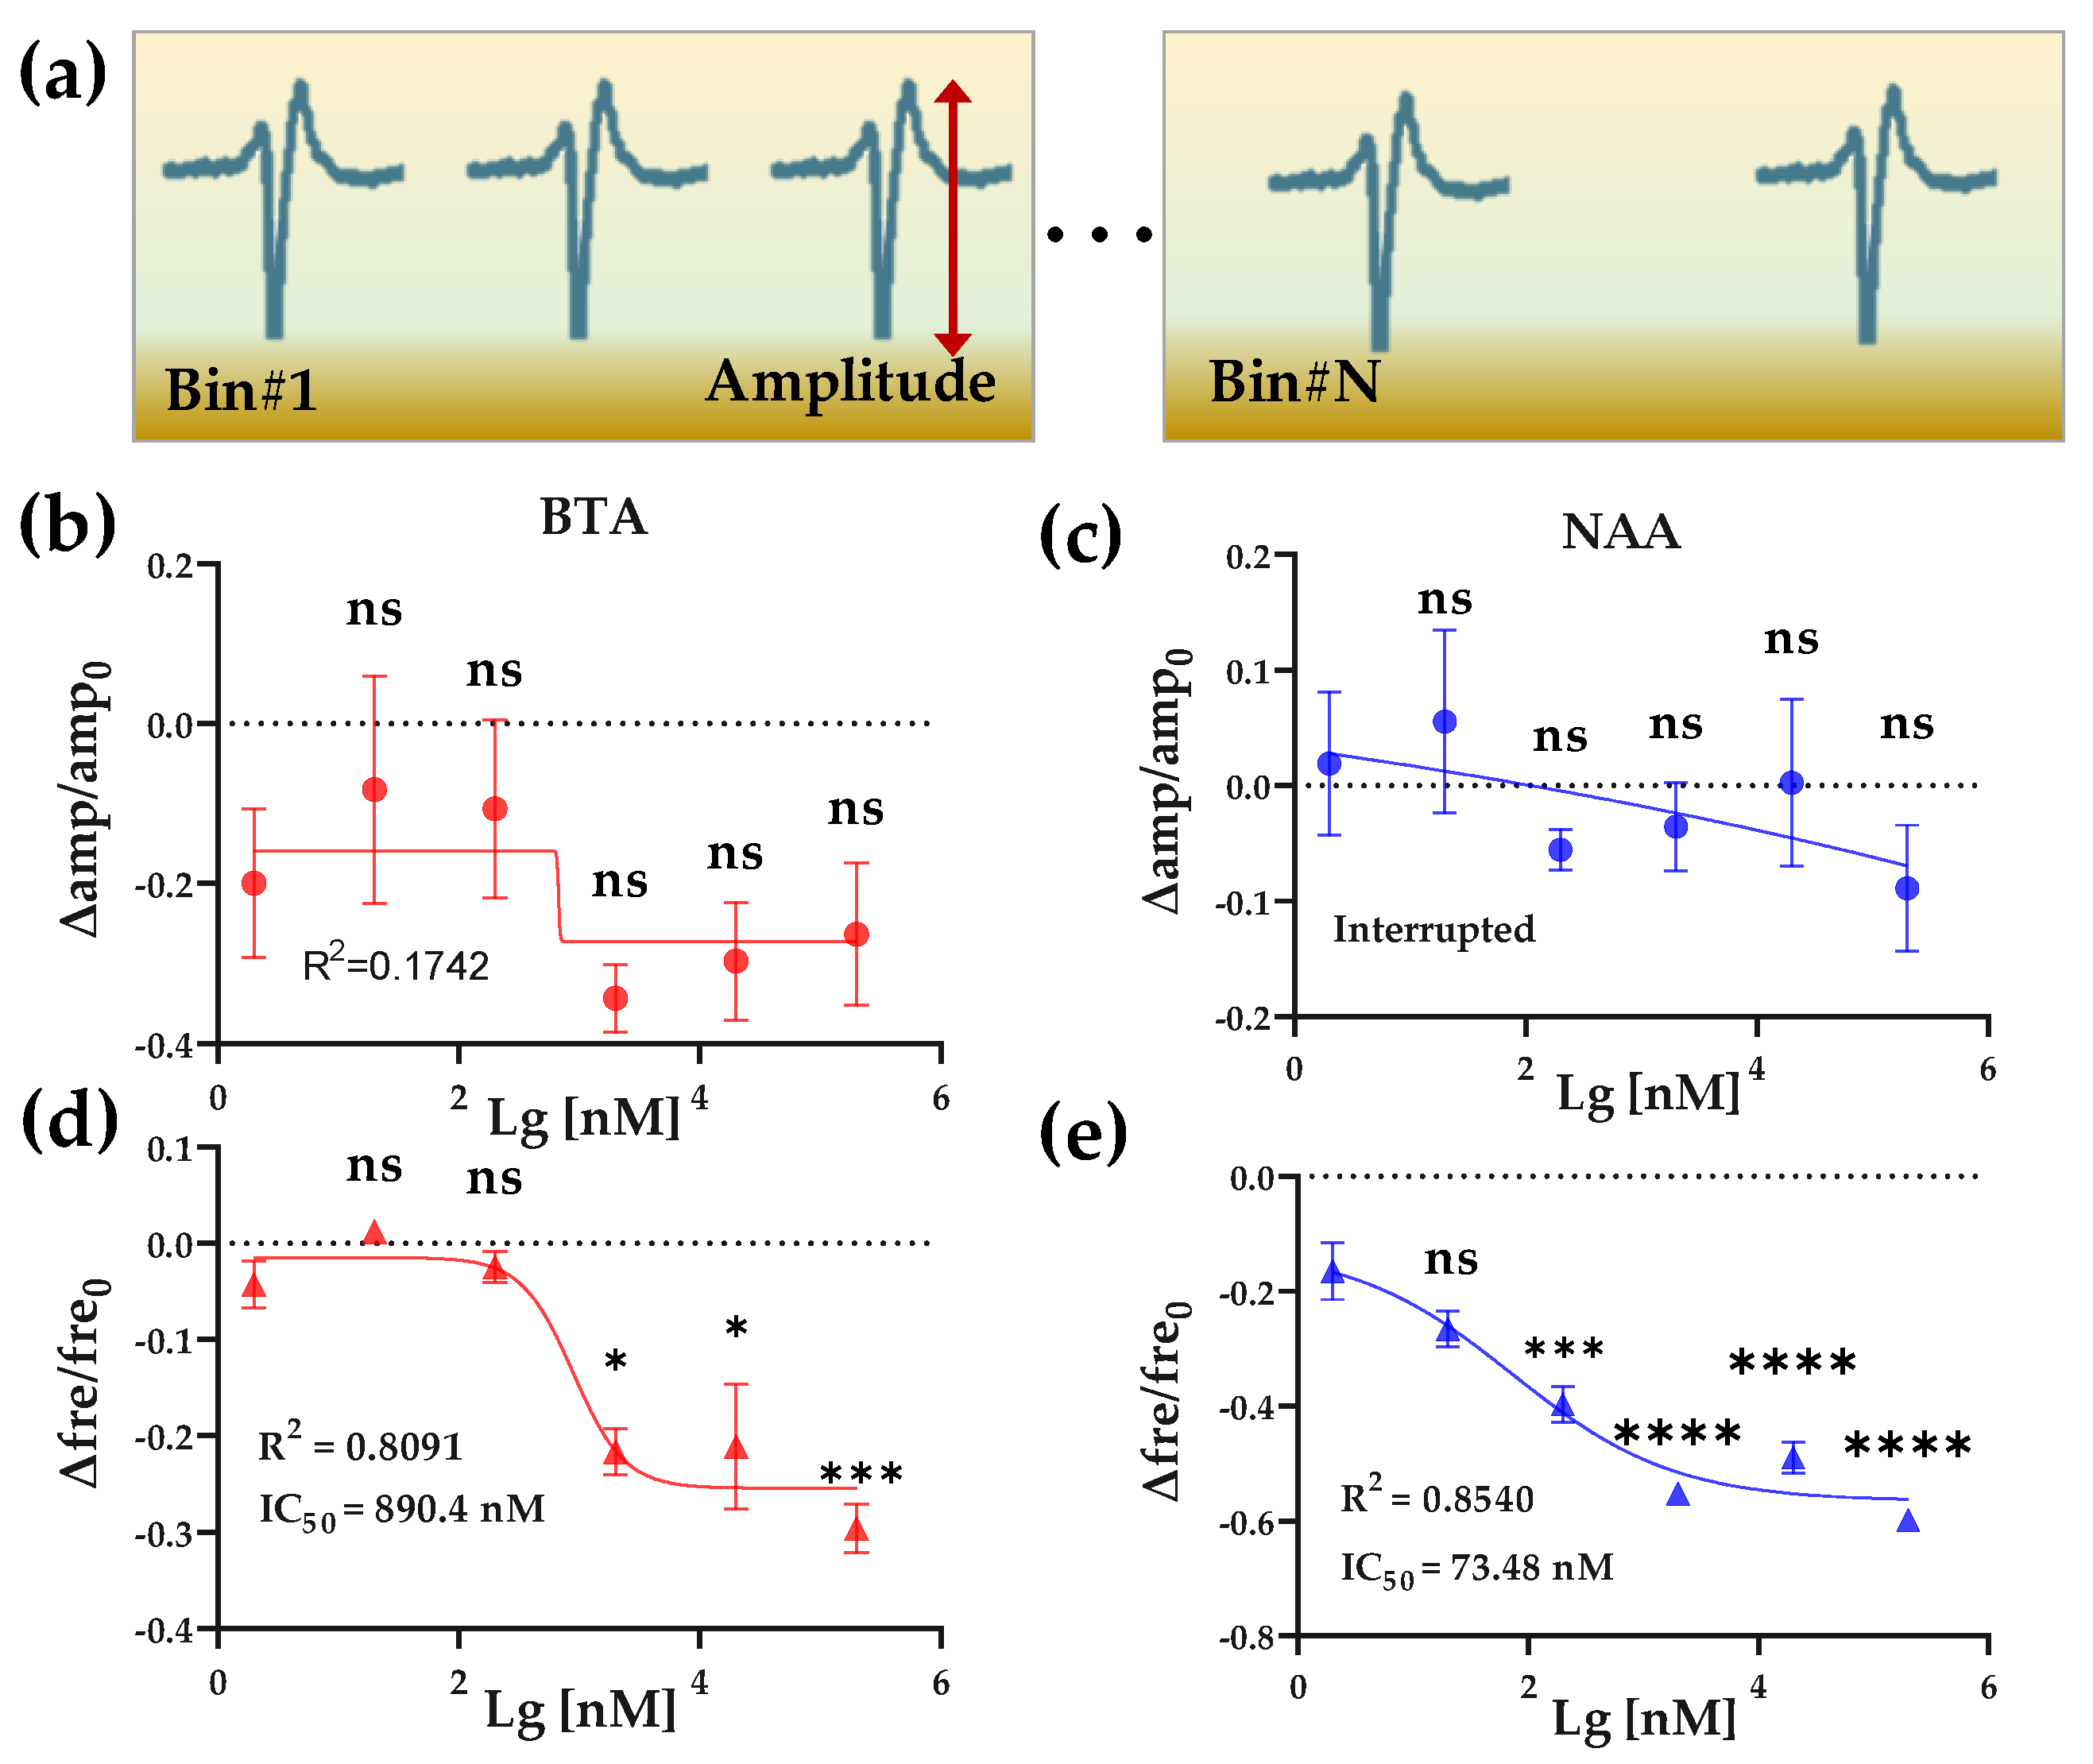
We next extracted and analyzed the amplitude and frequency of the EFPs to quantitatively compare the effects of Olfr558 ligands on HL-1 cardiomyocytes. By setting thresholds, the peaks of the original EFPs with valleys were identified, and the amplitude of each EFP was calculated from the difference between its peak and valley. The signals within 60 s after odor stimulation were counted as data in a bin, and the average firing rate was calculated (Figure 5a). To facilitate a comparison across experimental groups, we calculated the relative changes of the average amplitudes as well as the firing rate with the value of the control groups as a reference, respectively. As shown in Figure 5b,c, the relative changes in the amplitude of the EFPs, which were induced by different concentrations of BTA or NAA, did not significantly change from that of the initial concentration of odor (2 × 10⁻⁹ M). Both were fitted with nonlinear methods and were not effective. Conversely, the relative changes in frequency showed an inverse S-shaped curve in BTA and NAA groups with the values of the relative change decreasing as the odor concentration increased (Figure 5d,e). There was no significant difference in the relative change for both odor concentrations of 2 × 10⁻⁸ M compared to the initial concentration. This reduction effect in cardiac firing rate was consistent with previous research and similar to the effect of negative inotropic drugs [33,38]. One of the possible reasons for negative chronotropic effects, induced by Olfr558 in cardiomyocytes, is that the opening of the G protein-coupled inwardly-rectifying potassium channels after the activation of Olfr558 via the Gβγ subunit leads to a reduction in the frequency of Ca2+ spike. The nonlinear fit method was used to calculate an IC50 value of 890.4 nM for the BTA group, while the IC50 for NAA was 73.48 nM. The IC50 value of NAA measured by the HCBO-biosensor was much smaller than the EC50 tested in HEK293 which heterologously expresses OR51E1. The result indicated that the HCBO-biosensor was effective for the ligand odor of Olfr558 and was more sensitive than the transfection method reported previously. In this test, we also determined the relative change value of EFPs frequency as the output parameter of the biosensor.
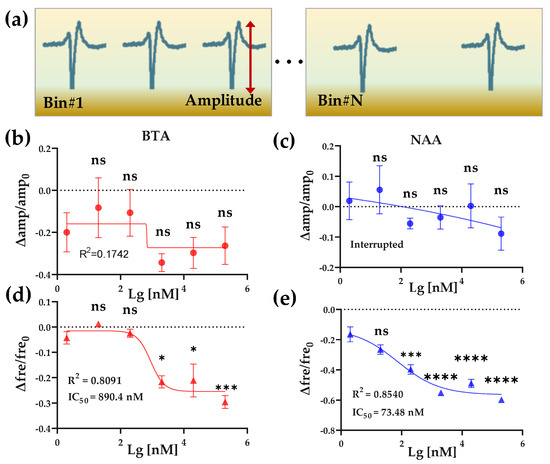
Figure 5.
BTA and NAA concentration gradient response. (a) Schematic diagram of amplitude and frequency feature extraction of EFP waveforms from one channel. (b,c) The effect of 2 × 10⁻⁹~2 × 10⁻⁴ M BTA and NAA on the relative change values of the amplitude of HL-1 cardiomyocyte EFPs, respectively. (d,e) The effect of 2 × 10⁻⁹~2 × 10⁻⁴ M BTA and NAA on the relative change values of the frequency of HL-1 cardiomyocyte EFPs, respectively.
3.2.2. Specific Response Test of HCBO-Biosensor
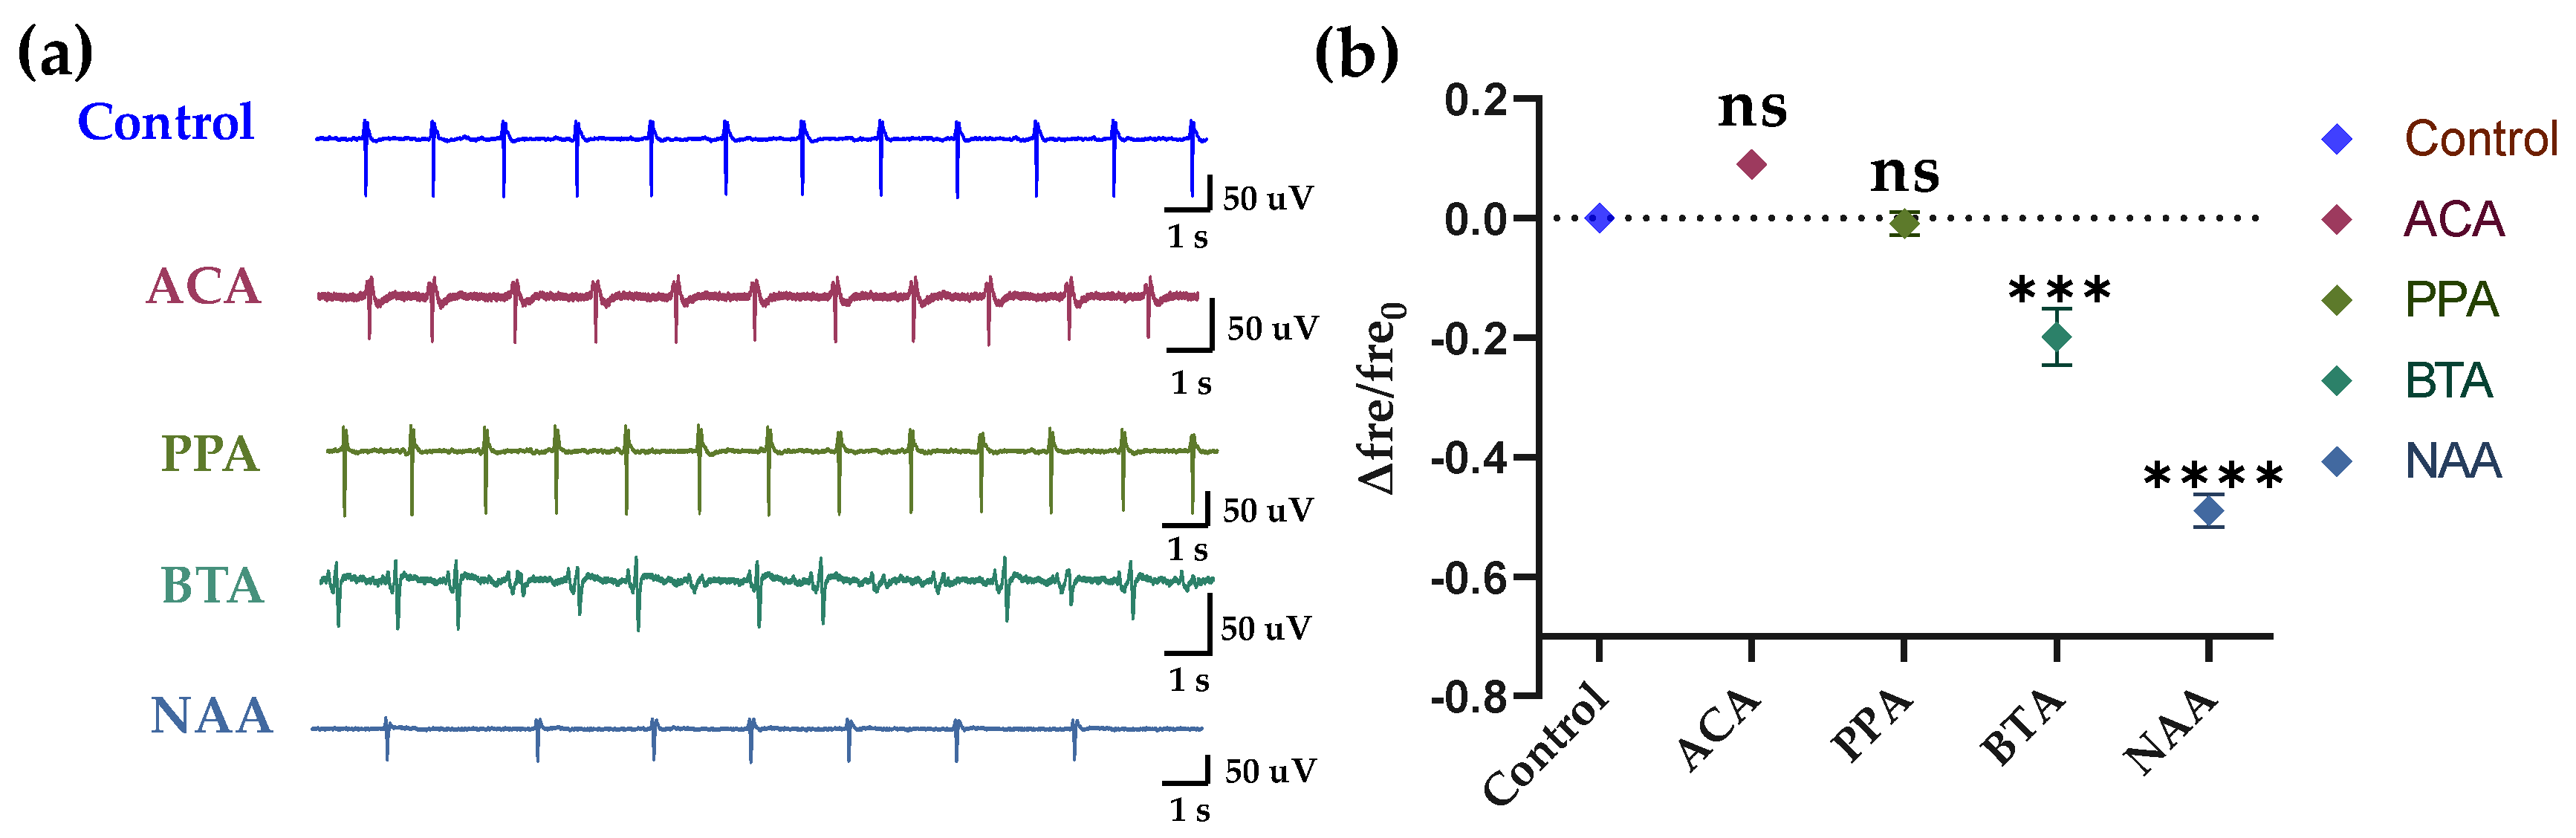
To verify the specificity of the HCBO-biosensor for ligands of Olfr558, we added the ligands of the olfr78 (which is rarely expressed in HL-1 cardiomyocytes) as test groups. In this experiment, acetic acid (ACA), propionic acid (PPA), BTA, and NAA at concentrations of 2 × 10⁻⁵ M were used. As shown in Figure 6, there was no significant difference in the relative change values of frequency of the ACA and PPA groups compared to the control group, while both values of the BTA and NAA groups were significantly lower than the control group. In other words, there was no significant change in the firing frequency of HL-1 cardiomyocytes after the addition of ACA or PPA, while the addition of BTA and NAA reduced the frequency. It indicated the specificity of the HCBO-biosensor for the detection of ligands of the Olfr558.
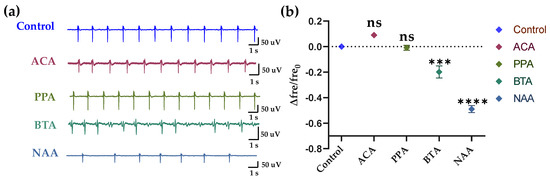
Figure 6.
Specific response of HL-1 cell-based biosensor. (a) After adding the solution for 20 s, the raw signals of groups Control, ACA, PPA, BTA, and NAA. (b) Statistics of the relative changes in the frequency of HL-1 cardiomyocytes in different groups.
3.3. Construction of Isovaleric Acid Response Model and Detection of Olfr558-Inhibited Efficiency
After the successful construction of the in vitro HCBO-biosensor, we used IVA to establish an IVA response model to explore the inhibitory efficacy of the potential masking agents citral (CIT, with lemon scent) and β-Damascenone (DMO, with floral and fruity) on Olfr558. IVA is proven to be one of the ligands of Olfr558 [34]. In the olfactory system, odor masking may arise from odor-receptor interactions at the olfactory sensory neurons, and lateral-inhibition of neurons in the olfactory bulb [39,40,41]. Previously, we developed an odor masking system based on an in vivo bioelectronic nose [25]. To compare with previous results we chose IVA to activate the HL-1 cardiomyocytes as well as to explore the efficiency of CIT and DMO on Olfr558 inhibition. The flow chart of the assay for the efficiency of inhibiting Olfr558 in this study was shown in Figure 7a.
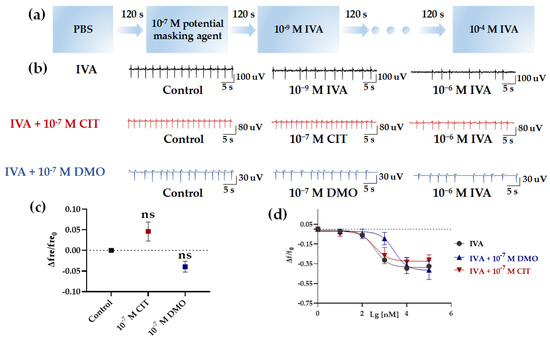
Figure 7.
Detection of the efficiency of inhibiting Olfr558. (a) The flow chart of detection of Olfr558−inhibited efficiency. (b) Raw signals of the HCBO-biosensor for IVA, IVA + CIT, and IVA + DMO groups. (c) Effect of CIT and 10−7 M DMO on the HCBO-biosensor. (d) Nonlinear fitted curves of relative changes of frequency for the three groups (black, IVA group; red, IVA + 10−7 M CIT group; blue, IVA + 10−7 M DMO group), n = 3.
First, after the addition of PBS (control group), IVA at concentrations of 10−9 M, 10−8 M, 10−7 M, 10−6 M, 10−5 M, and 10−4 M were added sequentially to investigate the effect of IVA on the HL-1 cardiomyocytes. Similar to the effect of BTA and NAA in the previous section, the frequency of HL-1 cardiomyocyte EFPs decreased with increasing concentrations of IVA (Figure 7b,d, black). In the absence of interference from potential masking agents, the IC50 of IVA for the relative change of frequency was 361.8 nM (Table 2). Next, we explored whether potential masking agents affected HL-1 cardiomyocytes. We tested the effect of CIT and DMO at a concentration of 10−7 M, respectively. CIT and DMO did not significantly change the frequency of HL-1 cardiomyocytes compared to the Control group (Figure 7b,c).
Table 2.
Fitting curve statistics in HL-1 cell-based biosensor for Olfr558 inhibition efficiency assay.
Finally, we performed tests on the inhibition efficiency of CIT and DMO for Olfr558. A total of 10−7 M of CIT or DMO was added to the biosensor after the addition of control group samples. Following, the increased concentrations of IVA were sequential to stimulate the HL-1 cardiomyocytes (Figure 7a). Figure 7c (red and blue) showed the relative change values of HL-1 cardiomyocytes frequency after the addition of six concentrations of IVA at 10−9~10−4 M in the presence of CIT and DMO. As the concentration of IVA increased, the frequency of HL-1 cardiomyocytes decreased, but this trend was more obvious in the IVA + CIT group. Both sets of curves showed a trend of inverted S-shaped curves (Figure 7d, red and blue). The IC50 of the IVA + DMO group shifted up to 2694 nM, while the value of the IVA + CIT group was 341.2 nM which was not significantly different from the IVA group (Table 2). This indicated that the presence of DMO interfered more with the binding of IVA to Olfr558, while CIT rarely affected the HL-1 cardiomyocytes.
The results were different from the results obtained by the in vivo bioelectronic nose [25]. In the in vivo method, the masking efficiency of CIT was higher than that of DMO. The reason for this result could be that the in vivo method compared the results of the interaction of odors in the olfactory bulb as well as in the olfactory epithelium, while it could not exhibit the efficacy of odor on specific olfactory receptors. However, the method in the study only detected the response of cells induced by the interaction between odorants and specific olfactory receptors. Olfr558 in cardiomyocytes has different signaling pathways from olfactory sensory neurons [33]. Previous studies have shown that CIT may inhibit the signaling of odor molecules after binding to olfactory receptors by inhibiting CNG channels [39]. However, the CNG channels are not fully expressed in cardiomyocytes, which is different from the olfactory sensory neurons [33]. Meanwhile, in the odor masking test by humans, the DMO partly masked the IVA. The masking score of DMO was 2.4 with a total score of 5 [39]. Thus, DMO was possibly an antagonist of the Olfr558 receptor compared to CIT, which competed with the ligand of Olfr558, while CIT did not. The results provided preliminary proof that the in vitro HCBO-biosensor can be used for detecting the Olfr558-inhibited efficiency.
4. Conclusions
In summary, we first reported an in vitro HL-1 cardiomyocyte-based biosensor by combining cardiomyocytes and an MEA chip for screening potential antagonists for the olfactory receptor Olfr558. First, the olfactory receptors expressed on the HL-1 cardiomyocytes were verified through an RT-PCR test. Compared to the primary myocardial cell cultures of mice, HL-1 cardiomyocytes are purified enough to reduce the potential interference from other cells. Meanwhile, they can be passaged and thus reduce the use of mice. Then, the results from the odor experiments showed that the HCBO-biosensor specifically responded to ligands of Olfr558 and was more sensitive than some reported methods. The negative chronotropic effect caused by ligands of Olfr558 was observed from the relative change in frequency of HL-1 cardiomyocytes, and the value was defined as the output parameter of the HCBO-biosensor. Finally, an odor response model of HL-1 cardiomyocytes was constructed with IVA which was one of the key compounds of malodorous body odor. Compared with the IVA group, the DMO significantly inhibited the negative chronotropic effect and shifted the dose–response curve of IVA to the right, while the CIT did not display an obvious antagonistic effect. The efficiency of the inhibition of Olfr558 by DMO was initially verified from the in vitro HCBO-biosensor. In the next stage, a combination of more in vitro expression methods for odor receptors could construct in vitro odor receptor-array sensors for the more accurate detection of odor and the screening of olfactory receptor inhibitors [42,43,44]. In addition, the chemical substrate response of other cells ectopically expressing olfactory or taste receptors can be detected by the cellular impedance method [35], and used for investigating the role of chemoreceptor ectopic expression and finding potential drug targets [29].
Author Contributions
Conceptualization, Q.Y., C.Q.; methodology, Q.Y., C.Q., S.Z., Y.Q., J.W., C.C.; formal analysis and investigation, Q.Y., C.Q., S.Z., D.J. and L.Z.; writing—original draft preparation, Q.Y., C.Q., S.Z.; writing—review and editing, D.J. and L.Z.; supervision, L.H., D.J., P.W. and L.Z. All authors have read and agreed to the published version of the manuscript.
Funding
This research was funded by the National Key Research and Development Program of China (SQ2021AAA010032, 2021YFB3200801, 2021YFF1200803); National Natural Science Foundation of China (No. 62120106004); Natural Science Foundation of Zhejiang Province (No. LBY21H180001, LY21C100001); and China Postdoctoral Science Foundation Funded Project (No. 2020M671728, 2021T140605).
Institutional Review Board Statement
The animal study protocol was approved by Animal Use and Care Committee of Zhejiang University, China (ethics code: ZJU20200084).
Data Availability Statement
The data presented in this study are available in the article.
Conflicts of Interest
The authors declare no conflict of interest.
References
- Mayer, S.; Hazenkamp, M.; Kluttig, M.; Ochs, D. Inhibition of microbial production of the malodorous substance isovaleric acid by 4,4′dichloro 2-hydroxydiphenyl ether (DCPP). Microbiologyopen 2021, 10, e1174. [Google Scholar] [CrossRef]
- Hara, T.; Kyuka, A.; Shimizu, H. Butane-2,3-dione: The Key Contributor to Axillary and Foot Odor Associated with an Acidic Note. Chem. Biodivers. 2015, 12, 248–258. [Google Scholar] [CrossRef] [PubMed]
- Azuma, K.; Ikeda, K.; Kagi, N.; Yanagi, U.; Osawa, H. Prevalence and risk factors associated with nonspecific building-related symptoms in office employees in Japan: Relationships between work environment, Indoor Air Quality, and occupational stress. Indoor Air 2015, 25, 499–511. [Google Scholar] [CrossRef] [PubMed]
- Avery, R.C.; Wing, S.; Marshall, S.W.; Schiffman, S.S. Odor from industrial hog farming operations and mucosal immune function in neighbors. Arch. Environ. Health Int. J. 2004, 59, 101–108. [Google Scholar] [CrossRef] [PubMed]
- Hirasawa, Y.; Shirasu, M.; Okamoto, M.; Touhara, K. Subjective unpleasantness of malodors induces a stress response. Psychoneuroendocrinology 2019, 106, 206–215. [Google Scholar] [CrossRef] [PubMed]
- Oliveira, E.C.V.d.; Salvador, D.S.; Holsback, V.; Shultz, J.D.; Michniak-Kohn, B.B.; Leonardi, G.R. Deodorants and antiperspirants: Identification of new strategies and perspectives to prevent and control malodor and sweat of the body. Int. J. Dermatol. 2021, 60, 613–619. [Google Scholar] [CrossRef] [PubMed]
- McGee, T.; Rankin, K.M.; Baydar, A. The design principles of axilla deodorant fragrances. In Olfaction and Taste XII: An International Symposium; Murphy, C., Ed.; New York Academy of Sciences: New York, NY, USA, 1998; Volume 855, pp. 841–846. [Google Scholar]
- Gautschi, M.; Natsch, A.; Schröder, F. Biochemistry of human axilla malodor and chemistry of deodorant ingredients. Chim. Int. J. Chem. 2007, 61, 27–32. [Google Scholar] [CrossRef]
- Boeker, P. On ‘electronic nose’ methodology. Sens. Actuators B Chem. 2014, 204, 2–17. [Google Scholar] [CrossRef]
- Xiong, Y.; Chen, Y.; Chen, C.; Wei, X.; Xue, Y.; Wan, H.; Wang, P. An Odor Recognition Algorithm of Electronic Noses Based on Convolutional Spiking Neural Network for Spoiled Food Identification. J. Electrochem. Soc. 2021, 168, 077519. [Google Scholar] [CrossRef]
- Khorramifar, A.; Rasekh, M.; Karami, H.; Malaga-Toboła, U.; Gancarz, M. A Machine Learning Method for Classification and Identification of Potato Cultivars Based on the Reaction of MOS Type Sensor-Array. Sensors 2021, 21, 5836. [Google Scholar] [CrossRef]
- Zhang, J.; Xue, Y.; Sun, Q.; Zhang, T.; Chen, Y.; Yu, W.; Xiong, Y.; Wei, X.; Yu, G.; Wan, H. A miniaturized electronic nose with artificial neural network for anti-interference detection of mixed indoor hazardous gases. Sens. Actuators B Chem. 2021, 326, 128822. [Google Scholar] [CrossRef]
- Kim, K.-H. Experimental Demonstration of Masking Phenomena between Competing Odorants via an Air Dilution Sensory Test. Sensors 2010, 10, 7287–7302. [Google Scholar] [CrossRef] [PubMed] [Green Version]
- Niu, Y.; Wang, P.; Xiao, Z.; Zhu, J.; Sun, X.; Wang, R. Evaluation of the perceptual interaction among ester aroma compounds in cherry wines by GC-MS, GC-O, odor threshold and sensory analysis: An insight at the molecular level. Food Chem. 2019, 275, 143–153. [Google Scholar] [CrossRef]
- Serizawa, S.U.; Miyamichi, K.; Sakano, H. One neuron-one receptor rule in the mouse olfactory system. Trends Genet. 2004, 20, 648–653. [Google Scholar] [CrossRef]
- Buck, L.; Axel, R. A Novel Multigene Family May Encode Odorant Receptors—A Molecular-Basis for Odor Recognition. Cell 1991, 65, 175–187. [Google Scholar] [CrossRef]
- Malnic, B.; Hirono, J.; Sato, T.; Buck, L.B. Combinatorial receptor codes for odors. Cell 1999, 96, 713–723. [Google Scholar] [CrossRef] [Green Version]
- Liu, M.T.; Na, M.; Li, Y.; Biscoe, M.R.; Ryan, K. Conformational Sensing by a Mammalian Olfactory Receptor. Chem. Eur. J. 2020, 26, 11462–11469. [Google Scholar] [CrossRef]
- Gregorio, G.G.; Masureel, M.; Hilger, D.; Terry, D.S.; Juette, M.; Zhao, H.; Zhou, Z.; Perez-Aguilar, J.M.; Hauge, M.; Mathiasen, S. Single-molecule analysis of ligand efficacy in β2AR–G-protein activation. Nature 2017, 547, 68–73. [Google Scholar] [CrossRef]
- Pfister, P.; Smith, B.C.; Evans, B.J.; Brann, J.H.; Trimmer, C.; Sheikh, M.; Arroyave, R.; Reddy, G.; Jeong, H.Y.; Raps, D.A.; et al. Odorant Receptor Inhibition Is Fundamental to Odor Encoding. Curr. Biol. 2020, 30, 2574–2587. [Google Scholar] [CrossRef]
- Kim, T.H.; Lee, S.H.; Lee, J.; Song, H.S.; Oh, E.H.; Park, T.H.; Hong, S. Single-Carbon-Atomic-Resolution Detection of Odorant Molecules using a Human Olfactory Receptor-based Bioelectronic Nose. Adv. Mater. 2009, 21, 91–94. [Google Scholar] [CrossRef]
- Lee, S.H.; Kwon, O.S.; Song, H.S.; Park, S.J.; Sung, J.H.; Jang, J.; Park, T.H. Mimicking the human smell sensing mechanism with an artificial nose platform. Biomaterials 2012, 33, 1722–1729. [Google Scholar] [CrossRef] [PubMed]
- Rosano, G.L.; Ceccarelli, E.A. Recombinant protein expression in Escherichia coli: Advances and challenges. Front. Microbiol. 2014, 5, 172. [Google Scholar] [CrossRef] [PubMed] [Green Version]
- Zhuang, L.; Wei, X.; Jiang, N.; Yuan, Q.; Qin, C.; Jiang, D.; Liu, M.; Zhang, Y.; Wang, P. A biohybrid nose for evaluation of odor masking in the peripheral olfactory system. Biosens. Bioelectron. 2021, 171, 112737. [Google Scholar] [CrossRef] [PubMed]
- Yuan, Q.; Qin, C.; Duan, Y.; Jiang, N.; Liu, M.; Wan, H.; Zhuang, L.; Wang, P. An in vivo bioelectronic nose for possible quantitative evaluation of odor masking using M/T cell spatial response patterns. Analyst 2022, 147, 178–186. [Google Scholar] [CrossRef] [PubMed]
- Feldmesser, E.; Olender, T.; Khen, M.; Yanai, I.; Ophir, R.; Lancet, D. Widespread ectopic expression of olfactory receptor genes. BMC Genom. 2006, 7, 121. [Google Scholar] [CrossRef] [Green Version]
- Tham, E.H.; Dyjack, N.; Kim, B.E.; Rios, C.; Seibold, M.A.; Leung, D.Y.M.; Goleva, E. Expression and function of the ectopic olfactory receptor OR10G7 in patients with atopic dermatitis. J. Allergy Clin. Immunol. 2019, 143, 1838–1848. [Google Scholar] [CrossRef]
- Woodcock, E.A.; Matkovich, S.J. Cardiomyocytes structure, function and associated pathologies. Int. J. Biochem. Cell Biol. 2005, 37, 1746–1751. [Google Scholar] [CrossRef]
- Massberg, D.; Hatt, H. Human Olfactory Receptors: Novel Cellular Functions Outside of the Nose. Physiol. Rev. 2018, 98, 1739–1763. [Google Scholar] [CrossRef]
- Foster, S.R.; Porrello, E.R.; Purdue, B.; Chan, H.-W.; Voigt, A.; Frenzel, S.; Hannan, R.D.; Moritz, K.M.; Simmons, D.G.; Molenaar, P. Expression, regulation and putative nutrient-sensing function of taste GPCRs in the heart. PLoS ONE 2013, 8, e64579. [Google Scholar] [CrossRef] [Green Version]
- Wei, X.; Qin, C.; Gu, C.; He, C.; Yuan, Q.; Liu, M.; Zhuang, L.; Wan, H.; Wang, P. A novel bionic in vitro bioelectronic tongue based on cardiomyocytes and microelectrode array for bitter and umami detection. Biosens. Bioelectron. 2019, 145, 111673. [Google Scholar] [CrossRef]
- Wu, C.; Hwang, S.H.; Jia, Y.; Choi, J.; Kim, Y.-J.; Choi, D.; Pathiraja, D.; Choi, I.-G.; Koo, S.-H.; Lee, S.-J. Olfactory receptor 544 reduces adiposity by steering fuel preference toward fats. J. Clin. Investig. 2017, 127, 4118–4123. [Google Scholar] [CrossRef] [PubMed] [Green Version]
- Jovancevic, N.; Dendorfer, A.; Matzkies, M.; Kovarova, M.; Heckmann, J.C.; Osterloh, M.; Boehm, M.; Weber, L.; Nguemo, F.; Semmler, J. Medium-chain fatty acids modulate myocardial function via a cardiac odorant receptor. Basic Res. Cardiol. 2017, 112, 13. [Google Scholar] [CrossRef] [PubMed] [Green Version]
- Halperin Kuhns, V.L.; Sanchez, J.; Sarver, D.C.; Khalil, Z.; Rajkumar, P.; Marr, K.A.; Pluznick, J.L. Characterizing novel olfactory receptors expressed in the murine renal cortex. Am. J. Physiol.-Ren. Physiol. 2019, 317, F172–F186. [Google Scholar] [CrossRef] [PubMed]
- Qin, C.; Yuan, Q.; Zhang, S.; He, C.; Wei, X.; Liu, M.; Jiang, N.; Huang, L.; Zhuang, L.; Wang, P. Biomimetic in vitro respiratory system using smooth muscle cells on ECIS chips for anti-asthma TCMs screening. Anal. Chim. Acta 2021, 1162, 338452. [Google Scholar] [CrossRef]
- Addis, R.C.; Ifkovits, J.L.; Pinto, F.; Kellam, L.D.; Esteso, P.; Rentschler, S.; Christoforou, N.; Epstein, J.A.; Gearhart, J.D. Optimization of direct fibroblast reprogramming to cardiomyocytes using calcium activity as a functional measure of success. J. Mol. Cell. Cardiol. 2013, 60, 97–106. [Google Scholar] [CrossRef] [PubMed] [Green Version]
- Mermer, P.; Strotmann, J.; Kummer, W.; Paddenberg, R. Olfactory receptor Olfr78 (prostate-specific G protein-coupled receptor PSGR) expression in arterioles supplying skeletal and cardiac muscles and in arterioles feeding some murine organs. Histochem. Cell Biol. 2021, 156, 539–553. [Google Scholar] [CrossRef] [PubMed]
- Bragança, B.; Oliveira-Monteiro, N.; Ferreirinha, F.; Lima, P.A.; Faria, M.; Fontes-Sousa, A.P.; Correia-de-Sá, P. Ion Fluxes through KCa2 (SK) and Cav1 (L-type) Channels Contribute to Chronoselectivity of Adenosine A1 Receptor-Mediated Actions in Spontaneously Beating Rat Atria. Front. Pharmacol. 2016, 7, 45. [Google Scholar] [CrossRef] [Green Version]
- Takeuchi, H.; Ishida, H.; Hikichi, S.; Kurahashi, T. Mechanism of olfactory masking in the sensory cilia. J. Gen. Physiol. 2009, 133, 583–601. [Google Scholar] [CrossRef] [Green Version]
- Inagaki, S.; Iwata, R.; Iwamoto, M.; Imai, T. Widespread Inhibition, Antagonism, and Synergy in Mouse Olfactory Sensory Neurons In Vivo. Cell Rep. 2020, 31, 107814. [Google Scholar] [CrossRef]
- Takahashi, Y.K. Detection and Masking of Spoiled Food Smells by Odor Maps in the Olfactory Bulb. J. Neurosci. 2004, 24, 8690–8694. [Google Scholar] [CrossRef] [Green Version]
- Murugathas, T.; Hamiaux, C.; Colbert, D.; Kralicek, A.V.; Plank, N.O.; Carraher, C. Evaluating Insect Odorant Receptor Display Formats for Biosensing Using Graphene Field Effect Transistors. ACS Appl. Electron. Mater. 2020, 2, 3610–3617. [Google Scholar] [CrossRef]
- Gao, K.; Gao, F.; Du, L.; He, C.; Wan, H.; Wang, P. Integrated olfaction, gustation and toxicity detection by a versatile bioengineered cell-based biomimetic sensor. Bioelectrochemistry 2019, 128, 1–8. [Google Scholar] [CrossRef]
- Du, L.; Wu, C.; Peng, H.; Zou, L.; Zhao, L.; Huang, L.; Wang, P. Piezoelectric olfactory receptor biosensor prepared by aptamer-assisted immobilization. Sens. Actuators B Chem. 2013, 187, 481–487. [Google Scholar] [CrossRef]


Publisher’s Note: MDPI stays neutral with regard to jurisdictional claims in published maps and institutional affiliations. |
© 2022 by the authors. Licensee MDPI, Basel, Switzerland. This article is an open access article distributed under the terms and conditions of the Creative Commons Attribution (CC BY) license (https://creativecommons.org/licenses/by/4.0/).