Article

Development of a Paper-Based Analytical Method for the Selective Colorimetric Determination of Bismuth in Water Samples

by
Panagiotis A. Bizirtsakis
,
Maria Tarara
,
Apostolia Tsiasioti
,
Paraskevas D. Tzanavaras
* and
George Z. Tsogas
*
Laboratory of Analytical Chemistry, School of Chemistry, Faculty of Sciences, Aristotle University of Thessaloniki, GR-54124 Thessaloniki, Greece
*
Authors to whom correspondence should be addressed.
Chemosensors 2022, 10(7), 265; https://doi.org/10.3390/chemosensors10070265
Submission received: 8 June 2022 / Revised: 29 June 2022 / Accepted: 5 July 2022 / Published: 8 July 2022
(This article belongs to the Section Analytical Methods, Instrumentation and Miniaturization)

Abstract

:
A novel, direct and simple colorimetric method employing μicroanalytical paper-based devices (μ-PADs) for the selective determination of bismuth is described. The suggested method exploits the colorimetric variation of bismuth after its rapid reaction with methyl thymol blue (MTB) in an acidic medium (pH ranging between 0.7 and 3.0), modified with nitric acid, on the surface of a paper device at room temperature. The devices are low cost, composed of chromatographic paper and wax barriers and the analytical protocol is easily applicable with minimal technical expertise and without the need for experimental apparatus. The user must add a test sample and read the color intensity of the colored Bi(III)–MTB complex formed at the sensing area using a simple imaging device such as a flatbed scanner. Various chemical variables, such as HNO3 and MTB concentration, reaction time, ionic strength, detection zone size and photo-capture detector are optimized. A study of interfering ions such as K+, Na+, Ca2+, Mg2+, Cl, SO42− and HCO3− was also conducted. The stability of the paper devices is also studied in different maintenance conditions with particularly satisfactory results, rendering the method suitable for field analysis. The detection limits are as low as 3.0 mg L−1 with very satisfactory precision, ranging from 4.0% (intra-day) to 5.5% (inter-day). Natural water samples are successfully analyzed, and bismuth percentage recoveries were calculated in the range of 82.8 to 115.4%.

1. Introduction

Bismuth is a trace element located in the environment in salt or oxide formations such as bismuth sulfide (bismuthinite-Bi2S3) and bismuth oxide (Bi2O3), and it rarely occurs naturally as the metal itself. In most cases, bismuth is associated with crystals in the suplhide ores of lead, copper, nickel, cobalt, and tin [1,2]. Bismuth occurrence in environmental samples is usually in the mg L−1 or μg L−1 concentration levels, while in sediments they were varying between 0.07 and 49.6 mg g−1 [3].
Over the past few years, Bi is environmentally significant, because of its rapidly increasing use by various industries due to its specific chemical and physical properties. Among others, Bi is often used in medicine for the treatment of peptic and dermatological disorders, as well as tumor treatment; the cosmetics industry as a colorant that creates an iridescent effect in lipsticks and hair dyes, bismuth-based nanomaterials used as semiconductors, alloys, metallurgy additives and during the production process of uranium nuclear fuels. Due to these widespread applications of Bi, its content in environmental matrices, as well as the possibility of human exposure, has been significantly increased, rendering necessary the development of fast, accurate and equipment-free methods for bismuth determination, which can also be used as control devices for bismuth environmental monitoring.
Many instrumental analytical methods have been developed for the determination of bismuth, utilizing various detection techniques, such as graphite furnace atomic absorption spectroscopy (GFAAS) [4,5], flame atomic absorption spectroscopy (FAAS) [6,7], inductively coupled plasma optical emission spectrometry (ICP-OES) [8], hydride generation inductively coupled plasma atomic emission spectrometry (HG-ICP-AES) [9], inductively coupled plasma mass spectrometry (ICP-MS) [10,11], fluorescence [1,12], UV-vis spectrophotometry [13,14] and flow injection methods [15,16].
For the colorimetric determination of bismuth, many chemical reagents have been employed, such as xylenol orange [13], lead tetramethylenedithiocarbamate (TMDTC) [17], N-(2-acetamide)iminodiacetic acid (ADA) [18], dipicolinic acid (DPA) [19], alizarin red S (ARS) [20], tetramethylammonium iodide (TMAI) [21] and methyl thymol blue (MTB) [15,16].
MTB is a thymol-containing metallochromic indicator, used in chemical analysis as an equivalence point identifier in complexometric titrations and as a spectrophotometric reagent for the formation of stable metal complexes during the spectrophotometric determination of metal ions. The MTB molecule has nine active functional groups, including four carboxylic acids, two phenolics, two amines and one sulfonyl group, providing the capacity for complexation with various metal ions [22]. MTB is a sensitive metallochromic indicator, which interacts with many metal ions depending on the pH value of the solution, such as Zn2+, Fe2+, Co2+, Cu2+, Ca2+, Mg2+, Fe3+, Al3+, Bi3+, etc. [23,24,25,26]. It is well established in previous reports that MTB has a higher affinity for metal ions with a higher charge, with the greater affinity displayed for metallic ions with the +3-oxidation state [27]. For example, MTB forms stable complexes with Al3+ [28], as well as Zr4+, Hf4+ and Bi3+ [29] under acidic conditions, but it can be used for the selective determination of bismuth due to the different maximum absorbance wavelengths and the reaction conditions required for the formation of the metal complex. For instance, Fe3+ reaction with MTB is accomplished in mild acidic values (pH = 6) [30] and alkaline metal earths such as Ca2+ and Mg2+ react at alkaline pH values [26,31], while the determination of Bi3+ was conducted in strong acidic conditions (pH = 0.7) [15,16].
Recently, there has been an increasing demand towards the production and development of simple and cheap analytical devices that are easy to implement, can be used with minimal resources and offer fast and reliable results. Based on this trend, paper-based devices are considered highly desirable analytical platforms for portable and low-cost determinations that can be used with minimal resource and instrumentation requirements and deliver swift results [32]. Since their insertion as analytical devices in 2007 by Professor G. Whiteside’s research team [33], many researchers have studied a significant number of devoted paper assays and developed several fully functional paper platforms to detect and identify a vast variety of environmental, biochemical and food analytes [34,35,36,37]. The main advantages of paper, in comparison with other materials such as silicone, plastics and glass, are that (a) it is readily available at low cost; (b) the high surface area to volume ratio, (c) the spontaneous; capillary force-driven flow of liquids without external energy sources; (d) the fibrous nature that allows reagents to be stored dry and reactivated upon rehydration; (e) the modification of the paper surface in such a way to favor the chemical detection of the analyte [38,39]. Additionally, these analytical platforms should also be portable or easily transported and installed at the point of need without loss of function, and the sensing of the analyte should be performed with the use of widely available non-specialized detectors, such as smartphones or flatbed scanners [40,41].
In this study, we report, for the first time, a paper-based assay for the selective determination of bismuth that depends on the direct complexation reaction between bismuth and MTB in a strongly acidic medium and the colorimetric variation generated on the paper surface, recorded by a flatbed scanner. The paper-based devices used are easy to fabricate, of low cost, are manufactured in a few seconds, and the analytical protocol is easily executable with negligible technical expertise and without the need for any expensive specialized instrumentation. According to the experimental protocol followed during this study, the user only added the appropriate amount of the solutions (a few μL) to adjust the experimental conditions, waiting for the device to dry at room temperature and reading the colorimetric alteration on the sensing area using a simple imaging device, such as a smartphone or a flatbed scanner. Moreover, we have evaluated the applicability of this method for the selective determination of bismuth in natural water samples and the results were satisfactory regarding sensitivity, recovery and reproducibility.

2. Materials and Methods

2.1. Reagents and Solutions

Methyl thymol Blue (MTB), Bismuth(III) nitrate pentahydrate, potassium chloride, sodium chloride, calcium chloride dihydrate, sodium sulfate anhydrous and sodium hydrogen carbonate were provided by Merck (Darmstadt, Germany), nitric acid was purchased by Sigma (St. Louis, MO, USA), magnesium chloride hexahydrate and sodium nitrate were provided by Panreac (Madrid, Spain). All chemical substances were of analytical grade and all the solutions were prepared with de-ionized water. The standard stock Bi(NO3)3 solution (1000 mg L−1 Bi(III)) also contained 0.5 mol L−1 HNO3 to prevent hydrolysis of the ions. Working Bi(III) solutions were prepared daily by the appropriate dilutions of the stock Bi(III) solution at a final HNO3 concentration of 0.1 mol L−1. A standard stock solution of 2 mol L−1 HNO3 was used for pH adjustment. Methyl thymol blue working solutions were prepared on a daily basis and were used without further purification while the MTB stock solution (1 mmol L−1) was prepared on a weekly basis by dissolving the required amount in de-ionized water. All solutions were de-gassed with purified nitrogen and all the stock solutions were stored in polyethylene containers. All the polyethylene containers and glassware used for aqueous solutions containing metal ions were cleaned in dilute HNO3, while the rest of the glassware was cleaned in 3% Decon 90. All were rinsed with de-ionized water before use. Cation and anion stock solutions for the selectivity investigation were 500 mg L−1 for each ion studied. Finally, sodium nitrate (NaNO3) stock solution (4 mol L−1) used for the salinity study, was prepared by dissolving the appropriate amount in de-ionized water.

2.2. Apparatus

For the fabrication of μPADs a ColorQube 8580DN Xerox printer was used for the deposition of solid wax on Whatman No. 1 chromatography paper in predestinated patterns originating on a white background. A pH meter (Orion) was used for the measurement of the pH values. The images of the paper devices were captured using a mobile smartphone (Xiaomi Poco X3) and a flatbed scanner (HP Scanjet 4850).

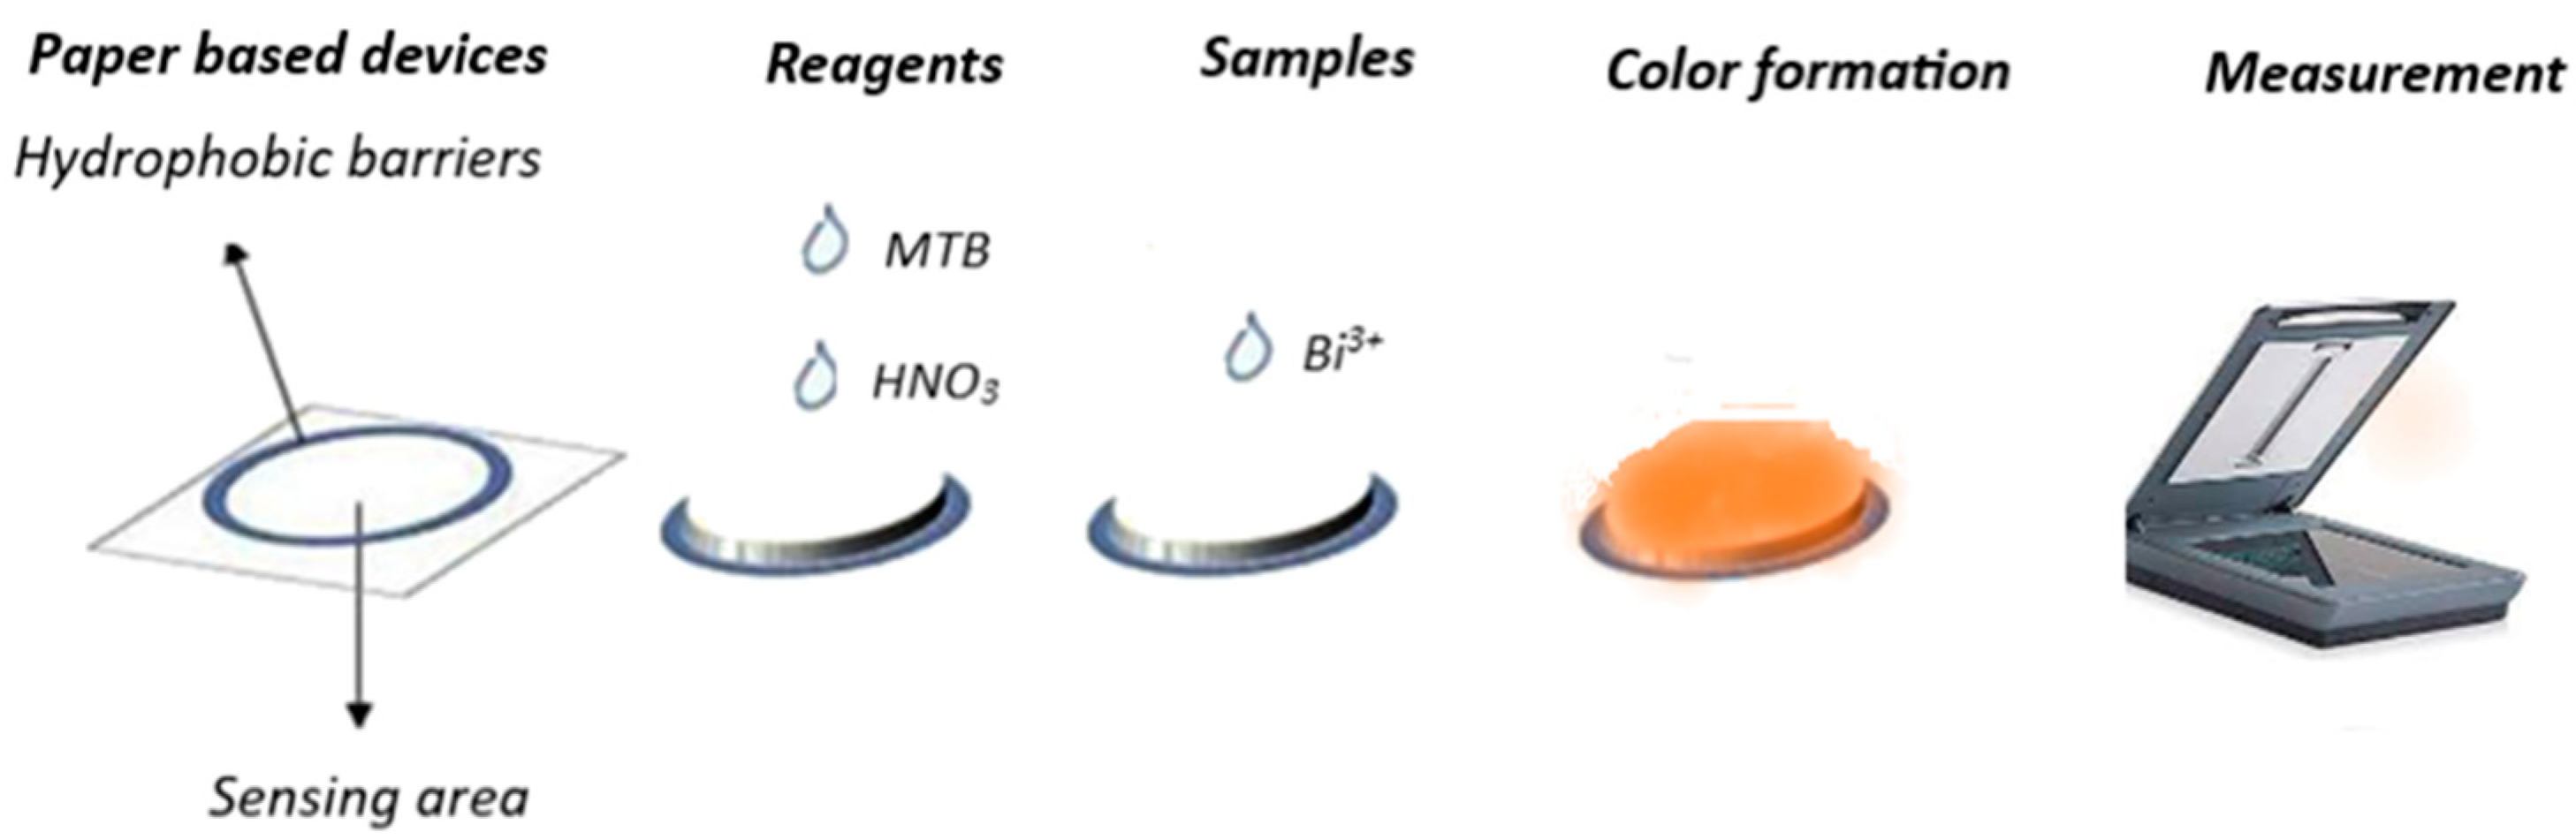
2.3. Fabrication of Paper Devices

The patterns of the devices were printed on paper using a wax printer. Hydrophilic sensing areas were designed with PowerPoint program. To create hydrophobic barriers on both sides of the paper, the paper was heated in an oven for 2.0 min at 120 ± 5 °C to melt the wax and pierce the paper. The devices produced had a diameter of 0.8 cm, an internal diameter of 0.4 cm (hydrophilic sensing zone) and 0.2 cm barrier thickness. Chromatography paper (Whatman No. 1) was used for this procedure because of its relatively high thickness and mass per area (0.18 mm, 87 g m−2), homogenous configuration (compared to other types of paper) and the absence of additives affecting the experimental process.

2.4. Experimental Procedure

Τhe experimental process was not laborious even for an inexperienced researcher, with minimum requirements for laboratory instrumentation. In brief, on the paper surface were added by the following sequence, 1 μL nitric acid 0.01 mol L−1, 1 μL MTB 0.5 mmol L−1 and finally 1 μL of the water sample or the bismuth standards. After each deposition, the paper device was left to dry for 10 min at room temperature. Subsequently the sensing areas of the paper-based devices revealed colorimetric differences depending on the bismuth concentration and the signal was captured by the smartphone or the flatbed scanner. The photographs were saved as files in JPEG format (300 dpi), and then Image J program was used to measure the mean intensity of the color in the red channel of the RGB mode (Figure 1).

2.5. Real Samples

The method was assessed on five different natural, surface water samples. The origin of the samples is divided into distinct categories, river waters, bottled samples and tap water. Specifically, the river water samples were collected from the rivers Acheron and Louros in northwestern Greece, the natural mineral water samples were bottled in plastic containers of 500 mL each and were purchased from local stores in Thessaloniki and finally the tap water sample was collected at the water supply system of the center of Thessaloniki. The samples were filtered with plain filter paper and were stored at 4 °C in the refrigerator.

3. Results and Discussion

3.1. Optimization Procedures

The ability of the proposed paper-based procedure for the selective colorimetric determination of bismuth in natural water samples was investigated in detail, and all parameters that could influence the efficiency of the proposed method were thoroughly studied and subsequently presented.

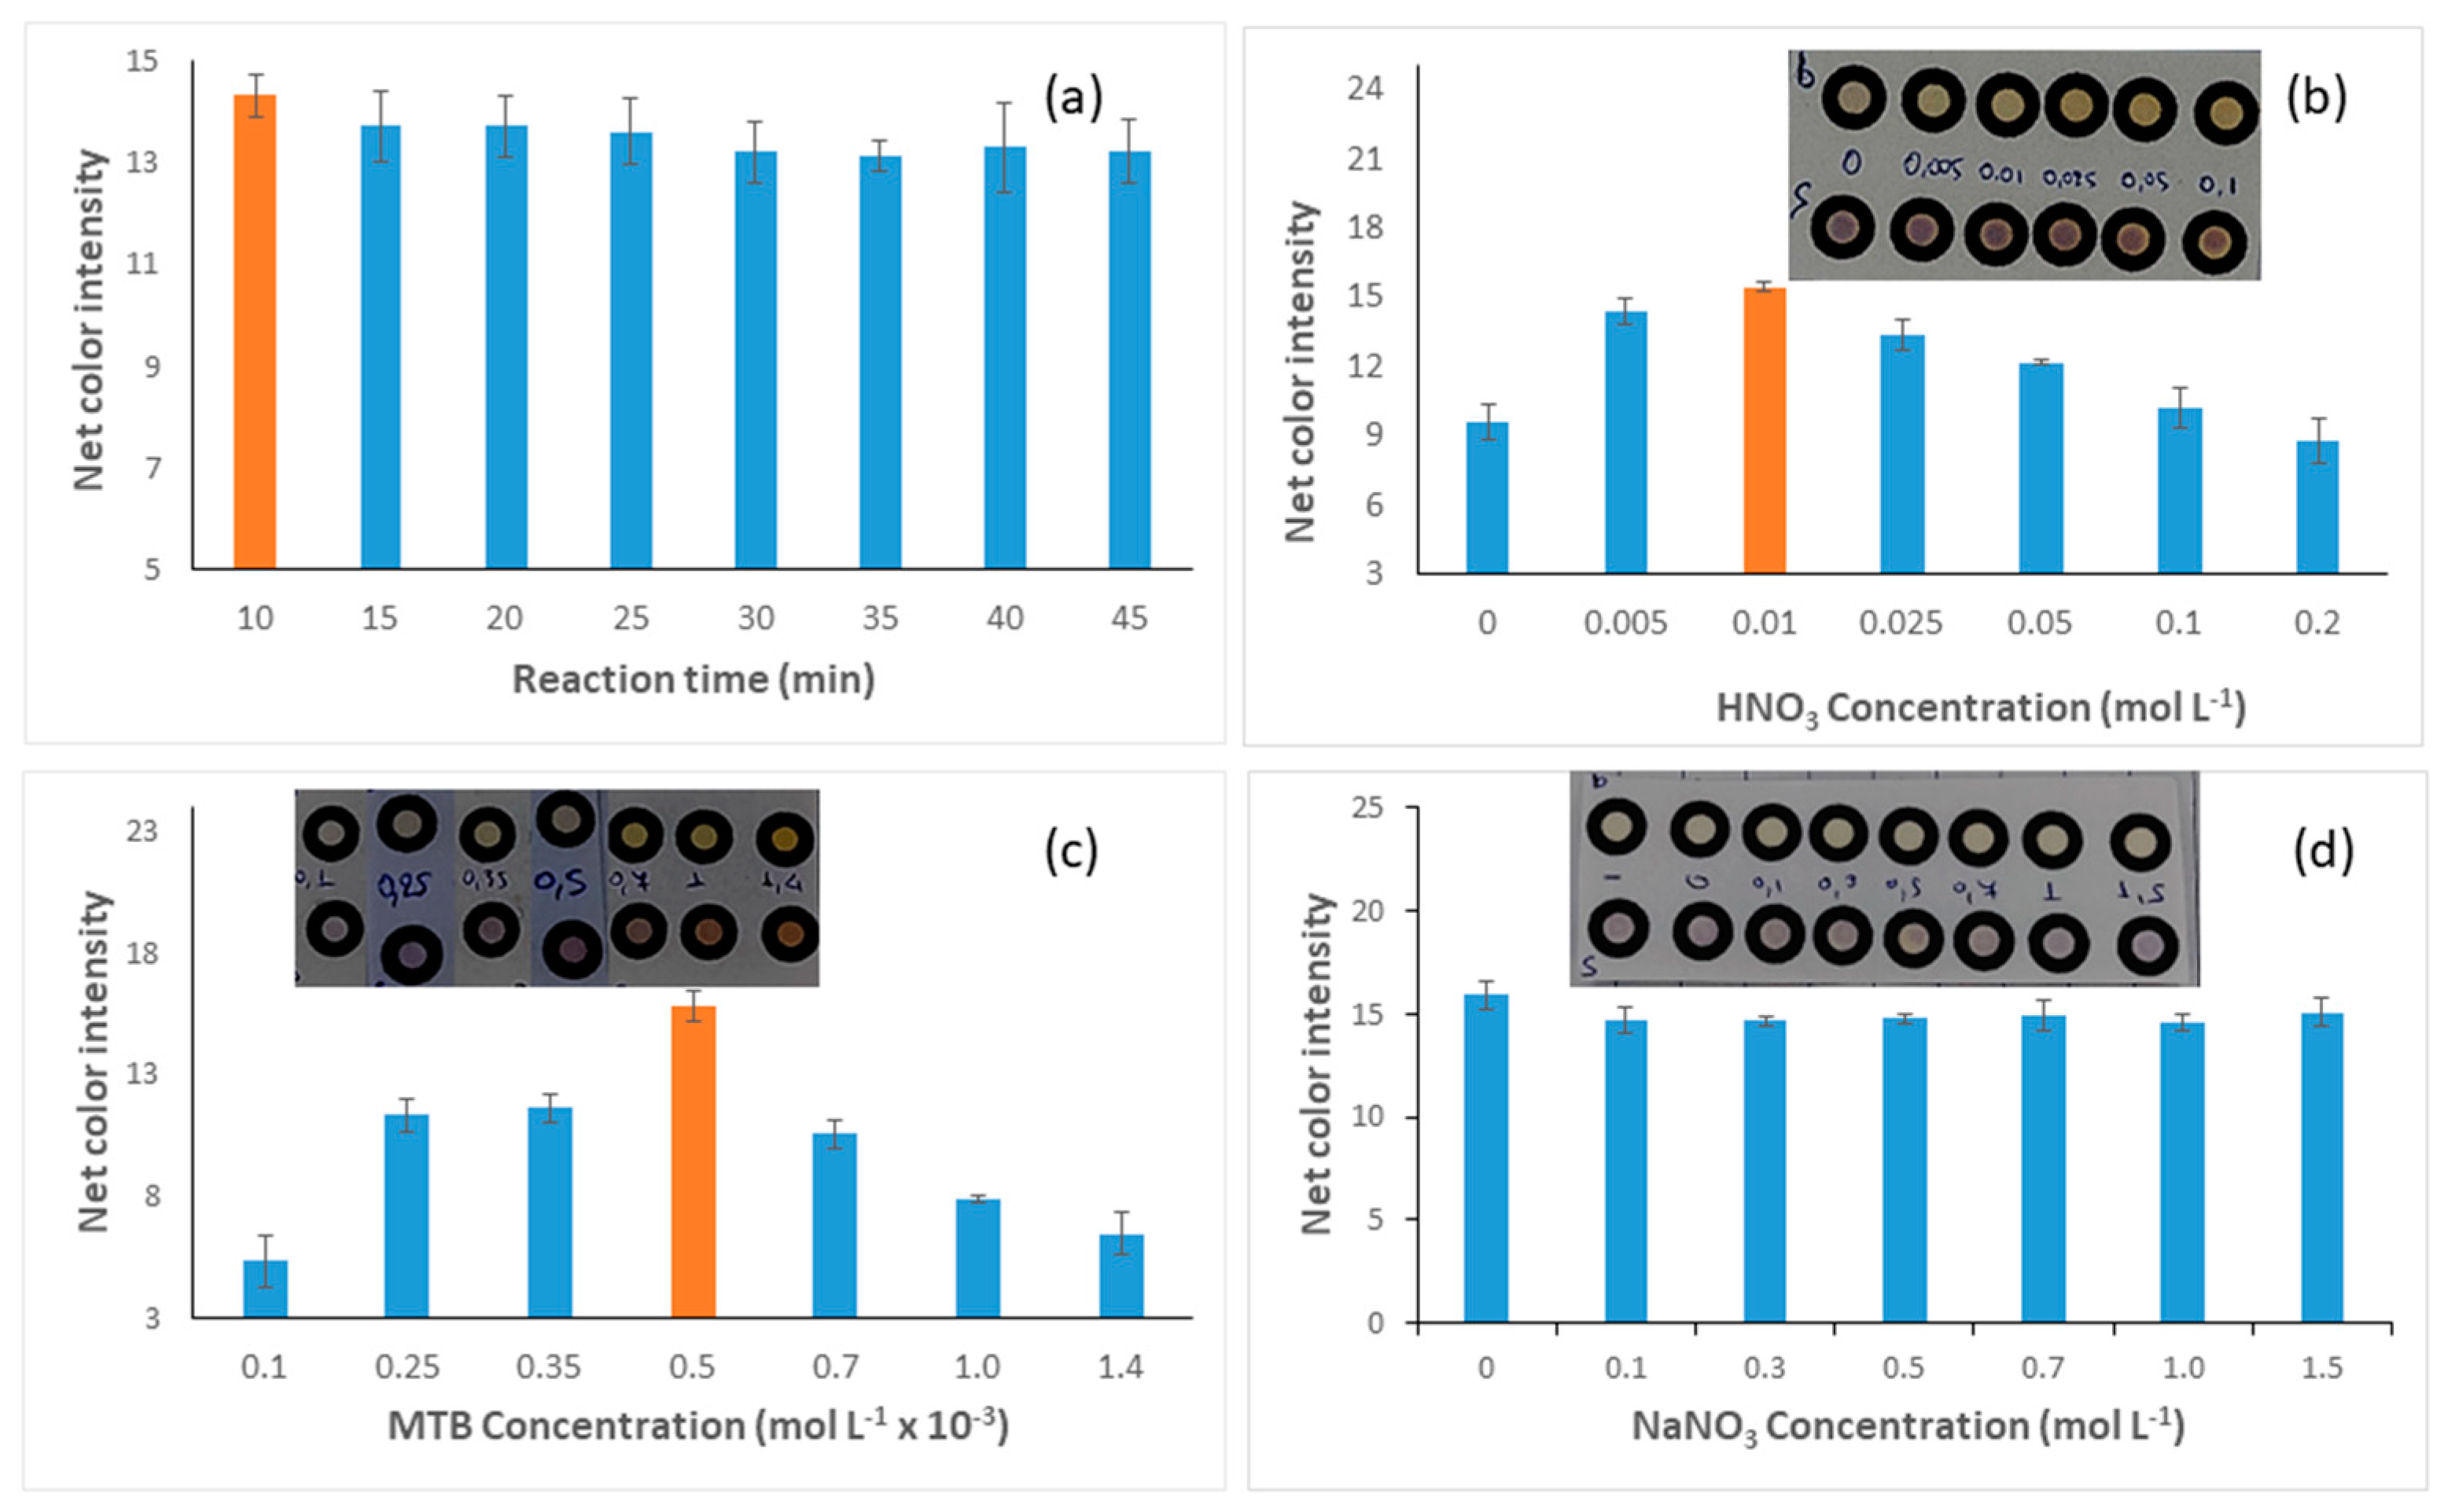
3.1.1. Effect of Reaction Time

The effect of reaction time was studied in the range of 10 to 45 min. The color development in aqueous solutions based on the formation of the complex between MTB and bismuth is a rapid phenomenon at room temperature [15,16]. However, due to the different substrates used for the present study (paper devices), it was considered necessary to study the reaction time for the quantitative formation of the complex between bismuth ions and MTB molecules. Thus, the net color signal was studied for various time intervals from 10 min (the shortest time demanded for the analytical paper-based devices to dry) to 45 min, as depicted in Figure 2a. The slight decrease in the colorimetric signal is attributed to the effect of sunlight on the surface of the paper devices. It has been observed by other research groups that sunlight affects the color of paper devices by reducing the difference between the sample and the blank [42]. It is apparent from Figure 2a that the reception of the photograph should be conducted for a reaction time of 10 min.

3.1.2. Effect of Nitric Acid Concentration

The formation of the bismuth-MTB complex has been studied in detail, and all the experimental literature reports agree that the formation of the complex takes place under highly acidic conditions [14,15,16]. Thus, the influence of the HNO3 concentration in the evolution of the complexation reaction was studied in the range from 0 to 0.2 mol L−1 by adding 1 μL of the appropriate diluted solution to the paper surface. The nitric acid solutions studied were 0.001, 0.005, 0.01, 0.025, 0.05, 0.1 and 0.2 M and the pH values for each of these were 3.0, 2.3, 2.0, 1.6, 1.3, 1.0 and 0.7, respectively. The experiments showed that maximum complex formation was achieved for an HNO3 concentration of 0.01 mol L−1, and thus this concentration was chosen for subsequent experiments (Figure 2b).

3.1.3. Effect of MTB Concentration

The next parameter studied was the concentration of methyl thymol blue (MTB) as the complexation reagent. The effect of the MTB concentration was studied in the range from 0.1 to 1.5 mmol L−1. Maximum signals were obtained at 0.5 mmol L−1 MTB, as depicted in Figure 2c. At low MTB concentration values, the formation of the colored complex was not sufficient, and the color disappeared after a few minutes, while at MTB concentration values higher than 0.7 mmol L−1, the excess of MTB, the orange color is preserved even after the addition of the analyte, resulting in a lower intensity difference between the blank and sample signals.

3.1.4. Effect of Ionic Strength

The effect of ionic strength during the complex formation was studied by adding different amounts of solid NaNO3 to the paper surface just before the addition of the analyte. The reaction was not affected significantly by changes in ionic strength up to 1.5 mol L−1 and in all cases, there was no more than approximately an 8% decrease in the net color signal, as shown in Figure 2d, rendering the method suitable for measurements in samples with high ionic strength, such as seawater samples. Thus, no addition of salt was chosen throughout the experiments. Ionic strength was studied to find out if real samples with high values of ionic strength, such as seawater, can be determined by our method. Ionic strength does not influence our method, so seawater or marine water samples will be determined in the future by our group.

3.1.5. Effect of the Detection Zone Size

The specific analytical devices were manufactured and presented in a simple form. A circular hydrophobic barrier is their main feature before the addition of reagents. This “circle” can be displayed in different radius values as it is a print result and can be fabricated at any size. The question, therefore, arose as to its effect on the value of the signal. Two devices of varied sizes were studied. Specifically, the largest selection concerns devices with a total diameter of a circular hydrophobic barrier of 0.7 cm and an inner diameter of 0.5 cm and 0.4 cm (before and after the baking stage of the devices, respectively). For the smaller device, the values amounted to a total diameter of a circular hydrophobic diameter of 0.6 cm and an inner diameter of 0.4 cm and 0.3 cm (before and after the baking stage of the devices respectively). A standard solution of bismuth concentration of 30 mg L−1, nitric acid solution of 0.01 mol L−1 and MTB solution of 0.5 mmol L−1 were prepared for the procedure. The samples were allowed to dry for 10 min, and then the signal was received. To measure and quantify the signal, a photograph was taken, which was then processed via the ImageJ program on the RED color channel (RGB). It turned out that there was no significant difference in the color values. Specifically, the small device (inner diameter 0.3 cm) showed a color intensity value of 15.0 ± 0.8, while the large device (internal diameter 0.4 cm) showed a color intensity value of 14.9 ± 0.5 (see Supplementary Figure S1). Therefore, there is no significantly optimal size for the detection area, provided that the amounts of reagents are evenly distributed throughout.

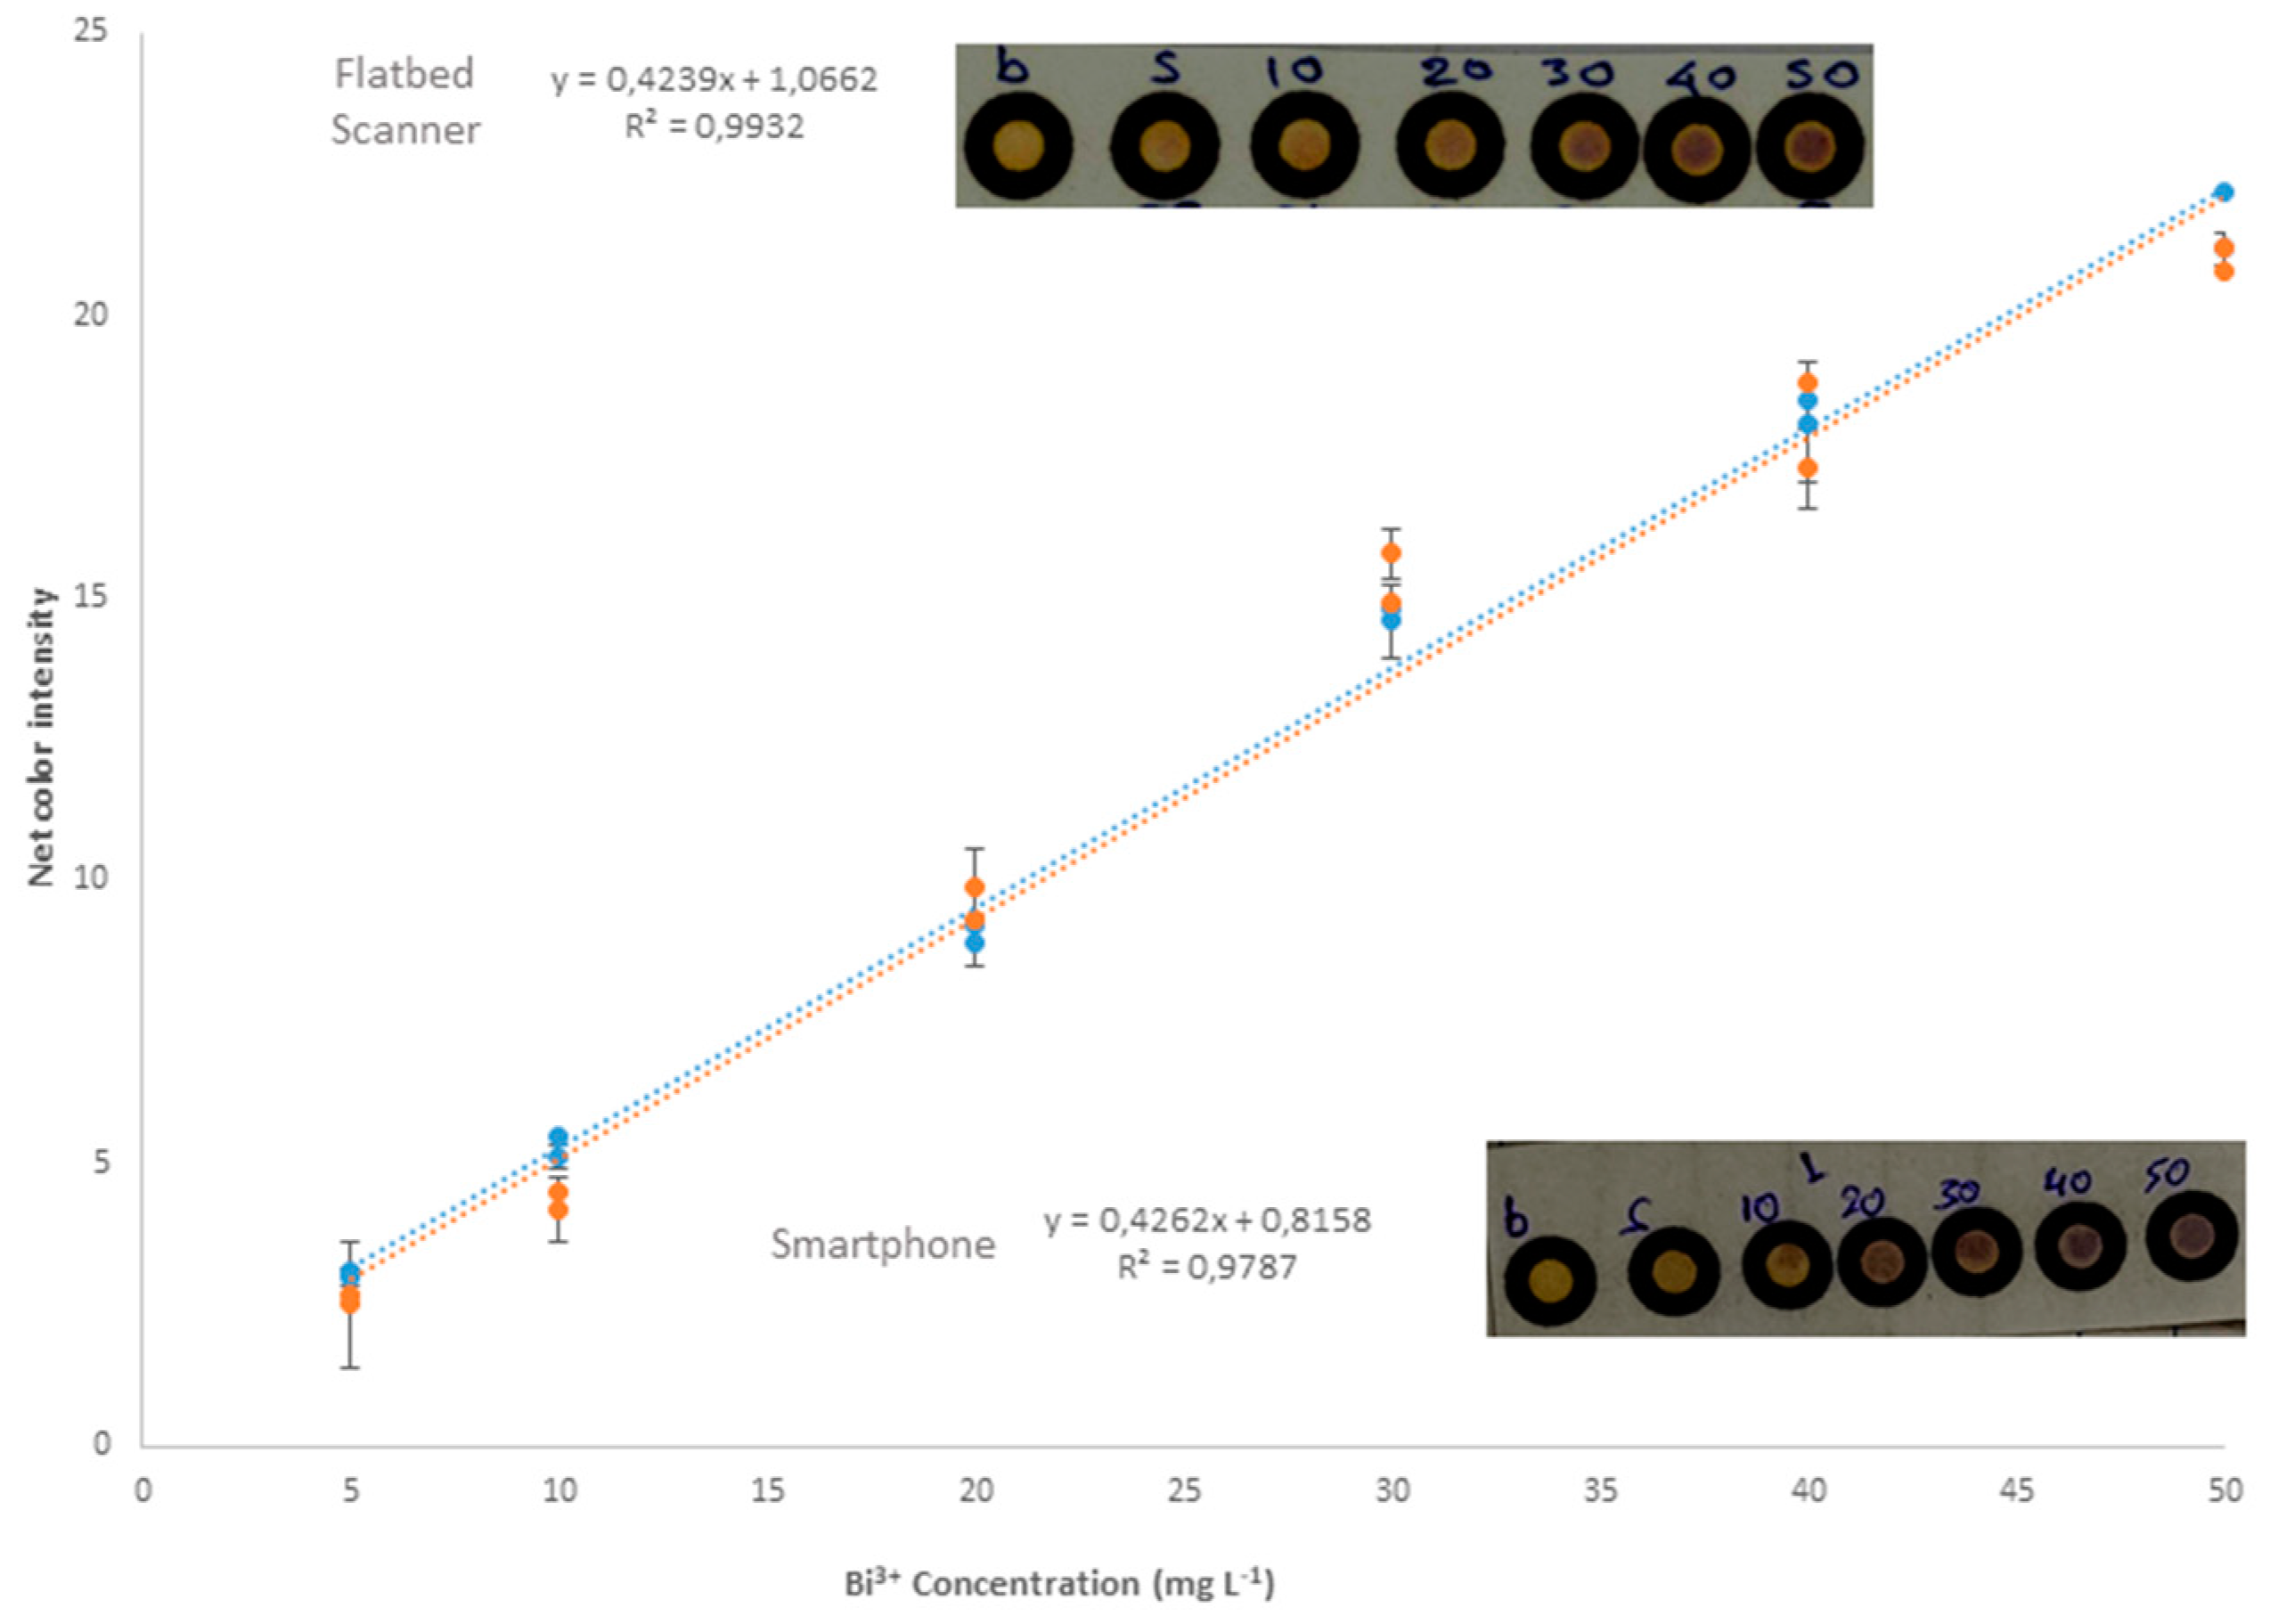
3.1.6. Effect of Photo-Capture Detector

In paper-based analytical methods, in addition to exploiting the nature of the reactions to achieve the desired signal, the way in which the specific signal is received also plays a vital role. The technology provides various systems that serve this purpose and for the proposed method, common mobile phone cameras and digital flatbed scanners were studied. Standard bismuth solutions of concentrations of 5, 10, 20, 30, 40, 50 mg L−1 were prepared for this study and calibration curves with both detectors were achieved. The comparison of the results of the two devices showed that there was no significant difference between them (Figure 3). For the overall process of development and study of the method, the use of the scanner was preferred, as it offered greater stability in the image capture conditions because it was not affected by external lighting conditions.

3.2. Analytical Parameters

The proposed method has been validated in aspects of linearity, limits of detection (LOD) and quantification (LOQ), precision, selectivity, and stability of the PADs.

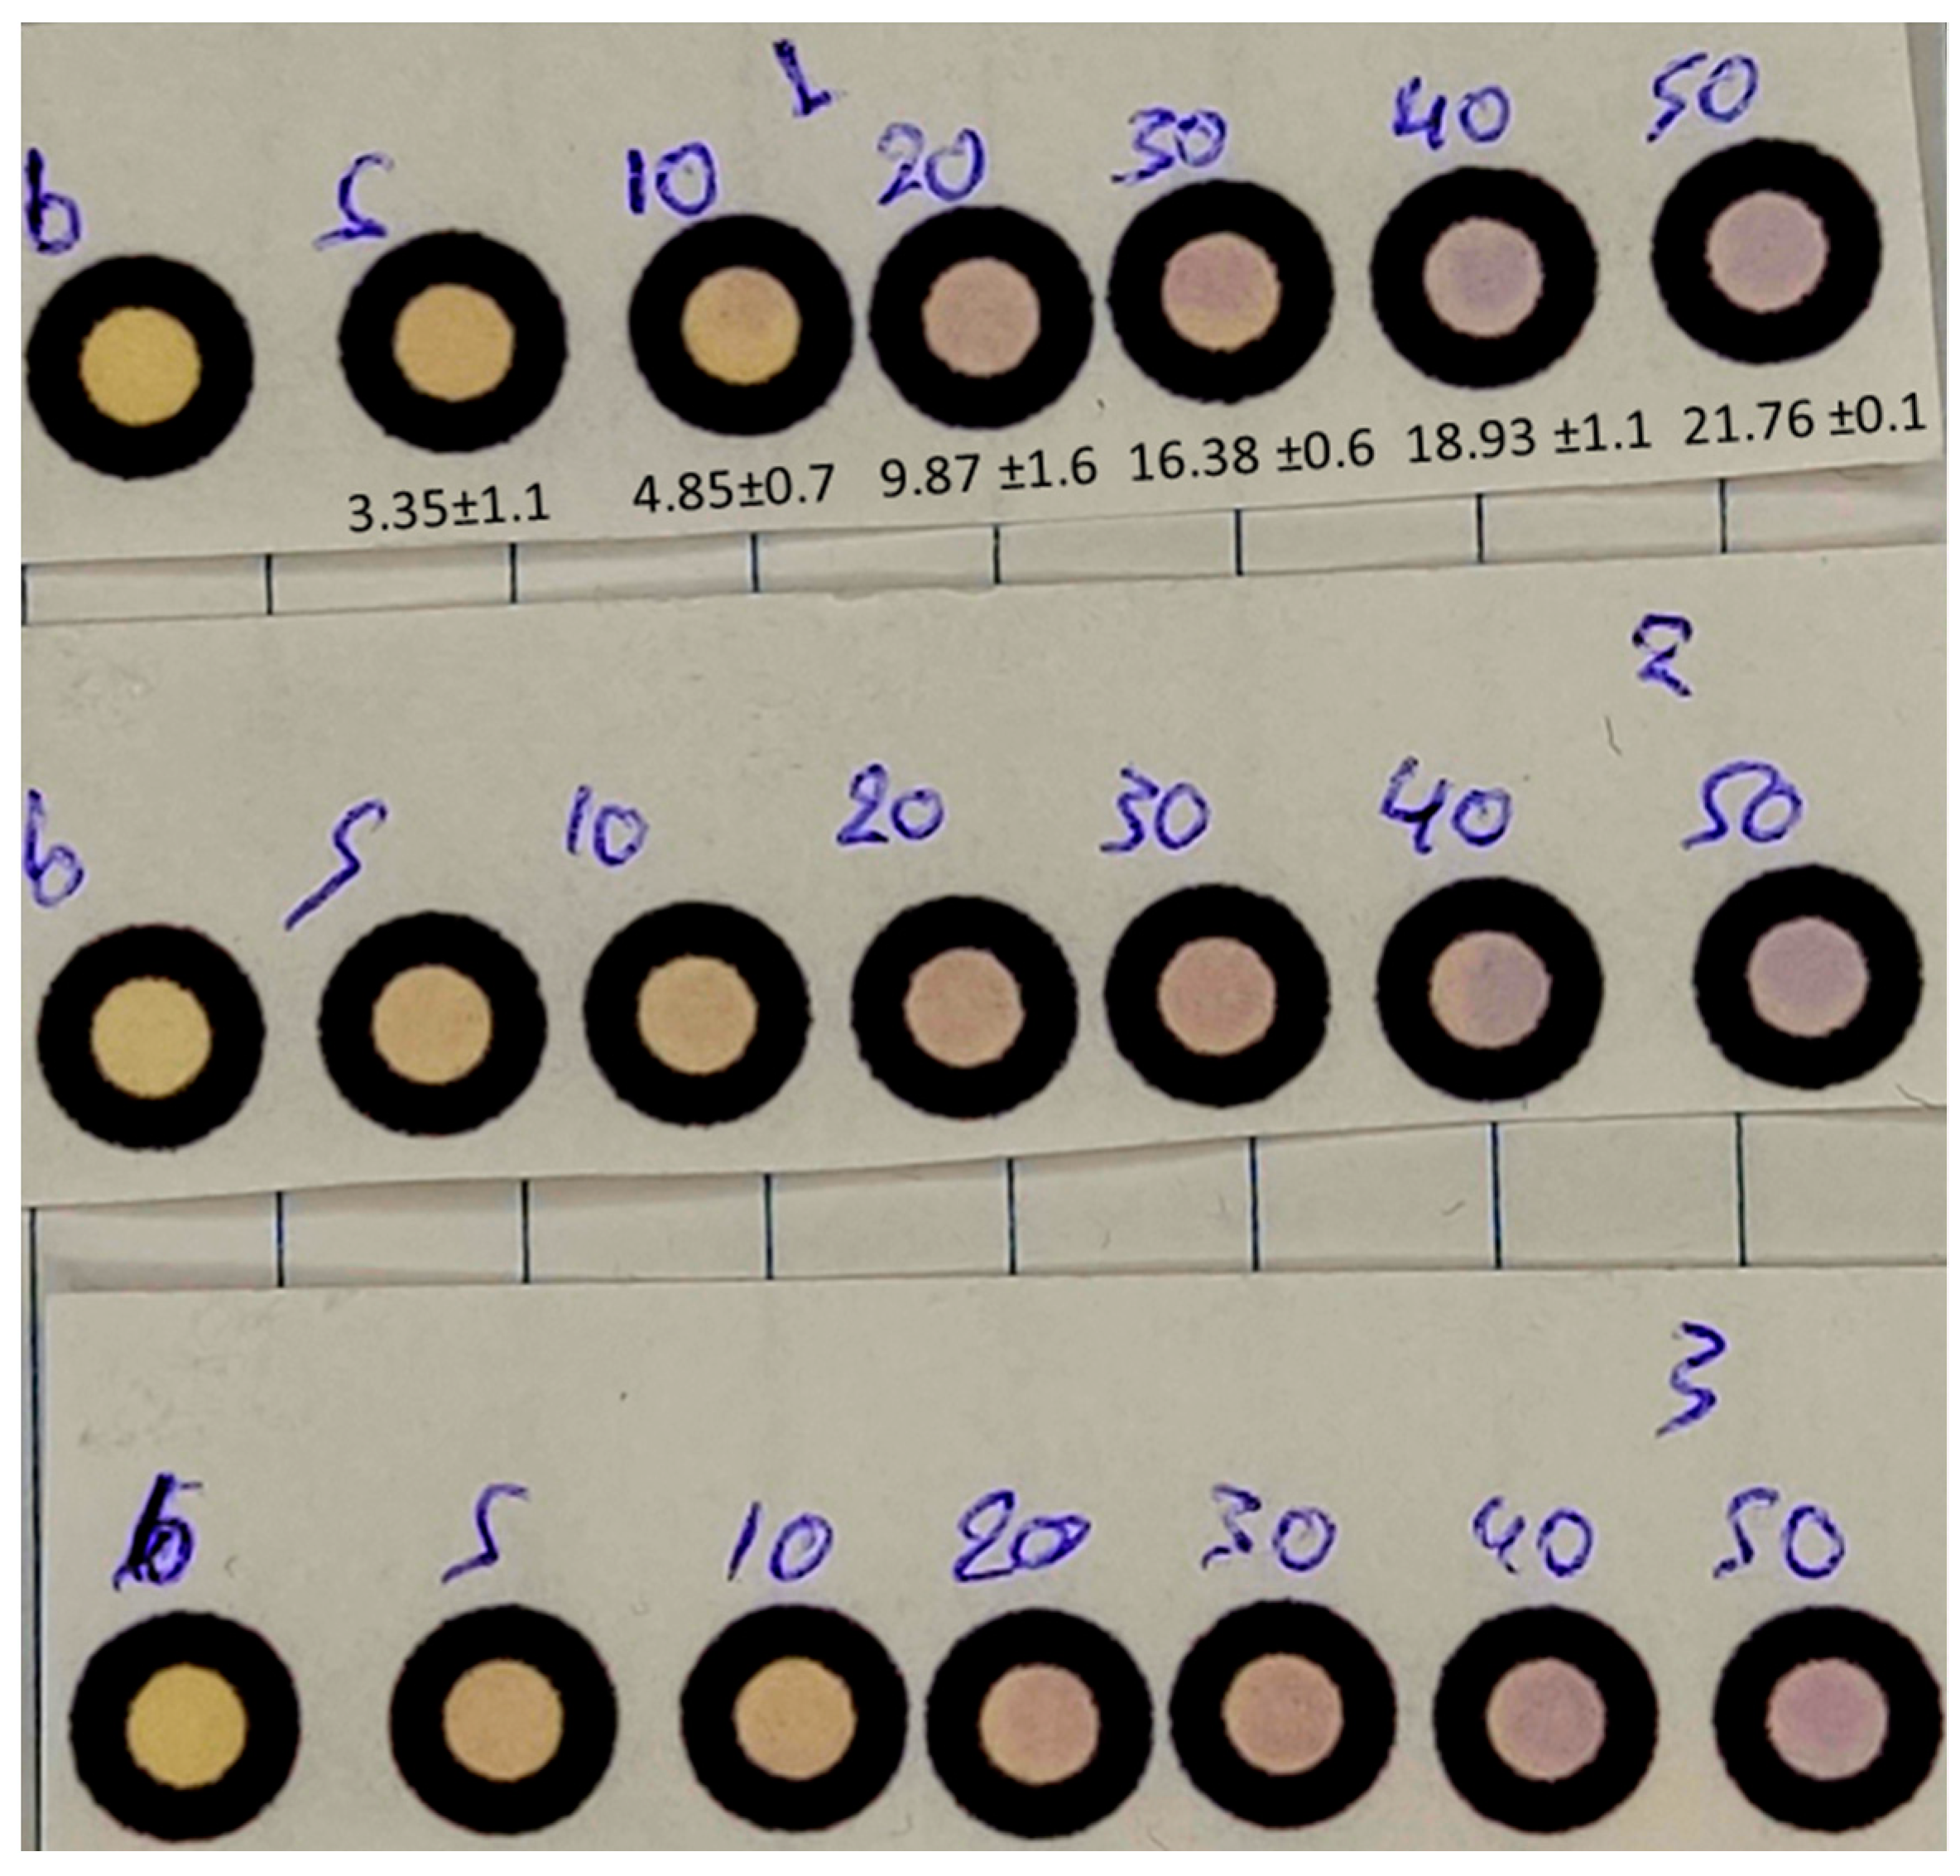
3.2.1. Linearity, Precision and Limits of Detection (LOD) and Quantification (LOQ)

The proposed method offered satisfactory linearity in the range of 5–50 mg L−1 of Bi3+, visible even to the naked eye (Figure 4). The regression equation was obtained in a “cumulative” way by incorporating the results from 30 standard solutions analyzed on different working days (n = 5). Because of this procedure, the calibration curve is more representative, including potential day-to-day variations and the following regression Equation (1) was obtained:
CI = 0.433 (±0.013) [Bi3+] + 1.34 (±0.40), r2 = 0.974
where CI is the color intensity measured by the proposed method.
The within-day precision was validated at the 30.0 mg L−1 level by repetitive measurements of different paper sensing areas (n = 5). The intra-day relative standard deviation (RSD) was 4.0% and the inter-day was 5.5%. The day-to-day precision was also evaluated by independent calibration curves obtained on different working days (n = 5), and the RSD of the regression slopes was 5.9%, verifying the repeatability of the proposed procedure.
Additionally, the LOD and LOQ were estimated based on the following Equation (2):
LOD = 3.3 × SDb/s and LOQ = 10 × SDb/s
where SDb is the standard deviation of the intercept and s is the slope of the respective regression lines. The calculated LOD/LOQ for the analysis of Bi3+ was 3.0 and 9.2 mg L−1, respectively.

3.2.2. Selectivity

The selectivity of the developed PAD was validated against representative common cations and anions that are expected to be present in the natural water samples; all potential interferents were analyzed at 500 mg L−1, whereas Bi3+ at 30 mg L−1. A parameter that is expected in natural water samples and was not measured during the selectivity study was the concentration of nitrate ions. The U.S. Environmental Protection Agency (EPA) has set the standard for nitrate in drinking water at ten milligrams of nitrate per liter of drinking water (10 mg L−1), while the European Union settled on 50 mg L−1. Nevertheless, the concentration of nitrate is impossible to affect the method because of the nitric acid concentration added on the paper’s surface to adjust the pH value of the experimental procedure. The experimental results are depicted in Figure 5 and verify the adequate selectivity of the procedure, considering the expected levels and ratios of Bi3+ in the water samples.

3.2.3. Stability of the μPADS

To evaluate the portability and the consistency of the devices at the point of need, we studied the stability of the μPADs by adding MTB and HNO3 solutions to the devices and storing them in airtight bags protected from light at room temperature (25 °C), 4 °C and −18 °C. The stability was examined at 30 mg L−1 Bi3+ after 2 days, 4 days and 6 days of storage, respectively. The paper devices were taken out of the refrigerator and the freezer, left at room temperature for more than one hour, protected from light, and then used to add the analyte. The experimental results as % recoveries of Bi3+ are included in Table 1. As can be seen, by the estimated percent recoveries, the μPADs are stable and usable even after 6 days if kept at −18 °C and protected from light.

3.3. Application in Real Water Samples

Five samples, two bottled water samples from the northern and northwestern Greece; two river samples from the region of Epirus, in northwestern Greece; tap water from the city of Thessaloniki, were measured with the developed PAD method. The water samples were stored at 4 °C in the refrigerator. The experimental solutions were added to the paper-based devices, and then we stored them at different temperature conditions. Then, the devices were defreezed at room temperature and the analyte or real sample was added to their surface. This was studied to find out the stability and portability of the devices. The samples were treated as described in the Experimental Section and the results can be seen in Table 2. The percent recoveries of the determined spiked levels of Bi3+ were satisfactory and ranged between 82.8 and 115.4%, with a good standard deviation.

4. Conclusions

A simple and reliable μPAD method for the selective determination of bismuth ions in surface water samples has been developed and validated. The μPADs were easily fabricated with minimum cost. The method was based on the color complex Bi-MTB formatted at strongly acidic conditions, and the color change was recorded by a flatbed scanner. The developed paper-based sensor uses cost-effective and readily available reagents and is attractive for real-time, at the point of need, applications. The sensor is sensitive enough for the quantification of the analyte in real samples with minimal treatment and without any significant loss of the net signal from coexisting ions. The levels of Bi3+ in the analyzed spiked samples were within acceptable recovery limits from 82.8 to 115.4% and were also confirmed by a corroborative UV-Vis method. Finally, the developed analytical methodology is robust, can analyze many samples in a brief period and permits the analysis of Bi3+ at low microgram levels (LOD 3.0 mg L−1), while it is a promising methodology for the determination of many cations that form complexes with MTB at various pH values.

Supplementary Materials

The following supporting information can be downloaded at: https://www.mdpi.com/article/10.3390/chemosensors10070265/s1, Figure S1: Paper-based devices with different size: (a) largest paper-based device with a total diameter of a circular hydrophobic barrier of 0.7 cm and an inner diameter of 0.5 cm and 0.4 cm (before and after the baking stage of the devices respectively). (b) smaller paper-based device, the values amounted to a total diameter of a circular hydrophobic diameter of 0.6 cm and an inner diameter of 0.4 cm and 0.3 cm (before and after the baking stage of the devices respectively).

Author Contributions

Conceptualization, G.Z.T. and P.D.T.; methodology, G.Z.T. and P.D.T.; investigation, P.A.B.; validation, P.A.B., M.T. and A.T.; data curation, M.T., A.T. and G.Z.T.; writing—original draft preparation, P.D.T. and G.Z.T.; writing—review and editing, P.D.T. and G.Z.T. All authors have read and agreed to the published version of the manuscript.

Funding

This research received no external funding.

Institutional Review Board Statement

Not applicable.

Informed Consent Statement

Not applicable.

Data Availability Statement

Not applicable.

Conflicts of Interest

The authors declare no conflict of interest.

References

  1. Taher, M.A.; Rahimi, M.; Fazelirada, H. A sensitive fluorescence quenching method for determination of bismuth with tiron. J. Lumin. 2014, 145, 976–980. [Google Scholar] [CrossRef]
  2. Calderilla, C.; Avivar, J.; Leal, L.O.; Cerdà, V. Multivariate optimisation of a rapid and simple automated method for bismuth determination in well water samples exploiting long path length spectrophotometry. Int. J. Environ. Anal. Chem. 2016, 96, 653–666. [Google Scholar] [CrossRef]
  3. Das, A.K.; Chakraborty, R.; Cervera, M.L.; de la Guardia, M. Analytical techniques for the determination of bismuth in solid environmental samples. Trends Anal. Chem. 2006, 25, 599–608. [Google Scholar] [CrossRef]
  4. Dobrowolski, R.; Dobrzyńska, J.; Gawrońska, B. Determination of bismuth in environmental samples by slurry sampling graphite furnace atomic absorption spectrometry using combined chemical modifiers. Environ. Monit. Assess 2015, 187, 4125–4133. [Google Scholar] [CrossRef] [Green Version]
  5. Magalhaes, C.G.; Nunes, B.R.; Oss Giacomelli, M.B.; da Silva, J.B.B. Direct determination of bismuth in urine samples by electrothermal atomic absorption spectrometry: Study of chemical modifiers. J. Anal. At. Spectrom. 2003, 18, 787–789. [Google Scholar] [CrossRef]
  6. Matusiewicz, H. Atom trapping and in situ preconcentration techniques for flame atomic absorption spectrometry. Spectrochim. Acta Part B At. Spectrosc. 1997, 52, 1711–1736. [Google Scholar] [CrossRef]
  7. Bodur, S.; Erarpat, S.; Selali Chormey, D.; Büyükpınar, C.; Bakırdere, S. Determination of bismuth in bottled and mineral water samples at trace levels by T-Shaped slotted quartz tube-atom trap-flame atomic absorption spectrometry. Anal. Lett. 2019, 52, 539–549. [Google Scholar] [CrossRef]
  8. Sun, M.; Wu, Q. Determination of trace bismuth in human serum by cloud point extraction coupled flow injection inductively coupled plasma optical emission spectrometry. J. Haz. Mat. 2011, 192, 935–939. [Google Scholar] [CrossRef]
  9. Moyano, S.; Wuilloud, R.G.; Olsina, R.A.; Gásquez, J.A.; Martinez, L.D. On-line preconcentration system for bismuth determination in urine by flow injection hydride generation inductively coupled plasma atomic emission spectrometry. Talanta 2001, 54, 211–219. [Google Scholar] [CrossRef]
  10. Yu, Y.; Zhao, Q.; Bao, H.; Mou, Q.; Shi, Z.; Chen, Y.; Gao, Y. Determination of trace bismuth in environmental waters by ICP-MS with cobalt ion-assisted photochemical vapour generation. Geostand. Geoanal. Res. 2020, 44, 617–627. [Google Scholar] [CrossRef]
  11. Okano, G.; Igarashi, S.; Ohno, O.; Yamamoto, Y.; Saito, S.; Oka, Y. Determination of trace amounts of bismuth in steel by ICP-MS through a cascade-preconcentration and separation method. ISIJ Int. 2015, 55, 332–334. [Google Scholar] [CrossRef] [Green Version]
  12. Li, Z.; Guo, Y. Simultaneous determination of trace arsenic, antimony, bismuth, and selenium in biological samples by hydride generation-four-channel atomic fluorescence spectrometry. Talanta 2005, 65, 1318–1325. [Google Scholar] [CrossRef] [PubMed]
  13. Jerónimo, P.C.A.; Araújo, A.N.; Montenegro, M.C.B.S.M.; Satinský, D.; Solich, P. Colorimetric bismuth determination in pharmaceuticals using a xylenol orange sol–gel sensor coupled to a multicommutated flow system. Anal. Chim. Acta 2004, 504, 235–241. [Google Scholar] [CrossRef]
  14. Gumus, G.; Filik, H.; Demirata, B. Determination of bismuth and zinc in pharmaceuticals by first derivative UV–Visible spectrophotometry. Anal. Chim. Acta 2005, 547, 138–143. [Google Scholar] [CrossRef]
  15. Tzanavaras, P.D.; Themelis, D.G.; Economou, A. Sequential injection method for the direct spectrophotometric determination of bismuth in pharmaceutical products. Anal. Chim. Acta 2004, 505, 167–171. [Google Scholar] [CrossRef]
  16. Themelis, D.G.; Tzanavaras, P.D.; Papadimitriou, J.K. Flow injection manifold for the direct spectrophotometric determination of bismuth in pharmaceutical products using Methylthymol Blue as a chromogenic reagent. Analyst 2001, 126, 247–250. [Google Scholar] [CrossRef]
  17. Szpunar-Łobińska, J. Extraction flow-injection spectrophotometric determination of bismuth with lead tetramethylenedithiocarbamate. Anal. Chim. Acta 1991, 251, 275–280. [Google Scholar] [CrossRef]
  18. González-Portal, A.; Bermejo-Martínez, F.; Baluja-Santos, C.; Diez-Rodríguez, M.C. Spectrophotometric study of bismuth with N-(2-acetamido)iminodiacetic acid (ADA): Determination of bismuth in pharmaceutical formulations. Microchem. J. 1985, 31, 368–374. [Google Scholar] [CrossRef]
  19. Mohammadi, S.; Khayatian, G. Colorimetric detection of Bi (III) in water and drug samples using pyridine-2,6-dicarboxylic acid modified silver nanoparticles. Spectrochim. Acta A Mol. Biomol. Spectrosc. 2015, 148, 405–411. [Google Scholar] [CrossRef]
  20. Mohammed, S.A.; Mohammed, M.M. Spectrophotometric determination of bismuth with alizarin red S and cetylpyridinium chloride—Application to water samples, urine and veterinary preparation. Raf. J. Sci. 2013, 24, 52–63. [Google Scholar] [CrossRef]
  21. El-Shahawi, M.S.; Aldhaheri, S.M. Spectrophotometric determination of bismuth (III and V) in water after ion-pair liquid–liquid extraction using tetramethylammonium cation as counter ion. Fresenius J. Anal. Chem. 1996, 354, 200–203. [Google Scholar] [CrossRef]
  22. Rasouli, Z.; Irani, M.; Jafari, S.; Ghavami, R. Study of interaction of metal ions with methylthymol blue by chemometrics and quantum chemical calculations. Sci. Rep. 2021, 11, 6465–6483. [Google Scholar] [CrossRef] [PubMed]
  23. Rasouli, Z.; Hassanzadeh, Z.; Ghavami, R. Application of a new version of GA-RBF neural network for simultaneous spectrophotometric determination of Zn(II), Fe(II), Co(II) and Cu(II) in real samples: An exploratory study of their complexation abilities toward MTB. Talanta 2016, 160, 86–98. [Google Scholar] [CrossRef]
  24. Pourreza, N.; Zavvar Mousavi, H. Solid phase preconcentration of iron as methylthymol blue complex on naphthalene-tetraoctylammonium bromide adsorbent with subsequent flame atomic absorption determination. Talanta 2004, 64, 264–267. [Google Scholar] [CrossRef] [PubMed]
  25. Bremer, C.; Ruf, H.; Grell, E. Kinetics and mechanism of complex formation between Mg2+ and methylthymol blue. J. Phys. Chem. A 1998, 102, 146–152. [Google Scholar] [CrossRef]
  26. Themelis, D.G.; Tzanavaras, P.D.; Anthemidis, A.N.; Stratis, J.A. Direct, selective flow injection spectrophotometric determination of calcium in wines using methylthymol blue and an on-line cascade dilution system. Anal. Chim. Acta 1999, 402, 259–266. [Google Scholar] [CrossRef]
  27. Sandell, E.B. Colorimetric Determination of Traces of Metals, 3rd ed.; Interscience Publishers: New York, NY, USA, 1959; Volume III, pp. 157–168. [Google Scholar]
  28. Sadaaki, M.; Takashi, Y. Equilibria of aluminium (III) complexes with methylthymol blue. Polyhedron 1982, 1, 405–408. [Google Scholar] [CrossRef]
  29. Cheng, K. Determination of zirconium and hafnium with xylenol orange and methylthymol blue. Anal. Chim. Acta 1963, 28, 41–53. [Google Scholar] [CrossRef]
  30. Karadakov, B.; Kantcheva, D.; Nenova, P. Spectrophotometric study of the reaction of iron(iii) with methylthymol blue. Talanta 1968, 15, 525–534. [Google Scholar] [CrossRef]
  31. Kiss, T.A.; Knežević, O.I. Complexometric determination of magnesium in magnesium stearate. Microchem. J. 1968, 13, 459–462. [Google Scholar] [CrossRef]
  32. Ozer, T.; McMahon, C.; Henry, C.S. Advances in paper-based analytical devices. Annu. Rev. Anal. Chem. 2020, 13, 85–109. [Google Scholar] [CrossRef] [PubMed] [Green Version]
  33. Martinez, A.W.; Phillips, S.T.; Butte, M.J.; Whitesides, G.M. Patterned paper as a platform for inexpensive, low-volume, portable bioassays. Angew. Chem. Int. Ed. 2007, 46, 1318–1320. [Google Scholar] [CrossRef] [PubMed] [Green Version]
  34. Rattanarat, P.; Dungchai, W.; Cate, D.; Volckens, J.; Chailapakul, O.; Henry, C.S. Multilayer paper-based device for colorimetric and electrochemical quantification of metals. Anal. Chem. 2014, 86, 3555–3562. [Google Scholar] [CrossRef] [PubMed]
  35. Kappi, F.A.; Tsogas, G.Z.; Routsi, A.M.; Christodouleas, D.C.; Giokas, D.L. Paper-based devices for biothiols sensing using the photochemical reduction of silver halides. Anal. Chim. Acta 2018, 1036, 89–96. [Google Scholar] [CrossRef]
  36. Katelakha, K.; Nopponpunth, V.; Boonlue, W.; Laiwattanapaisal, W. A simple distance paper-based analytical device for the screening of lead in food matrices. Biosensors 2021, 11, 90. [Google Scholar] [CrossRef]
  37. Yan, Y.; Zhao, D.; Li, W.; Li, X.; Chang, Y.; Zhang, Q.; Liu, M. An origami paper-based analytical device for rapid and sensitive analysis of acrylamide in foods. Micromachines 2022, 13, 13. [Google Scholar] [CrossRef]
  38. Lim, H.; Jafry, A.T.; Lee, J. Fabrication, flow control, and applications of microfluidic paper-based analytical devices. Molecules 2019, 24, 2869. [Google Scholar] [CrossRef] [Green Version]
  39. Tarara, M.; Giokas, D.L.; Tsogas, G.Z. Wax-Printed fluidic controls for delaying and accelerating fluid transport on paper-based analytical devices. Chemosensors 2022, 10, 155. [Google Scholar] [CrossRef]
  40. Kappi, F.A.; Papadopoulos, G.A.; Tsogas, G.Z.; Giokas, D.L. Low-cost colorimetric assay of biothiols based on the photochemical reduction of silver halides and consumer electronic imaging devices. Talanta 2017, 172, 15–22. [Google Scholar] [CrossRef]
  41. Tsagkaris, A.S.; Migliorelli, D.; Uttl, L.; Filippini, D.; Pulkrabova, J.; Hajslova, J. A microfluidic paper-based analytical device (μPAD) with smartphone readout for chlorpyrifos-oxon screening in human serum. Talanta 2021, 222, 121535. [Google Scholar] [CrossRef]
  42. Manori Jayawardane, B.; Wongwilai, W.; Grudpan, K.; Kolev, S.D.; Heaven, M.W.; Nash, D.M.; McKelvie, I.D. Evaluation and application of a paper-based device for the determination of reactive phosphate in soil solution. J. Environ. Qual. 2014, 43, 1081–1085. [Google Scholar] [CrossRef] [PubMed] [Green Version]
Figure 1. Experimental procedure of the proposed method.
Chemosensors 10 00265 g001
Figure 2. Optimization of (a) reaction time (Bi3+ 30 mg L−1, nitric acid concentration 0.01 mol L−1, MTB concentration 0.5 mM, no addition of NaNO3), (b) HNO3 concentration (reaction time 10 min, Bi3+ 30 mg L−1, MTB concentration 0.5 mM, no addition of NaNO3), (c) MTB concentration (reaction time 10 min, Bi3+ 30 mg L−1, nitric acid concentration 0.01 mol L−1, no addition of NaNO3) and (d) NaNO3 concentration (Bi3+ 30 mg L−1, nitric acid concentration 0.01 mol L−1, MTB concentration 0.5 mM), Error bars are the standard deviation for n = 3.
Chemosensors 10 00265 g002
Figure 3. Effect of photograph receiving device. The values at the flatbed scanner are represented by the blue dots, while the values at the smartphone camera are represented by the orange dots. Error bars are the standard deviation for n = 3.
Chemosensors 10 00265 g003
Figure 4. Display of the color change at the calibration curves of the proposed method (5–50 mg L−1).
Chemosensors 10 00265 g004
Figure 5. Selectivity of the Bi3+-MTB reaction under the optimum experimental conditions (reaction time 10 min, Bi3+ concentration 30 mg L−1, HNO3 concentration 0.01 mol L−1, MTB concentration 0.5 mmol L−1, no addition of NaNO3, interferant concentration 500 mg L−1). Error bars are the standard deviation for n = 3.
Chemosensors 10 00265 g005
Table 1. Stability of the μ-PADS (HNO3 + MTB) under different storage conditions.
Time (Days)
246
Temperature (°C) % Recovery
2598.592.886.2
4101.998.594.4
−18101.397.695.5
Table 2. Accuracy of the proposed paper-based method for the analysis of Bi3+ in water samples.
SamplesSpiked (mg L−1)% Recovery (± RSD, n = 3)
River water 110105.9 ± 3.2
3089.5 ± 3.7
River water 21083.7 ± 5.1
3090.5 ± 3.6
Bottled water 11089.9 ± 5.6
3087.2 ± 5.9
Bottled water 210111.4 ± 9.8
3082.8 ± 2.7
Tap water10115.4 ± 6.9
3083.7 ± 2.1
Publisher’s Note: MDPI stays neutral with regard to jurisdictional claims in published maps and institutional affiliations.

