Article

Scanning Electron Microscopy and Raman Spectroscopy Characterization of Structural Changes Induced by Thermal Treatment in Innovative Bio-Based Polyamide Nanocomposites

by
Ioana Andreea Brezeștean
1,2,
Daniel Marconi
1,
Alia Colniță
1,
Alexandra Ciorîță
1,
Septimiu Cassian Tripon
1,
Zina Vuluga
3,
Mihai Cosmin Corobea
3,
Nicoleta Elena Dina
1,* and
Ioan Turcu
1
1
Department of Molecular and Biomolecular Physics, National Institute for Research and Development of Isotopic and Molecular Technologies, 67-103 Donath, 400296 Cluj-Napoca, Romania
2
Department of Biomolecular Physics, Faculty of Physics, Babeș-Bolyai University, Kogălniceanu 1, 400084 Cluj-Napoca, Romania
3
Department of Polymers, National Institute for Research and Development in Chemistry and Petrochemistry-ICECHIM, 202 Spl. Independenței, 060021 Bucharest, Romania
*
Author to whom correspondence should be addressed.
Chemosensors 2023, 11(1), 28; https://doi.org/10.3390/chemosensors11010028
Submission received: 24 November 2022 / Revised: 23 December 2022 / Accepted: 26 December 2022 / Published: 28 December 2022

Abstract

:
A comprehensive Raman scattering-based characterization of a full bio-based polyamide loaded with graphene nanoplatelets or layered double hydroxides (LDH) was assessed. The potential of the Raman spectroscopy was used to reveal several particularities of the nanocomposite structures induced by thermal treatment. Thus, a complete morpho-structural picture was obtained in combination with scanning electron microscopy (SEM) analysis of the neat polyamide and polyamide nanocomposites exposed at different thermal conditions (room temperature, 80 °C, and 145 °C). The analysis of G, D and 2D Raman peaks and their relative intensity ratio ID/IG, revealed the fact that the presence of graphene in polyamide is suitable for improving the essential physical properties and is also responsible for the decrease in the defects’ occurrence in the graphene layers. The surface of nanocomposites based on full bio-based polyamide, with different 2D fillers (graphenic and non-graphenic structures), was carefully evaluated before and after the thermal treatment by employing SEM and Raman analyses. The two thermal treatments allowed different chain mobility of the polymer (first temperature being over the polymer Tg and second one close to the melting phase in the viscoelastic stage). The spectroscopic and microscopic investigation was used to determine the conformational changes in filler aggregates and polymer surface, respectively.

Graphical Abstract

1. Introduction

Polyamides (PAs) have been extensively studied for many years and have developed into a significant class of engineering polymers [1]. They are widely used in the automotive, electrical, textile, consumer goods, and medical industries as well as in the manufacturing of consumer goods and machine parts [2,3,4]. They have outstanding mechanical qualities even at high temperatures [5], good chemical resistance, low gas permeability, good flow, increased strength, and impact resistance. As one of the most important synthetic polymers for high-performance industrial thermoplastics, PAs are produced in enormous quantities.
From this angle, macromolecular chemistry and industry both gain a great deal from the synthesis of polyamides from renewable resources [6]. Eco-friendly materials are crucial because they reduce environmental harm caused by their use. Due to their sustainability and capacity to contribute unique structural features to the resulting polymers and their qualities, such as side groups, functionalities, or stereo information, bio-based PAs made from renewable resources have particularly raised interest [7]. Bio-based PAs are safe for human health, readily disposed of, and energy efficient [8,9]. These environmentally friendly materials can be made using traditional manufacturing methods, bio-based chemical substitutes, recycled materials, or monomers prepared entirely from bio-based sources [10].
To further enhance the mechanical properties of the bio-based PAs, graphenic and non-graphenic derivatives fillers used at low filler fractions are preferred [11,12]. Graphene, the elementary structure of graphite, is an atomically thick sheet composed of sp2 carbon atoms, and became one of the most potential nanofillers because of its capability to improve thermal, electrical, and mechanical properties of the other materials [13,14,15,16]. Applications of the polyamide–graphene nanocomposites are diverse, especially in the industrial fields of electronic textiles [17], non-flammable materials, coatings, packaging, or even membrane technology [18]. There are different types of synthesized nanocomposites containing both PA (namely: PA46, PA6, PA66, PA612, PA11, PA12, or PA1212) and graphene, as basic components [19]. In situ polymerization was used to create PA6 nanocomposites including graphene oxide (GO), and as a result, the PA6’s thermal conductivity was noticeably increased [20]. Using the same preparation method, bio-based PA11–graphene nanocomposites, with different graphene concentrations (0.25, 0.5, 0.75, 1.5, and 3 wt %) were also obtained and it was found that a graphene concentration of 0.75 wt % offered the best performances in terms of mechanical properties [21]. Another study [22] demonstrated that polyamide 6 (PA6)/reduced graphene oxide (RGO) nanocomposites are electrically conductive.
Among the non-graphenic fillers used in the bio-based PA nanocomposites, layered double hydroxide (LDH), also known as hydrotalcite-like compounds or anionic clays, has attracted great interest due to its highly flexible physical and chemical properties [23,24]. A number of properties, including increased modulus and impact strength, higher heat distortion temperature, better dimensional stability, decreased flammability, and improved barrier properties, have been shown to dramatically improve when very low layered filler concentrations are dispersed to create nanocomposites [25,26]. The mechanical, structural, and morphological properties of these types of nanocomposites can be assessed through various methods, such as X-ray diffraction (XRD), atomic force microscopy (AFM), scanning electron microscopy (SEM) [17], differential scanning calorimetry (DSC) [20], X-ray photoelectron spectroscopy (XPS), and thermogravimetric analysis (TGA) [22], rheological measurements [27], and Raman spectroscopy [28,29]. Raman spectroscopy is one of the most useful, nondestructive characterization methods for locating bands connected to the vibrational modes of functional groups in both polymer chains and filler particles [30]. Additionally, the analysis of vibrational spectra can shed light on the interactions between organic and inorganic phases, the intercalation and exfoliation states of layered silicate-containing polymer nanocomposites, the dispersion and functionalization of fillers, and the degree of orientation of both the polymer chains and the reinforcing anisometric particles [31]. For example, in PA–graphenic nanocomposites, the Raman analysis will offer valuable information regarding the G band (around 1580 cm−1), typical for graphite crystal and the second Raman band (around 1333 cm−1) for graphite [17,32].
PA1010 exhibits excellent grade of rigidity (mainly after reinforced with glass fiber or graphene materials), process ability, thermal stability, and permeability to petrol and gas [33]. Multi-layered PA1010 materials can be used in industrial applications such as automotive (resists aging in high-heat engine parts), cables jacketing, optical fibers, and injection moulded parts for electronic applications and manufacturing pipes [10].
A recent and ongoing research direction with preeminent solutions based on the quantitative tools for investigating defective materials promises a wide range of applications, such as, photo-/electro-/thermal catalysis, energy storage, and battery development [34]. Although recent advancements are compelling, the related research is still the prerequisite for further comprehending the doping effect on the industrial performance of thermoplastic materials. On the other hand, carbon-based materials, such as graphene or carbon heterogeneous nanosheets are currently proposed as low cost, environmentally friendly co-catalysts, and promoters of green production of hydrogen [35].
Considering that the bio-based polymeric nanocomposites represent a relatively new research field, the possibility of using the Raman technique in combination with SEM to monitor their structural and morphological properties was evaluated. Thus, we focused our study on investigating the bio-based polyamide structural modifications induced by the bi-dimensional nanofillers, which are polar (LDH) and non-polar (graphenic) and by the thermal treatment specific to automotive industrial requirements.
In this work, we present a complete Raman and SEM analyses of full bio-based polyamide (bio–PA1010) filled with one type of graphenic material (C500) and with a non-graphenic material, LDH, before and after the thermal treatment at 80 °C and 145 °C. To investigate the dispersion rate of the polar and non-polar nanoparticles in the bio-PA1010 polymeric matrix, the SEM analysis was employed, while the structural phenomena leading to changes in the polymeric matrix were studied using Raman spectroscopy. The thermal protocol for the samples obtained by injection moulding was adapted in order to investigate the influence of the molecular chain mobility of the nanocomposites and their interaction with the fillers, which can generate specific Raman fingerprint and distinct SEM topography of the surfaces after the thermal treatment. The temperatures were relevant not only in a hypothetical material use environment (material reliance on a temperature domain), but also in highlighting the different molecular dynamics involved in the material: (1) room temperature (before the polymer matrix glass transition), (2) treatment at 80 °C (after polymer matrix glass transition), and (3) treatment at 145 °C (before polymer matrix melting). The dispersion degree of the polar and non-polar nanoparticles in the bio-PA1010 polymeric matrix was found to be influenced by the molecular interaction of the macromolecular chains and the different surface of the 2D filler.
Specifically, LDH material was previously evaluated in terms of its catalytic performance in specific reactions [36] or for co-precipitating the LDH phase in the presence of GO [37]. However, its behaviour in certain thermic conditions was not assessed, moreover in combination with a bio-PA1010. This morpho-structural approach allows us to gather new insight on the enhancement of the mechanical properties of bio-PA1010 filled with graphenic material (C500) and with a non-graphenic material (LDH), as promising dopant candidates for making the bio-based polyamide more suitable in industrial applications.

2. Materials and Methods

2.1. Materials

Bio-PA1010, VESTAMID® Terra DS18 (bio-PA1010), a natural color semi-crystalline polymer, with viscosity number according to ISO 307of 180 cm3/g, was kindly offered by Evonik Resources Efficiency GmbH. Graphene nanoplatelets (GNP), namely C500 with 500 m2/g surface area, was purchased from XG Sciences, Lansing, MI, used as received 4 wt % with respect to bio-PA1010. Layered double hydroxide (LDH), magnesium aluminum hydroxycarbonate (HT), and Mg6Al2(CO3)(OH)16·4H2O were purchased from Sigma-Aldrich (Darmstadt, Germany).

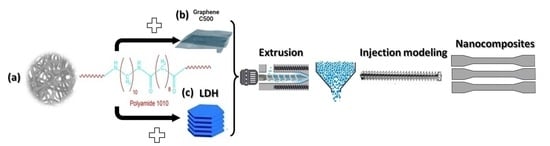
2.2. Preparation of Nanocomposites and Samples

Before use, bio-PA1010, LDH and C500 were dried for 6 h at 80 °C and 2 h under vacuum at 80 °C, respectively. Bio-PA1010 nanocomposites with 5 wt % of LDH and 4 wt % of C500 were obtained in dynamical conditions by the melt processing method. A co-rotating twin-screw extruder type DSE 20 Brabender (Brabender GmbH & Co KG, Duisburg, Germany) was used. Extrusion was performed at a main screw speed of 100 rpm and the following temperatures per zone (from feed to nozzle): 210, 215, 220, 225, 230, and 200 °C, respectively. The obtained extruded filaments were placed on a conveyor belt and cooled with air, after which they were granulated with a granulator mounted in flow with the extruder. Nanocomposite granules with 5 wt % LDH and 4 wt % C500 were obtained, respectively. Neat Bio-PA1010 was granulated under the same conditions as the nanocomposites and served as reference samples.
The obtained granules were dried for 6 h at 80 °C. Then, standard specimens for the tensile test were injected with the help of the Engel ES 40/22 injection machine, at 220–240 °C and the mould temperature of 80 °C. The injected specimens were used for spectroscopic and microscopic investigations.

2.3. Thermal Treatment

In order to investigate the structural changes [38] involved by the polymer glass transition and storage modulus fall before melting, two main peak temperature were chosen. The first one at 80 °C over the Tg (for bio-PA1010), and second one 145 °C before bio-PA1010 melting (were the modulus decrease arrives to a pseudo plateau region before the melting event shown by dynamic mechanical analysis [38]. At 145 °C, the molecular process accompanies dehydration [38]; the samples (injected and granules) were thermal treated at 80 °C and 145 °C. The increased rate of the temperature was 1 °C/min and the samples were maintained at high temperatures for a period of 12 h. All the samples were further analyzed before and after the thermal treatment. The thermogravimetric analysis data of the full bio-based PA1010 are included in the Supplementary Material, showing a very good thermal stability of the nanocomposites.

2.4. Scanning Electron Microscopy

The topographical examination of the bio-PA1010s and nanocomposites was performed using scanning electron microscope (SEM) Hitachi SU 8230 Cold Field Emission, coupled with EDS analysis (Oxford Instruments, AZtec Software, version 3.3, Oxford, UK) used for elemental detection, operating at an acceleration voltage of 15 kV. Millimeter-sized block samples (between 5 to 10 mm in diameter) were examined first by EDS and the morphology was examined after the samples were coated with a 9 nm layer of gold.

2.5. Raman Spectroscopy

The Raman spectra were recorded with a Confocal Renishaw InVia Reflex Raman microscope, with 20× objective, numerical aperture (NA) of 0.35 and a working distance (WD) of 20 mm. Two laser lines, 532-nm line (output power 200 mW) from a Cobalt diode and a 785-nm line (output power 300 mW) from a Renishaw high-power near-infrared (NIR) diode were used. The number of accumulations was progressively increased from 5 s (for samples at room temperature) to 10 s (for the samples treated at 80 °C) and 15 s, respectively (in case of the samples treated at 145 °C). The laser power on the sample was varied from 0.1% for the thermal treatment sample to 10% for the untreated sample measurements using the WIRE 3.4 dedicated software.

3. Results and Discussion

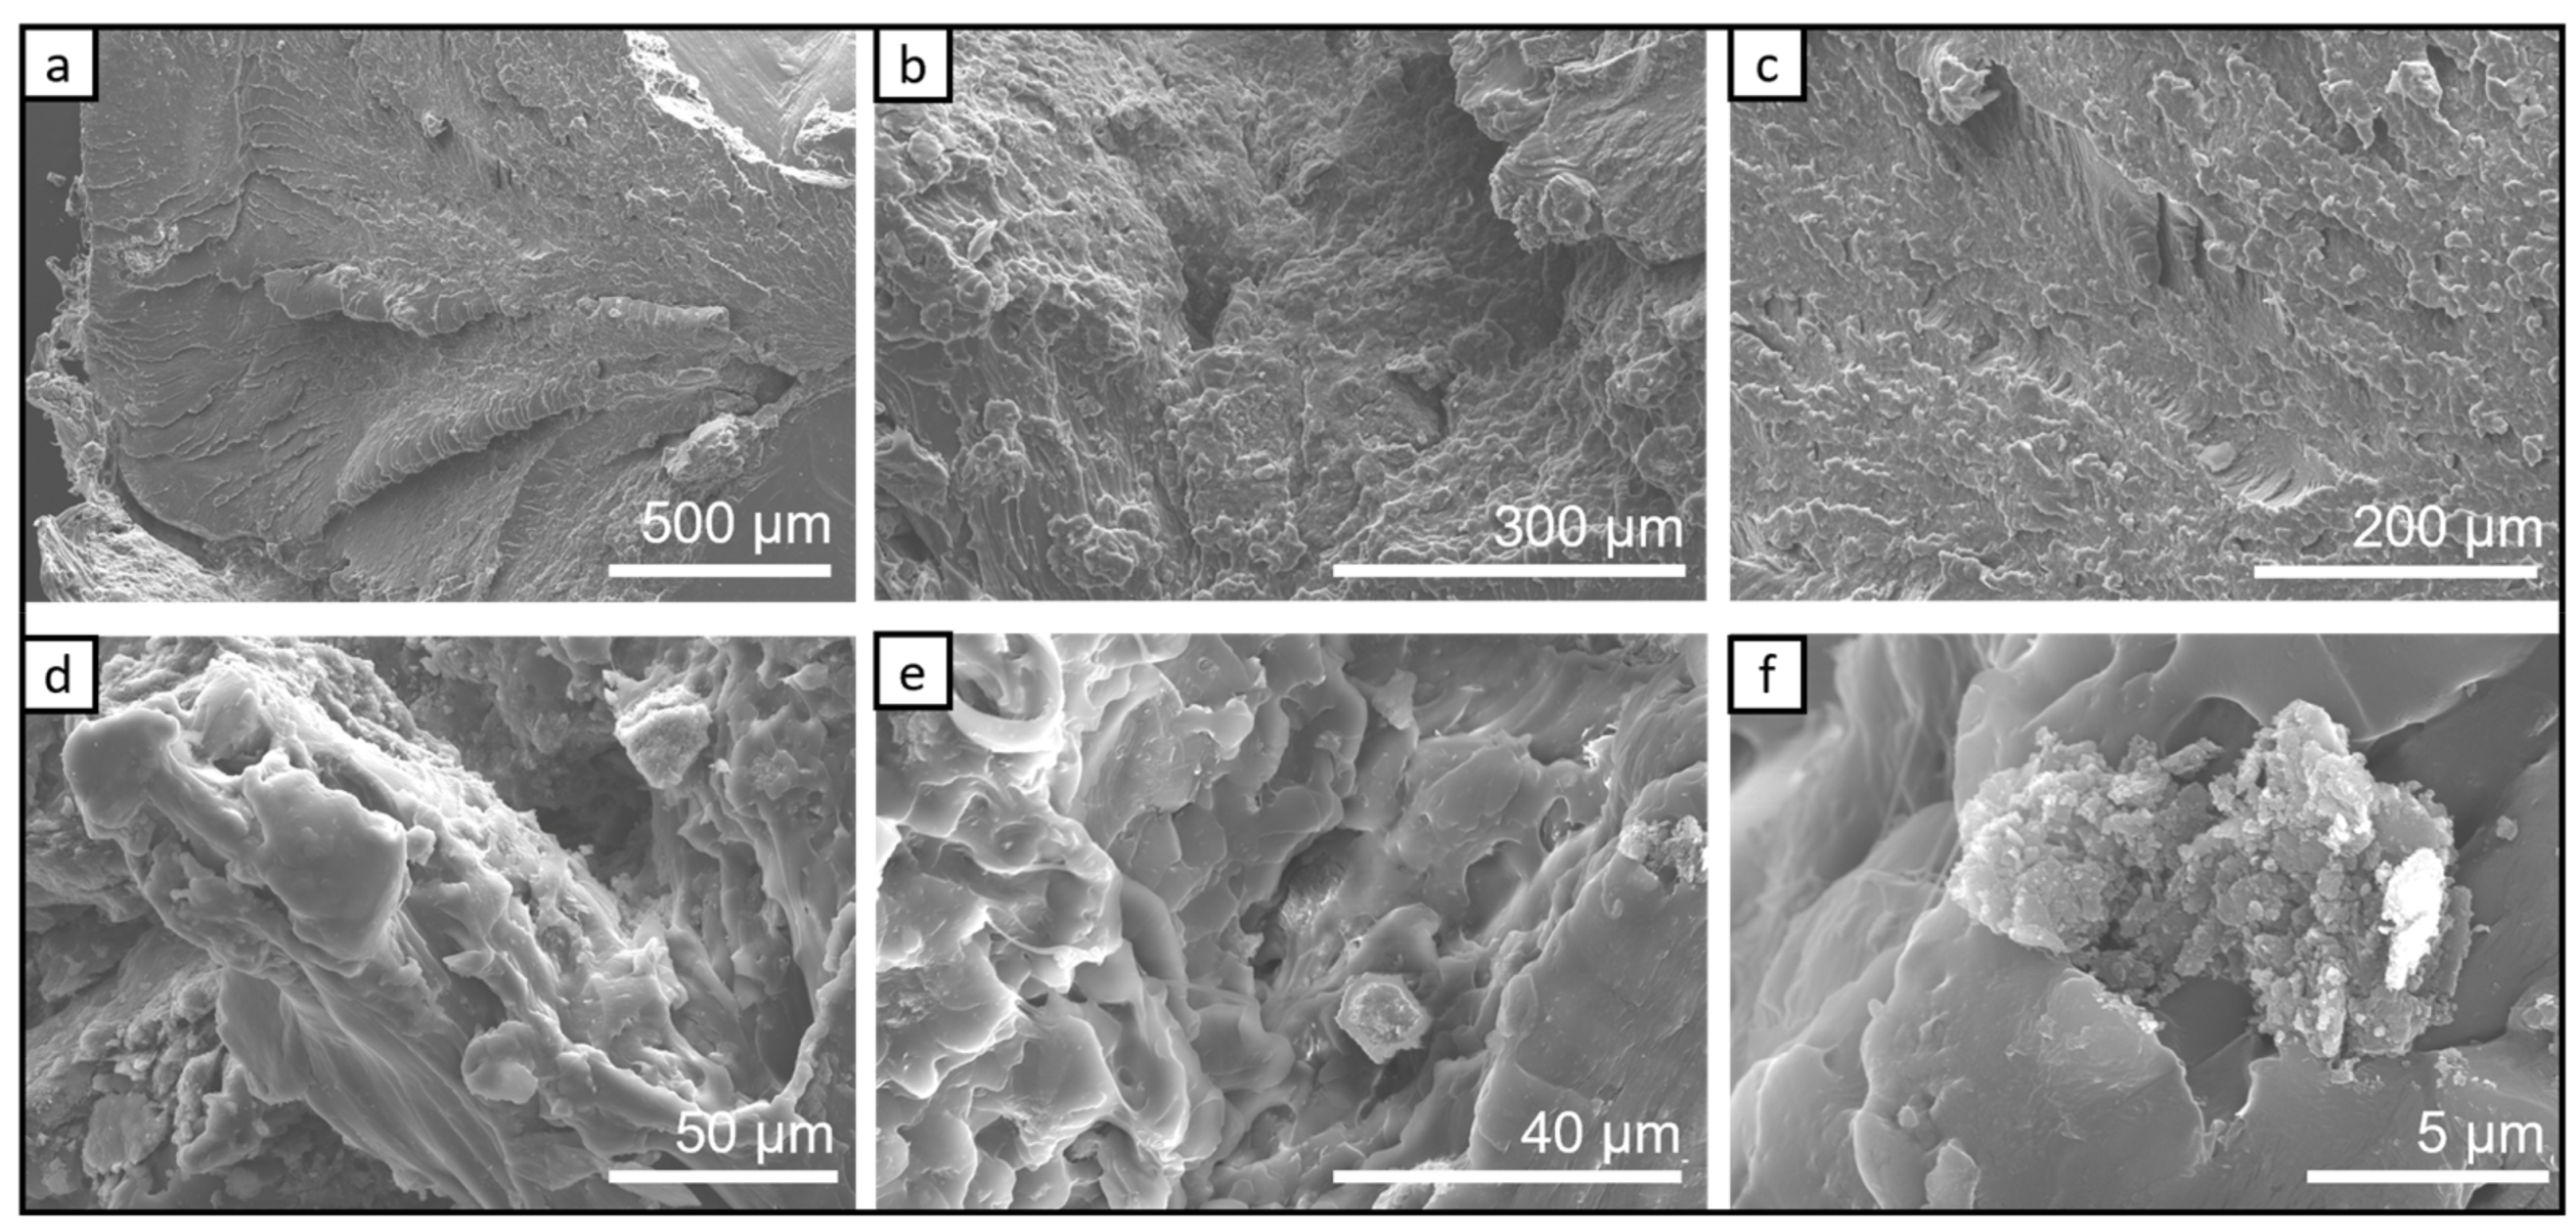
3.1. SEM Characterization

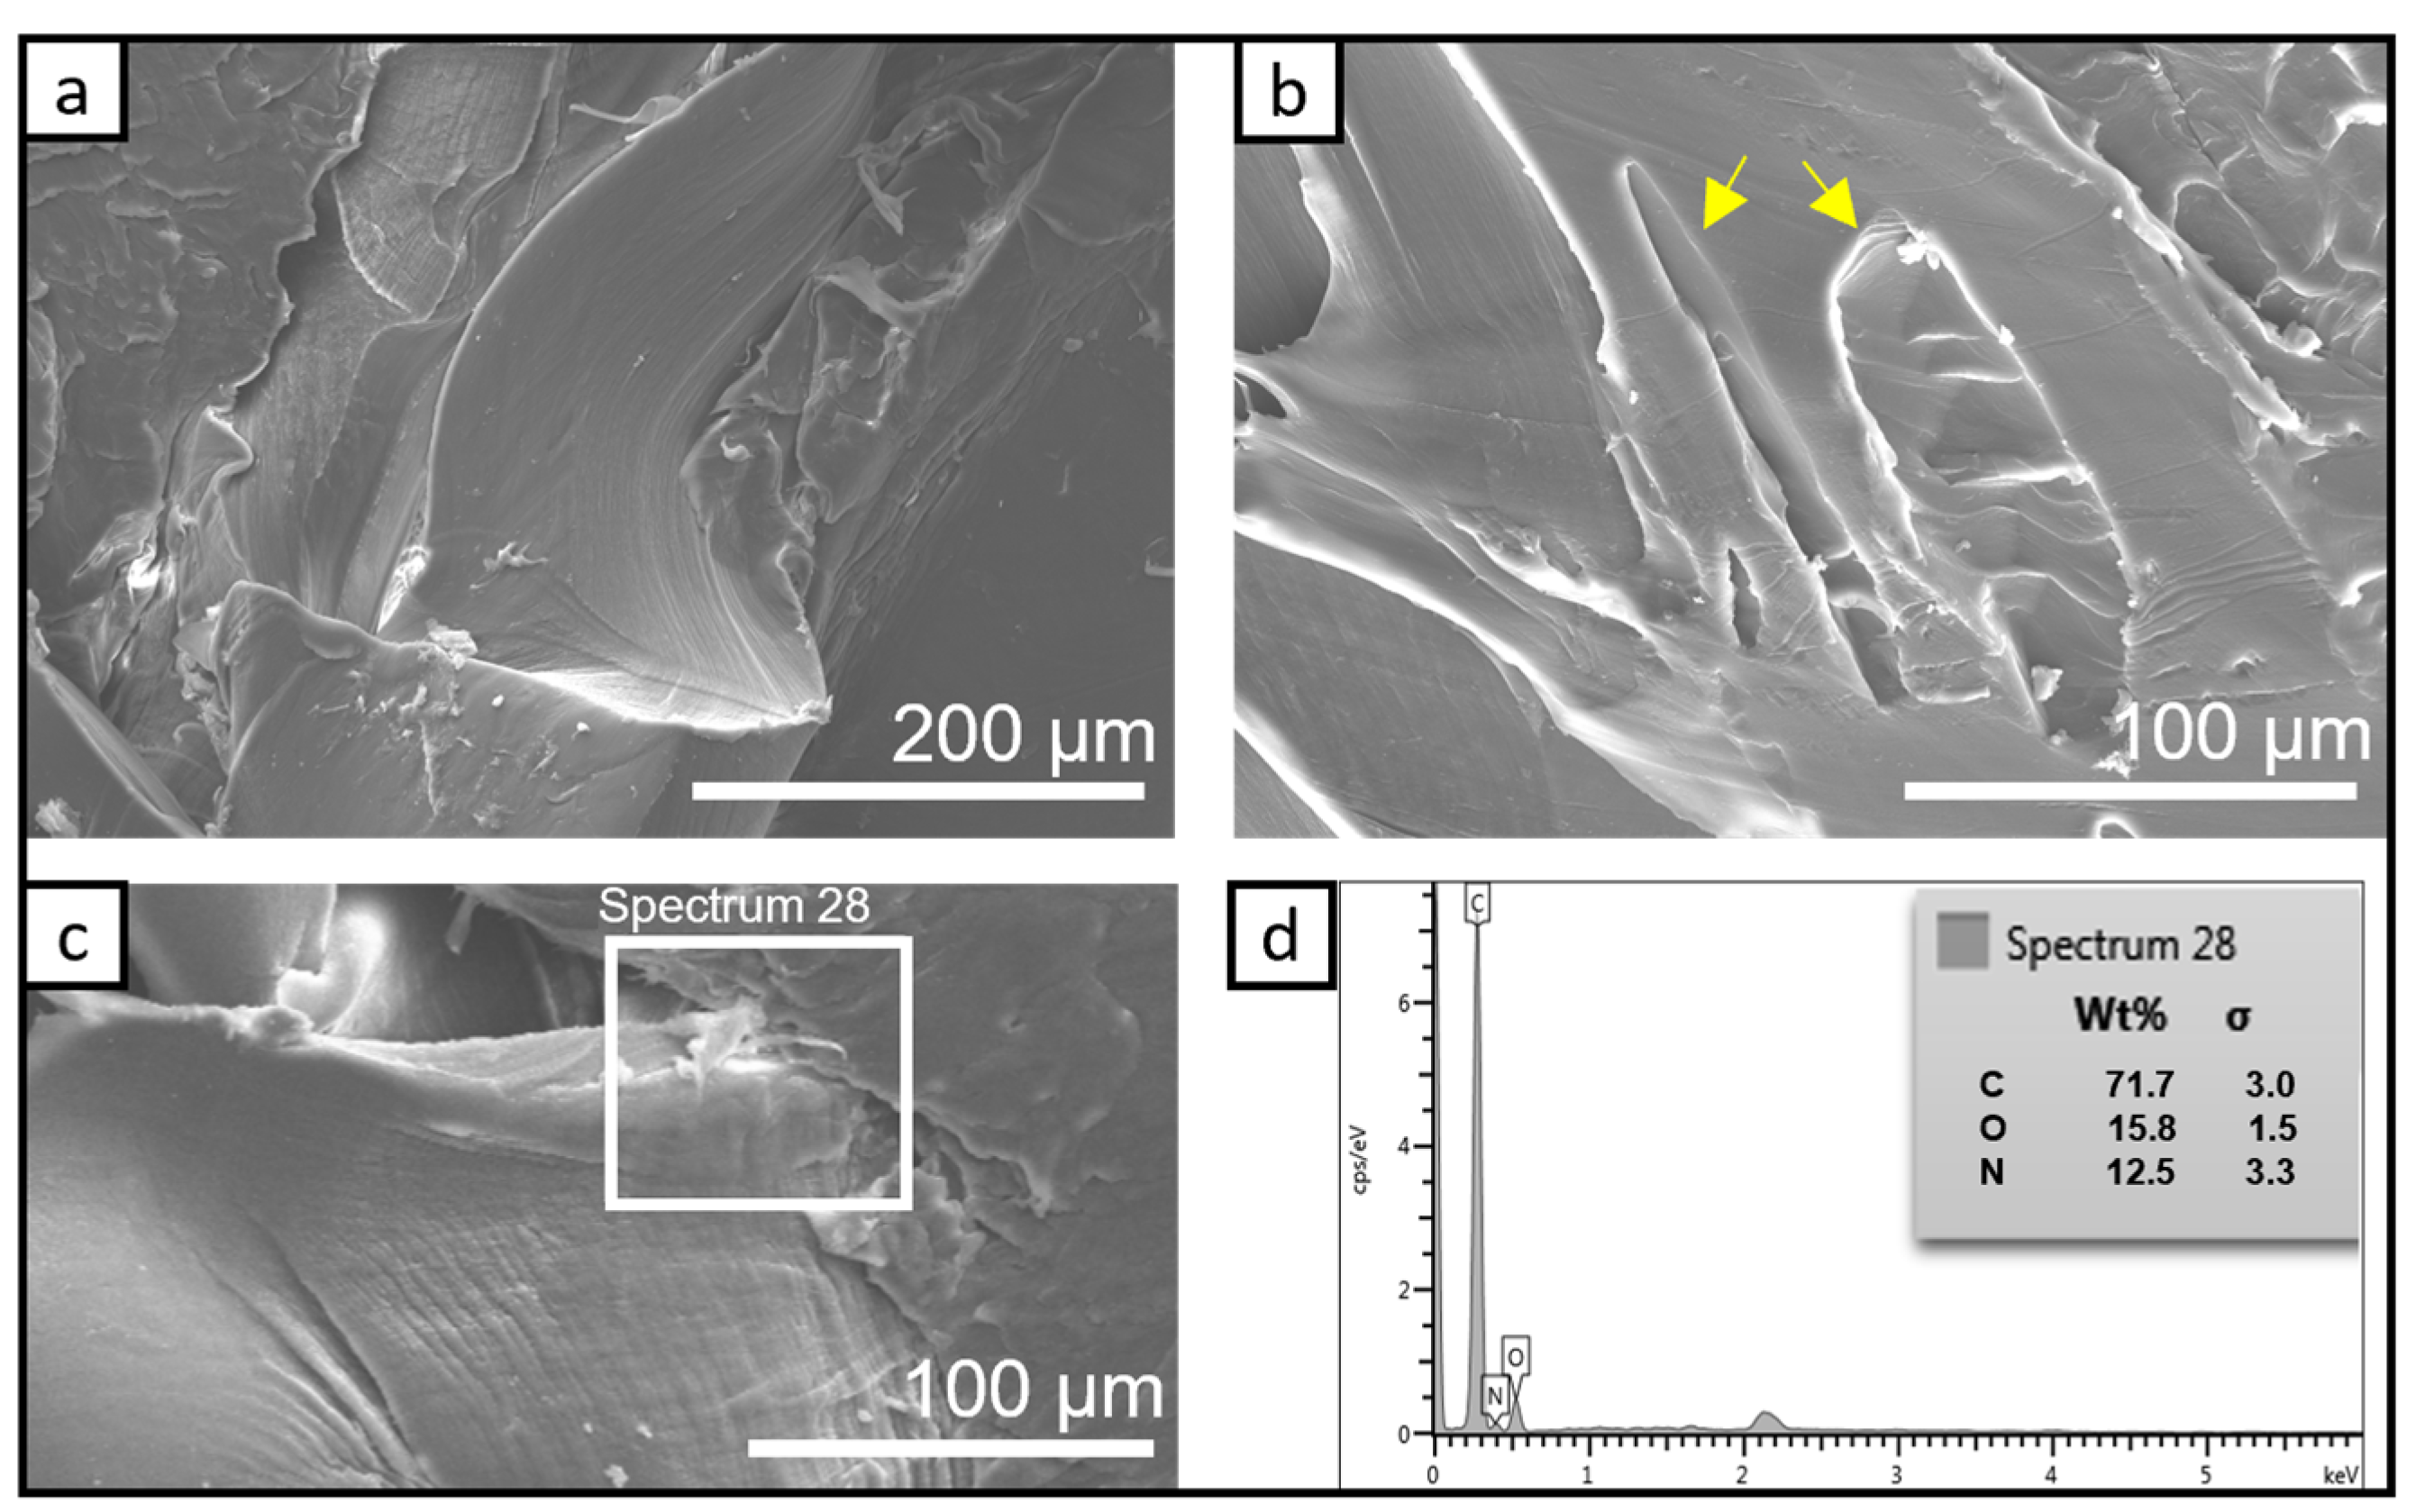
3.1.1. SEM Investigation of the Bio-PA1010 and Nanocomposites

The interface between the polymeric material and injection mould, as well as the contact surfaces showed a relative uniform morphology (Figure 1a,b). These micrographs also highlight the exact imprint mark of the demoulded area (the effect of the mould), while the edges appear as a result of the processing surface. The bio-PA1010 material (reference sample) crystallization occurred fast on the mould sample interface on extended planar areas. At the same time, small technological cavities were seen in the SEM images. This is most likely due to the escape of entrapped gases, during the hot-melt process. The material is carbon based with low levels of oxygen and nitrogen content, according to the EDS analysis (Figure 1c,d). This is in good agreement with amide repetitive groups found in the polyamide macromolecular chain.
Compared to the reference sample, the surface of the bio-PA1010 nanocomposites filled with LDH exhibits a higher roughness (Figure 2a–c). This might be due to the small LDH particle aggregates that migrated at the bio-PA1010 surface. However, the planarity of the demoulding was similar to that of the bio-PA1010 sample.
The graphene–bio-PA1010 samples had increased roughness, in comparison with the reference sample and bio-PA1010 nanocomposites (Figure 3). Moreover, the surface had rough edges that gave it a particular skin-like morphology. These morphological details were associated with both agglomerated graphene particles and a preferential phase of crystallization skin-like type. In higher resolution SEM images, some micrometric-sized aggregates based on graphenic structures and polyamide can be found (flakes). These flakes have a relatively homogeneous distribution which suggests a potential contribution to the crystallization process which took place on the injection mould surface. It is clearly noticed that at higher resolutions, the aggregates do not contain pure graphene, but a composite phase of graphene in combination with polyamide (in contrast with LDH polyamide composites).
The LDH particles have a more uniform distribution on the surface of the bio-PA1010 nanocomposites sample, as compared to the flakes observed in the graphene–bio-PA1010 samples. A lower roughness for LDH in comparison with graphene composites indicates a crystallization process in mild conditions (Figure 2 and Figure 3). These aspects can be correlated with several molecular interactions: one LDH can participate in the crystallization of bio-PA1010 with more polar groups than C500. The second one with a lower polarity difference could improve the dispersion degree in the matrix. Aggregates seen in the SEM images are relatively uniformly dispersed on the bio-PA1010 demoulded surface (after injection). At high magnifications, the LDH aggregates can be clearly observed. They were randomly covered with polyamide, while some others were found uncovered. These later aspects clarify true compatibility on the unmodified LDH with polar polymers such as bio-PA1010. The absence of hydrophobic domains in the LDH molecular structure can be considered as a real limitation for a high dispersion degree in the bio-PA1010.

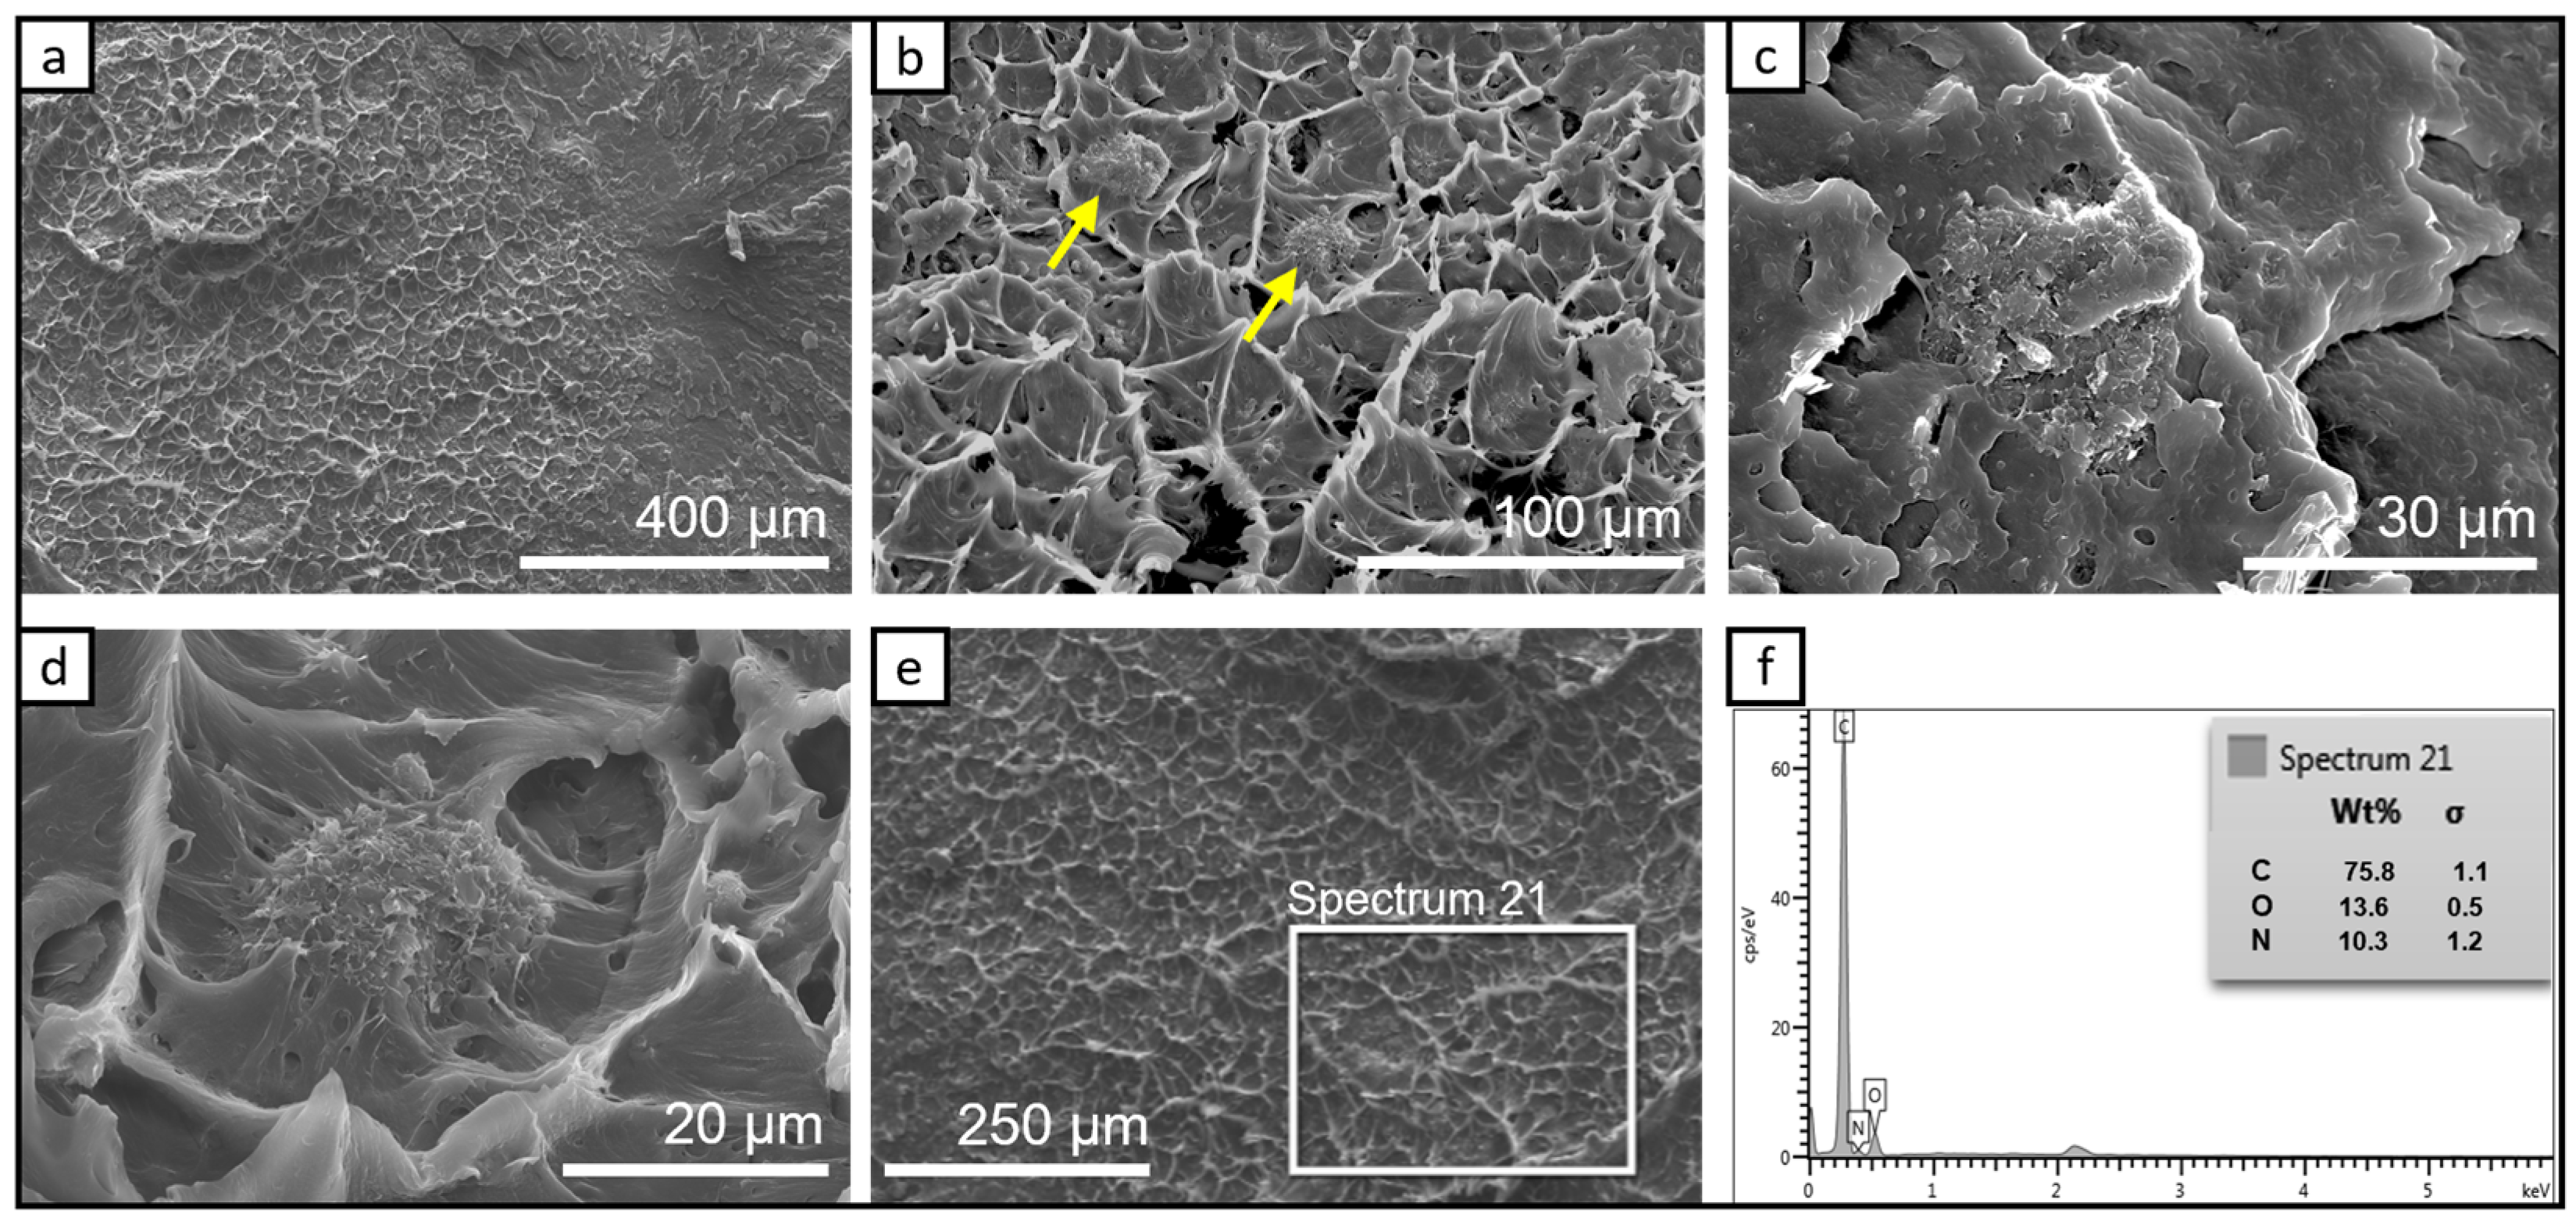
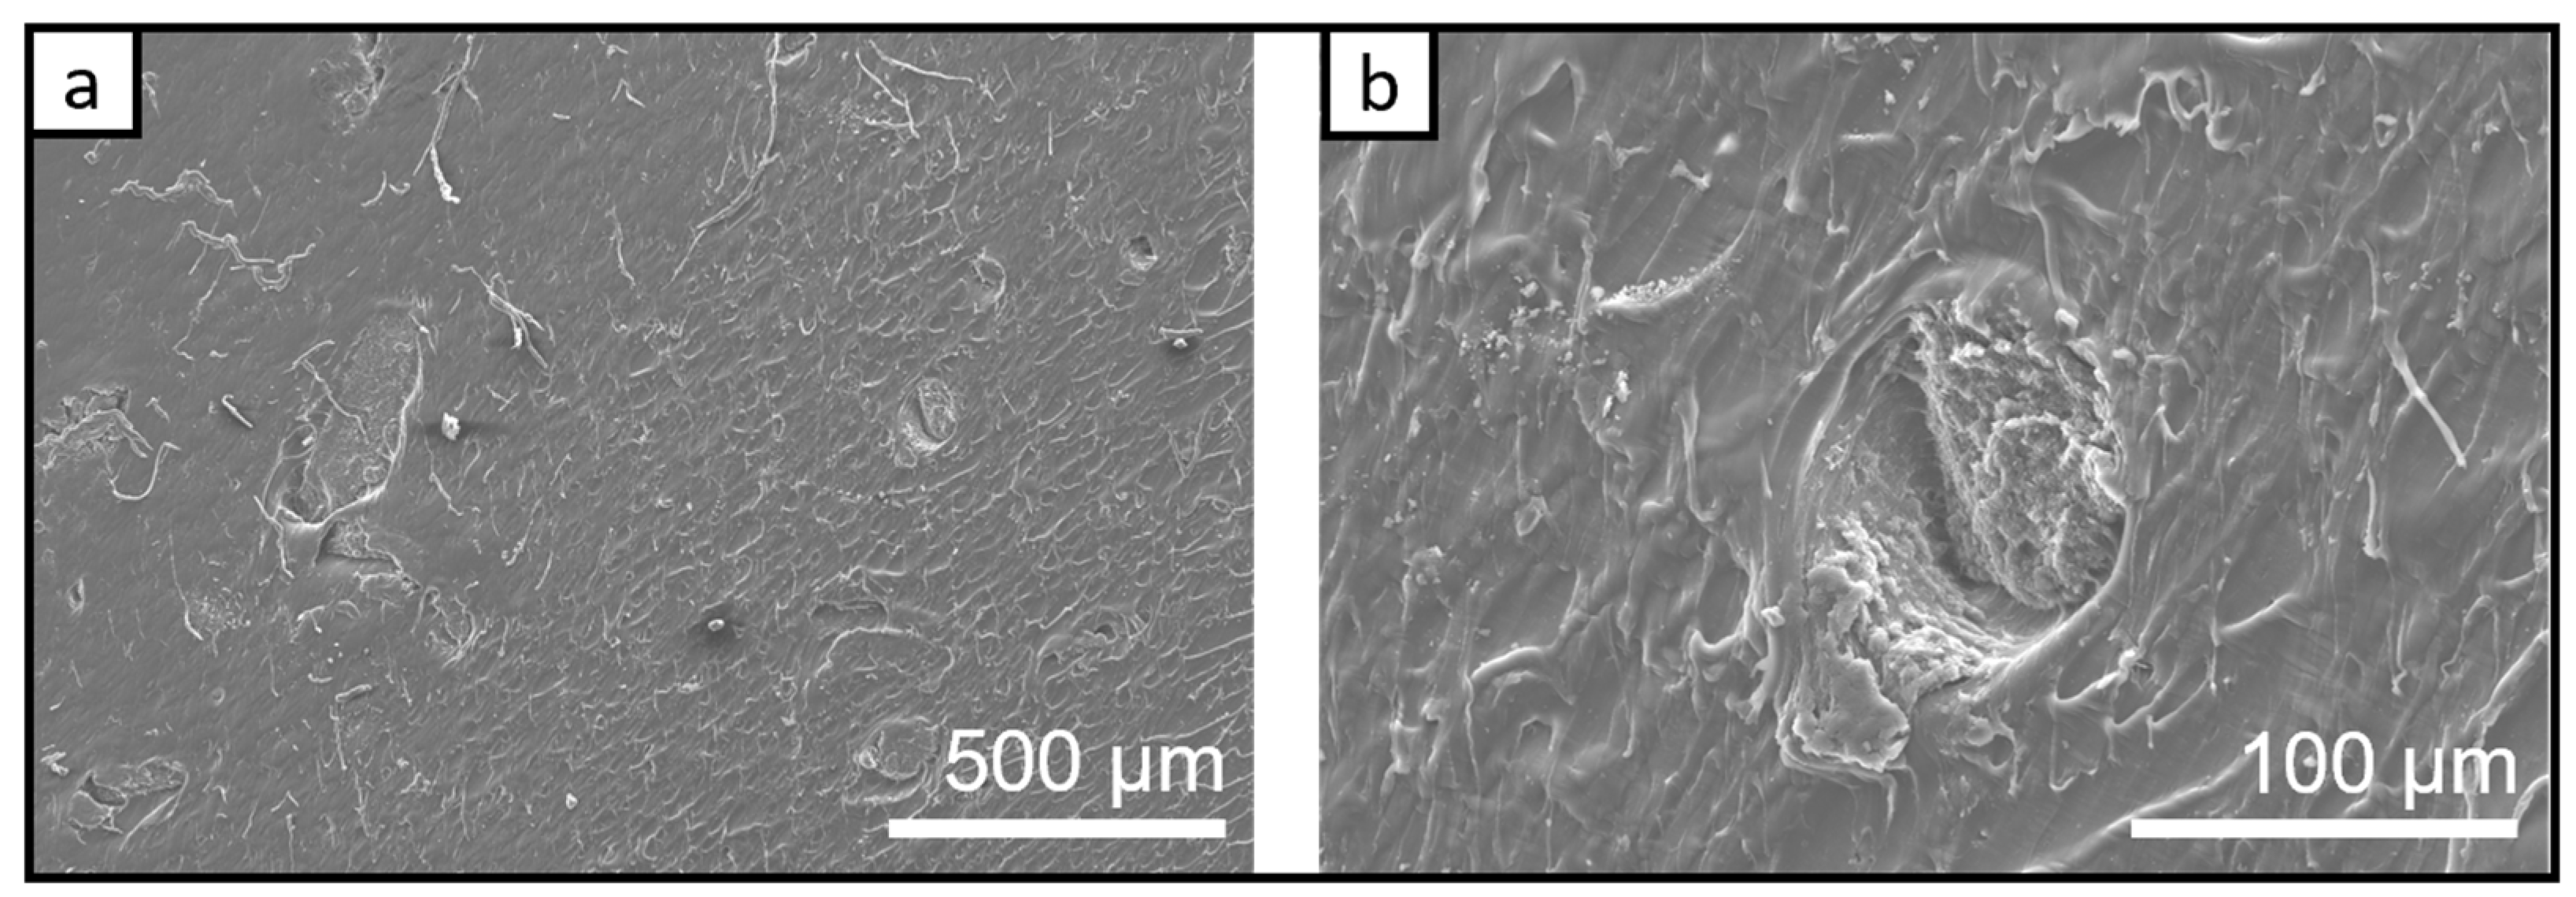
3.1.2. SEM Investigation of the Bio-PA1010 Nanocomposites Filled with Graphene Nanoplatelets C500-4% and LDH-5% after Thermal Treatment at 80 °C

The thermal treatment at 80 °C allows the rearrangement of the polyamidic phases in the presence of LDH. This allows the LDH to “sink” into the polymer matrix which makes it unobservable (Figure 4b). The surface morphology changes since the composite phase remodels. This leads to the disappearance of the potential tensions occurred during injection moulding. The resulted surface morphology (“tree bark”) had small protuberances indicating the rearrangement of the polymer composite phase (based on amide units–LDH interaction), different from the previously evidenced LDH aggregates (Figure 2b,c).
The thermal treatment at 80 °C of the C500-4% graphene–bio-PA1010, showed a pronounced debonding effect of the GNP aggregates decorated with polyamide (Figure 5). Large aggregates, similar to the pre-thermal treatment ones (Figure 3b–d) were seen on most of the analyzed areas. At a closer look of the sample, flake-like particles with dimensions closer to the elementary particles can be seen. Since they appear with a smooth edge at the margins of the layered structures, the polyamide–GNP composite phase occurrence is very probable. This correlates with the details seen in Figure 4d, where very well defined, solitary flake-like particles can be observed. Solitary aggregates are scarce, while the sharp edges disappear, due to the polyamide coverage, which confirms a better interaction for bio-PA1010 with C500, than for LDH.

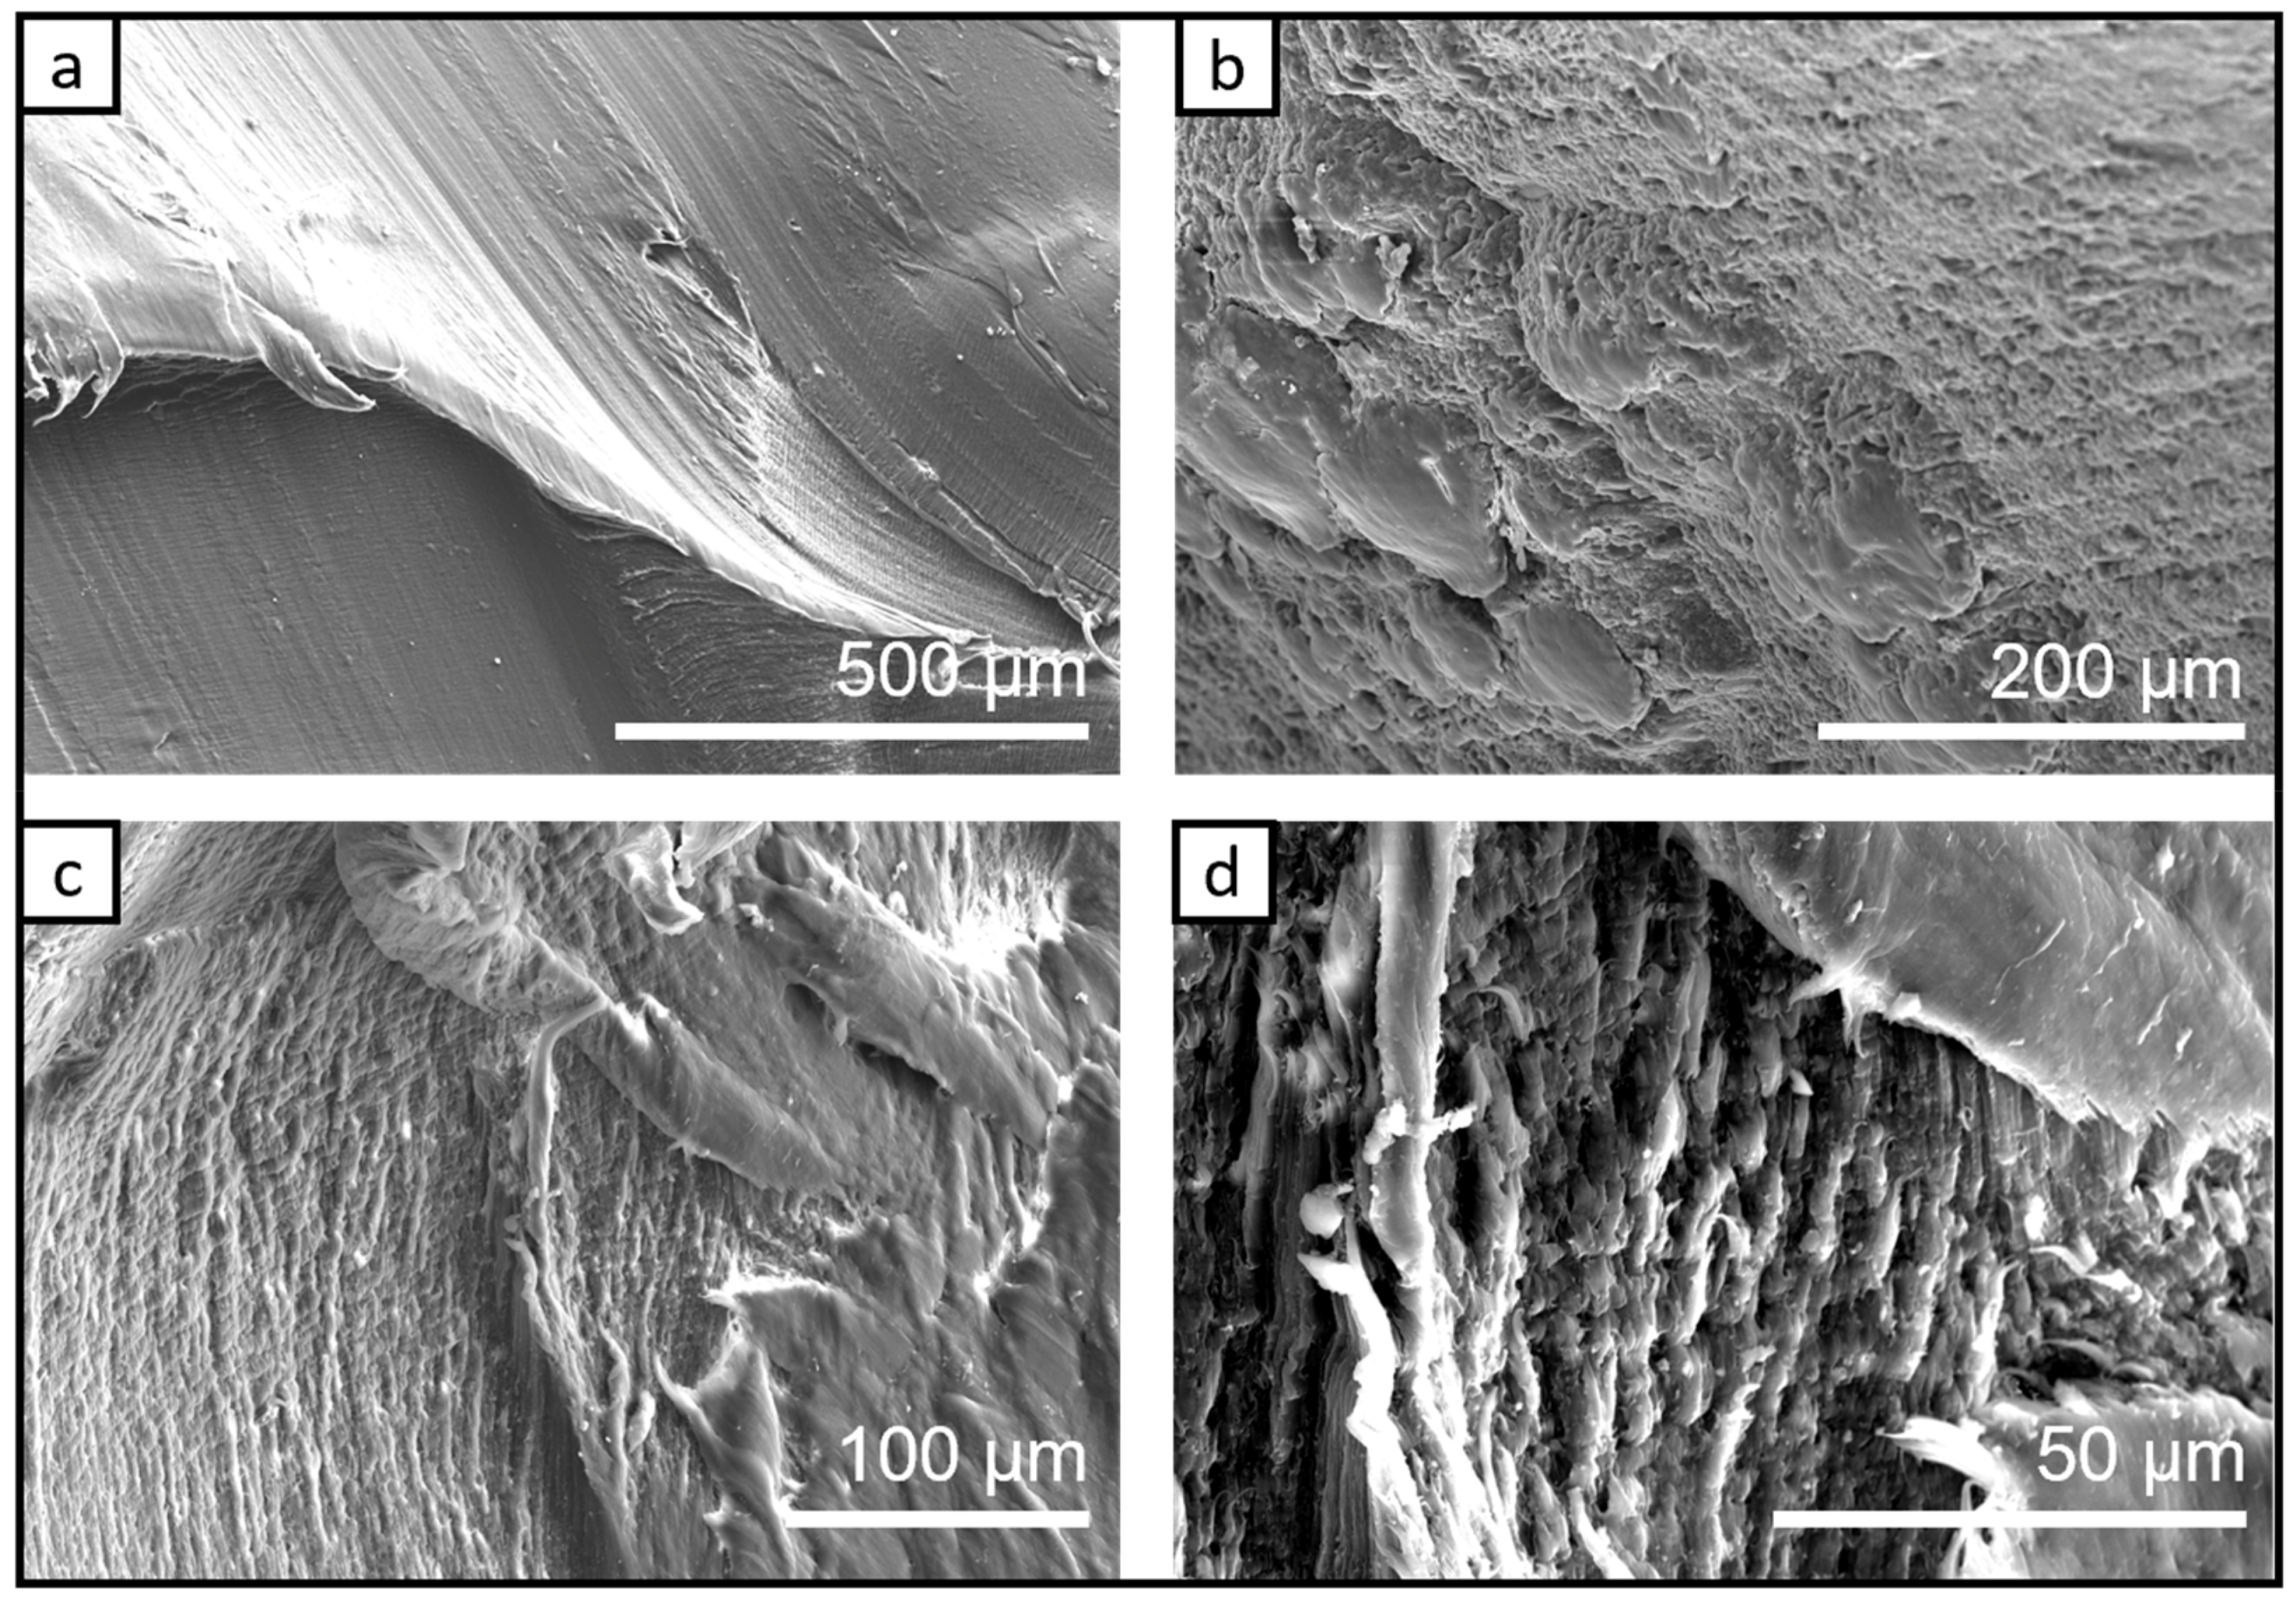
3.1.3. The SEM Analysis/Investigation of the Bio-PA1010 Nanocomposites filled with Graphene Nanoplatelets C500-4% and LDH-5% Thermal Treated at 145 °C
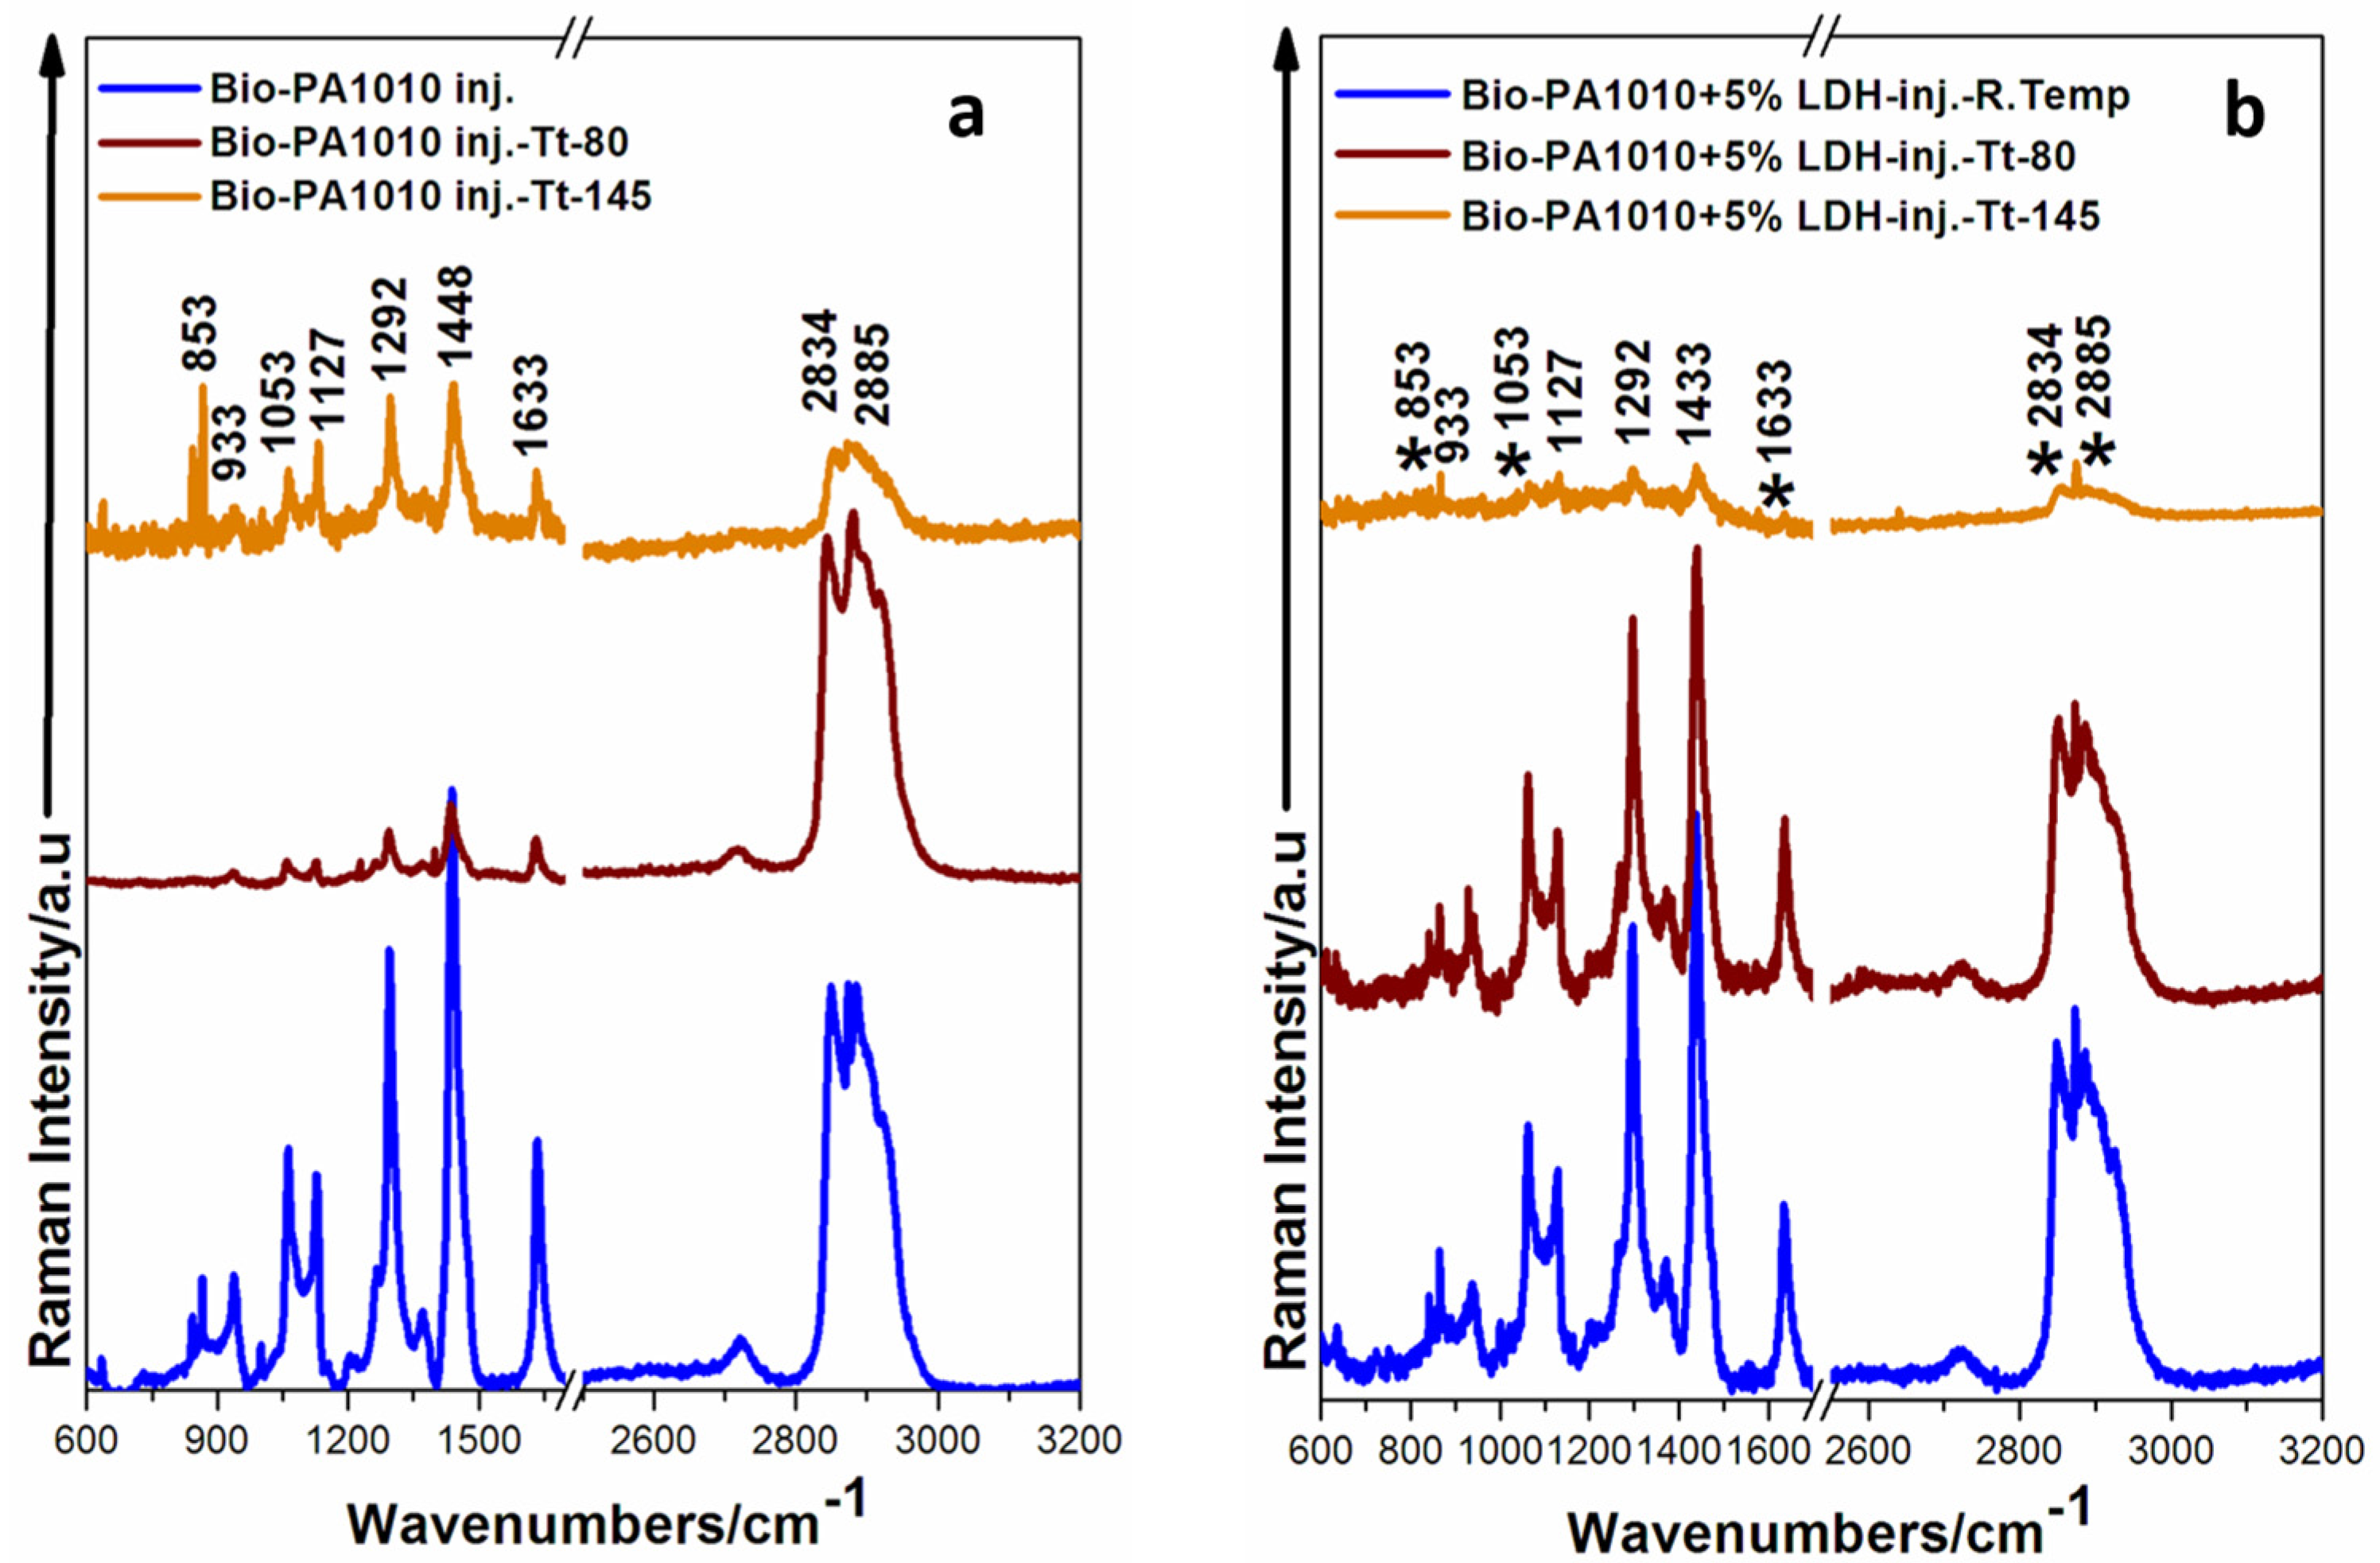
The LDH-5% sample treated at 145 °C (Figure 6) had a highly different morphology compared to the C500-4% sample, treated at 145 °C (Figure 7). Plastic deformations can be observed in the demoulded areas (Figure 6b), probably due to the mechanical properties considerably changed by LDH in the polyamide. It seems that the embedding process of the LDH into the polymer phase was not as effective as it was at the 80 °C. In this scenario, these particles can act as effort concentrators for future materials development.
In the case of bio-PA1010–GNP, the favorable interaction between partners allows the composite phase to act as a whole (Figure 7) indicating a promising way for future materials development. The same aspects were confirmed later in the Section 3.2, with more details on the specific interactions between polymer and filler molecular units.
In the SEM images presented in Figure 7, the polymorphic phases generated by different forms of GNP aggregates (GNP-elementary particles, GNP-aggregated particles) can be seen. In a comparative view, it seems that GNP are more compatible with the bio-PA1010 matrix than LDH. The assembling on hydrophobic interactions in the bio-PA1010 nanocomposites appeared as more favorable then polar–polar ones. The advantage of the hydrophobic one is that it does not interrupt the amido–amido interaction between bio-PA1010 chain molecules, which are the driving force for the crystallizing. Moreover, one can notice that GNP are able to act also in the bio-PA1010 amorphous region.

3.2. Raman Analysis

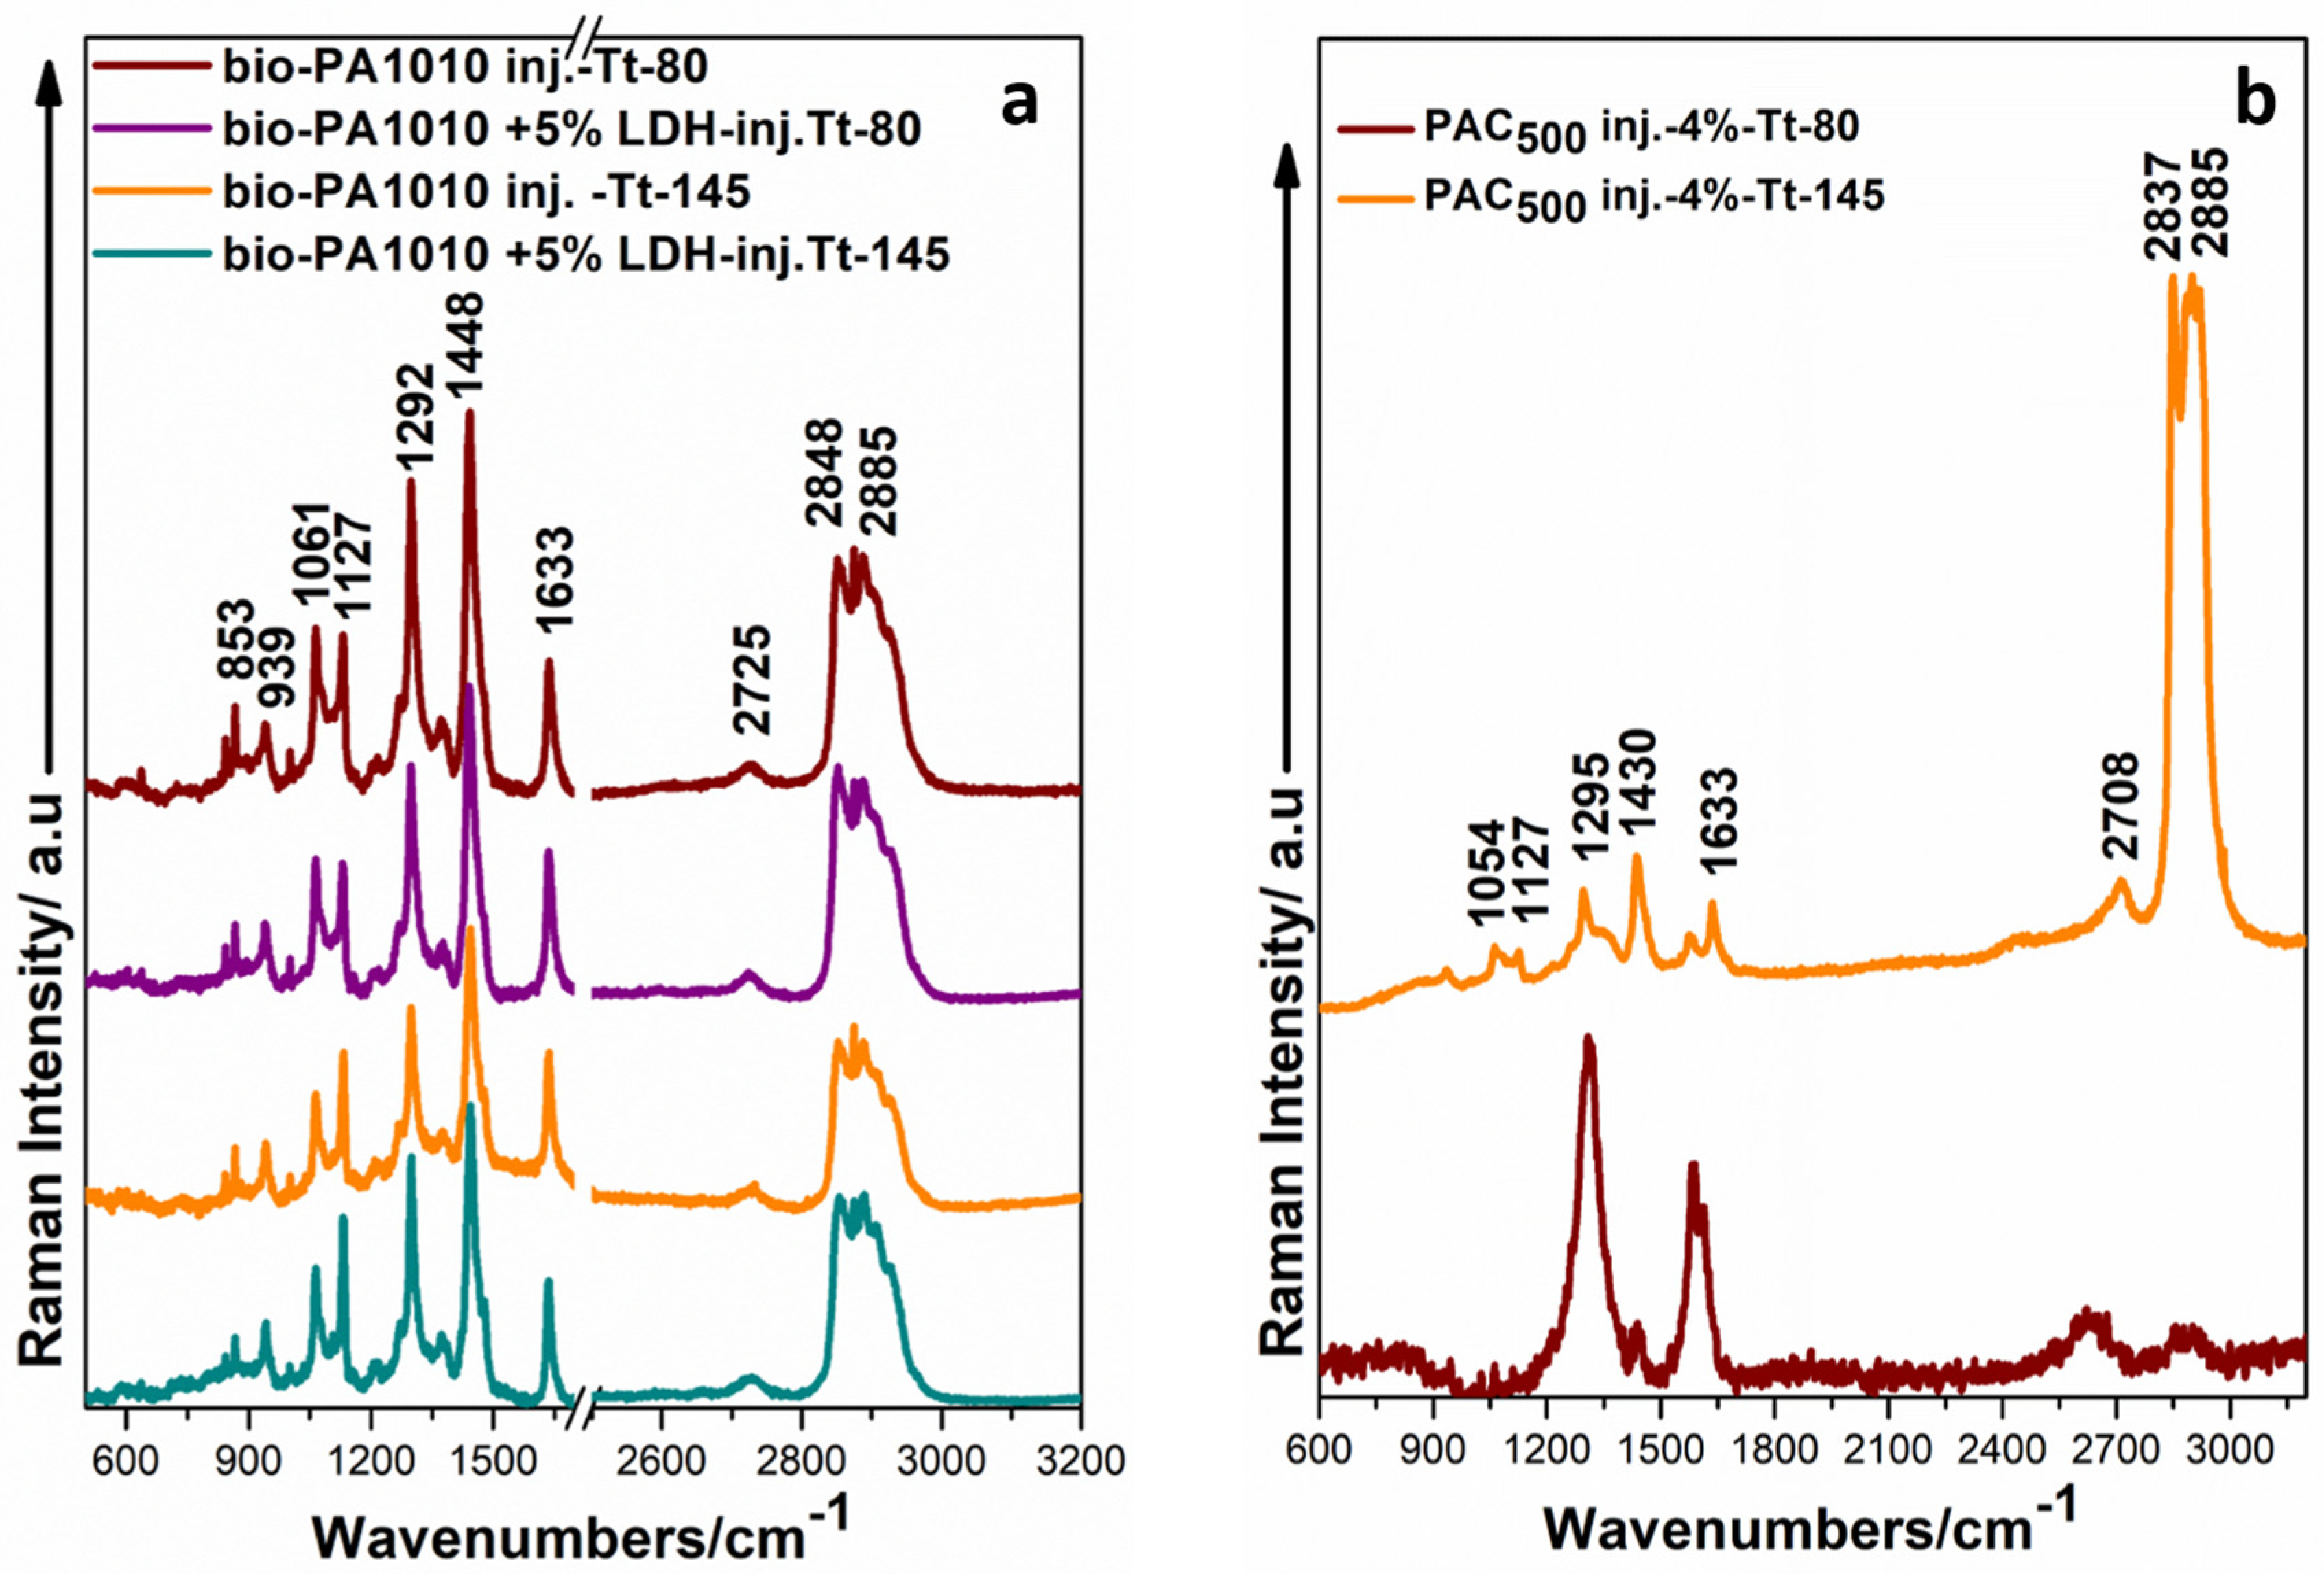
3.2.1. Raman Spectra of Bio-PA1010 Sample and Bio-PA1010 Filled with LDH before and after the Thermal Treatment

Figure 8a presents the Raman spectra for neat bio-PA1010 samples before and after the thermal treatment. The characteristic bands of bio-PA1010 are present at 1633 cm−1 (Amide I) and 1292 cm−1 (Amide III) corresponding to the presence of amide group in polymer. The two strong bands, at 2885 cm−1 and 2834 cm−1 belong to the CH2 symmetric and asymmetric stretching vibrations. Other Raman bands located in between the wavenumbers ranging from 1450 cm−1–850 cm−1 for the bio-PA1010 spectrum were assigned to the bending, stretching, and deformation vibrations of C-C bonds and the rocking vibration in the CH2 group [39]. The results indicated a drastic decrease in the intensity of the characteristic Raman bands once the temperature increases and reaches 145 °C as compared to the Raman profile recorded for room temperature conditions (Supplementary Material). These spectral changes indicate a dehydration process of the polyamide matrices.
The Raman spectra of bio-PA1010 samples filled with LDH, at room temperature and after the thermal treatments at 80 °C and 145 °C are shown in Figure 8b. By comparing the Raman spectrum of bio-PA1010 sample with the Raman spectrum of bio-PA1010 filled with LDH, one can observe the absence of the Raman fingerprint of LDH. In the LDH presence, the polar–polar interactions with the polymer chains involve a more stacked conformation of the CH2 bending modes (slightly shifted from 1448 to 1433 cm−1). This behavior is the result of the interaction between amido groups from the bio-PA1010 and the edges with positive charges from the LDH layers. LDH positive layers are compensated by negative charges of carbonates anions in the interlayer region [40]. However, the strong positive charges from the edges are still able to absorb carbon dioxide from the air or to interact with other species able to offer negative charges to compensate with [41]. These aspects can be noticed also by the drastic decrease in intensity ratio between the peak from the amido I versus CH2 bending or other C-C modes (Supplementary Material). All these aspects were in good agreement with the almost disappearance of the approx. 650 cm−1 Amido IV C=O mode.
In the same key, we should notice the influence of the 80 °C treatment, in order to compare the bio-PA1010 with LDH as compared to the neat polyamide. It is obvious that LDH restricts the overall segmental mobility (little over the polymer Tg). The intensity ratio between CH2 modes (especially symmetric and asymmetric stretching vibrations from 2800–2900 cm−1) and C=O modes (respectively NH ones) is completely changed in the presence of LDH (Supplementary Material).
The recorded Raman spectra show changes in the intensity of the corresponding bands of the bio-PA1010 in both cases (Figure 8a,b). Indeed, as the temperature increases, the intensity ratios between bands decrease, indicating chemical structure modifications (Supplementary Material).

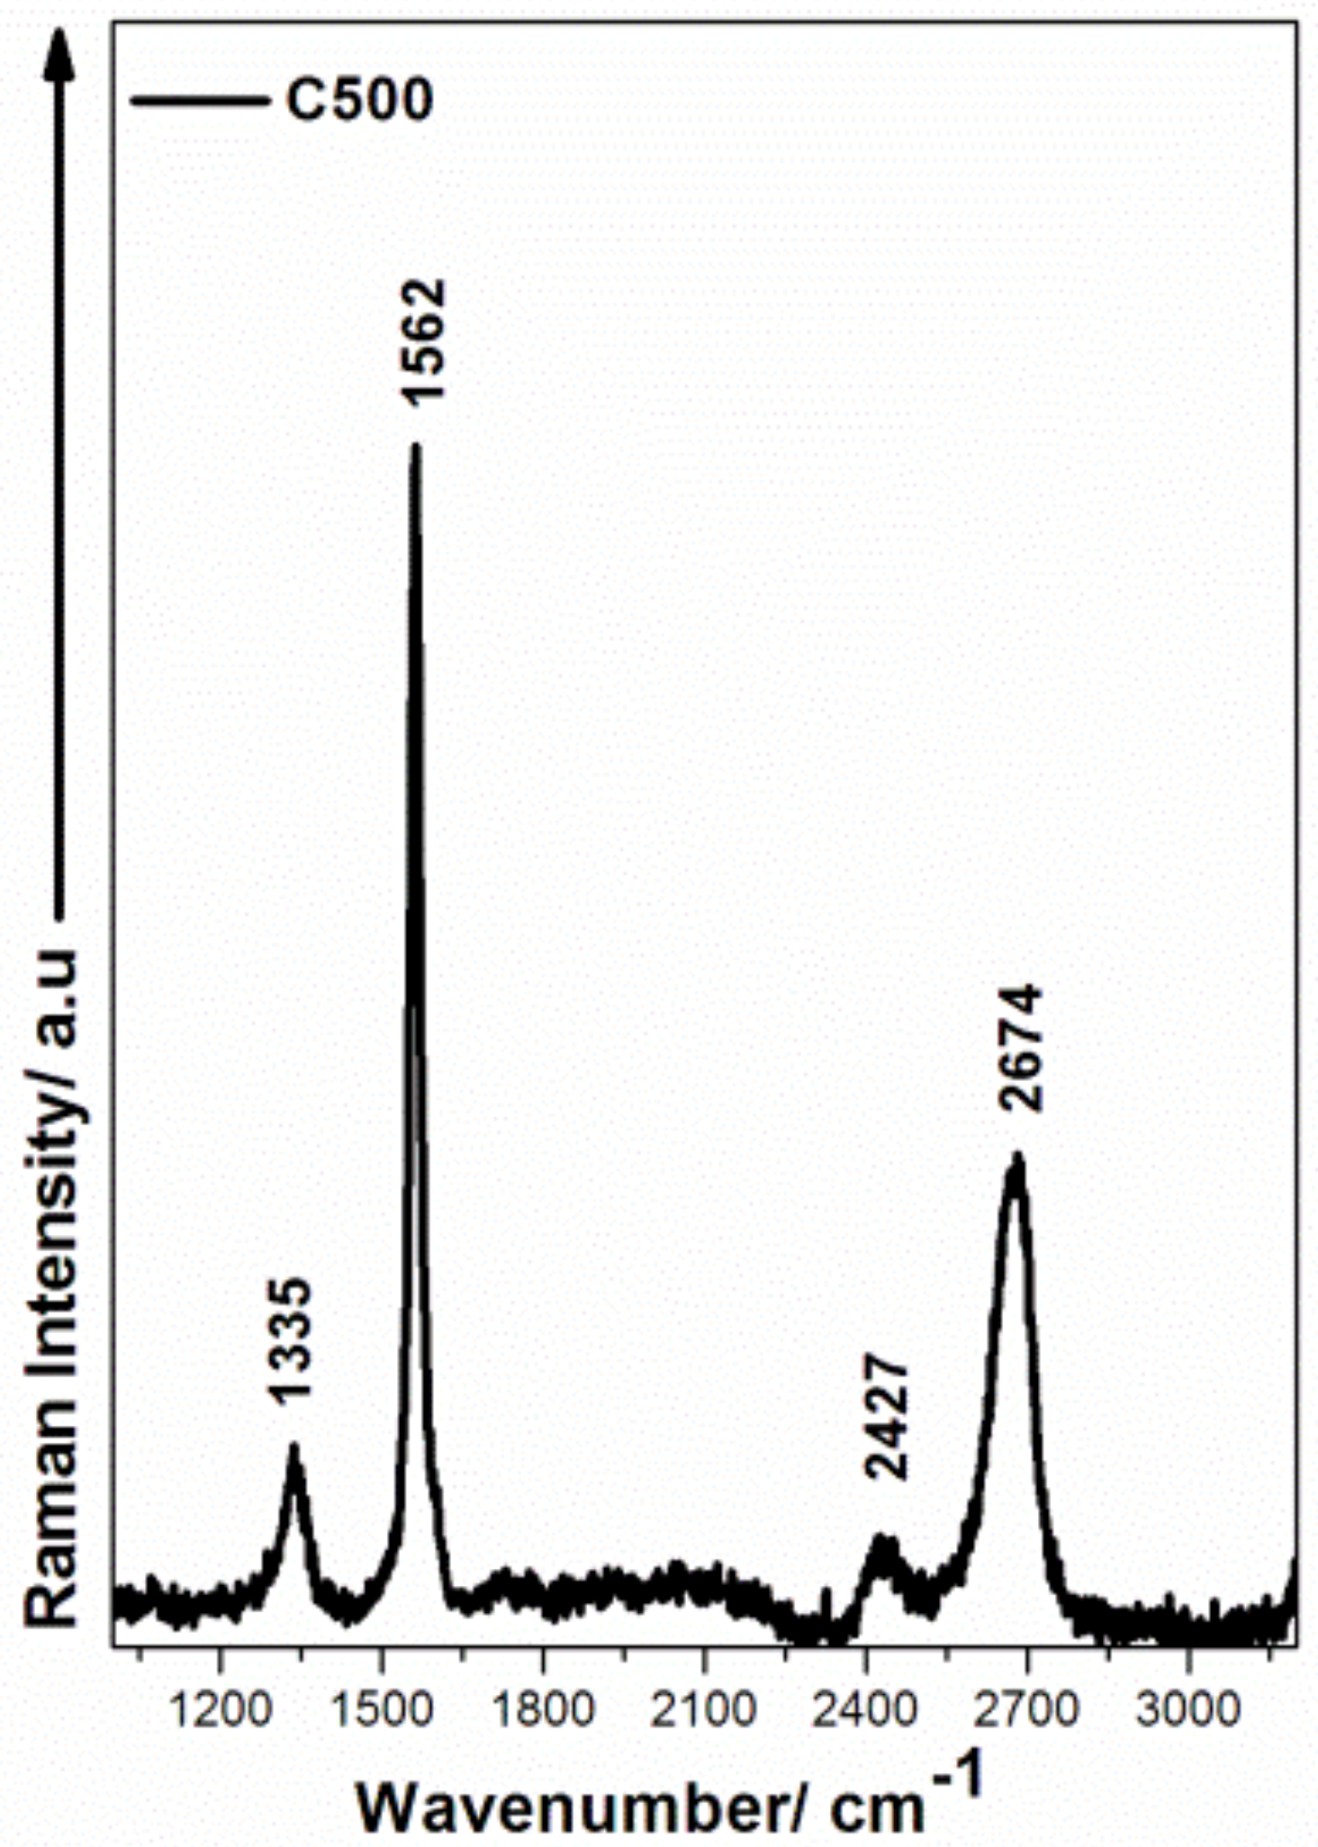
3.2.2. Raman Analysis of Bio-PA1010 Filled with C500 Graphene before and after the Thermal Treatment

The Raman spectra of C500 graphene used as fillers in bio-PA1010 are shown in Figure 9. These results can be used as an essential standard to calculate the defect levels of the fillers [42]. The characteristic Raman bands in graphene particles are observed around 1335 cm−1 (the D band of the sp3 carbon), indicating the presence of disorder in sp2–hybridization state of carbon system in their resonance Raman spectra. The G band located at 1562 cm−1, resulting from the in-plan tangential stretching of the carbon–carbon bonds νsym(C-C) in graphitic materials [29] and the 2D Raman band around 2700 cm−1, can be used to determine the number of graphene layers [29].
In the case of bio-PA1010 and nanocomposites filled with C500-4% concentration and thermally treated at 80 °C and 145 °C, the Raman spectra are presented in Figure 10. For C500 filling, the intensity of the bands starts to decrease with the increasing temperature, while the defects in the polymeric also increase [43]. At 145 °C, we observed an increase in the ratio ID/IG (from 0.9 to 1.43).

3.2.3. Raman Spectra of Bio-PA1010 Polyamide Filled with LDH and C500-4% Measured 1 Month after the Thermal Treatment

In Figure 11, the Raman spectra of neat bio-PA1010 and filled with LDH after the thermal treatment at 80 °C and 145 °C and measured after 1 month are shown. The Raman spectra of at bio-PA1010 nanocomposites contain characteristics bands of PA and are similar with the Raman spectra bio-PA1010 at room temperature shown in Figure 8a. In comparison with the Raman spectra of thermally treated bio-PA1010 samples (Figure 8a,b), the intensity of the marker bands increases after the rehydration step. The chemical structure returns to the original form of bio-PA1010. In the case of bio-PA1010 filled with C500, the rehydration step does not change the intensity of the Raman bands assigned to the polymer matrix. The Raman spectra are similar for the bio-PA1010 filled with graphenic materials after thermal treatment at 145 °C.
The spectral range contains the vibrational modes of PA and graphene, with a major contribution from the PA as presented in Table 1.

4. Conclusions

The surface of injected bio-PA1010, neat and filled with 2D graphene/non-graphene structures, was evaluated from SEM images. At the 80 °C thermal treatment, the surface of both samples, pellets and nanocomposites, had no alterations. Raman spectroscopy proved to be a powerful technique to analyze bio-PA1010s filled with 2D graphenic materials and was used to efficiently evaluate the defect level of the graphene-based fillers. The level of the chemical modification of the graphitic carbon sample was quantified by using the intensity ratio of the D band and G band (ID/IG). For a comparative view, we also used an inorganic 2D filler (hydrotalcite) able to offer better polar interaction with bio-PA1010 chain molecules. Despite a promising theoretical interaction for polar–polar segments (in filler–polymer composites), SEM and Raman analyses highlighted the best approach as being the one using non-polar interactions (based on hydrophobic segments in filler–polymer chain interaction). Moreover, the thermal treatments below 80 °C did not affect the structure of nanocomposites filled with graphene, which indicates that these materials might be safely used for automotive industry.

Supplementary Materials

The following supporting information can be downloaded at: https://www.mdpi.com/article/10.3390/chemosensors11010028/s1, Figure S1: Thermogravimetric analysis showing the thermal stability for bio-PA1010 granules in undried and dried state, and for the bio-PA1010 injected in cold and hot mold, respectively; Table S1: Table containing main parameters monitored during thermogravimetric analysis (weight loss, temperature of onset and the residues at 700 °C); Table S2: Tables containing Raman intensities ratios specific to bio-PA1010 filled with LDH and C500, respectively.

Author Contributions

Conceptualization, I.A.B., M.C.C. and I.T.; methodology, Z.V. and M.C.C.; validation, I.A.B., A.C. (Alexandra Ciorîță), A.C. (Alia Colniță) and Z.V.; investigation, I.A.B., D.M., A.C. (Alia Colniță), S.C.T., Z.V., M.C.C. and A.C. (Alexandra Ciorîță); resources, Z.V.; data curation, S.C.T. and N.E.D.; formal analysis, N.E.D.; writing—original draft preparation, I.A.B.; writing—review and editing, D.M., A.C. (Alia Colniță), Z.V., M.C.C., N.E.D. and I.T.; supervision, I.T.; project administration, Z.V. and I.T.; funding acquisition, Z.V. All authors have read and agreed to the published version of the manuscript.

Funding

This work was supported by a grant of the Ministry of Research, Innovation and Digitization, CNCS/CCCDI-UEFISCDI, project number PN-III-P2-2.1-PED-2021-0795 and the subprogramme 1. Institutional Performance Funding Projects for Excellence in RDI, contract number 37PFE/ 30.12.2021, within PNCD III.

Institutional Review Board Statement

Not applicable.

Informed Consent Statement

Not applicable.

Data Availability Statement

Not applicable.

Conflicts of Interest

The authors declare no conflict of interest.

References

  1. Jia, Y.; He, H.; Peng, X.; Meng, S.; Chen, J.; Geng, Y. Preparation of a new filament based on polyamide-6 for three-dimensional printing. Polym. Eng. Sci. 2017, 57, 1322–1328. [Google Scholar] [CrossRef]
  2. Marchildon, K. Polyamides—Still strong after seventy years. Macromol. React. Eng. 2011, 5, 22–54. [Google Scholar] [CrossRef]
  3. Russo, S.; Casazza, E. 4.14—Ring-opening polymerization of cyclic amides (lactams). In Polymer Science: A Comprehensive Reference; Matyjaszewski, K., Möller, M., Eds.; Elsevier: Amsterdam, The Netherlands, 2012; pp. 331–396. [Google Scholar]
  4. Schmitz, K.; Schepers, U. Polyamides as artificial transcription factors: Novel tools for molecular medicine? Angew. Chem. Int. Ed. 2004, 43, 2472–2475. [Google Scholar] [CrossRef] [PubMed]
  5. Rulkens, R.; Koning, C. 5.18—Chemistry and technology of polyamides. In Polymer Science: A Comprehensive Reference; Matyjaszewski, K., Möller, M., Eds.; Elsevier: Amsterdam, The Netherlands, 2012; pp. 431–467. [Google Scholar]
  6. Nguyen, X.H.; Honda, T.; Wang, Y.; Yamamoto, R. Eco-Materials; University of Tokyo: Tokyo, Japan, 2010. [Google Scholar]
  7. Winnacker, M.; Rieger, B. Biobased polyamides: Recent advances in basic and applied research. Macromol. Rapid Commun. 2016, 37, 1391–1413. [Google Scholar] [CrossRef] [PubMed]
  8. Geyer, R.; Jambeck, J.R.; Law, K.L. Production, use, and fate of all plastics ever made. Sci. Adv. 2017, 3, e1700782. [Google Scholar] [CrossRef] [Green Version]
  9. Taylor, K. EU Set to Adopt Mandatory Recycled Content Targets in New Packaging Law. Available online: https://www.euractiv.com/section/energy-environment/news/eu-set-to-adopt-mandatory-recycled-content-targets-in-new-packaging-law/ (accessed on 15 November 2022).
  10. Rydz, J.; Sikorska, W.; Kyulavska, M.; Christova, D. Polyester-based (bio)degradable polymers as environmentally friendly materials for sustainable development. Int. J. Mol. Sci. 2015, 16, 564–596. [Google Scholar] [CrossRef] [Green Version]
  11. Liu, Z.; Zhou, P.; Yan, D. Preparation and properties of nylon-1010/montmorillonite nanocomposites by melt intercalation. J. Appl. Polym. Sci. 2004, 91, 1834–1841. [Google Scholar] [CrossRef]
  12. Zeng, H.; Gao, C.; Wang, Y.; Watts, P.C.; Kong, H.; Cui, X.; Yan, D. In situ polymerization approach to multiwalled carbon nanotubes-reinforced nylon 1010 composites: Mechanical properties and crystallization behavior. Polymer 2006, 47, 113–122. [Google Scholar] [CrossRef]
  13. Allen, M.J.; Tung, V.C.; Kaner, R.B. Honeycomb carbon: A review of graphene. Chem. Rev. 2010, 110, 132–145. [Google Scholar] [CrossRef]
  14. Loh, K.P.; Bao, Q.; Ang, P.K.; Yang, J. The chemistry of graphene. J. Mater. Chem. 2010, 20, 2277–2289. [Google Scholar] [CrossRef]
  15. Novoselov, K.S.; Geim, A.K.; Morozov, S.V.; Jiang, D.; Katsnelson, M.I.; Grigorieva, I.V.; Dubonos, S.V.; Firsov, A.A. Two-dimensional gas of massless Dirac fermions in graphene. Nature 2005, 438, 197–200. [Google Scholar] [CrossRef] [PubMed] [Green Version]
  16. Zhang, H.-B.; Yan, Q.; Zheng, W.-G.; He, Z.; Yu, Z.-Z. Tough graphene−polymer microcellular foams for electromagnetic interference shielding. ACS Appl. Mater. Interfaces 2011, 3, 918–924. [Google Scholar] [CrossRef] [PubMed]
  17. Barjasteh, E.; Sutanto, C.; Nepal, D. Conductive polyamide–graphene composite fabric via interface engineering. Langmuir 2019, 35, 2261–2269. [Google Scholar] [CrossRef] [PubMed]
  18. Kausar, A. Trends in graphene reinforced polyamide nanocomposite for functional application: A review. Polym. Plast. Technol. Mater. 2019, 58, 917–933. [Google Scholar] [CrossRef]
  19. Francisco, D.L.; Paiva, L.B.; Aldeia, W. Advances in polyamide nanocomposites: A review. Polym. Compos. 2019, 40, 851–870. [Google Scholar] [CrossRef]
  20. Wang, R.; Wu, L.; Zhuo, D.; Zhang, J.; Zheng, Y. Fabrication of polyamide 6 nanocomposite with improved thermal conductivity and mechanical properties via incorporation of low graphene content. Ind. Eng. Chem. Res. 2018, 57, 10967–10976. [Google Scholar] [CrossRef]
  21. Sisti, L.; Totaro, G.; Vannini, M.; Giorgini, L.; Ligi, S.; Celli, A. Bio-based PA11/graphene nanocomposites prepared by in situ polymerization. J. Nanosci. Nanotechnol. 2018, 18, 1169–1175. [Google Scholar] [CrossRef]
  22. Zheng, D.; Tang, G.; Zhang, H.-B.; Yu, Z.-Z.; Yavari, F.; Koratkar, N.; Lim, S.-H.; Lee, M.-W. In situ thermal reduction of graphene oxide for high electrical conductivity and low percolation threshold in polyamide 6 nanocomposites. Compos. Sci. Technol. 2012, 72, 284–289. [Google Scholar] [CrossRef]
  23. Yu, J.; Wang, Q.; O’Hare, D.; Sun, L. Preparation of two dimensional layered double hydroxide nanosheets and their applications. Chem. Soc. Rev. 2017, 46, 5950–5974. [Google Scholar] [CrossRef]
  24. Basu, D.; Das, A.; Heinrich, G. Layered double hydroxide (LDH)-based rubber nanocomposites. In Encyclopedia of Polymeric Nanomaterials; Springer: Berlin/Heidelberg, Germany, 2014; pp. 1–7. [Google Scholar]
  25. Sinha Ray, S.; Okamoto, M. Polymer/layered silicate nanocomposites: A review from preparation to processing. Prog. Polym. Sci. 2003, 28, 1539–1641. [Google Scholar] [CrossRef]
  26. Paul, D.R.; Robeson, L.M. Polymer nanotechnology: Nanocomposites. Polymer 2008, 49, 3187–3204. [Google Scholar] [CrossRef] [Green Version]
  27. Mayoral, B.; Harkin-Jones, E.; Khanam, P.N.; AlMaadeed, M.A.; Ouederni, M.; Hamilton, A.R.; Sun, D. Melt processing and characterisation of polyamide 6/graphene nanoplatelet composites. RSC Adv. 2015, 5, 52395–52409. [Google Scholar] [CrossRef] [Green Version]
  28. Ferrari, A.C.; Basko, D.M. Raman spectroscopy as a versatile tool for studying the properties of graphene. Nat. Nanotechnol. 2013, 8, 235–246. [Google Scholar] [CrossRef] [PubMed] [Green Version]
  29. Dresselhaus, M.S.; Jorio, A.; Hofmann, M.; Dresselhaus, G.; Saito, R. Perspectives on carbon nanotubes and graphene Raman spectroscopy. Nano Lett. 2010, 10, 751–758. [Google Scholar] [CrossRef] [PubMed]
  30. Iijima, S. Helical microtubules of graphitic carbon. Nature 1991, 354, 56–58. [Google Scholar] [CrossRef]
  31. Bokobza, L. Spectroscopic techniques for the characterization of polymer nanocomposites: A review. Polymers 2018, 10, 7. [Google Scholar] [CrossRef] [PubMed] [Green Version]
  32. Bokobza, L.; Couzi, M.; Bruneel, J.-L. Raman spectroscopy of polymer–carbon nanomaterial composites. Rubber Chem. Technol. 2017, 90, 37–59. [Google Scholar] [CrossRef]
  33. Potts, J.R.; Dreyer, D.R.; Bielawski, C.W.; Ruoff, R.S. Graphene-based polymer nanocomposites. Polymer 2011, 52, 5–25. [Google Scholar] [CrossRef] [Green Version]
  34. Ye, K.; Li, K.; Lu, Y.; Guo, Z.; Ni, N.; Liu, H.; Huang, Y.; Ji, H.; Wang, P. An overview of advanced methods for the characterization of oxygen vacancies in materials. TrAC Trends Anal. Chem. 2019, 116, 102–108. [Google Scholar] [CrossRef]
  35. Wang, Y.; Chen, D.; Zhang, J.; Balogun, M.T.; Wang, P.; Tong, Y.; Huang, Y. Charge relays via dual carbon-actions on nanostructured BiVO4 for high performance photoelectrochemical water splitting. Adv. Funct. Mater. 2022, 32, 2112738. [Google Scholar] [CrossRef]
  36. Stamate, A.-E.; Zăvoianu, R.; Pavel, O.D.; Birjega, R.; Matei, A.; Dumitru, M.; Brezeștean, I.; Osiac, M.; Marcu, I.-C. The influence of the preparation method on the physico-chemical properties and catalytic activities of Ce-modified LDH structures used as catalysts in condensation reactions. Molecules 2021, 26, 6191. [Google Scholar] [CrossRef] [PubMed]
  37. Stamate, A.-E.; Pavel, O.D.; Zăvoianu, R.; Brezeştean, I.; Ciorȋță, A.; Bȋrjega, R.; Neubauer, K.; Koeckritz, A.; Marcu, I.-C. Ce-containing MgAl-layered double hydroxide-graphene oxide hybrid materials as multifunctional catalysts for organic transformations. Materials 2021, 14, 7457. [Google Scholar] [CrossRef]
  38. Levinta, N.; Corobea, M.C.; Vuluga, Z.; Nicolae, C.-A.; Gabor, A.R.; Raditoiu, V.; Osiac, M.; Teodorescu, G.-M.; Teodorescu, M. Bio-based polyamide 1010 with a halogen-free flame retardant based on melamine–gallic acid complex. Polymers 2020, 12, 1482. [Google Scholar] [CrossRef] [PubMed]
  39. Cho, L.-L. Identification of textile fiber by Raman microspectroscopy. Forensic Sci. J. 2007, 6, 55–62. [Google Scholar]
  40. Birjega, R.; Matei, A.; Mitu, B.; Ionita, M.; Filipescu, M.; Stokker-Cheregi, F.; Luculescu, C.; Dinescu, M.; Zăvoianu, R.; Pavel, O.; et al. Layered double hydroxides/polymer thin films grown by matrix assisted pulsed laser evaporation. Thin Solid Film. 2013, 543, 63–68. [Google Scholar] [CrossRef]
  41. Birjega, R.; Matei, A.; Marascu, V.; Vlad, A.; Ionita, M.; Dinescu, M.; Zăvoianu, R.; Corobea, M. Stearic acid/layered double hydroxides composite thin films deposited by combined laser techniques. Molecules 2020, 25, 4097. [Google Scholar] [CrossRef]
  42. Kim, H.S.; Bae, H.S.; Yu, J.; Kim, S.Y. Thermal conductivity of polymer composites with the geometrical characteristics of graphene nanoplatelets. Sci. Rep. 2016, 6, 26825. [Google Scholar] [CrossRef] [Green Version]
  43. Schuepfer, D.B.; Badaczewski, F.; Guerra-Castro, J.M.; Hofmann, D.M.; Heiliger, C.; Smarsly, B.; Klar, P.J. Assessing the structural properties of graphitic and non-graphitic carbons by Raman spectroscopy. Carbon 2020, 161, 359–372. [Google Scholar] [CrossRef]
  44. Hendra, P.; Maddams, W.; Royaud, I.; Willis, H.; Zichy, V. The application of Fourier transform Raman spectroscopy to the identification and characterization of polyamides—I. Single number nylons. Spectrochim. Acta Part A 1990, 46, 747–756. [Google Scholar] [CrossRef]
Figure 1. Representative SEM micrographs of bio-PA1010, reference sample: low magnification image showing the smooth surface and the demoulded area of the sample (a); detailed image of the technological cavities (marked in b) with yellow arrows); the area selected for the EDS analysis (c); and the EDS spectrum and elemental composition of the selected area (d).
Chemosensors 11 00028 g001
Figure 2. Representative SEM micrographs of bio-PA1010 nanocomposites filled with LDH 5%: low magnification image showing the rough surface of the sample, with LDH aggregates (marked in (a) with yellow arrows); detailed view of the LDH aggregates (b); the area selected for the EDS analysis (c); and the EDS spectrum and elemental composition of the selected area (d).
Chemosensors 11 00028 g002
Figure 3. Representative SEM micrographs of bio-PA1010 filled with 4% C500 GNP: low magnification image showing the rough surface of the sample (a); detailed view of the rough surface, with flakes and graphenic aggregates marked with yellow arrows (b,c); and high magnification image of graphenic aggregates surrounded by flakes (d); the area selected for the EDS analysis (e); and the EDS spectrum and elemental composition of the selected area (f).
Chemosensors 11 00028 g003
Figure 4. Representative SEM micrographs of bio-PA1010 filled with 5% LDH nanocomposites after thermal treatment at 80 °C (a) and low magnification images showing the relatively smooth surface of the sample and detailed views of the small protuberances (bd).
Chemosensors 11 00028 g004
Figure 5. Representative SEM micrographs of bio-PA1010 filled with 4% C500 graphene nanoplatelets after thermal treatment at 80 °C (a); low magnification images of the sample with progressive magnification showing the smooth surface and embedded graphenic aggregates (bf).
Chemosensors 11 00028 g005
Figure 6. Representative SEM micrographs of bio-PA1010 filled with LDH-5% nanocomposites after thermal treatment at 145 °C (a) and low magnification image showing the smooth surface of the sample detailed view of the plastic deformation that occurred in the sample (b).
Chemosensors 11 00028 g006
Figure 7. Representative SEM micrographs of bio-PA1010 filled with C500-4% nanocomposites after thermal treatment at 145 °C (a,b).
Chemosensors 11 00028 g007
Figure 8. The Raman spectra of bio-PA1010 untreated and thermally treated at 80 °C and 145 °C (a) and bio-PA1010 filled with LDH-5% nanocomposites untreated and thermally treated at 80 °C and 145 °C (b). We marked with * the bands that are less visible after the thermal treatment.
Chemosensors 11 00028 g008
Figure 9. The Raman spectra of C500 graphene fillers in the bio-PA1010 samples. Excitation laser: 532 nm.
Chemosensors 11 00028 g009
Figure 10. The Raman spectra of bio-PA1010 nanocomposite filled with GNP C500-4% thermally treated at 80 °C and 145 °C. We marked with * the bands that are less visible after the thermal treatment.
Chemosensors 11 00028 g010
Figure 11. Raman spectra of neat bio-PA1010 and filled with LDH, thermally treated at 80 °C and 145 °C, measured after 1 month (a) and of bio-PA1010 nanocomposite filled with graphene type C500-4% thermally treated at 80 °C and 145 °C, measured after 1 month (b).
Chemosensors 11 00028 g011
Table 1. Main Raman peaks positions of bio-PA1010 and nanocomposites and their proposed assignments. (Adapted with permission from Ref. [42], Copyright © 2016, The Author(s) and Ref. [44], Copyright © 1990 Published by Elsevier B.V.)
BIO-PA1010 (cm−1)Nanocomposite
(cm−1)
IntensityVibration ModesSpectral Assignment [39,42,44]
650 Amido IV C=O mode
853-Very StrongFinger printC-C stretching
931-StrongFinger printC-C stretching
1057-Medium C-O stretching
1127-Very Strong CH3 rocking
1292-StrongAmide IIC-H+C-O-C
-1335Very StrongD bandDouble resonance effects in sp2 carbon attributable of the presence of graphene
14481444Strong CH2 bending
-1570MediumG- bandRaman active mode of graphite
1632-WeakAmide IC=O mixed with NH deformation
-2704Strong Overtones C-H
2724-Medium Overtones C-H
28502847StrongG′ bandOvertones of G band C-H
29412941MediumG′ bandOvertones of G band
Disclaimer/Publisher’s Note: The statements, opinions and data contained in all publications are solely those of the individual author(s) and contributor(s) and not of MDPI and/or the editor(s). MDPI and/or the editor(s) disclaim responsibility for any injury to people or property resulting from any ideas, methods, instructions or products referred to in the content.

