Article

External-Cavity Quantum Cascade Laser-Based Gas Sensor for Sulfur Hexafluoride Detection

Laser Spectroscopy and Sensing Laboratory, Anhui University, Hefei 230601, China
*
Author to whom correspondence should be addressed.
Chemosensors 2023, 11(1), 30; https://doi.org/10.3390/chemosensors11010030
Submission received: 9 December 2022 / Revised: 26 December 2022 / Accepted: 27 December 2022 / Published: 30 December 2022

Abstract

:
The external-cavity quantum cascade laser (ECQCL) is an ideal mid-infrared (MIR) spectral light source for determining large molecular-absorption spectral features with broad transition bands. For this paper, a gas sensor system was developed using a broadband tunable ECQCL and a direct absorption spectroscopy detection scheme with a short path absorption cell of 29.6 cm. For spectral signal detection, a cheap and miniaturized quartz crystal tuning fork- (QCTF) based light detector was used for laser signal detection. The characteristics of the QCTF detector were theoretically simulated and experimentally observed. To demonstrate this sensing technique, sulfur hexafluoride (SF6) was selected as the analyte, which can be used as an effective indicator to identify fault-types of gas-insulated electrical equipment. Preliminary results indicated that a good agreement was obtained between experimentally observed data and reference spectra according to the NIST database and previous publications, and the gas sensor system showed a good linear response to SF6 gas concentration. Finally, Allan–Werle deviation analysis indicated that detection limits of 1.89 ppm for SF6 were obtained with a 1 s integration time, which can be further improved to ~0.38 ppm by averaging up to 131 s.

1. Introduction

Laser spectroscopy-based sensors are based upon the direct and indirect detection of laser light interacting with a target object, which inherently allows for trace gas non-invasive measurements with high precision and high accuracy, as well as fast response. To date, a variety of spectroscopic techniques, from absorbance, reflectance, transmission and scattering, to established methods such as direct absorption spectroscopy (DAS), wavelength modulation spectroscopy (WMS) or calibration-free WMS [1,2], photoacoustic spectroscopy (PAS), multi-pass cell-based laser absorption spectroscopy, cavity-enhanced absorption spectroscopy (CEAS) or integral cavity output spectroscopy (ICOS) or cavity ring-down spectroscopy (CRDS), and Raman spectroscopy have been widely used for most atmospheric molecule (including isotope) detection [3], and the sensitivity achieved by these spectroscopy methods can be comparable to that of traditional mass spectrometry [4]. Therefore, laser spectroscopy-based detection techniques and sensors have been attractive and powerful analysis tools for environmental sensing, defense and public security, biomedical, industrial and agricultural applications, etc. Among various laser light sources, quantum cascade lasers (QCLs), initially demonstrated at Bell Labs in 1994, are ideal light sources for spectroscopic applications, especially for external-cavity quantum cascade lasers (ECQCL), which cover almost the entire MIR spectral region (between 2.5 µm and 25 µm), and provide broadly spectral tuning intervals up to several hundred cm−1 by a single ECQCL module; thus, ECQCL-based spectroscopy sensors can be used for simultaneous detection of multiple light gas molecules with narrow-band absorption features or heavy molecules with broadband spectral signatures [5].
Sulfur hexafluoride (SF6) is a colorless and odorless gas with a relative molecular mass of 146.05, which is often used as an insulating gas in gas-insulated electrical equipment in power systems, such as gas-insulated switchgear, transmission pipes, gas circuit breakers, and other industrial electrical installations, mainly due to its stable chemical properties and excellent insulating and arc-extinguishing abilities. Usually, when insulation faults occur in gas-insulated electrical equipment, such as overheating and partial discharge, SF6 as an inert gas will decompose and react with other constituents (such as H2O, O2 and other substances containing carbon, hydrogen and oxygen) in insulating gas to generate various so-called fault characteristic gases (such as CO/CO2, SO2,/H2S/COS, SO2F2, HF, CF4, etc.), which can be used as effective indicators to identify fault types of gas-insulated electrical equipment. Recently, laser spectroscopy-based techniques and sensors have been proven as effective diagnostic tools for the non-destructive detection of fault characteristic gases with a high degree of sensitivity and selectivity.
For this paper, a spectroscopic sensor system based on a widely tunable ECQCL was developed for potential detection of gas-phase sulfur hexafluoride (SF6). For the spectral signal record, a cheap and miniaturized quartz crystal tuning fork- (QCTF) based light detector was integrated for laser signal detection. Preliminary evaluation of the ECQCL gas sensor system is discussed for quantitative and qualitative analysis of the gas-phase of sulfur hexafluoride. To realize spectroscopic detection of the gaseous sulfur hexafluoride (SF6), theoretical simulation was primarily made to select the optimal spectral window. The spectral characteristic of sulfur hexafluoride (SF6) within 500 cm−1 and 4000 cm−1 is simulated and provided in Figure 1 according to the NIST (National Institute of Standards and Technology) database [6]. For clarity, the inset is the spectral region within our ECQCL laser tuning range between 1150 cm−1 and 1450 cm−1. In this figure, the X-coordinate wavenumber (in units of cm−1) is defined as the reciprocal of the wavelength (in units of cm).

2. Theory of Laser Absorption Spectroscopy and Quartz Tuning Fork Detector

When detecting the concentration of chemical gases using optical spectroscopy sensors, the mutual absorption process between incident laser light and gas absorption species satisfies the well-known Lambert–Beer law, which is usually used for theoretical analysis and data processing [7]. When an excited laser with an emitting wavelength λ passes through a uniform gas medium, the relationship between the incident light intensity I 0 and transmitted light intensity I can be described with the Lambert–Beer law, and the corresponding mathematical expression is:
I λ = I 0 λ exp α λ CL
where α λ is the absorption coefficient of a specific substance at a wavelength λ ,   C is the concentration of the chemical gas to be measured, and L is the effective light path for the interaction between the laser light and the chemical gas. For evenly distributed gas molecules, the absorption coefficient, the absorption line shape, the line strength and the number of molecules satisfy:
α λ = ϕ λ λ 0 × S T × N T , P
where S T is the gas molecular absorption line intensity at temperature T(K),   N T , P is the number density of the gas molecule, and ϕ λ λ 0 is the gas molecular absorption line shape. Generally, the gas molecule number density N T , P can be described as:
N T , P = P P 0 × N 0 × T ref T
where N0 = 2.678 × 10¹⁹ (mol/cm3 ·atm) is the Avogadro constant, Tref is the reference temperature, which is usually taken as 276 K, and T is the actual laboratory temperature. P0 is the reference pressure, which is usually taken as 1 atm, and P is the actual sample gas pressure. The molecular absorption line shape usually depends on experimental conditions, especially for the broadening effects. Typically, both Doppler and collisional broadening effects are significant, and neither can be neglected, while natural broadening is much less significant than collisional broadening and can be completely neglected. Thus, a representative line shape that is a convolution of Doppler and collisional broadening called the Voigt function is widely used. Moreover, the gas molecular absorption line shape ϕ λ λ 0 satisfies the normalization condition:
0 ϕ λ λ 0 d λ = 1
According to the Lambert–Beer law described above, the integral absorbance area A of a single specific molecule transition can be described as:
A = + a λ Ld λ = + ϕ λ λ 0 S T N T , P Ld λ
When the relevant experimental conditions (such as temperature T, pressure P, optical path L, and spectral line parameters) are known and the molecule absorption spectrum is measured, the number or concentration of absorption gas molecules can be calculated by combing with a line shape-fitting algorithm and Equation (5).
Moreover, the quartz tuning fork is used as a light detector by employing its resonant effect and piezoelectric effect [8]. The high resonant frequency (typically ~32.768 kHz) allows for a good noise suppression effect. To realize the laser spectral signal detection, the excited laser source should be pulsed or modulated for a continuous-wave laser, and a pulsed repetitive rate or modulated frequency will be set to match with the resonant frequency of the quartz tuning fork detector. Because of the same frequency condition, the transmitted light beam can excite the resonant effect of the quartz tuning fork, and the mechanical resonance process of the quartz tuning fork will produce a piezoelectric current due to its piezoelectric effect. The piezoelectric current can be measured and converted into a voltage signal using a low-noise preamplifier. Theoretically, the mechanical model of the quartz tuning fork can be simplified as a second-order damping-mass-spring system; its effective mass m can be expressed by its own density ρ , length l , width w , and thickness h . The mathematical relationship between mass and geometric parameters is expressed as follows:
m = 0.247 ρ × l w h
Moreover, the relationship between the resonance frequency of the quartz tuning fork and the mechanical parameters is:
f = 1 2 π k m = 1.015 w 2 π l 2 Y ρ
where Y represents Young’s modulus of the quartz crystal and k represents the elastic coefficient of the quartz crystal, which is described as:
k = 1 4 Y h w 3 l 3
When the relevant parameters of the quartz tuning fork are constant, the corresponding resonance frequency of the quartz tuning fork can be calculated and analyzed using finite element simulation software. Moreover, the quality factor Q (i.e., Q-value) is another key parameter to judge the performance of the quartz tuning fork-based detector, which expresses the loss of vibration energy or the amount of the damping process. The Q-value can be determined from the experimentally measured resonant profile according to the following equation:
Q = f 0 Δ f
where Δ f is the frequency bandwidth (full width at half maximum) at 1 / 2 of the maximum signal amplitude, typically a few Hz.

3. Experimental Details

Figure 2 shows the schematic diagram of the ECQCL and QCTF detector-based gas detection system. The laser source that we used is a pulsed room-temperature (RT) ECQCL (Block Engineering, Southborough, MA, USA) with a tuning range of 1130–1437 cm−1 (or 6.96–8.85 μm) with an average output power between 0.5 and 20 mW, since the ECQCL power shows significant dependence on both its pulse repetition rate and pulse width [9]; therefore, the maximum pulse width of 350 ns was selected. However, the pulse repetition rate is set to match the resonant frequency of the QCTF detector for realizing laser signal detection. The ECQCL is automatically controlled by a flexible and user-friendly software interface, an internal trigger controls the pulses at regular intervals, and a sync-out signal can be utilized to trigger other external laboratory equipment. A homemade, glass, gas sample cell with an optical path length of ~29.6 cm was used for spectral measurements. The laser beam is directly coupled into the gas cell and then collimated and focused onto the detector using a CaF2 lens with a focal length of 50 mm. Unlike the traditional spectroscopy system, a standard mid-infrared MCT (mercury cadmium telluride) detector is commonly used. Here a quartz crystal tuning fork- (QCTF) based photodetector was employed for recording laser spectral signals, mainly based on its piezoelectric effect and resonant properties. Prior to the experiment, details of the QCTF detector characteristics were investigated theoretically and experimentally, which will be described in the next section. Finally, a home-made LabVIEW program-integrated data acquisition (NI USB-6259, 1.25 MHz sampling rate) and signal processing analysis was used for sensor system control and signal acquisition.

4. Results and Discussion

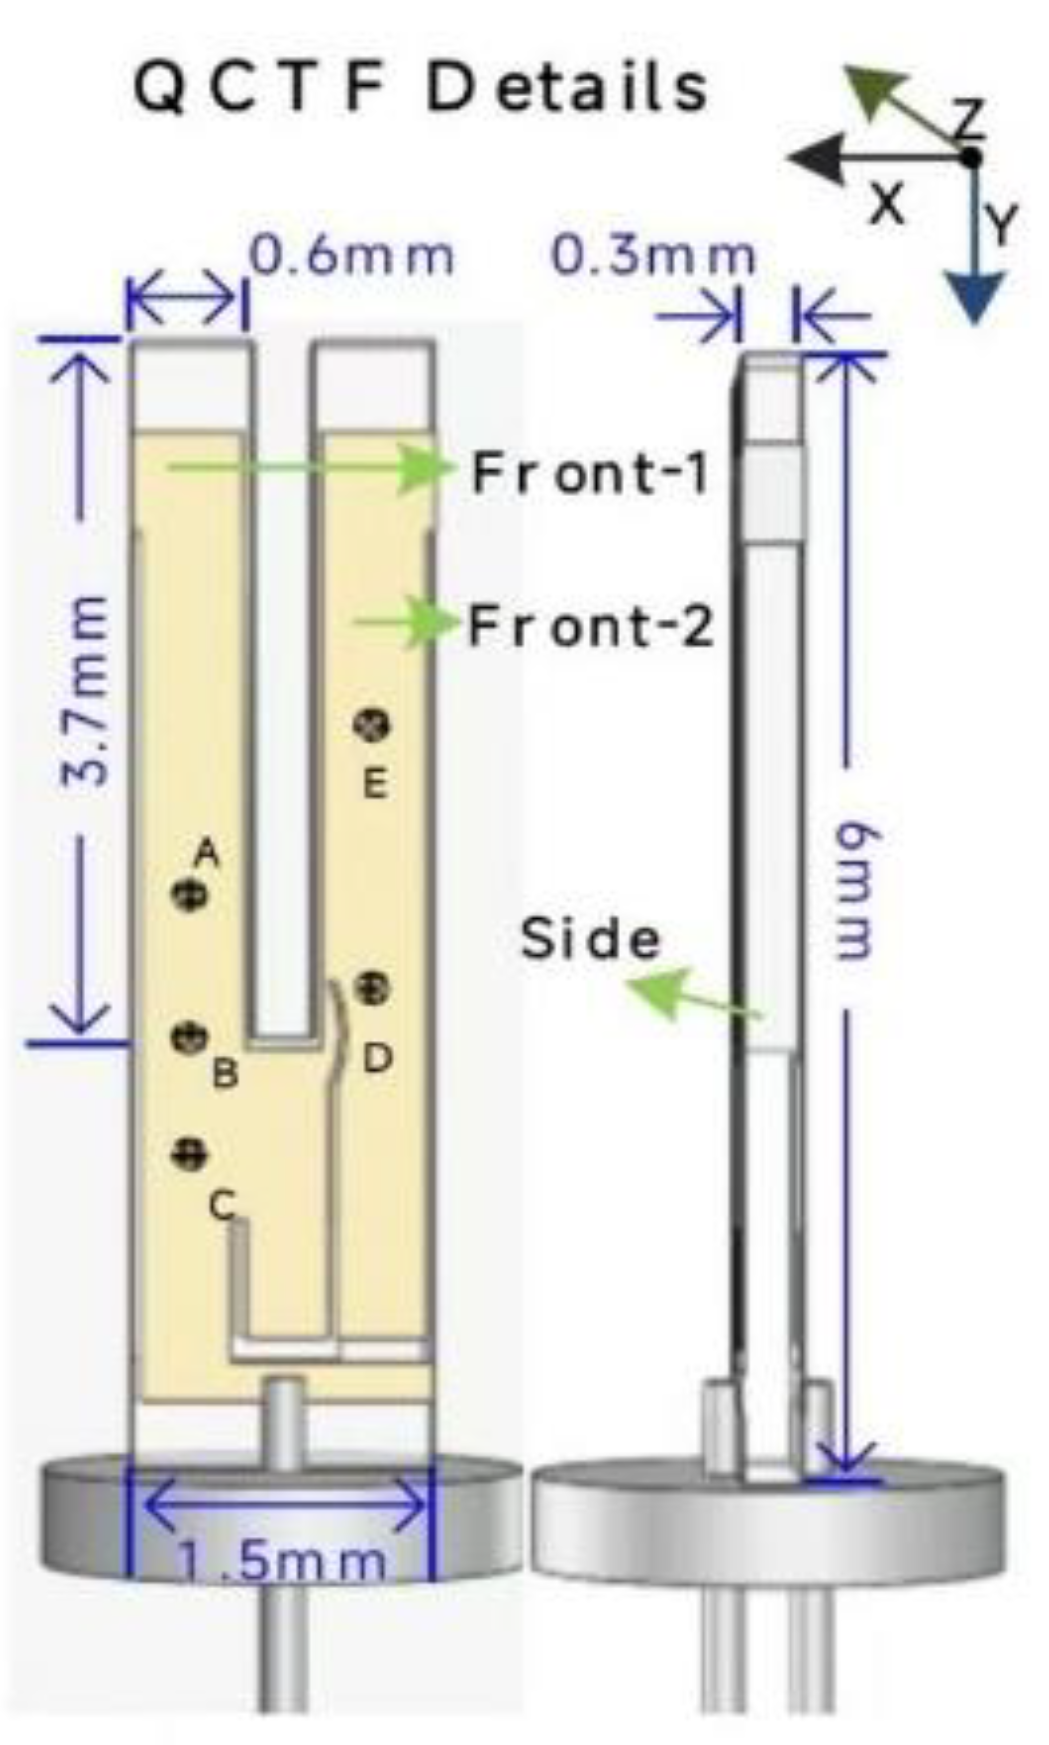
Before gas detection experiments, the resonant frequency of the QCTF detector is first simulated by establishing a physical model combing using the COMSOL finite element analysis method. The establishment of the QCTF resonant model includes the setting of tuning fork geometric parameters and material parameters. The QCTF fork arm simulated in this experiment is 3.7 mm long and 0.6 mm wide. The entire physical dimensions of the QCTF are 6 mm long, 1.5 mm wide and 0.3 mm thick. The QCTF physical diagram is shown in Figure 3. For theoretical simulation using finite element analysis, the simple mechanical model of the QCTF is established as shown in Figure 4. The main component of the material is SiO2; an elastic modulus of 70 Gpa, a Poisson’s ratio of 0.17 and a density of 2300 kg × m−3 are used for calculation. The established QCTF model has a good symmetrical structure and reasonable parameter settings, which makes the established model very close to the experimental conditions.
In the theoretical simulation, the COMSOL finite element method is used to decompose a series of continuous solution domains into multiple groups of discrete small regions, and the approximate function is used in each small region to represent the unknown field function for solving for the solution domain. The approximate function is generally expressed using the numerical interpolation function of the original unknown field function and its derivatives at each node in a small region. By changing a series of continuous, infinite degrees of freedom problems into a discrete, finite degree of freedom problems, the whole simulation process can be implemented quickly. When simulating the resonant frequency of the QCTF, we found that the vibration models of the QCTF can be divided into symmetrical vibrations and asymmetric vibrations [10], and only the symmetrical vibration model is the effective model for producing the piezoelectric effect; thus, the symmetrical vibration model is investigated in detail. Through the COMSOL finite element analysis of the first six resonant models of the QCTF, it is found that the fourth-order resonant model is the symmetrical vibration; the fork arm of the QCTF first moves outward and then inward, as shown in Figure 5. For this resonant model, the calculated resonant frequency is about 32,406 Hz.
After the theoretical simulation, the resonant frequency response characteristics of the QCTF were further investigated experimentally to better understand their photoelectric conversion efficiency. As described above, the QCTF-based photoelectric detector was used for collecting laser beams by employing its resonant effect and piezoelectric effect. The laser signal of the QCTF was first recorded in the time domain, and then its frequency spectrum was calculated using a self-developed fast Fourier transform (FFT) algorithm, and the peak value of frequency spectrum was finally extracted as the signal amplitude. For example, the QCTF signal-processing procedure is demonstrated in Figure 6. According to this signal-processing procedure, the experimentally measured resonant profile of the QCTF detector is shown in Figure 7, and a Lorentzian line-shape mode was used to fit the experimental data. The analysis indicated that the QCTF used in this work had a resonant frequency of 32,753.4 Hz in ambient air and a quality factor Q-value of 6468.65.
To further evaluate the gas sensor system, sulfur hexafluoride gas was used for the relevant experiments. Various sulfur hexafluoride samples with different concentrations were prepared for experimental tests. The whole experiment was carried out at room temperature and at a standard atmospheric pressure. At the beginning of the experiment, the gas sample cell was extracted to a vacuum environment to record the background signal for signal normalization processing analysis. Then, the sulfur hexafluoride sample was filled and diluted for signal spectra. In this study, the ECQCL laser emitted from 1130 cm−1 to 1440 cm−1, with a step frequency of 1 cm−1/s. Experimental data were synchronously collected with an approximate 1 Hz sampling rate. To improve the spectral signal-to-noise ratio (SNR), the repetition rate of the ECQCL was set to match the QCTF resonance frequency (i.e., 32,753.4 Hz) as closely as possible, so as to achieve the maximum output power. According to the parameters mentioned above, it takes about 310 s to finish the whole wavelength tuning scan. Figure 8 (upper panel) shows the absorption spectra of sulfur hexafluoride gas under different concentrations. By comparing this to the reference spectrum in the NIST database as shown in Figure 1, the experimental data indicate that two distinct absorption bands of sulfur hexafluoride near 1257 cm−1 and 1390 cm−1, respectively, have been confirmed. However, a weak absorption peak near 1355 cm−1 is not found in the experimental data. Note that this weak absorption peak near 1355 cm−1 is also not found in a previous publication reported by Chapados et al. [11]. Moreover, the sensor system characteristic of concentration response was also evaluated by selecting the absorption peaks at 1257 cm−1 and 1390 cm−1, respectively, as shown in Figure 8 (bottom panel). A linear regression algorithm was used to analyze the experimental data. As the theory predicted, a good linear dependence of the absorption signal at 1257 cm−1 and 1390 cm−1 on SF6 concentration was obtained, with a regression coefficient R2 of 0.9997 and 0.99264, respectively. The results indicate that the ECQCL gas sensor system is proportional to the concentration of the absorbing molecule, and the calibration curve can be used for determining the gas concentration of an unknown sample.
To evaluate the stability and the sensitivity of this system, the Allan–Werle deviation analysis was used for experimental data [12,13]. It was conducted on the continuous measurement of spectral signal at 1257 cm−1, as shown in Figure 9a. The Allan–Werle deviation plot presented in Figure 9b indicates that the sensitivity of the developed SF6 gas sensor system is 1.89 ppm at 1 s averaging time and the measurement sensitivity can be improved to 0.38 ppm with an averaging time of 131 s.

5. Conclusions

For this paper, a gas-sensor system based on a mid-infrared ECQCL laser and a cheap and miniaturized QCTF detector has been developed for identifying the indicator of fault-types of gas-insulated electrical equipment. To demonstrate this sensing technique, a sulfur hexafluoride (SF6) molecule was selected as the analyte. Preliminary theoretical analysis and experimental evaluation has been performed to measure the sulfur hexafluoride absorption spectroscopy. As a result, a good agreement was obtained between the experimentally observed data and the reference spectra by referring to the NIST database and previous publications. As expected, a good linear dependence of the absorption signal at 1257 cm−1 and 1390 cm−1 of SF6 concentration was obtained, with a regression coefficient R2 of 0.9997 and 0.9926, respectively. Finally, Allan–Werle deviation analysis was used for stability and sensitivity assessment, and the result indicated that a detection limit of 1.89 ppm for SF6 was obtained with a 1 s integration time, which can be further improved to ~0.38 by averaging up to 131 s. Optimization of the experimental scheme is ongoing; the sensitivity can be significantly improved by combing with a multi-pass absorption cell or a high-precision optical cavity [14,15], as well as other high-sensitivity spectroscopy techniques, such as photoacoustic spectroscopy (PAS) [16]. Moreover, as can be seen from Figure 1, the stronger absorption spectral region will provide higher detection sensitivity; therefore, the external cavity quantum cascade laser used here can be upgraded to other central wavenumbers (such as 950 cm−1) by replacing its internal emitting chip. The developed gas sensor system is expected to be an effective analysis tool for non-destructive detection of the fault characteristic gases with high sensitivity and selectivity.

Author Contributions

Conceptualization, X.P. and J.L.; methodology, X.P. and J.L.; software, Y.Z.; validation, X.P., Y.Z. and J.Z.; formal analysis, J.Z.; investigation, Y.Z.; resources, Y.Z.; data curation, M.Z.; writing—original draft preparation, X.P.; writing—review and editing, X.P. and J.L. All authors have read and agreed to the published version of the manuscript.

Funding

This research was funded by the National Natural Science Foundation of China (41875158),the Key lab of Opto-electronic Information Technology of the Ministry of Education, Tianjin University (2022KFKT011) and the Innovation Training Program for college students of Anhui University (S202210357549).

Data Availability Statement

Not applicable.

Acknowledgments

The authors gratefully acknowledge the financial support from the National Natural Science Foundation of China (41875158), the Key lab of Opto-electronic Information Technology of the Ministry of Education, Tianjin University (2022KFKT011) and the Innovation Training Program for college students of Anhui University (S202210357549).

Conflicts of Interest

The authors declare no conflict of interest.

References

  1. Liu, N.; Xu, L.; Zhou, S.; Zhang, L.; Li, J. Soil respiration analysis using a mid-infrared quantum cascade laser and calibration-free WMS-based dual-gas sensor. Analyst 2021, 146, 3841–3851. [Google Scholar] [CrossRef] [PubMed]
  2. Li, J.; Parchatka, U.; Fischer, H. Development of field-deployable real time QCL spectrometer for simultaneous detection of ambient N2O and CO. Sens. Actuators B 2013, 182, 659–667. [Google Scholar] [CrossRef]
  3. Li, J.; Chen, W.; Fischer, H. Quantum cascade laser spectrometry techniques: A new trend in atmospheric chemistry. Appl. Spectrosc. Rev. 2013, 48, 523–559. [Google Scholar] [CrossRef]
  4. KöSter, J.R.; Well, R.; Tuzson, B.; Bol, R.; Dittert, K.; Giesemann, A.; Emmenegger, L.; Manninen, A.; Cárdenas, L.; Mohn, J. Novel laser spectroscopic technique for continuous analysis of N2O isotopomers-application and intercomparison with isotope ratio mass spectrometry. Rapid Commun. Mass Spectrom. 2013, 27, 216–222. [Google Scholar] [CrossRef] [PubMed] [Green Version]
  5. Li, J.; Liu, N.; Ding, J.; Zhou, S.; He, T.; Zhang, L. Piezoelectric effect-based detector for spectroscopic application. Opt. Lasers Eng. 2019, 115, 141–148. [Google Scholar] [CrossRef]
  6. National Institute of Standards and Technology (NIST) Database. Available online: https://www.nist.gov (accessed on 21 July 2009).
  7. Li, J.; Yu, B.; Zhao, W.; Chen, W. A review of signal enhancement and noise reduction techniques for Tunable Diode Laser Absorption Spectroscopy. Appl. Spectrosc. Rev. 2014, 49, 666–691. [Google Scholar] [CrossRef]
  8. Sun, J.; Deng, H.; Liu, N.; Wang, H.; Yu, B.; Li, J. Mid-infrared gas absorption sensor based on a broadband external cavity quantum cascade laser. Rev. Sci. Instrum. 2016, 87, 123101. [Google Scholar] [CrossRef] [PubMed]
  9. Liu, N.; Zhou, S.; Zhang, L.; Yu, B.; Fischer, H.; Ren, W.; Li, J. Standoff detection of VOCs using external cavity quantum cascade laser spectroscopy. Laser Phys. Lett. 2018, 15, 085701. [Google Scholar] [CrossRef]
  10. Cheng, G.; Cao, Y.; Liu, K.; Cao, Y.; Tian, X.; Chen, J.; Yang, G.; Gao, X. Modal Simulation Calculation and Research of Tuning Fork Based on QEPAS System. Spectrosc. Spectr. Anal. 2019, 39, 31–38. [Google Scholar]
  11. Chapados, C.; Birnbaum, G. Infrared absorption of SF6 from 32 to 3000 cm−1 in the gaseous and liquid states. J. Mol. Spectrosc. 1988, 132, 323–335. [Google Scholar] [CrossRef]
  12. Werle, P.W.; Mazzinghi, P.; D’Amato, F.; De Rosa, M.; Maurer, K.; Slemr, F. Signal processing and calibration procedures for in situ diode-laser absorption spectroscopy. Spectrochim. Acta Part A 2004, 60, 1685–1705. [Google Scholar] [CrossRef] [PubMed]
  13. Werle, P.; Mucke, R.; Slemr, F. The limits of signal averaging in atmospheric trace-gas monitoring by tunable diode-laser absorption spectroscopy (TDLAS). Appl. Phys. B 1993, 57, 131–139. [Google Scholar] [CrossRef]
  14. Wan, F.; Zhou, F.; Hu, J.; Wang, P.; Wang, J.; Chen, W.; Zhu, C.; Liu, Y. Highly Sensitive and Precise Analysis of SF6 Decomposition Component CO by Multi-comb Optical-feedback Cavity Enhanced Absorption Spectroscopy with a 2.3 μm Diode Laser. Sci. Rep. 2019, 9, 9690. [Google Scholar] [CrossRef] [PubMed] [Green Version]
  15. Waßmuth, B.; Fuchs, G.; Zimmermann, H.; Giesen, T. Concept and application of a linearized ring multipass optics configuration. Appl. Opt. 2021, 60, 10273–10281. [Google Scholar] [CrossRef] [PubMed]
  16. Rocha, M.; Sthel, M.; Lima, G.; Silva, M.; Schramm, D.; Miklós, A.; Vargas, H. A Sulfur Hexafluoride Sensor Using Quantum Cascade and CO2 Laser-Based Photoacoustic Spectroscopy. Sensors 2010, 10, 9359–9368. [Google Scholar] [CrossRef] [PubMed]
Figure 1. Sulfur hexafluoride absorption spectra simulated using the NIST database.
Chemosensors 11 00030 g001
Figure 2. The schematic diagram of the ECQCL and QCTF-based gas detection system.
Chemosensors 11 00030 g002
Figure 3. Structural model diagram of the QCTF.
Chemosensors 11 00030 g003
Figure 4. The established QCTF model.
Chemosensors 11 00030 g004
Figure 5. Vibration mode distribution characteristics.
Chemosensors 11 00030 g005
Figure 6. The QCTF signal-processing procedure.
Chemosensors 11 00030 g006
Figure 7. The measured QCTF resonant profile at ambient air and the Lorentz fitting.
Chemosensors 11 00030 g007
Figure 8. Experimentally measured SF6 spectra (upper panel) and signal amplitude at 1250 cm−1 and 1390 cm−1 as a function of sample concentrations (bottom panel), and the corresponding linear fit.
Chemosensors 11 00030 g008
Figure 9. (a) Time series concentration of SF6 continuously measured standard gas sample, (b) Allan–Werle deviation as a function of signal averaging time.
Chemosensors 11 00030 g009
Disclaimer/Publisher’s Note: The statements, opinions and data contained in all publications are solely those of the individual author(s) and contributor(s) and not of MDPI and/or the editor(s). MDPI and/or the editor(s) disclaim responsibility for any injury to people or property resulting from any ideas, methods, instructions or products referred to in the content.