Article

Ultrafast Electrochemical Self-Doping of Anodic Titanium Dioxide Nanotubes for Enhanced Electroanalytical and Photocatalytic Performance

1
Department of Science and High Technology, University of Insubria, Via Valleggio 11, 22100 Como, Italy
2
Norwegian Institute for Water Research (NIVA), Økernveien 94, 0579 Oslo, Norway
*
Author to whom correspondence should be addressed.
Chemosensors 2023, 11(11), 560; https://doi.org/10.3390/chemosensors11110560
Submission received: 11 October 2023 / Revised: 4 November 2023 / Accepted: 8 November 2023 / Published: 10 November 2023
(This article belongs to the Special Issue Advanced Electrochemical Sensors or Biosensors Based on Nanomaterial)

Abstract

:
This study explores an ultrarapid electrochemical self-doping procedure applied to anodic titanium dioxide (TiO2) nanotube arrays in an alkaline solution to boost their performance for electroanalytical and photocatalytic applications. The electrochemical self-doping process (i.e., the creation of surface Ti3+ states by applying a negative potential) is recently emerging as a simpler and cleaner way to improve the electronic properties of TiO2 compared to traditional chemical and high-temperature doping strategies. Here, self-doping was carried out through varying voltages and treatment times to identify the most performing materials without compromising their structural stability. Interestingly, cyclic voltammetry characterization revealed that undoped TiO2 shows negligible activity, whereas all self-doped materials demonstrate their suitability as electrode materials: an outstandingly short 10 s self-doping treatment leads to the highest electrochemical activity. The electrochemical detection of hydrogen peroxide was assessed as well, demonstrating a good sensitivity and a linear detection range of 3–200 µM. Additionally, the self-doped TiO2 nanotubes exhibited an enhanced photocatalytic activity compared to the untreated substrate: the degradation potential of methylene blue under UV light exposure increased by 25% in comparison to undoped materials. Overall, this study highlights the potential of ultrafast electrochemical self-doping to unleash and improve TiO2 nanotubes performances for electroanalytical and photocatalytic applications.

Graphical Abstract

1. Introduction

The quest for advanced materials with multifunctional capabilities has been a driving force in modern scientific research, particularly in the domains of electro- and photo- chemistry [1,2]. In this pursuit, titanium dioxide (TiO2) nanotubes have emerged as a remarkable candidate, exhibiting exceptional potential for various applications, owing to their unique structural and electronic properties [3,4,5]. The utilization of TiO2 nanotubes in photo-electrochemistry has garnered substantial attention due to their high surface area, excellent chemical stability, and the ability to harness solar energy [6,7]. As a matter of fact, this one-dimensional nanostructure finds application for hydrogen production [8,9], environmental remediation [10,11,12], supercapacitor electrodes [13] and sensing applications [14,15]. However, to fully exploit their potential both in electro- and photocatalysis, it is imperative to explore strategies for enhancing their performance, and one promising avenue is the doping process [16,17,18].
Doping, i.e., the introduction of foreign elements or compounds into a host material or the chemical modification of existing species, has proven to be an effective means of tailoring the physicochemical properties of materials to meet specific application requirements [18,19]. In the case of TiO2 nanotubes, doping can influence their charge carrier dynamics, band structure, and catalytic activity, thereby augmenting their performance in electroanalysis and photocatalysis. Doping strategies, such as nitrogen [20], carbon [21], or metal doping [22], have the potential to modify the electronic structure of TiO2 nanotubes, enhancing their ability to capture, transfer, and utilize charge carriers in electrochemical and photocatalytic reactions.
An interesting and increasingly emerging approach to achieve these advantages is via the self-doping process, i.e., the introduction of surface oxygen defects by forming Ti3+ sites through reduction processes [23]. This phenomenon can be induced using various strategies, among which include hydrogenation [24], hydrothermal reactions [25], and alkaline metal reduction [26]. All these processes, however, have the drawback of operating under very harsh conditions in terms of temperature and pressure, making the treatment complex, and possibly leading to structural modification of the material.
The electrochemical self-doping has recently emerged as a simpler and cleaner way to boost the photoelectrochemical properties of supported materials such as anodic TiO2 nanotube arrays [27,28,29,30,31]. Electrochemical self-doping involves the controlled application of a negative potential to modify the surface of TiO2 via reduction processes, ultimately improving their electroanalytical and photocatalytic performance. The irreversible reduction in Ti4+ into Ti3+ sites through protons intercalation phenomena leads in fact to the creation of dopant states, inducing an almost metallic behavior in the material, strongly promoting the electrical conductivity of the semiconductor and introducing intermediate energy levels within the band gap [27,28,29,30]. These factors enhance the photocatalytic activity by extending the functionality of TiO2 under visible light and by activating this semiconductor for solely electrochemical process. Various experimental conditions are currently explored in the electrochemical self-doping of TiO2 nanotubes, and one of the main drawbacks is the time-consuming nature of the process (frequently requiring tens of minutes [32,33,34,35]), and the challenges associated with achieving uniform and controlled doping levels. Developing a rapid strategy is crucial, as it can significantly reduce the processing time, making the production of self-doped TiO2 nanotubes more efficient and scalable. This accelerated approach is vital for advancing various applications, such as photocatalysis and sensing, where timely production is essential for practical implementation and commercial viability.
Within such a framework, in this article, we provide an exploration of an ultrafast electrochemical activation/doping procedure in alkaline solution to enhance the performance of TiO2 nanotubes for both electroanalytical and photocatalytic applications. First, we performed a setup of suitable doping conditions: we assessed different voltages and durations of the electrochemical process to obtain doped materials without compromising the stability of the nanostructure. Electrochemical characterization helped us to identify the best self-doping conditions. Particular attention was paid to exploring very short cathodic modification times to make the self-doping process simpler and faster. We then applied the most promising materials for two potential applications of this class of materials: the electrochemical detection of hydrogen peroxide and the photocatalytic degradation of methylene blue.

2. Materials and Methods

2.1. TiO2 Nanotubes Production

Titanium dioxide nanotubes were synthesized through the anodization of metallic titanium foils (anodized area = 1.5 cm2), using a two-electrode configuration. An NPS1230W potentiostat (Shenzhen Wanptek Electronic Co., Ltd., Shenzen, China) and a graphite counter-electrode placed at 2.0 cm from the Ti foil were employed for this purpose.
The anodization process was carried out in an electrolytic solution, consisting of ethylene glycol (Merck Life Science S.r.l., Milan, Italy), to which ammonium fluoride (0.09 M) and ultrapure water (2% v/v) were added. Ultrapure water with a resistivity of 18.2 MΩ/cm² and a total organic carbon (TOC) content below 5 ppb was obtained via the Sartorius Arius® mini purification system (Sartorius Italy S.r.l., Varedo, Italy). The anodization process was conducted by applying a potential of +40 V for 60 min.
To convert the amorphous TiO2 obtained during anodization into an active crystalline phase for efficient photo- and electrochemical processes, the material underwent a thermal treatment with the following temperature gradients:
  • Heating at 30 °C/min until reaching 420 °C.
  • Heating at 5 °C/min until reaching 450 °C.
  • Maintaining an isothermal condition at 450 °C for 1 h.
  • The heat treatment was conducted in a quartz tubular furnace in the presence of air. Following calcination, the samples were allowed to cool naturally within the furnace and were removed once they reached room temperature.
  • The entire procedure to fabricate TiO2 was optimized in a previous work [36]. As-prepared materials’ results mechanically stable and no issues were related to air exposure.

2.2. Electrochemical Self-Doping of TiO2 Nanotubes and Preliminary Characterization

For the electrode self-doping process, a solution of monohydrated sodium hydrogen phosphate (Na2HPO4 × H2O 0.1 M) at pH 10.00 ± 0.02 was prepared by adjusting the pH using 1 M NaOH. The choice of this electrolyte is based on the work by Bessegato et al. [27], who optimized these conditions. Self-doping was conducted using an Amel polarograph (Model 4330, AMEL S.r.l., Milan, Italy) with VApeak 2018 software (release date: June 2021). The anodized and calcined TiO2 electrode was immersed in 7 mL of the buffer solution and used as the working electrode in a three-electrode system alongside a platinum electrode (counter-electrode) and an Ag/AgCl electrode (reference electrode, containing a 3 M KCl solution). All potentials mentioned here are expressed as relative to Ag/AgCl. The electrical contact was easily ensured by clipping the upper portion of the electrode, which is in its original metallic titanium state.
Tested activation conditions included the potential ranging between −2.5 V and −1.5 V and the duration ranging between 2 s and 30 min. Prior to the activation/reduction process, the measurement cell was purged under nitrogen for 5 min. The solution was continuously stirred using a magnetic stir bar (300 rpm).
All materials prior and after electrochemical self-doping were characterized using a Philips® (Amsterdam, The Netherlands) field emission gun scanning electron microscope (ESEM FEG XL30), with a 20 keV beam under high-vacuum atmosphere. X-ray diffraction (XRD) data were recorded on a Siemens D5000 system using Cu-Kα radiation, 40 kV, 40 mA, with a step of 0.03° (2θ) and a scanning speed of 0.06°·s−1.

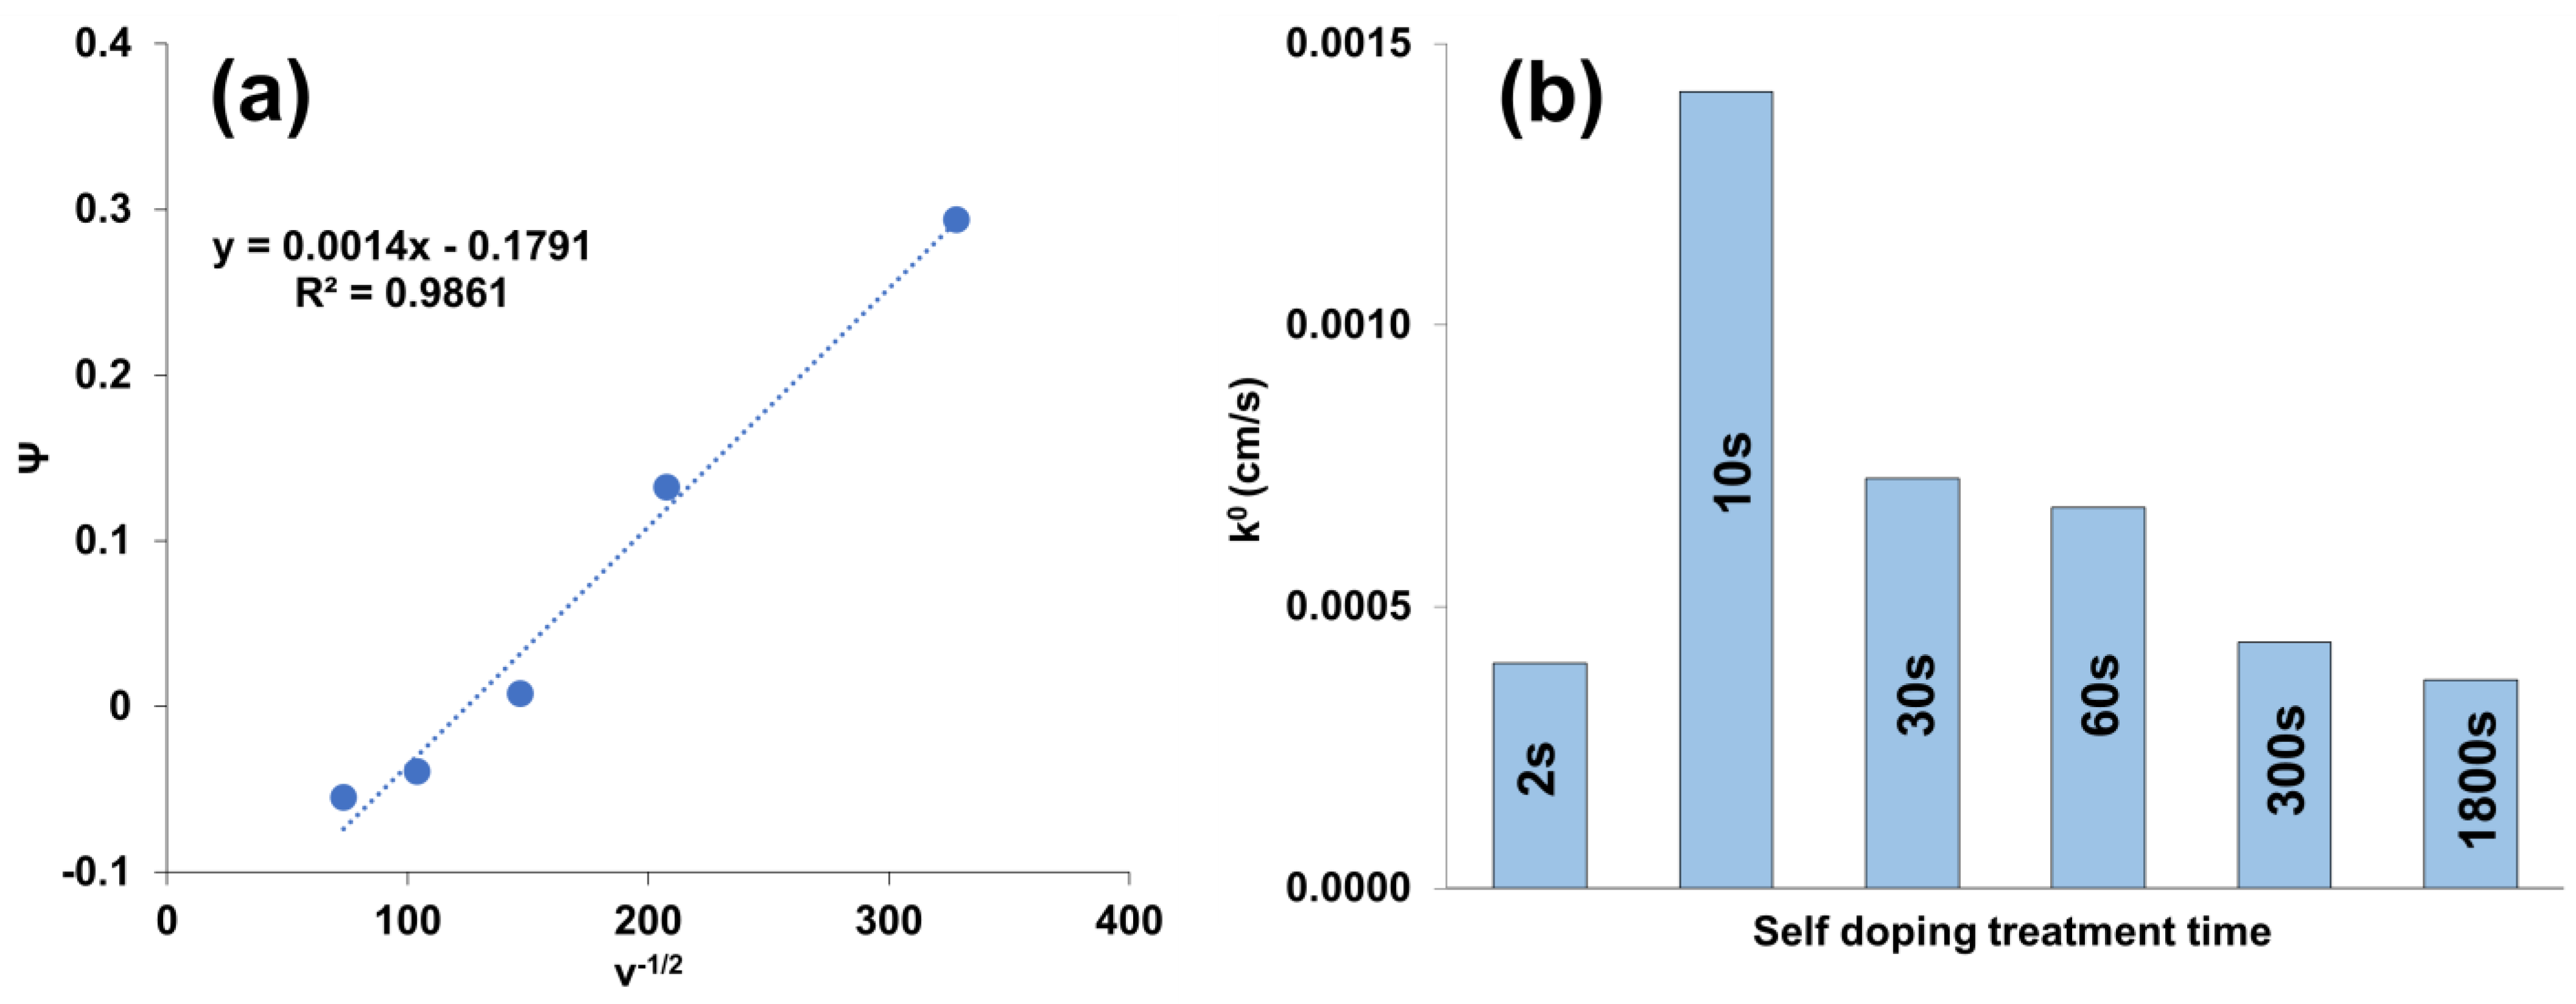
2.3. Electrochemical Characterization

The electrochemical characterization of self-doped and undoped materials was performed using an Amel polarograph (Model 4330, AMEL S.r.l., Milan, Italy) and the acquired data were processed with VApeak 2018 software. All measurements were conducted by filling the measurement cell with approximately 7 mL of degassed solution under nitrogen flow. Stirring of the solution was accomplished using a magnetic stir bar (300 rpm).
For electrode characterization, cyclic voltammetry measurements were carried out using a solution consisting of 5 mM K3[Fe(CN)6] (Carlo Erba reagents; for analysis–ACS reagent, Carlo Erba, Milan, Italy) and 100 mM KNO3 (Carlo Erba reagents; ACS-ISO—for analysis). Measurements were conducted at scan rates varying from 10 mV/s to 200 mV/s (with a step potential of 5 mV and a step time ranging from 500 ms to 25 ms, respectively) within the potential range of 900 mV to −600 mV. Measurements carried out at different scan rates were used to estimate the heterogeneous standard kinetic constant (k0). The peak-to-peak separation distance (ΔEp) was used for the calculation of k0, following the method described by Lavagnini et al. [37]. In more detail, the following equation was employed:
Ψ = k0 [DnvF/(RT)]1/2
where:
  • F (Faraday’s constant) = 96,485 C/mol;
  • D (diffusion coefficient) = 7.6 × 10⁻⁶ cm2/s;
  • R (gas constant) = 8.314 J/K × mol;
  • T (temperature) = 298.15 K;
  • n = Number of electrons exchanged;
  • v = Scan rate (mV/s).
Specifically, the kinetic dimensionless parameter Ψ was calculated using this formula: Ψ = (−0.6288 + 0.0021X)/(1 − 0.017X), where X represents ΔEp in mV.
k0 was determined graphically by linearizing Ψ against v−1/2.

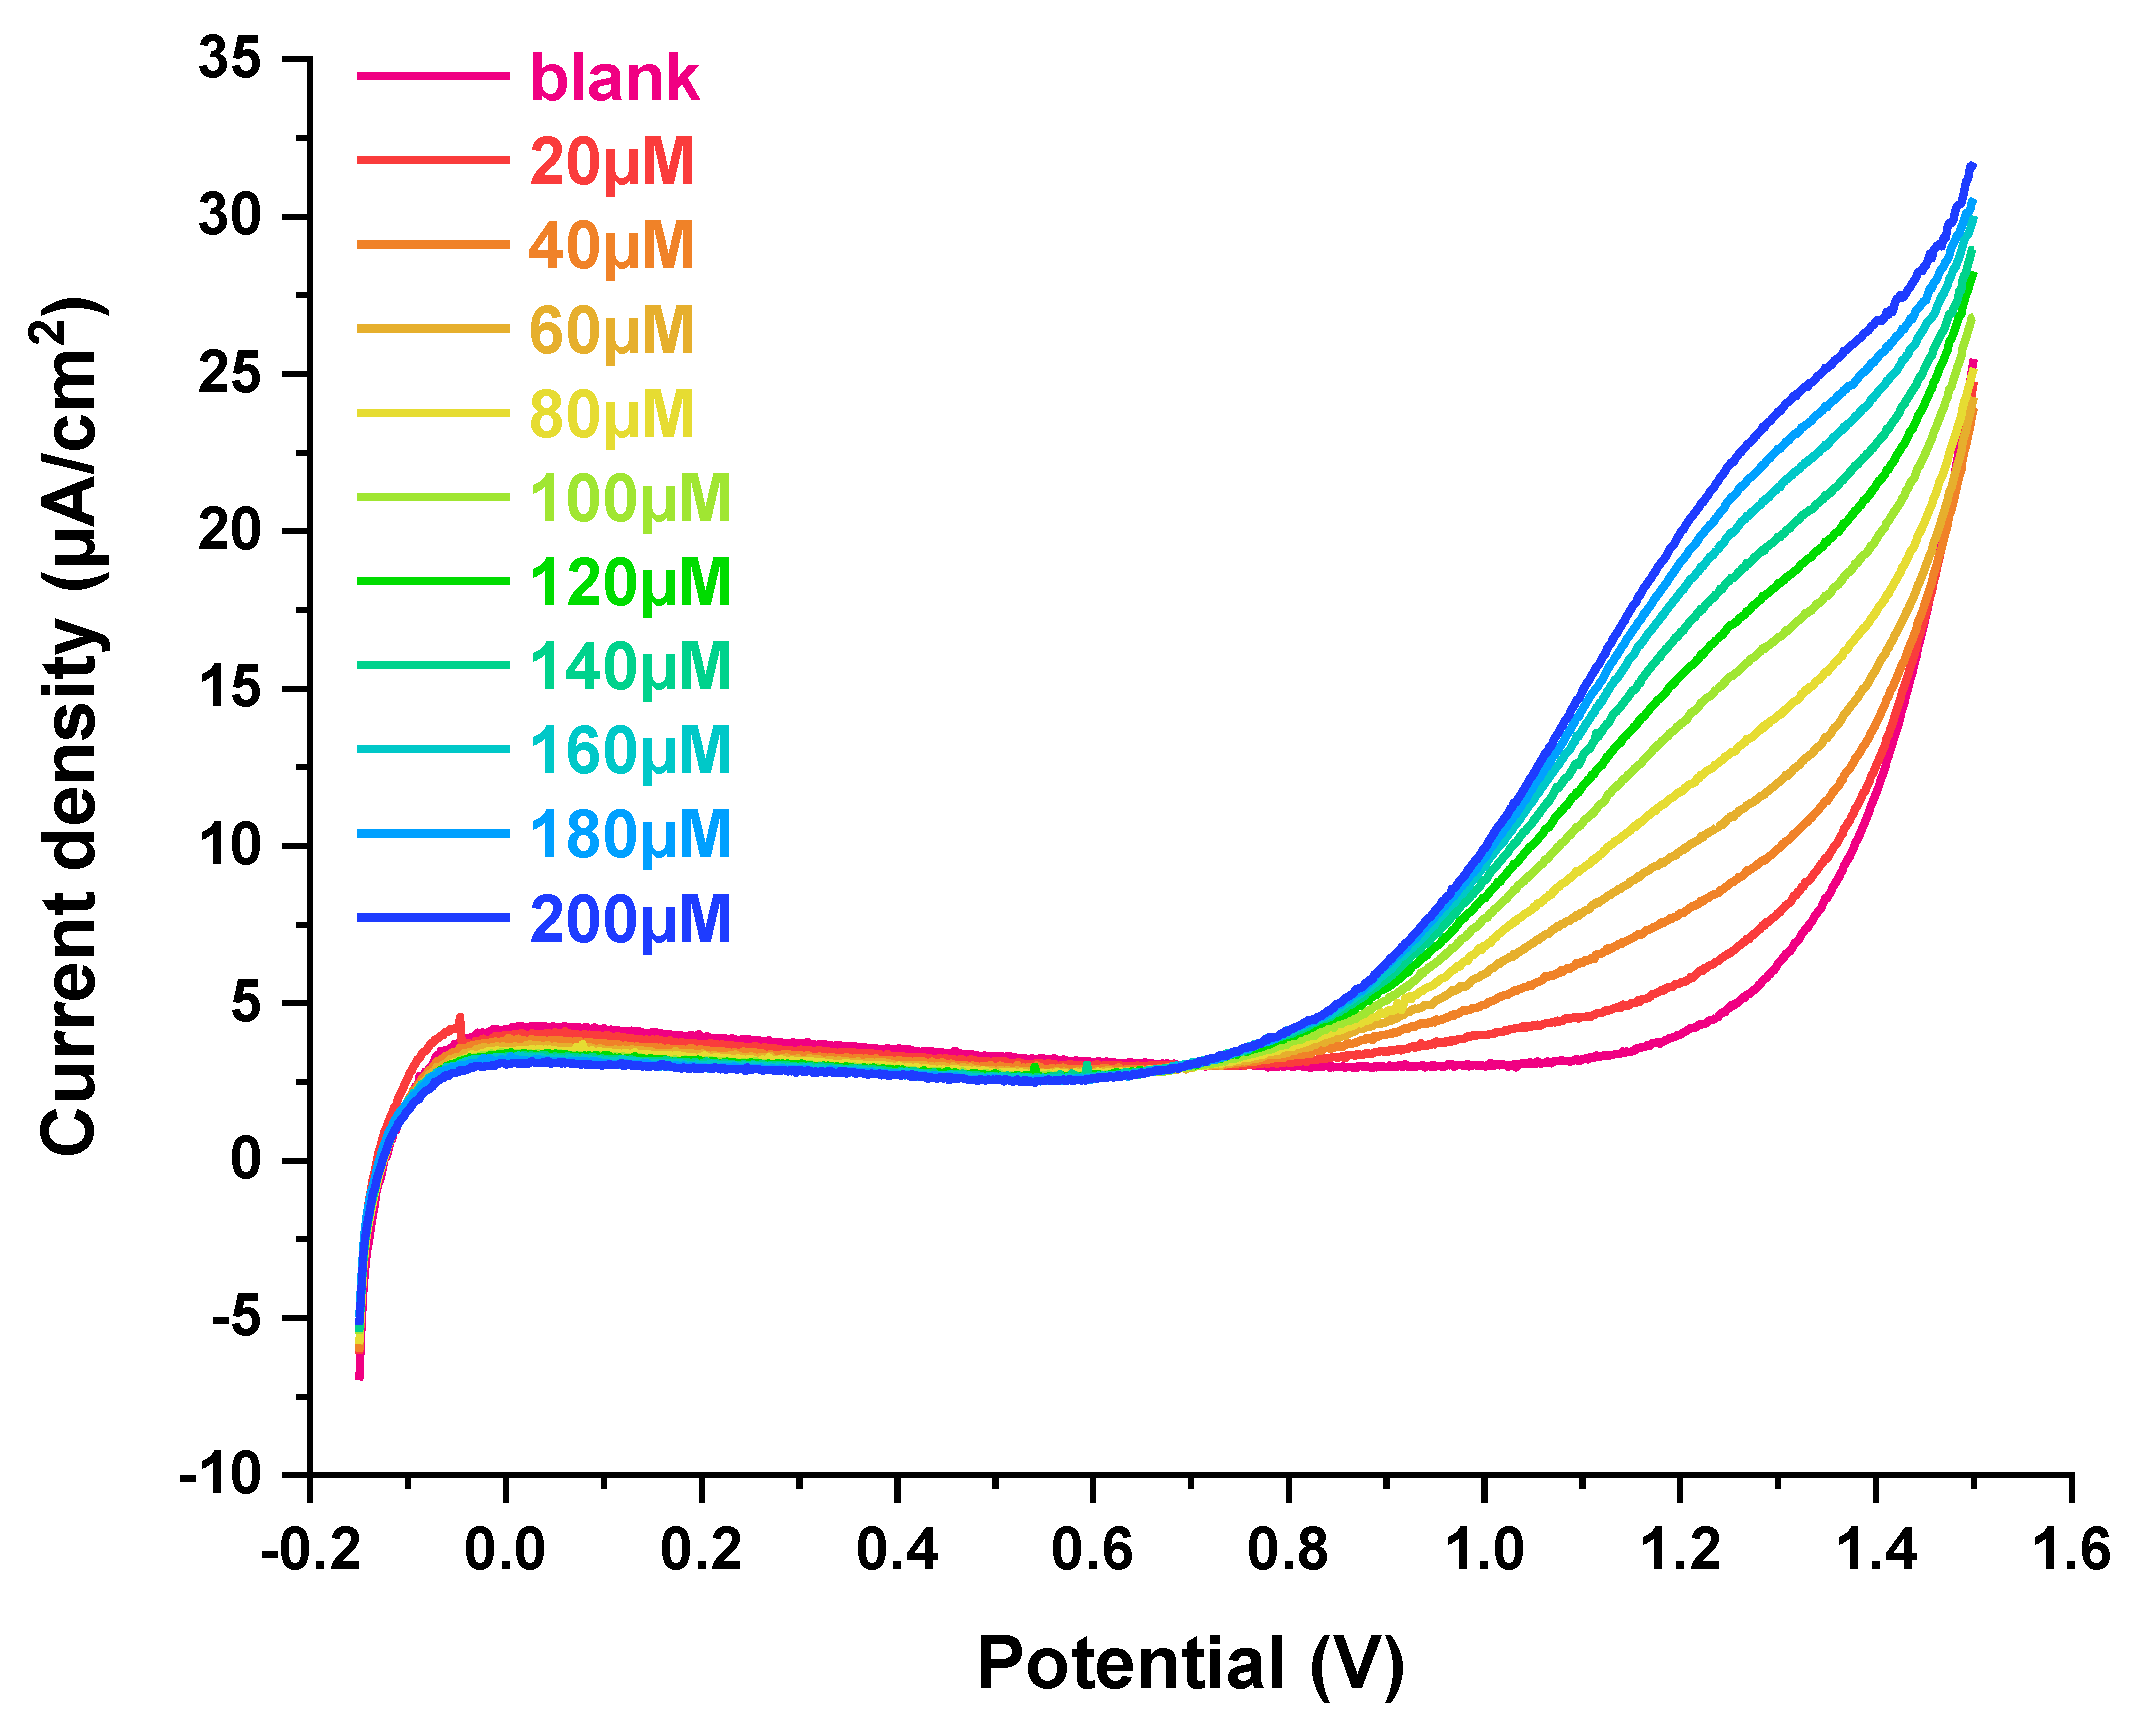
2.4. Determination of H2O2 Content through Voltammetric Measurements

Self-doped TiO2 samples were employed as electrochemical sensors for the determination of H2O2 in aqueous solution. This application is frequently used as benchmark for evaluating electrochemical sensing performances [38], and for this reason was selected in this work.
Measurements were conducted using a 663 VA stand polarograph (Metrohm, Origgio, Italy). The measurement cell was filled with approximately 7 mL of a phosphate buffer solution (pH = 7.00), consisting of 28% NaH2PO4 (0.2 M) and 72% Na2HPO4 (0.2 M), and degassed for 300 s under N2.
After the degassing step, the analysis was initiated by adding known aliquots of H2O2 at a concentration of 10 mM (Sigma-Aldrich, ≥30%). The additions ranged from 20 μM to a maximum final concentration of 200 μM. Three blank scans (phosphate buffer, pH = 7.00) were recorded, and four scans were conducted for each H2O2 addition; only the last three scans were considered for quantitative purposes.
Measurements were carried out via differential pulse voltammetry (DPV) sweeps from −150 mV to 1500 mV, using the following experimental conditions: pulse amplitude of 80 mV; pulse duration time of 10 ms; pulse repetition of 250 ms; step potential of 5 mV, resulting in a scan rate of 20 mV/s.

2.5. Photocatalytic Test

The photocatalytic degradation process was analyzed using methylene blue (MB) as a model organic molecule: this is a representative and common model compound to assess the degradation of organic pollutants [36]. Photocatalysis experiments were carried out by immersing the TiO2 photocatalyst in 10 mL of a 10 mg/L MB solution, which was stirred in a quartz cuvette. A UV LED light source (λ = 365 nm, UVWave, Villebon-sur-Yvette, France) with a power of 100 mW/cm2 was used. The power density was measured using a thermal sensor (OptoSigma®, Les Ulis, France). The MB concentration was monitored during the degradation tests using a UV Spectroquant NOVA 60A spectrophotometer, recording absorbance values at 665 nm. Prior to each photocatalytic test, a 30 min equilibration period without light irradiation was performed.

3. Results and Discussion

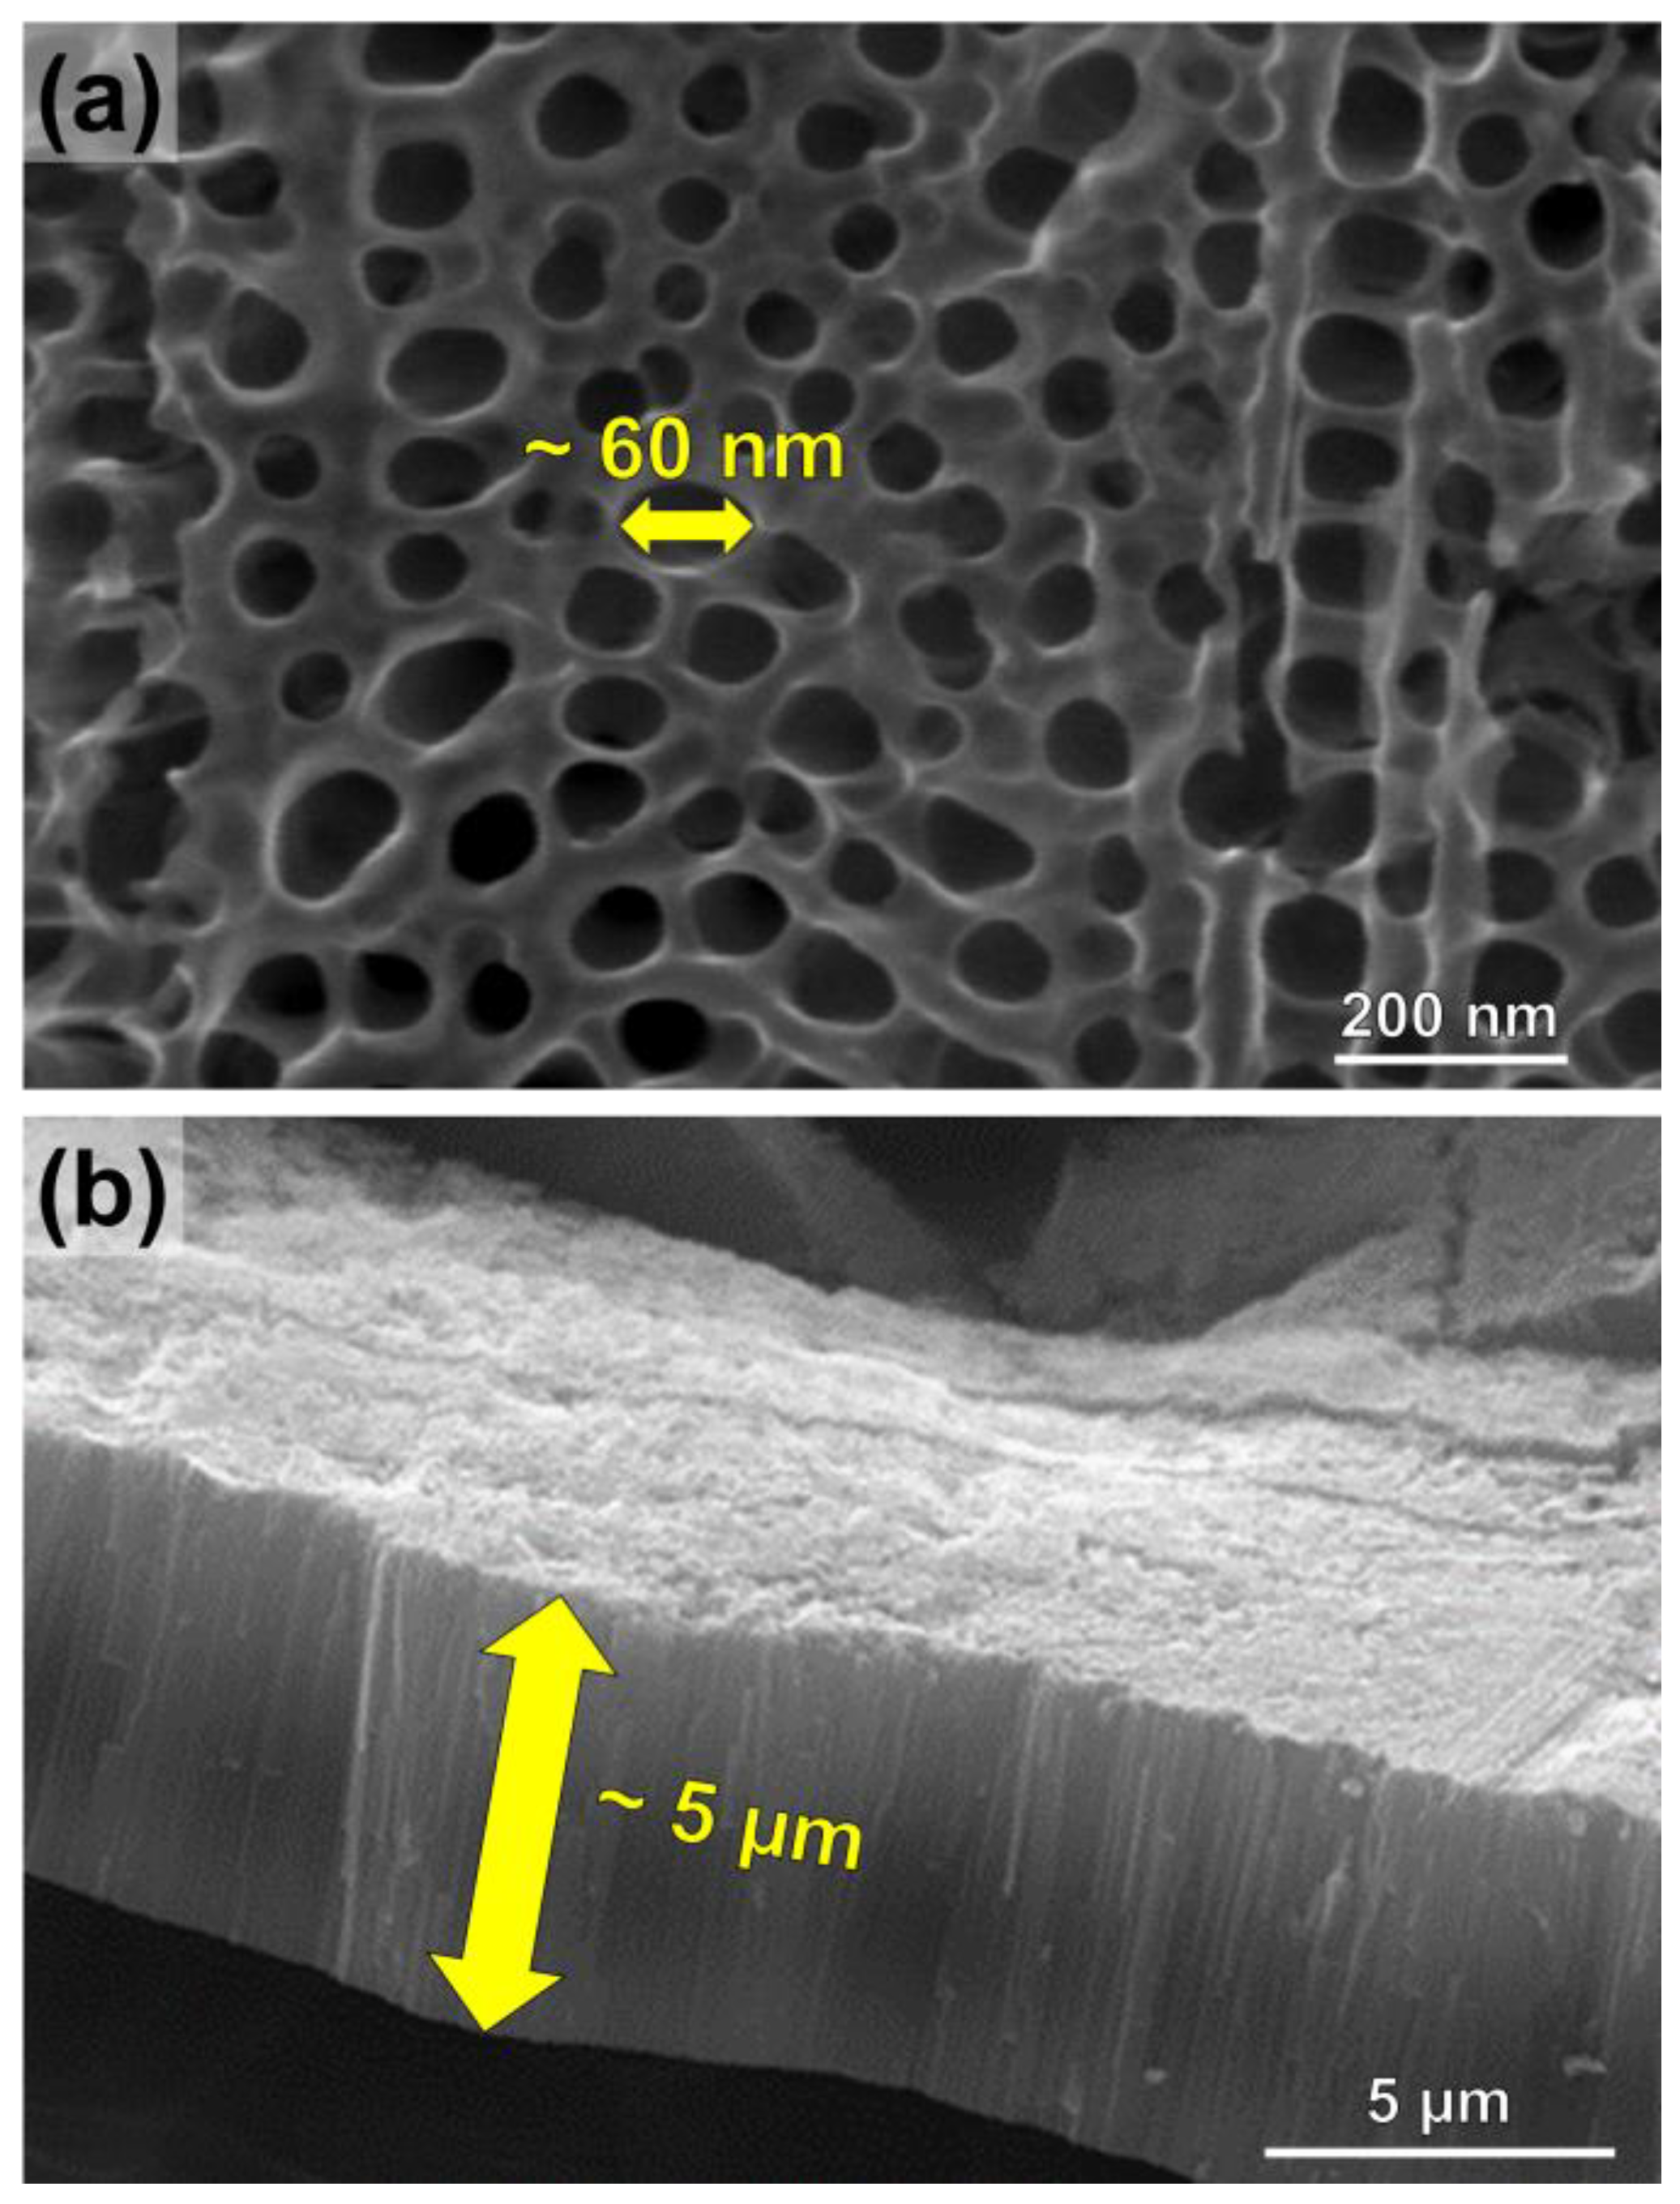
3.1. Anodic TiO2 Nanotubes Fabrication and Morphological Characterization

Anodic TiO2 nanotube arrays used in this work were obtained through anodization, as described in the Materials and Methods section. Nanotubes with a length of approximately 4–5 µm and an inner diameter ranging from 40 to 80 µm were obtained (see Figure 1). Such morphological features, easily tunable by adjusting the anodization time, were chosen as they represent a good compromise between good charge carrier transport/separation and high light harvesting, as demonstrated in previous reports [39].
The anodized materials were in the amorphous phase prior to the annealing process, whereas following the thermal treatment at 450 °C, the anatase phase was detected (see Figure 2). The formation of rutile was not observed, as it is typically reported in the literature to occur through nucleation at the oxide/metallic substrate interface after prolonged heat treatments or at higher temperatures (generally > 600 °C [40]).

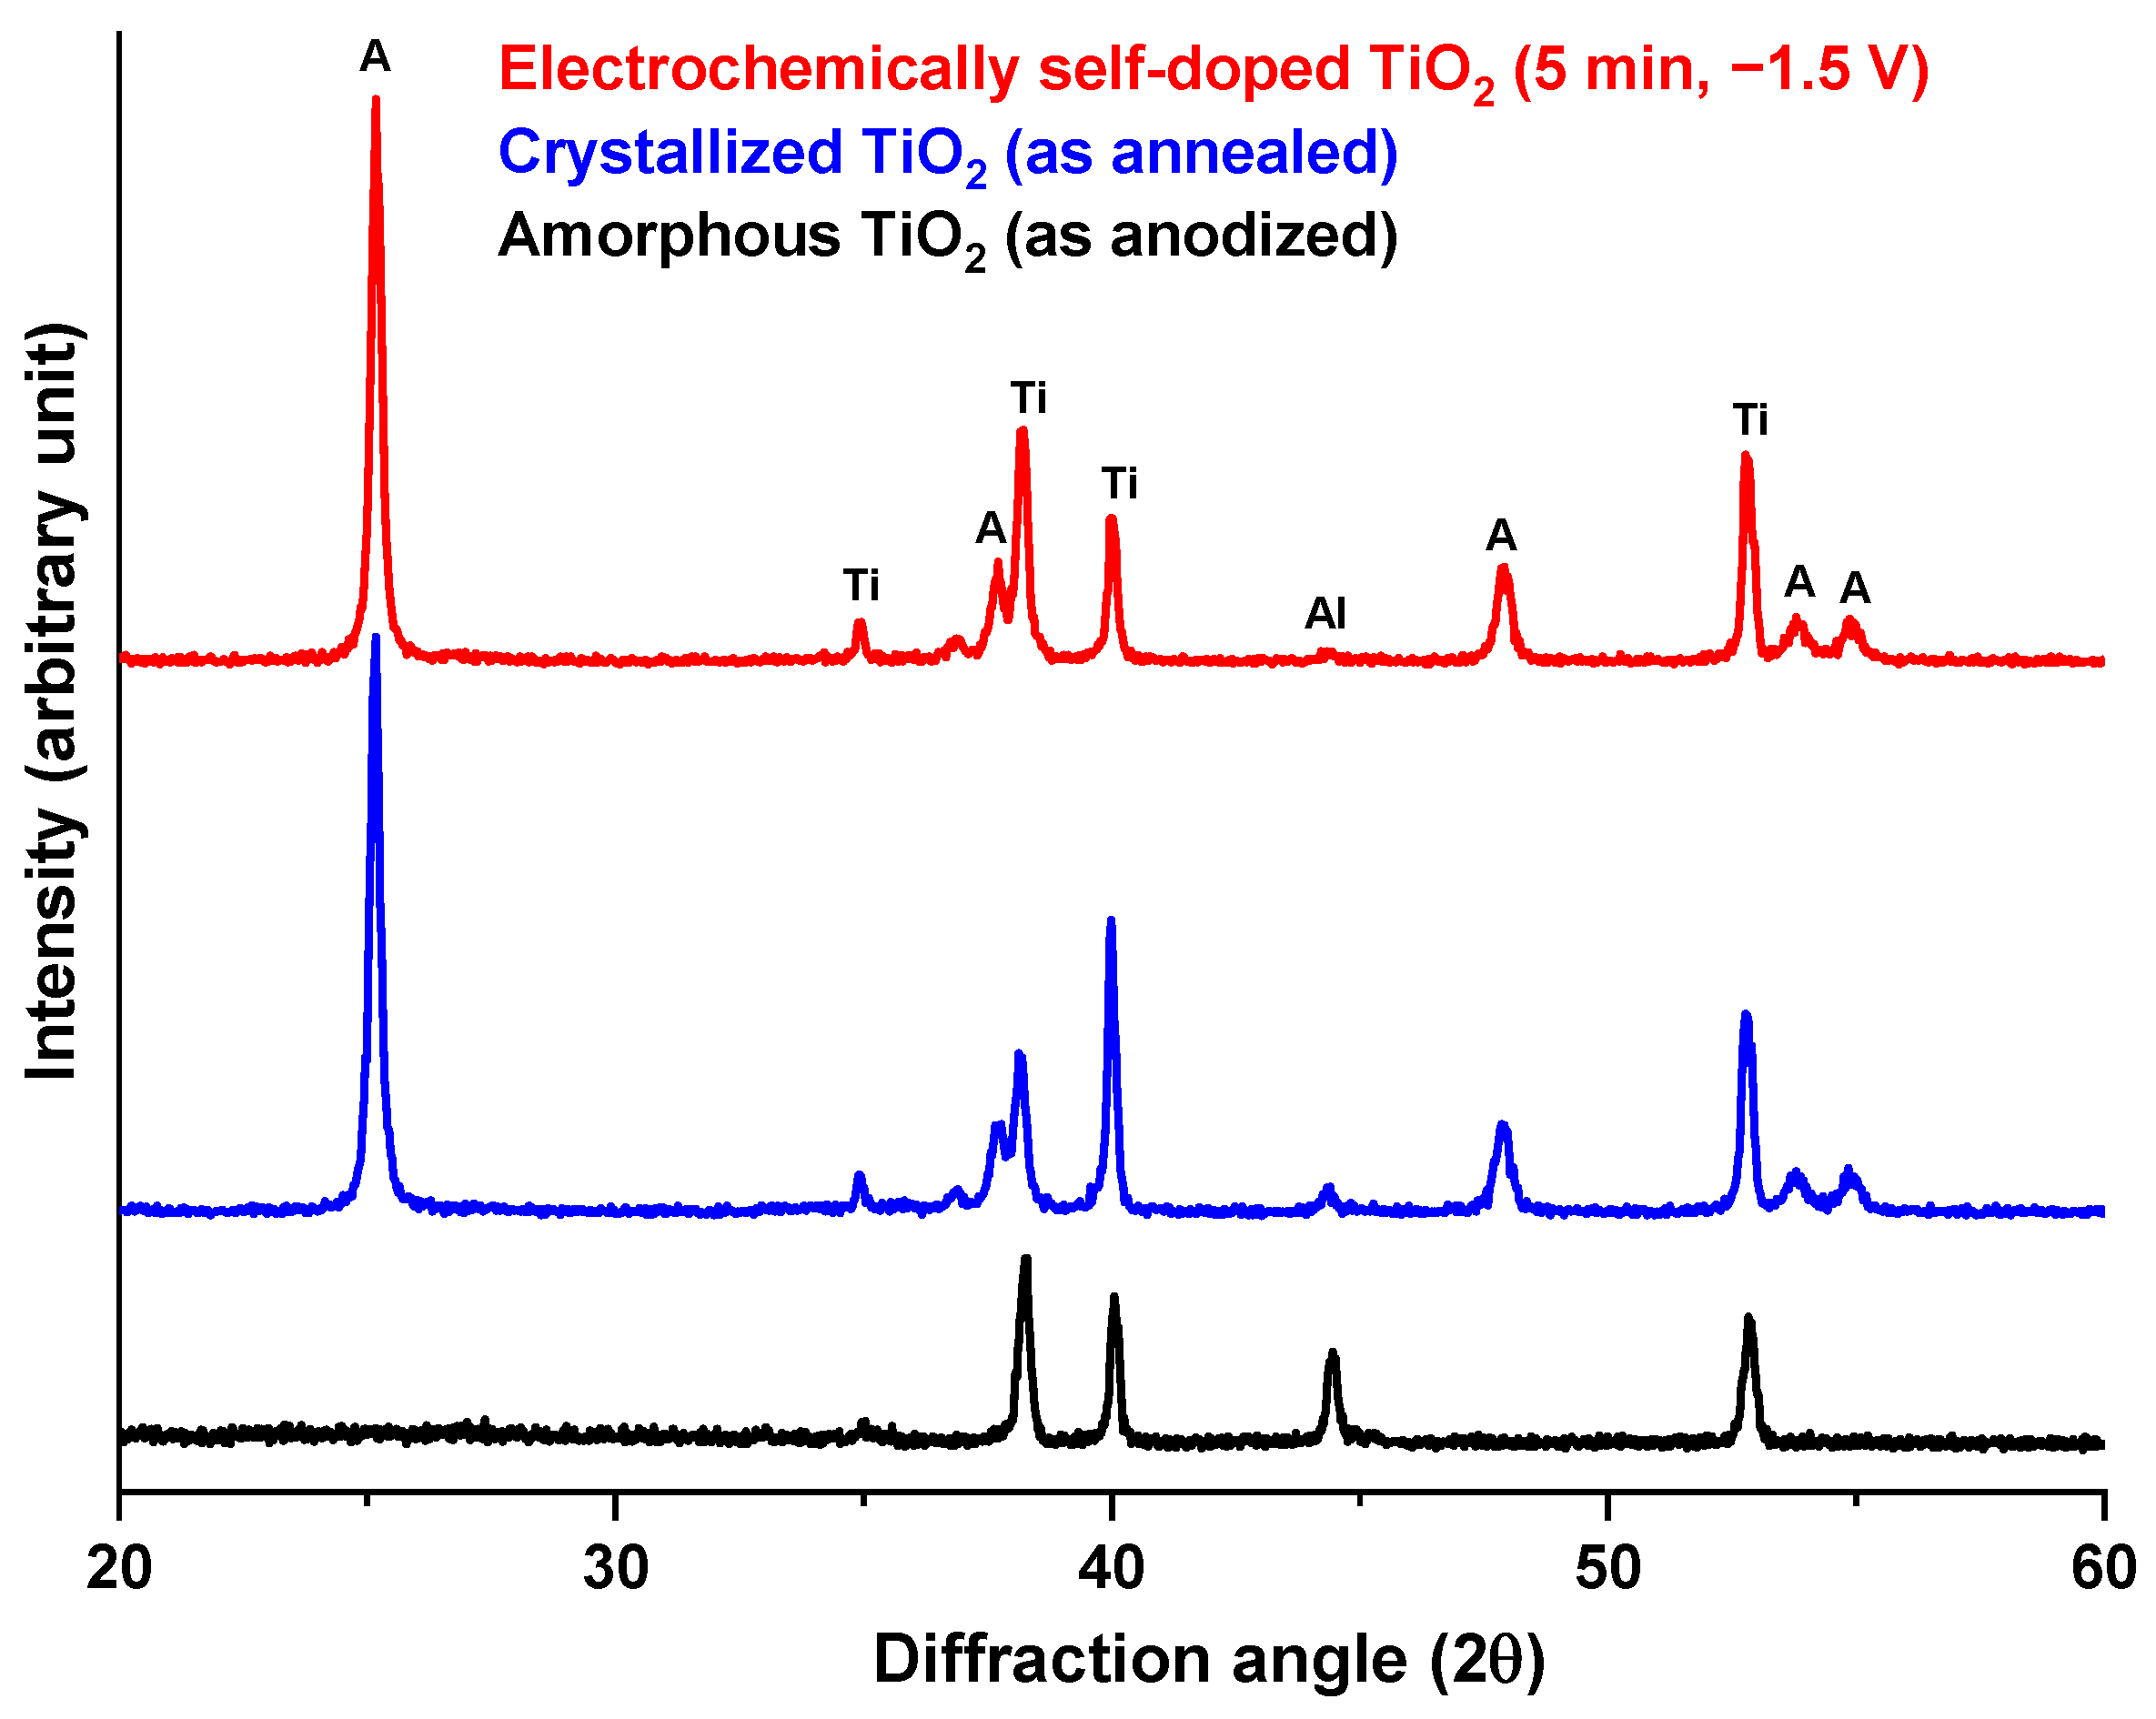
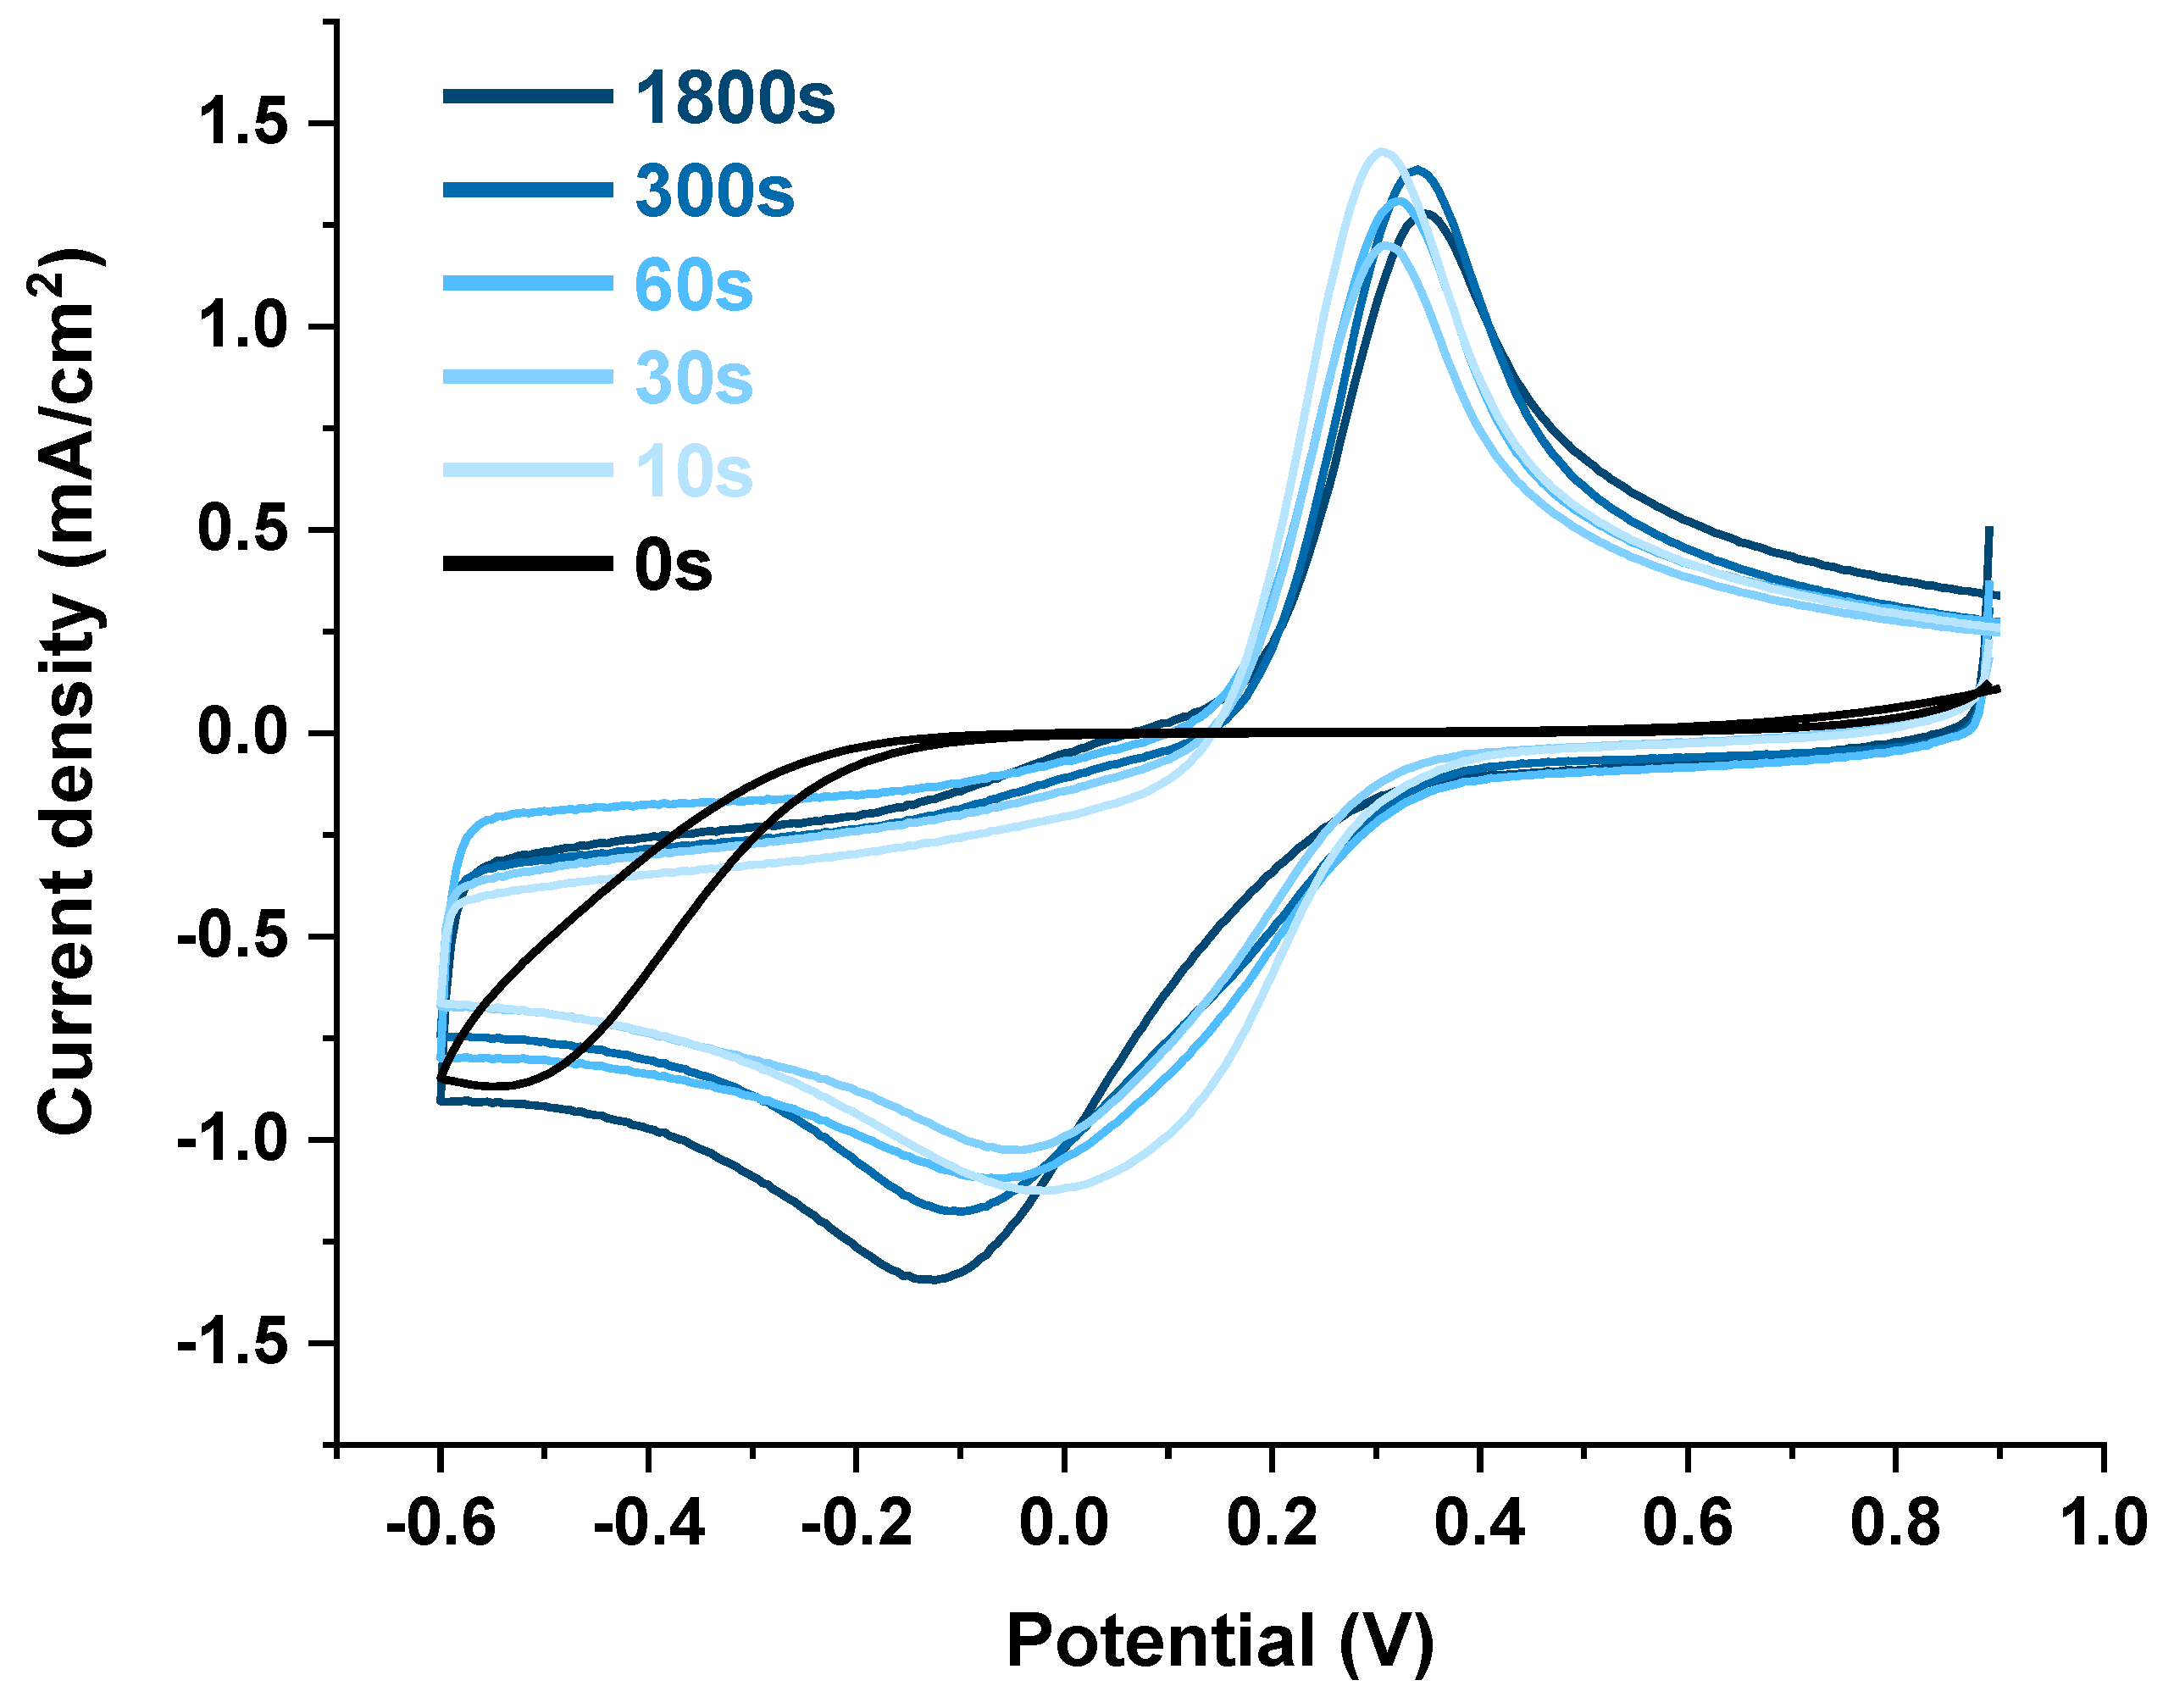
3.2. Electrochemical Self-Doping of TiO2 Nanotubes

As a starting point to produce electrochemically self-doped TiO2 nanotubes, we decided to use a strategy already developed by Bessegato et al. [27]. This protocol involves applying a potential of −2.5 V to the titanium dioxide nanotubes in an alkaline solution (pH = 10, conditions detailed in the Materials and Methods section) to induce the irreversible reduction in Ti4+ into reduced states of Ti3+, through protons intercalation phenomena: the creation of reduced dopant states results in a nearly metallic conductive characteristic in the material, improving its electrical conductivity and introducing intermediary energy levels within the band gap. These aspects are expected to not only enhance the materials’ electrochemical capabilities, but also its photocatalytic performance.
Two samples were self-doped by applying a −2.5 V potential for different times: one for 30 min and another for 5 min. After the self-doping process, TiO2 materials were morphologically investigated (Figure 3).
As shown in Figure 3a, applying a potential of −2.5 V for just 5 min already caused significant damage to TiO2 nanotubes. Prolonged polarization resulted in the complete dissolution of the nanotubes that were initially grown through anodization (Figure 3b). Aware of this, and considering also that analogous evidence was observed in previous reports using similar potentials [28], a reduced applied voltage was explored to mitigate damage to the material ensuring anyway self-doping.
We decided to apply a potential of −1.5 V in the same electrolytic solution to electrochemically dope TiO2. In this case as well, polarization was carried out for varying durations, specifically for: 10–30–60–300–1800 s. We decided to limit and fix the applied potential and to optimize only the self-doping time to tentatively avoid sample damage. This precautionary measure was vital in ensuring the integrity of the samples during the experimentation process.
The morphological features observed for these materials via SEM (Figure 4) highlighted the lack of damage in the structure for up to 5 min of treatment at this potential (comparison of Figure 2 and Figure 4a). Also, beyond this time, the level of structural damage remains significantly limited compared to the one observed when applying a more negative voltage (Figure 4b).
Concerning crystallographic features, no changes can be observed in the recorded XRD pattern after electrochemical self-doping (Figure 2): this evidence is well in line with the previous literature [27]. Both self-doped and undoped TiO2 samples after crystallization feature diffraction peaks at 25.2°, 37.7°, 48°, 53.7°, and 55.1° attributable to the (101), (004), (200), (105), and (211) planes of anatase TiO2, respectively [36,41]. Additionally, both annealed and as-anodized samples present peaks at 38.3°, 38.8°, 40°, 52.8°, 70.5°, 76.6°, and 78° ascribed to the (002), (100), (101), (102), (110), (103), and (112) planes of hexagonal titanium, respectively, i.e., associated with the metallic Ti support. Therefore, if Ti3+ sites are produced through this cathodic treatment, we have to conclude that they are present only as isolated moieties within the extended anatase structure.
Summing up, no significant differences were observed due to the nanostructure’s high stability and the limited presence of reduced Ti+3 states, which are beyond the detection capability of XRD analysis. This evidence is well in line with previous reports applying analogous negative potentials during polarization in different electrolytes (e.g., (NH4)2SO4 [42], Na2SO4 [43]).

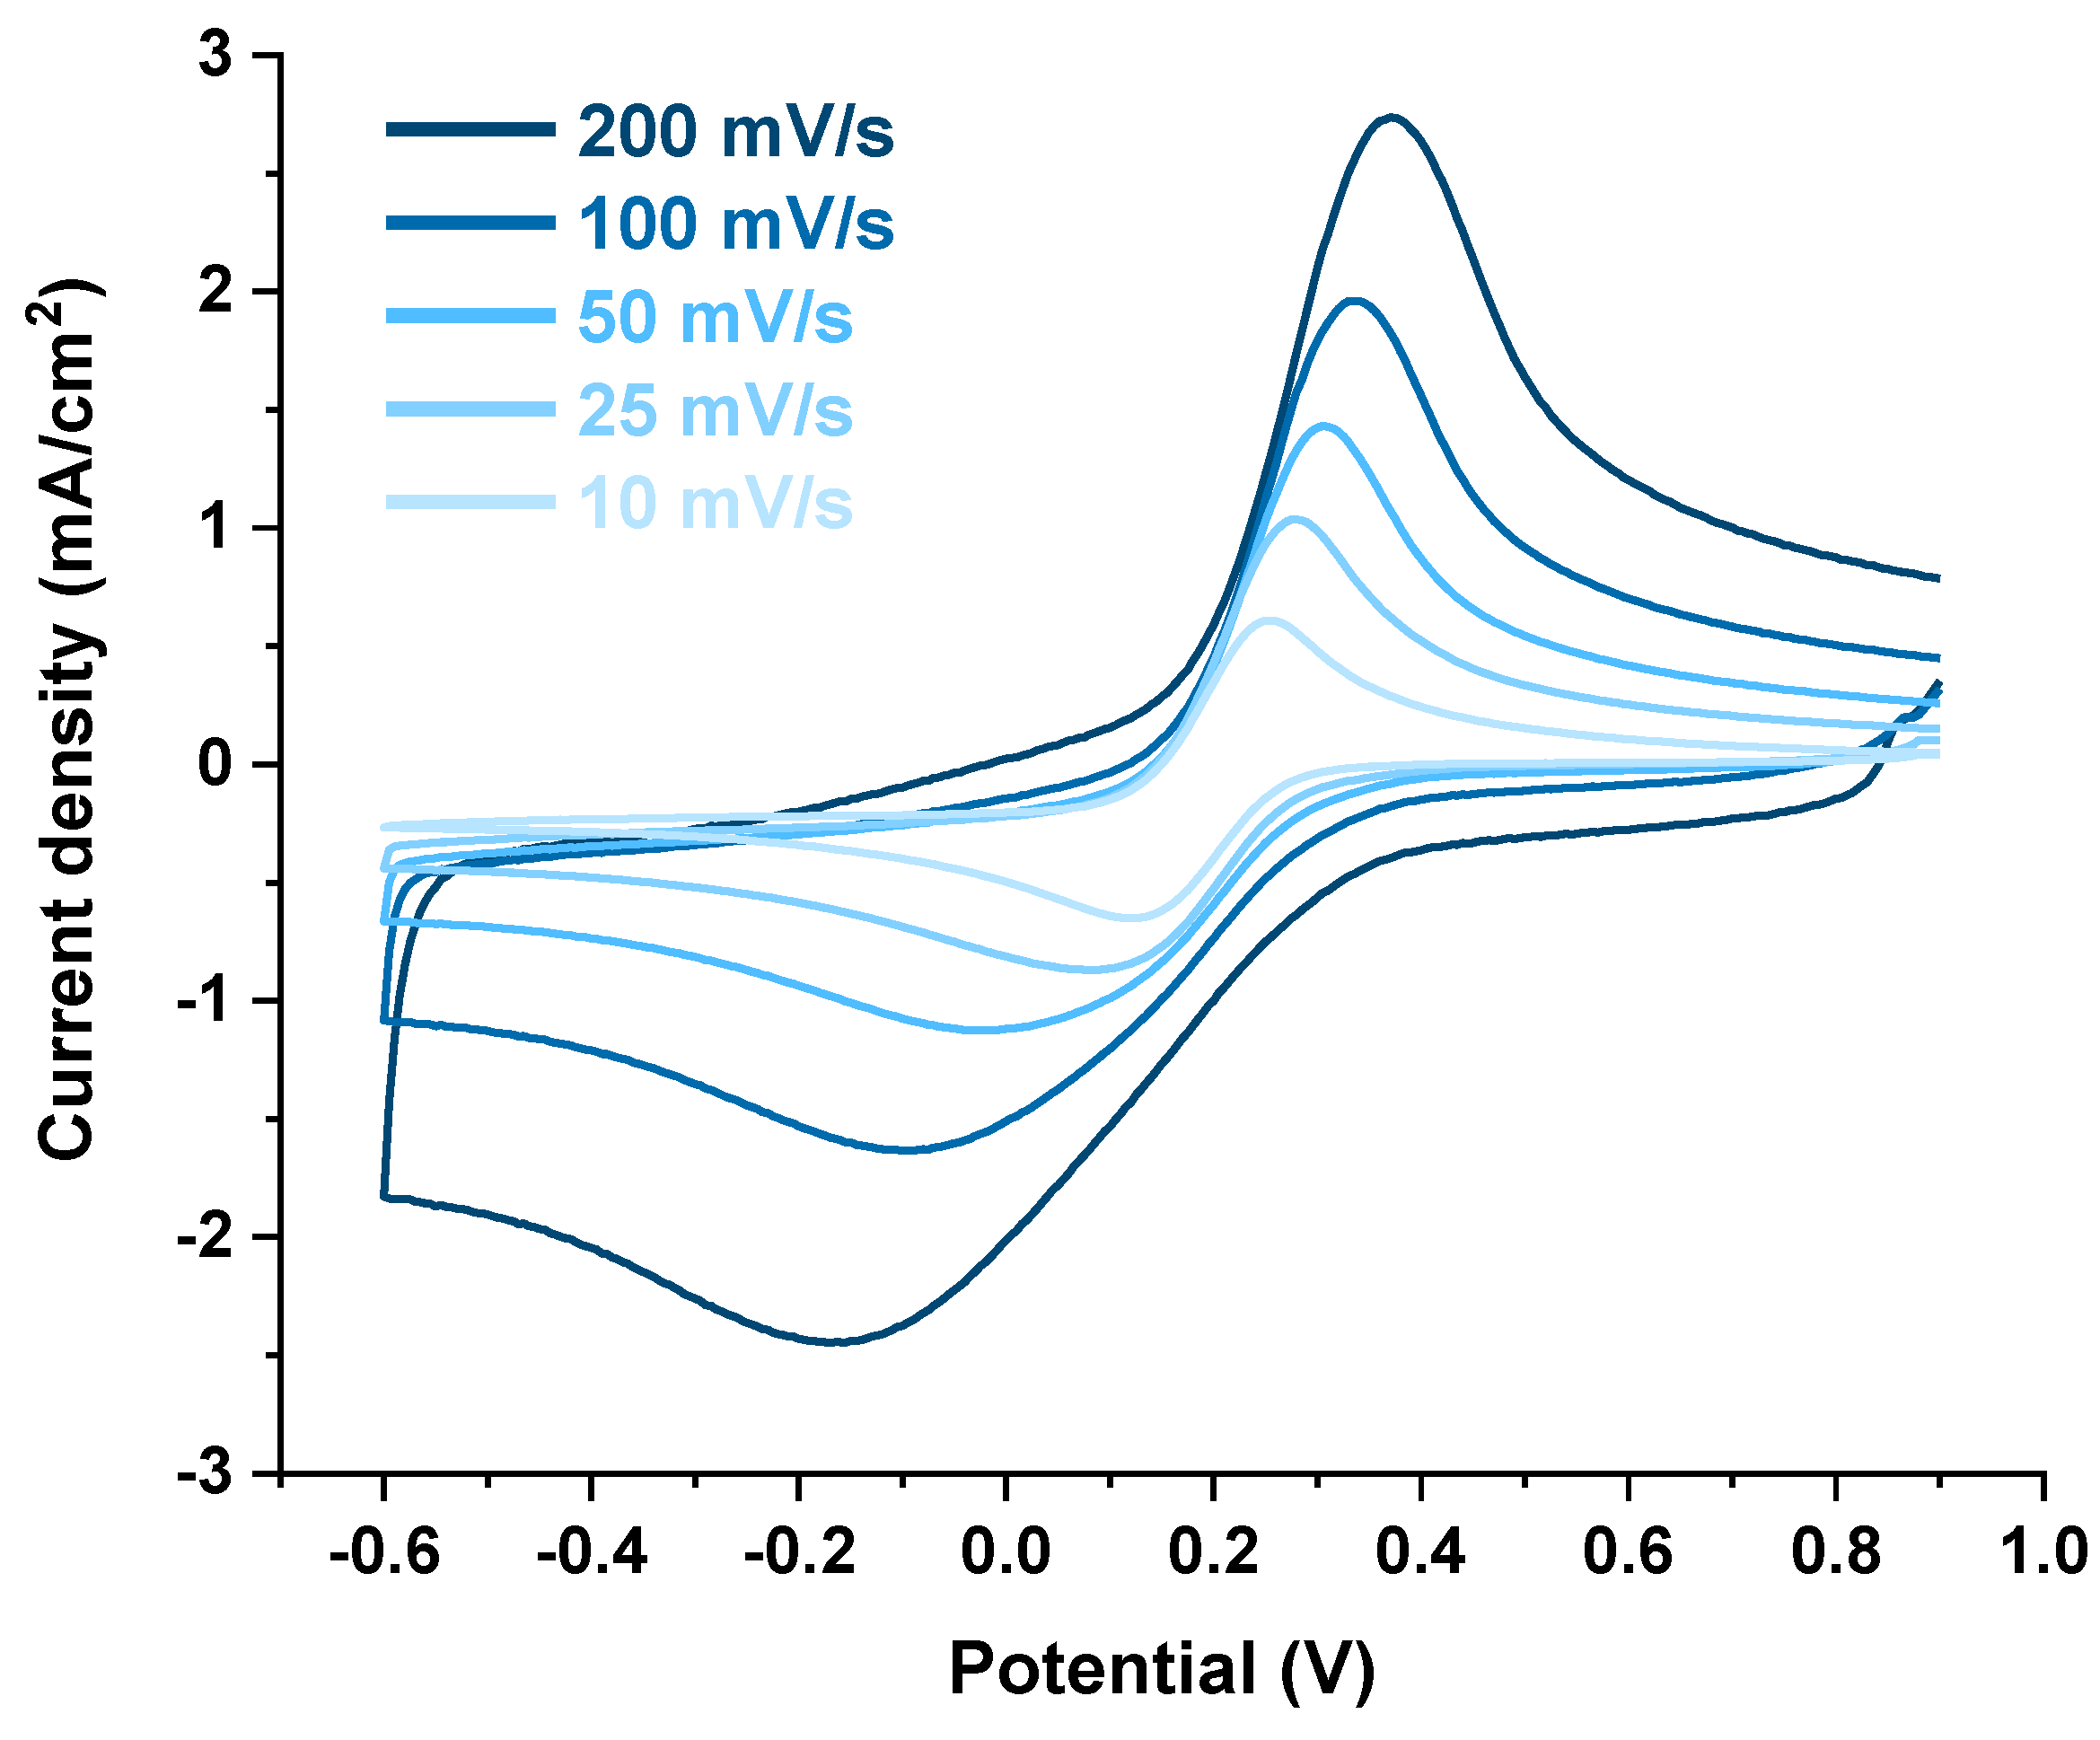
3.3. Electrochemical Characterization

The physicochemical characterization permitted to establish that the self-doping process performed at −1.5 V does not compromise the nanotubes’ structure. Therefore, we decided to electrochemically characterize all self-doped materials obtained using this potential at different doping times (0–1800 s) and the undoped samples (subjected only to anodization and annealing).
The electrochemical properties of the electrodes were examined by studying the voltametric behavior of the ferricyanide ion. The scan was performed first in the cathodic direction (corresponding to the forward peak associated with the reduction in ferricyanide to ferrocyanide) and then in the anodic direction (corresponding to the reverse peak associated with the re-oxidation of ferrocyanide to ferricyanide). Voltammograms for all samples were recorded at a scan rate of 50 mV/s (Figure 5).
From the data presented in Figure 5, it is evident that all materials self-doped for different time intervals exhibit a significantly higher electrochemical activity toward the ferrocyanide/ferricyanide solution compared to the undoped TiO2. As expected, the latter is essentially electrochemically inactive toward the Fe(CN)63−/Fe(CN)64− couple. Differently, all self-doped samples produce appreciable signals at ~−100–0 mV and ~300–400 mV ascribed to the reduction in ferricyanide to ferrocyanide and reverse oxidation process, respectively.
Upon a closer observation of these data, it can be discerned that, although seemingly limited, there are differences in the electrochemical activity of the samples by varying the activation times. These differences are observed in the relative positions of the anodic and cathodic peaks (see variations in the peak-to-peak separation, ΔEp, an index of process reversibility and charge transfer kinetic) and in the peak intensities (indicative of the number of electrons transferred). A qualitative evaluation of these aspects suggests that the sample self-doped for 10 s is the most potentially active, owing to the smallest ΔEp and the highest peak intensity.
To assess the distinct behavior of the self-doped materials quantitatively and systematically, the heterogeneous standard kinetic constant (k0) was calculated. This is an important parameter that quantifies the reversibility of electron transfer and reaction kinetics [44]. Consequently, cyclic voltammetry measurements were conducted using various scan rates. An example of a complete voltametric analysis is shown in Figure 6: as expected, the position of the reduction and oxidation peaks shifts with varying scan rates. Additionally, the cathodic peaks appear broader and less intense compared to the anodic peaks, particularly in the fast scan rates. This pattern might appear unconventional, however, it has been previously documented in TiO2 nanotube materials [45]. It could be ascribed to the distinctive nanostructure of TiO2 nanotubes, which exerts a significant influence on diffusion control. This impact alters the shape of cathodic peaks, since nanotubes have an extremely narrow mouth of approximately 60 nm, thereby modifying the material’s electrochemical response.
k0 was determined graphically by linearizing Ψ against v−1/2 (see details in the Materials and Methods section). An example of this linearization is shown in Figure 7a, while the values obtained for all investigated materials are presented in Figure 7b.
The histogram shown in Figure 7b displays a slightly skewed bell-shaped trend and indicates that the material self-doped for 10 s clearly exhibits the best performance in terms of electron transfer kinetics: a k0 value of 1.4 × 10⁻³ cm/s was determined, which is approximately double that of the second performing material (activation time 30 s). These data indicate, on one hand, that too short self-doping times (e.g., 2 s) may lead to a limited surface reduction and thus a limited effect induced by the electrochemical treatment. On the other hand, longer activation times (e.g., 60 s and more) result in poorer performance, likely due to an ample quantity of reduced Ti3+ sites. The abundance of Ti3+ centers induces the excessive generation of sub-band electronic states (e.g., Ti3d levels below the conduction band) that can act as electron traps [46,47], promoting Shockley–Read–Hall recombination [48], and lowering charge mobility and transfer.
The electroactive surface was determined as well. As non-activated TiO2 did not exhibit any discernible electrochemical signal, it was not feasible to calculate the electroactive surface for this material. For all other materials, this parameter was estimated using the Randles–Sevcik model [49]. The results are summarized in Table 1.
A distinct pattern is noticeable within the specified time frame, showing that the electroactive surface area reaches its peak value after 60 s of treatment. Although this trend is reliable, it is essential to carefully interpret these absolute values, especially considering that the diffusion coefficient within porous materials such as TiO2 nanotubes might deviate from standard table values used for the estimation of these surfaces.
For the sake of completeness, all materials self-doped in the time range 10–300 s were evaluated in view of their electrochemical sensing capabilities toward hydrogen peroxide.

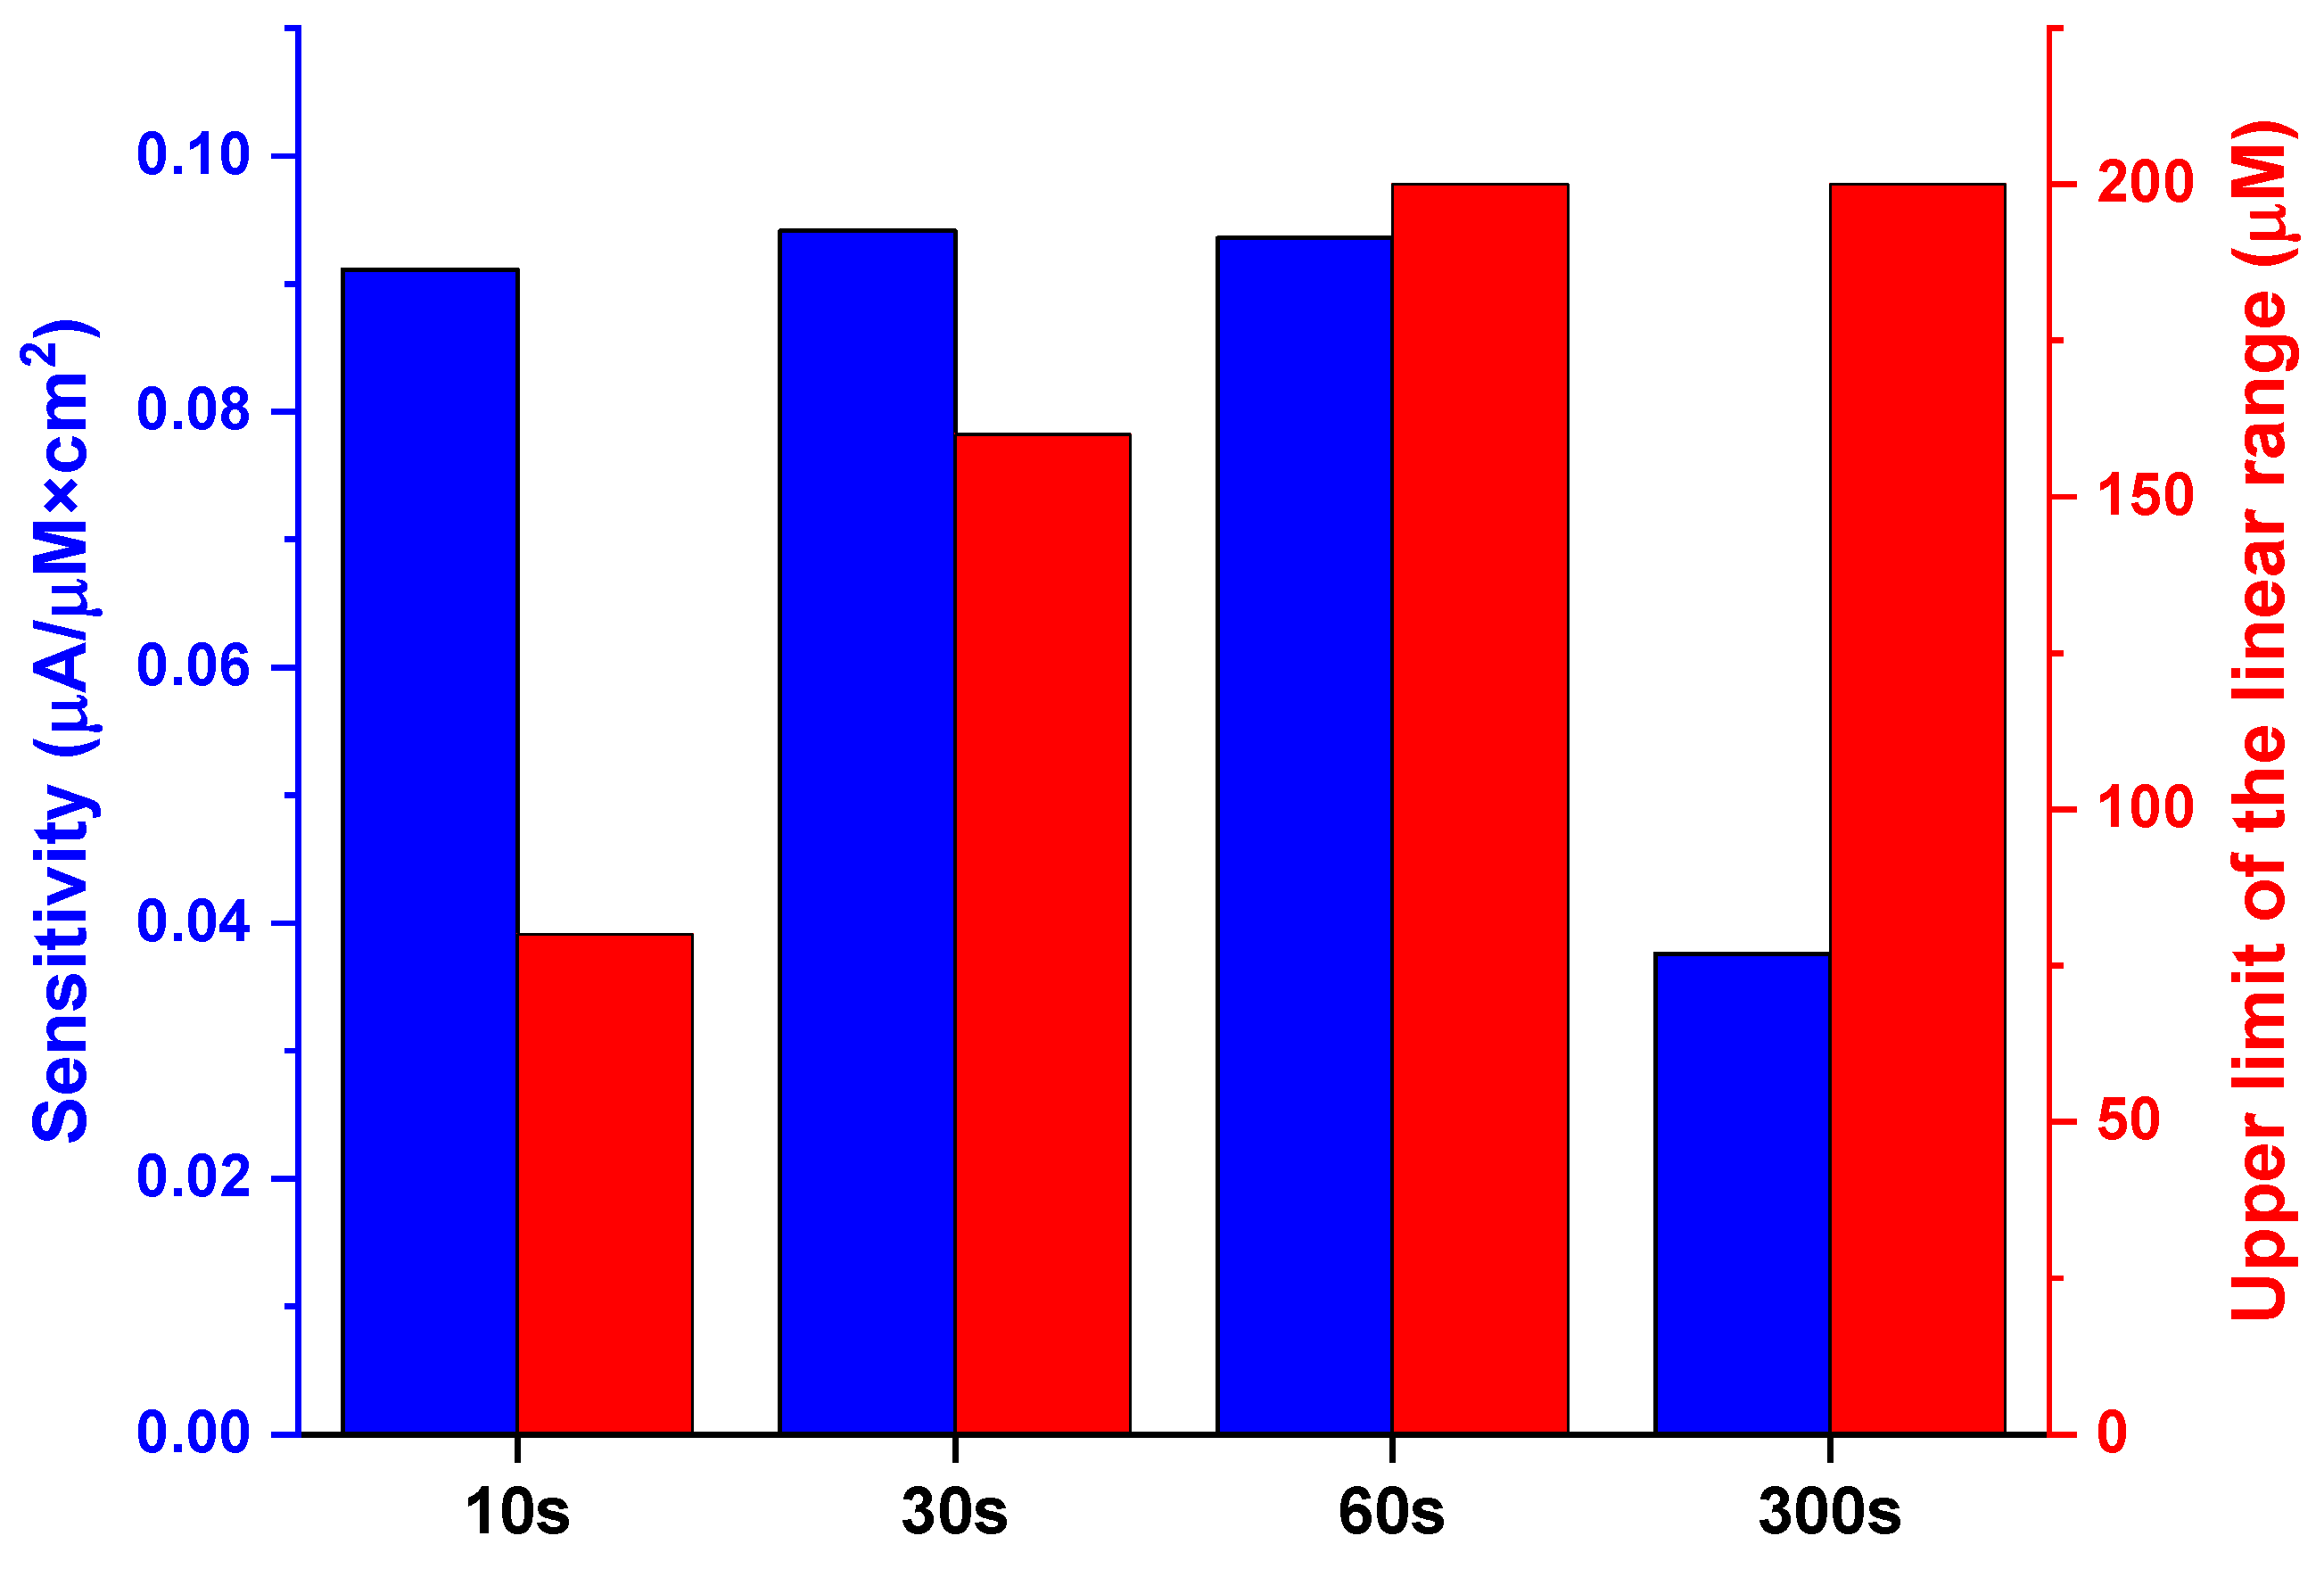
3.4. Voltametric Detection of H2O2

Having established the effectiveness of the electrochemical self-doping process, we decided to test the materials for a specific electroanalytical application. Analyses were conducted to assess the potential use of the produced materials as electrochemical sensors for the determination of very low concentrations of H2O2 in aqueous solutions. It is worth noting that the production of electrochemical sensors for H2O2 detection is essential for ensuring safety in certain chemical processes [50], quality control (hydrogen peroxide is widely used in the food industry and water treatment [51,52]), and advancing research in various fields, including medicine (where hydrogen peroxide can be used as an indicator for certain diseases, being produced by cells in the early stages of specific illnesses [53,54]) and environmental sciences (for monitoring contaminants in the environment [55]).
Measurements were conducted through DPV (see details in the experimental procedures), and to assess the feasibility and sensitivity of the method, voltammograms were recorded over the concentration range of 20–200 µM of H2O2 (addition method). Tests were conducted on samples self-doped for 10, 30, 60, and 300 s. Experiments related to undoped titania are not shown here because, in this case as well, it is not electrochemically active. The selection of these specific electrodes was based on their superior activity compared to other samples self-doped for different time intervals. An example of a complete analysis (30 s self-doped material) is presented in Figure 8. We chose to present this self-doped material because it offers a balance between electron transfer efficiency and electroactive surface area according to data reported in Figure 7b and Table 1, respectively.
As observed, following the sequential addition of H2O2, there is an increase in the current value in the anodic region. This phenomenon can be explained by the oxidative process that leads to the production of O2 from H2O2. However, since this increase in signal due to oxygen evolution partially overlaps with the analytical signal generated via the blank analysis (phosphate buffer, pH = 7 in ultrapure water), it became necessary to subtract the voltammogram of the blank from the analytical signal recorded after each subsequent addition.
The result of this subtraction is shown in Figure 9, where the presence of a peak solely attributable to the presence of hydrogen peroxide is clearly observed. The maximum signal of this peak (potential ~1.25–1.30 V) is recorded as a quantitative measure to evaluate the linearity of the signal with respect to the analyte concentration. The high potential here reported does not approach the very low voltages of the most efficient electrocatalysts, such as metallic electrodes like Au or Pt electrodes, which show significantly lower potentials. However, comparable values have been documented in pertinent literature, including studies on carbon and metal oxide materials [56,57].
The analytical response recorded at various concentrations was then plotted against the concentration of hydrogen peroxide (over the entire range of 20–200 µM). The result is depicted in Figure 10.
As can be observed, the TiO2 self-doped for 30 s exhibits a linear range between 20 and 160 µM thanks to the linear correlation between peak height and hydrogen peroxide concentration. Indeed, for values greater than 160 µM, the data tend to deviate from linearity.
The results of the same experiments carried out on the other self-doped materials are reported in Figure 11, where a histogram is provided to describe the sensitivity and linearity range trend for all these materials, with respect to the self-doping time.
Once again, a bell-shaped trend is observed for the sensitivity, analogously to what was observed for the k0 value (see Figure 7b). However, in this case, differences are much less marked in the range 10–60 s, testifying the suitability of these materials for these sensing applications. Furthermore, extended linearity ranges (systematically determined by considering a relative root-mean-squared error (RRMSE) threshold of less than 5%) were observed only in samples that underwent self-doping for more than 10 s. In summary, self-doping below 60 s maximizes sensitivity, achieving the optimal balance between sensitivity and linearity range at 60 s. With longer durations, sensitivity diminishes, but the linearity range expands. This may be explained also with the trend of the electroactive surface area of the electrodes (see Table 1). This evidence suggests that the sample self-doped for 60 s is the ideal electrode for this application offering the best compromise between sensitivity and linearity range: up to 200 μM hydrogen peroxide concentrations can be accurately determined with a limit of detection (LOD) and a limit of quantification (LOQ) equal to 0.98 μM and 2.9 μM, respectively. The latter were determined via an upper limit approach as suggested by the International Union of Pure and Applied Chemistry (IUPAC). Although the analytical results presented do not approach the best performing materials (as from existing literature), the performances are comparable, or, in some cases, even superior to those achieved in recent works [58,59,60]. This comparison underscores that the concentration range covered in this study is well-suited for determining hydrogen peroxide across various applications while keeping the electrode fabrication extremely simple and fast. This feature stands in contrast to the existing literature, which often focuses on developing extremely sensitive materials (sometimes surpassing the required sensitivity levels) through significantly more complex strategies.
As a final consideration, no alterations in the material’s morphology were observed after electrochemical determinations based on the SEM analysis. Reusability tests were performed using the material self-doped for 60 s (considered the best material): no statistically significant differences were observed in terms of sensitivity after three cycles (relative standard deviation = 5.2%).

3.5. Photocatalytic Methylene Blue Degradation

A feasibility assessment of the potential application of the TiO2 self-doping method for photocatalytic purposes (an increasingly utilized technology also for sensing applications [61]) was performed in addition to the improvements observed from an electrochemical perspective.
This choice was made because the reduction process performed on this semiconductor can make the material more conductive and improve benefits in terms of photocatalytic processes. In these processes, in fact, light radiation (of the appropriate wavelength) interacts with a semiconductor material, induces the formation of an electron–hole pair, and utilize these charges to drive environmentally beneficial redox reactions (e.g., the degradation of environmental pollutants). The reduction in the band gap (i.e., the energy required to move an electron from the valence band to the conduction band) improved after self-doping may therefore improve photocatalytic degradation as well.
In this work, the degradation of an organic dye (methylene blue) was chosen as a model for organic pollutant in the environment. Preliminary tests to demonstrate the enhancement in terms of photocatalytic degradation performances were carried out using undoped TiO2 and a TiO2 self-doped material taken as an example (i.e., TiO2 electrochemically treated at −1.5 V for 30 s, see Figure 12).
As observed from the graph, after 3 h, there is a 63% reduction for the electrochemically self-doped TiO2 and only a 44% reduction for the undoped TiO2, confirming the hypothesis that electrochemical treatment also results in benefits for photocatalytic processes. Linearization via fitting with a first-order kinetic model enabled the estimation of the reaction kinetic constants: k = 0.0053 s−1 and k = 0.0043 s−1 were determined for the self-doped and undoped material, respectively. In order to further investigate the reasons behind this enhancement, the potential involvement of adsorption in methylene blue degradation was evaluated by conducting experiments in which TiO2 samples were exposed to the dye solution without illumination (i.e., under dark conditions). In this scenario, if methylene blue concentration decreases, it suggests a significant role played by the adsorption process in improving the photocatalytic activity. However, after 3 h of exposure, no distinctions were noted between non-activated and self-doped materials; both exhibited negligible reductions in TiO2 concentration. Therefore, based on electrochemical characterization, the improvement in photocatalytic performance may be attributed to the enhanced charge carrier transport provided by self-doping.
Finally, SEM and XRD analyses showed no differences in the morphology and crystalline features of the material after photocatalytic degradation, thereby testifying its stability. The photocatalytic degradation was performed five times using the same material and no statistical differences were found in the degraded fraction of methylene blue after 3 h (64 ± 4%, n = 5, uncertainty expressed as one time the standard deviation). This point evidences the possibility to reuse the material multiple times without compromising its performances.

4. Conclusions

This study demonstrates the feasibility of an efficient and ultra-rapid self-doping process over anodic TiO2 nanotube arrays within mere seconds. Applying a potential of −1.5 V in an alkaline solution for as short as several tens of seconds results in self-doped materials exhibiting significantly enhanced electronic properties and accelerated charge transfer kinetics, while maintaining the stable structure of TiO2 nanotubes. Notably, these self-doped materials exhibit a substantial increase in electrochemical activity after just 10 s of the doping process, distinguishing them from undoped TiO2 materials that display negligible electroactivity. These advancements in electrochemical properties have profound implications for two key applications: electrochemical sensing and photocatalytic pollutant abatement. Self-doped materials demonstrate their potential as highly efficient electrochemical sensors, boasting a linear detection range of 3–200 µM for H2O2, thus finding practical utility in areas such as food safety and environmental monitoring. Moreover, their heightened electronic conductivity, resulting from self-doping, translates into improved photocatalytic performances, evidenced by a 25% enhancement in the reduction in methylene blue under UV light exposure.
It is important to acknowledge that while the concept of electrochemical self-doping is not entirely new, a lot of work is still required in this field to explore different self-doping conditions to simplify and quicken the process. Our study serves as a proof of concept for the rapid and straightforward development of a novel class of materials with versatile applications in both electro- and photocatalytic domains, which are pivotal in the sensing field, laying the foundation for future investigations aiming to refine experimental parameters and enhance analytical capabilities. At present in fact, the analytical performance does not match that of the most advanced materials documented in the literature. Nevertheless, our electrodes are suitable for a range of applications having the additional advantage of a much simpler and faster fabrication process when compared to the best electrochemical sensors.
While our study provides an essential initial insight into the ultrafast self-doping process, future research endeavors will delve deeper, focusing on the optimization and comprehensive exploration of this innovative approach, promising a transformative impact on various technological domains.

Author Contributions

Conceptualization, D.S.; methodology, D.S. and A.D.; investigation, A.D. and M.P.; formal analysis, D.S. and A.D.; data curation, D.S., A.D. and M.P.; writing—original draft preparation, D.S. and M.P.; writing—review and editing, G.B., D.M. and S.R.; visualization, D.S. and G.B.; resources, D.S. and S.R.; supervision, D.S. All authors have read and agreed to the published version of the manuscript.

Funding

This research received no external funding.

Institutional Review Board Statement

Not applicable.

Informed Consent Statement

Not applicable.

Data Availability Statement

The data presented in this study are available on request from the corresponding author.

Conflicts of Interest

The authors declare no conflict of interest.

References

  1. Sun, H.; Song, S.; Xu, X.; Dai, J.; Yu, J.; Zhou, W.; Shao, Z.; Jung, W. Recent Progress on Structurally Ordered Materials for Electrocatalysis. Adv. Energy Mater. 2021, 11, 2101937. [Google Scholar] [CrossRef]
  2. Tong, H.; Ouyang, S.; Bi, Y.; Umezawa, N.; Oshikiri, M.; Ye, J. Nano-photocatalytic Materials: Possibilities and Challenges. Adv. Mater. 2012, 24, 229–251. [Google Scholar] [CrossRef] [PubMed]
  3. Riboni, F.; Nguyen, N.T.; So, S.; Schmuki, P. Aligned metal oxide nanotube arrays: Key-aspects of anodic TiO2 nanotube formation and properties. Nanoscale Horiz. 2016, 1, 445–466. [Google Scholar] [CrossRef]
  4. Kowalski, D.; Kim, D.; Schmuki, P. TiO2 nanotubes, nanochannels and mesosponge: Self-organized formation and applications. Nano Today 2013, 8, 235–264. [Google Scholar] [CrossRef]
  5. Paramasivam, I.; Jha, H.; Liu, N.; Schmuki, P. A Review of Photocatalysis using Self-organized TiO2 Nanotubes and Other Ordered Oxide Nanostructures. Small 2012, 8, 3073–3103. [Google Scholar] [CrossRef] [PubMed]
  6. Valeeva, A.A.; Dorosheva, I.B.; Kozlova, E.A.; Sushnikova, A.A.; Kurenkova, A.Y.; Saraev, A.A.; Schroettner, H.; Rempel, A.A. Solar photocatalysts based on titanium dioxide nanotubes for hydrogen evolution from aqueous solutions of ethanol. Int. J. Hydrogen Energy 2021, 46, 16917–16924. [Google Scholar] [CrossRef]
  7. Ge, M.; Li, Q.; Cao, C.; Huang, J.; Li, S.; Zhang, S.; Chen, Z.; Zhang, K.; Al-Deyab, S.S.; Lai, Y. One-dimensional TiO2 Nanotube Photocatalysts for Solar Water Splitting. Adv. Sci. 2017, 4, 1600152. [Google Scholar] [CrossRef] [PubMed]
  8. Pinna, M.; Wei, A.W.W.; Spanu, D.; Will, J.; Yokosawa, T.; Spiecker, E.; Recchia, S.; Schmuki, P.; Altomare, M. Amorphous NiCu Thin Films Sputtered on TiO2 Nanotube Arrays: A Noble-Metal Free Photocatalyst for Hydrogen Evolution. ChemCatChem 2022, 14, e202201052. [Google Scholar] [CrossRef]
  9. Hou, X.; Aitola, K.; Jiang, H.; Lund, P.D.; Li, Y. Reduced TiO2 nanotube array as an excellent cathode for hydrogen evolution reaction in alkaline solution. Catal. Today 2022, 402, 3–9. [Google Scholar] [CrossRef]
  10. Spanu, D.; Bestetti, A.; Hildebrand, H.; Schmuki, P.; Altomare, M.; Recchia, S. Photocatalytic reduction and scavenging of Hg(II) over templated-dewetted Au on TiO2 nanotubes. Photochem. Photobiol. Sci. 2019, 18, 1046–1055. [Google Scholar] [CrossRef]
  11. Alsheheri, S.Z. Nanocomposites containing titanium dioxide for environmental remediation. Des. Monomers Polym. 2021, 24, 22–45. [Google Scholar] [CrossRef] [PubMed]
  12. Weon, S.; Choi, W. TiO2 Nanotubes with Open Channels as Deactivation-Resistant Photocatalyst for the Degradation of Volatile Organic Compounds. Environ. Sci. Technol. 2016, 50, 2556–2563. [Google Scholar] [CrossRef] [PubMed]
  13. Raj, C.C.; Prasanth, R. Review—Advent of TiO2 Nanotubes as Supercapacitor Electrode. J. Electrochem. Soc. 2018, 165, E345–E358. [Google Scholar] [CrossRef]
  14. Galstyan, V.; Comini, E.; Faglia, G.; Sberveglieri, G. TiO2 Nanotubes: Recent Advances in Synthesis and Gas Sensing Properties. Sensors 2013, 13, 14813–14838. [Google Scholar] [CrossRef]
  15. Kwon, Y.; Kim, H.; Lee, S.; Chin, I.-J.; Seong, T.-Y.; Lee, W.I.; Lee, C. Enhanced ethanol sensing properties of TiO2 nanotube sensors. Sens. Actuators B Chem. 2012, 173, 441–446. [Google Scholar] [CrossRef]
  16. Nah, Y.; Paramasivam, I.; Schmuki, P. Doped TiO2 and TiO2 Nanotubes: Synthesis and Applications. ChemPhysChem 2010, 11, 2698–2713. [Google Scholar] [CrossRef]
  17. Malati, M.A.; Wong, W.K. Doping TiO2 for solar energy applications. Surf. Technol. 1984, 22, 305–322. [Google Scholar] [CrossRef]
  18. Dozzi, M.V.; Selli, E. Doping TiO2 with p-block elements: Effects on photocatalytic activity. J. Photochem. Photobiol. C Photochem. Rev. 2013, 14, 13–28. [Google Scholar] [CrossRef]
  19. Karlsson, R.K.B.; Cornell, A.; Pettersson, L.G.M. The electrocatalytic properties of doped TiO2. Electrochim. Acta 2015, 180, 514–527. [Google Scholar] [CrossRef]
  20. Lai, Y.-K.; Huang, J.-Y.; Zhang, H.-F.; Subramaniam, V.-P.; Tang, Y.-X.; Gong, D.-G.; Sundar, L.; Sun, L.; Chen, Z.; Lin, C.-J. Nitrogen-doped TiO2 nanotube array films with enhanced photocatalytic activity under various light sources. J. Hazard. Mater. 2010, 184, 855–863. [Google Scholar] [CrossRef]
  21. Park, J.H.; Kim, S.; Bard, A.J. Novel Carbon-Doped TiO2 Nanotube Arrays with High Aspect Ratios for Efficient Solar Water Splitting. Nano Lett. 2006, 6, 24–28. [Google Scholar] [CrossRef] [PubMed]
  22. Aijo John, K.; Naduvath, J.; Remillard, S.K.; Shaji, S.; DeYoung, P.A.; Kellner, Z.T.; Mallick, S.; Thankamoniamma, M.; Okram, G.S.; Philip, R.R. A simple method to fabricate metal doped TiO2 nanotubes. Chem. Phys. 2019, 523, 198–204. [Google Scholar] [CrossRef]
  23. Na, S.; Seo, S.; Lee, H. Recent Developments of Advanced Ti3+-Self-Doped TiO2 for Efficient Visible-Light-Driven Photocatalysis. Catalysts 2020, 10, 679. [Google Scholar] [CrossRef]
  24. Zhu, G.; Shan, Y.; Lin, T.; Zhao, W.; Xu, J.; Tian, Z.; Zhang, H.; Zheng, C.; Huang, F. Hydrogenated blue titania with high solar absorption and greatly improved photocatalysis. Nanoscale 2016, 8, 4705–4712. [Google Scholar] [CrossRef]
  25. Zhu, Q.; Peng, Y.; Lin, L.; Fan, C.-M.; Gao, G.-Q.; Wang, R.-X.; Xu, A.-W. Stable blue TiO2−x nanoparticles for efficient visible light photocatalysts. J. Mater. Chem. A 2014, 2, 4429. [Google Scholar] [CrossRef]
  26. Yin, H.; Lin, T.; Yang, C.; Wang, Z.; Zhu, G.; Xu, T.; Xie, X.; Huang, F.; Jiang, M. Gray TiO2 Nanowires Synthesized by Aluminum-Mediated Reduction and Their Excellent Photocatalytic Activity for Water Cleaning. Chem.—A Eur. J. 2013, 19, 13313–13316. [Google Scholar] [CrossRef]
  27. Bessegato, G.G.; Hudari, F.F.; Zanoni, M.V.B. Self-doped TiO2 nanotube electrodes: A powerful tool as a sensor platform for electroanalytical applications. Electrochim. Acta 2017, 235, 527–533. [Google Scholar] [CrossRef]
  28. Zhou, H.; Zhang, Y. Electrochemically Self-Doped TiO2 Nanotube Arrays for Supercapacitors. J. Phys. Chem. C 2014, 118, 5626–5636. [Google Scholar] [CrossRef]
  29. Liao, W.; Yang, J.; Zhou, H.; Murugananthan, M.; Zhang, Y. Electrochemically Self-Doped TiO2 Nanotube Arrays for Efficient Visible Light Photoelectrocatalytic Degradation of Contaminants. Electrochim. Acta 2014, 136, 310–317. [Google Scholar] [CrossRef]
  30. Gan, L.; Wu, Y.; Song, H.; Lu, C.; Zhang, S.; Li, A. Self-doped TiO2 nanotube arrays for electrochemical mineralization of phenols. Chemosphere 2019, 226, 329–339. [Google Scholar] [CrossRef]
  31. Pinto, V.L.; Cervantes, T.N.M.; Soto, P.C.; Sarto, G.; Bessegato, G.G.; de Almeida, L.C. Multivariate optimization of methylene blue dye degradation using electro-Fenton process with self-doped TiO2 nanotube anode. Chemosphere 2023, 344, 140336. [Google Scholar] [CrossRef] [PubMed]
  32. Soto, P.C.; Salamanca-Neto, C.A.R.; Moraes, J.T.; Sartori, E.R.; Bessegato, G.G.; Lopes, F.; Almeida, L.C. A novel sensing platform based on self-doped TiO2 nanotubes for methylene blue dye electrochemical monitoring during its electro-Fenton degradation. J. Solid State Electrochem. 2020, 24, 1951–1959. [Google Scholar] [CrossRef]
  33. Zhang, Z.; Hedhili, M.N.; Zhu, H.; Wang, P. Electrochemical reduction induced self-doping of Ti3+ for efficient water splitting performance on TiO2 based photoelectrodes. Phys. Chem. Chem. Phys. 2013, 15, 15637. [Google Scholar] [CrossRef] [PubMed]
  34. Zhu, W.-D.; Wang, C.-W.; Chen, J.-B.; Li, Y.; Wang, J. Enhanced field emission from Ti3+ self-doped TiO2 nanotube arrays synthesized by a facile cathodic reduction process. Appl. Surf. Sci. 2014, 301, 525–529. [Google Scholar] [CrossRef]
  35. Hong, S.P.; Kim, S.; Kim, N.; Yoon, J.; Kim, C. A short review on electrochemically self-doped TiO2 nanotube arrays: Synthesis and applications. Korean J. Chem. Eng. 2019, 36, 1753–1766. [Google Scholar] [CrossRef]
  36. Pinna, M.; Binda, G.; Altomare, M.; Marelli, M.; Dossi, C.; Monticelli, D.; Spanu, D.; Recchia, S. Biochar Nanoparticles over TiO2 Nanotube Arrays: A Green Co-Catalyst to Boost the Photocatalytic Degradation of Organic Pollutants. Catalysts 2021, 11, 1048. [Google Scholar] [CrossRef]
  37. Lavagnini, I.; Antiochia, R.; Magno, F. An Extended Method for the Practical Evaluation of the Standard Rate Constant from Cyclic Voltammetric Data. Electroanalysis 2004, 16, 505–506. [Google Scholar] [CrossRef]
  38. Chen, W.; Cai, S.; Ren, Q.-Q.; Wen, W.; Zhao, Y.-D. Recent advances in electrochemical sensing for hydrogen peroxide: A review. Analyst 2012, 137, 49–58. [Google Scholar] [CrossRef]
  39. Cha, G.; Schmuki, P.; Altomare, M. Anodic TiO2 nanotube membranes: Site-selective Pt-activation and photocatalytic H2 evolution. Electrochim. Acta 2017, 258, 302–310. [Google Scholar] [CrossRef]
  40. Rao, B.M.; Roy, S.C. Anatase TiO2 nanotube arrays with high temperature stability. RSC Adv. 2014, 4, 38133–38139. [Google Scholar] [CrossRef]
  41. Spanu, D.; Minguzzi, A.; Recchia, S.; Shahvardanfard, F.; Tomanec, O.; Zboril, R.; Schmuki, P.; Ghigna, P.; Altomare, M. An Operando X-ray Absorption Spectroscopy Study of a NiCu−TiO2 Photocatalyst for H2 Evolution. ACS Catal. 2020, 10, 8293–8302. [Google Scholar] [CrossRef]
  42. Macak, J.M.; Gong, B.G.; Hueppe, M.; Schmuki, P. Filling of TiO2 Nanotubes by Self-Doping and Electrodeposition. Adv. Mater. 2007, 19, 3027–3031. [Google Scholar] [CrossRef]
  43. Thi Thanh Thuy, M.; Thi Van Anh, N.; Thi Xuan, M.; Vinh, T.Q.; Thi Binh, P. Study on the photoelectrocatalytic activity of reduced TiO2 nanotube films for removal of methyl orange. Green Process. Synth. 2023, 12, 20228159. [Google Scholar] [CrossRef]
  44. Klingler, R.J.; Kochi, J.K. Electron-transfer kinetics from cyclic voltammetry. Quantitative description of electrochemical reversibility. J. Phys. Chem. 1981, 85, 1731–1741. [Google Scholar] [CrossRef]
  45. AlHoshan, M.S.; BaQais, A.A.; Al-Hazza, M.I.; Al-Mayouf, A.M. Heat treatment and electrochemical activation of titanium oxide nanotubes: The effect of hydrogen doping on electrochemical behavior. Electrochim. Acta 2012, 62, 390–395. [Google Scholar] [CrossRef]
  46. Takata, T.; Domen, K. Defect Engineering of Photocatalysts by Doping of Aliovalent Metal Cations for Efficient Water Splitting. J. Phys. Chem. C 2009, 113, 19386–19388. [Google Scholar] [CrossRef]
  47. Cheng, C.; Long, R. Charge-Compensated Doping Extends Carrier Lifetimes in SrTiO3 by Passivating Oxygen Vacancy Defects. J. Phys. Chem. Lett. 2021, 12, 12040–12047. [Google Scholar] [CrossRef]
  48. Goudon, T.; Miljanović, V.; Schmeiser, C. On the Shockley–Read–Hall Model: Generation-Recombination in Semiconductors. SIAM J. Appl. Math. 2007, 67, 1183–1201. [Google Scholar] [CrossRef]
  49. Trachioti, M.G.; Lazanas, A.C.; Prodromidis, M.I. Shedding light on the calculation of electrode electroactive area and heterogeneous electron transfer rate constants at graphite screen-printed electrodes. Microchim. Acta 2023, 190, 251. [Google Scholar] [CrossRef]
  50. Wang, J. Electrochemical Sensing of Explosives. Electroanalysis 2007, 19, 415–423. [Google Scholar] [CrossRef]
  51. Murugan, P.; Nagarajan, R.D.; Sundramoorthy, A.K.; Ganapathy, D.; Atchudan, R.; Nallaswamy, D.; Khosla, A. Electrochemical Detection of H2O2 Using an Activated Glassy Carbon Electrode. ECS Sens. Plus 2022, 1, 034401. [Google Scholar] [CrossRef]
  52. Yang, Z.; Zhang, X.; Guo, J. Functionalized Carbon-Based Electrochemical Sensors for Food and Alcoholic Beverage Safety. Appl. Sci. 2022, 12, 9082. [Google Scholar] [CrossRef]
  53. Wang, T.; Zhu, H.; Zhuo, J.; Zhu, Z.; Papakonstantinou, P.; Lubarsky, G.; Lin, J.; Li, M. Biosensor Based on Ultrasmall MoS2 Nanoparticles for Electrochemical Detection of H2O2 Released by Cells at the Nanomolar Level. Anal. Chem. 2013, 85, 10289–10295. [Google Scholar] [CrossRef]
  54. Patella, B.; Buscetta, M.; Di Vincenzo, S.; Ferraro, M.; Aiello, G.; Sunseri, C.; Pace, E.; Inguanta, R.; Cipollina, C. Electrochemical sensor based on rGO/Au nanoparticles for monitoring H2O2 released by human macrophages. Sens. Actuators B Chem. 2021, 327, 128901. [Google Scholar] [CrossRef]
  55. Baig, N.; Sajid, M. Applications of layered double hydroxides based electrochemical sensors for determination of environmental pollutants: A review. Trends Environ. Anal. Chem. 2017, 16, 1–15. [Google Scholar] [CrossRef]
  56. Sanford, A.L.; Morton, S.W.; Whitehouse, K.L.; Oara, H.M.; Lugo-Morales, L.Z.; Roberts, J.G.; Sombers, L.A. Voltammetric Detection of Hydrogen Peroxide at Carbon Fiber Microelectrodes. Anal. Chem. 2010, 82, 5205–5210. [Google Scholar] [CrossRef] [PubMed]
  57. de Oliveira, R.H.; Gonçalves, D.A.; dos Reis, D.D. TiO2/MWCNT/Nafion-Modified Glassy Carbon Electrode as a Sensitive Voltammetric Sensor for the Determination of Hydrogen Peroxide. Sensors 2023, 23, 7732. [Google Scholar] [CrossRef]
  58. Dutta, A.K.; Maji, S.K.; Srivastava, D.N.; Mondal, A.; Biswas, P.; Paul, P.; Adhikary, B. Peroxidase-like activity and amperometric sensing of hydrogen peroxide by Fe2O3 and Prussian Blue-modified Fe2O3 nanoparticles. J. Mol. Catal. A Chem. 2012, 360, 71–77. [Google Scholar] [CrossRef]
  59. Majumder, S.; Saha, B.; Dey, S.; Mondal, R.; Kumar, S.; Banerjee, S. A highly sensitive non-enzymatic hydrogen peroxide and hydrazine electrochemical sensor based on 3D micro-snowflake architectures of α-Fe2O3. RSC Adv. 2016, 6, 59907–59918. [Google Scholar] [CrossRef]
  60. Cai, J.; Ding, S.; Chen, G.; Sun, Y.; Xie, Q. In situ electrodeposition of mesoporous aligned α-Fe2O3 nanoflakes for highly sensitive nonenzymatic H2O2 sensor. Appl. Surf. Sci. 2018, 456, 302–306. [Google Scholar] [CrossRef]
  61. Sun, X.; Wang, C.; Su, D.; Wang, G.; Zhong, Y. Application of Photocatalytic Materials in Sensors. Adv. Mater. Technol. 2020, 5, 1900993. [Google Scholar] [CrossRef]
Figure 1. (a) Top-view and (b) cross-section SEM images of TiO2 nanotubes after anodization and crystallization.
Chemosensors 11 00560 g001
Figure 2. XRD pattern of as-formed (black line), crystalline (blue line), and electrochemically self-doped TiO2 nanotubes (red line). The peak labels are indicated as follows: A = Anatase; Ti = Titanium (substrate); Al = Aluminum (sample holder).
Chemosensors 11 00560 g002
Figure 3. SEM top-view image of TiO2 nanotubes after self-doping at −2.5 V for (a) 5 min and (b) 30 min.
Chemosensors 11 00560 g003
Figure 4. SEM top-view image of titanium dioxide nanotubes after self-doping at −1.5 V for (a) 5 and (b) 30 min.
Chemosensors 11 00560 g004
Figure 5. Cyclic voltammograms (scan rate = 50 mV/s) obtained for all samples self-doped at −1.5 V (blue lines) and for the undoped sample (black line) in K3[Fe(CN)6] 5 mM and KNO3 100 mM. Labels refer to the duration of the electrochemical self-doping process.
Chemosensors 11 00560 g005
Figure 6. Cyclic voltammograms obtained for the sample activated at −1.5 V for 10 s in K3[Fe(CN)6] 5 mM and KNO3 100 mM at different scan rates.
Chemosensors 11 00560 g006
Figure 7. (a) Linearization to graphically determine the value of k0 for the sample activated for 10 s. (b) Estimated values of k0 for materials self-doped for different times.
Chemosensors 11 00560 g007
Figure 8. Voltammograms recorded in phosphate buffer (pH = 7) as a function of hydrogen peroxide concentration for the sample activated for 30 s.
Chemosensors 11 00560 g008
Figure 9. Voltammograms recorded in phosphate buffer (pH = 7) as a function of hydrogen peroxide concentration after subtracting the blank signal for the sample activated for 30 s.
Chemosensors 11 00560 g009
Figure 10. Correlation between peak height (located at 1.25 V) and hydrogen peroxide concentration for the sample activated for 30 s. Linear fitting was performed in the range of 20–160 µM.
Chemosensors 11 00560 g010
Figure 11. Variation in sensitivity (blue bars) and linearity range (red bars) toward hydrogen peroxide detection observed for materials activated for different times.
Chemosensors 11 00560 g011
Figure 12. Photocatalytic degradation of methylene blue observed on TiO2 electrochemically activated for 30 s (black) and on undoped TiO2 (red).
Chemosensors 11 00560 g012
Table 1. Electroactive surface area value estimated by applying the Randles–Sevcik model.
Self-Doping TimeElectroactive Surface Area (cm2)
10 s0.09
30 s0.19
60 s0.20
300 s0.18
1800 s0.16
Disclaimer/Publisher’s Note: The statements, opinions and data contained in all publications are solely those of the individual author(s) and contributor(s) and not of MDPI and/or the editor(s). MDPI and/or the editor(s) disclaim responsibility for any injury to people or property resulting from any ideas, methods, instructions or products referred to in the content.

