Abstract
The aim of the present study is to evaluate the potential of mid-infrared spectroscopy in combination with two-dimensional correlation spectroscopy (2DCOS) and partial least squares discriminant analysis (PLS-DA) to monitor molecular structure evolution of milk mixtures of two species (cow and camel) during enzymatic coagulation. Molecular structure changes and texture characteristics were investigated on five different milk formulations by mixing camel milk (CaM) and cow milk (CM) (i.e., CaM, CaM3:CM1, CaM1:CM1, CaM1:CM3, and CM, (v/v)). Regarding MIR spectroscopy, two spectral regions were considered to monitor milk coagulation, the fatty acid acyl-chain region (3000–2800 cm−1) and the protein region (1700–1500 cm−1). Different formulation dissimilarities were revealed through the synchronous 2DCOS spectra and their respective auto-peaks. Moreover, using the cross-peak symbols of the synchronous and asynchronous spectra helps to establish the sequence of molecular structure modifications during coagulation. Finally, the analysis of the 2DCOS-MIR synchronous and asynchronous maps by PLS-DA gave good discriminant accuracy (88 to 100%) between each formulation. Those results highlighted that different synchronous and asynchronous chemical phenomena occurred during milk coagulation depending on the milk formulation. Texture attributes were influenced by camel milk ratio in mixtures based on the initial composition of milks. Samples containing more than 50% of CM showed significantly higher hardness compared to pure CaM and CaM3:CM; however, CM gel displayed lower springiness contrary to CaM. Textural characteristics of the resulted gels also confirmed that 2DCOS MIR observations are consistent with textural observations of the gels obtained after milk mixtures coagulation.
1. Introduction
Camel milk (CaM) represents the main food source in many parts of the world, especially for people living in arid and semi-arid areas. It is generally consumed either in raw or fermented form. Over the last decades, the interest in CaM has increased [1] and has attracted the attention of several researchers [2,3,4,5]. This interest is mostly associated with its nutritional composition and benefits for human health. This milk presents a high level of minerals (e.g., K+, Cu2+, and Mn2+), vitamin C, and low cholesterol content when compared to bovine milk. It contains also essential polyunsaturated fatty acids (e.g., linolenic, palmitinic, and myristic), various bacteriostatic enzymes (e.g., lysozyme), protective proteins (e.g., lactoferrin, lactoperoxidase, and immunoglobulins) [2,6,7,8,9], potential therapeutic properties, such as antidiabetic, antibacterial, and anticarcinogenic [3,10,11].
Unlike cow milk, obtaining satisfactory cheese products from CaM is reported to be challenging. This is principally assigned to its low concentration of κ-casein, the small size of the fat globules, as well as a high content of antimicrobial factors [12,13]. In order to increase the consumption of this milk and to allow consumers and dairy companies to benefit from its nutritional qualities and advantages, mixing CaM to bovine milk constitutes an interesting opportunity to diversify the dairy market and to improve the nutritional, physicochemical, and sensory properties of available dairy products [14,15,16,17].
Most of dairy products making requires good management of milk coagulation, a process mainly based on a series of chemical, physicochemical modifications, and microbiological activities resulting in a gel formation. Moreover, the coagulation kinetics and the structural aspects of protein-protein, protein-water, protein-lipid, and lipid-lipid interactions determine the rheological properties of the gels and consequently the quality features of the final cheese product [18]. Until now, the monitoring of curd formation and the identification of curd cutting time were mainly managed by skilled operators by controlling different process parameters, such as the vat temperature, the rennet activity, the concentration of calcium salt concentration and pH [19]. These empirical and fastidious monitoring strategies can result in failures in milk coagulation leading to decrease in cheese quality and increase in food waste generally associated to economical loss.
Choosing a dairy product does not only depend on its quality but primarily on its characteristics related to sensory acceptance, such as parameters that can be measured by texture profile analysis (TPA) [20], which provides textural information such as hardness, cohesiveness, adhesiveness, gumminess, springiness, and chewiness [21,22]. However, a major inconvenience of mechanical techniques is their destructive aspect. To overcome this condition, several studies have focused on modeling the relationship between destructive and nondestructive techniques [23,24,25,26] to provide an alternative technology for the food industry. Over the last decade, many researchers have been interested in non-destructive methods such as mid-infrared spectroscopy (MIR) coupled with chemometric techniques (e.g., principal components analysis), to investigate the molecular structure of milk and dairy products [27,28,29,30,31]. The development of this technology for the rapid and simultaneous measurement of molecular structure evolution and component interactions of milk mixtures throughout coagulation can help dairy industries to predict the quality features of the final product using chemometric tools.
Because of the high complexities of molecular structure modification of milk during coagulation, most observed MIR bands cannot be simply and directly assigned to a single structure change, and spectrum interpretation may be misleading. Therefore, in the present paper, we proposed to use an original approach combining two-dimensional correlation spectroscopy (2DCOS) and partial least squares discriminant analysis (PLS-DA) to delineate molecular structure changes occurring during milk coagulation. 2DCOS is an analytical technique that combines experimental design and data processing which was established and generalized by Noda in 1986 and 1993, respectively [32,33], and it is very useful to provide a high-resolution spectrum. Moreover, numerous chemometric tools can be applied to build classification models, among them PLS-DA which is used to reduce the dimensionality of spectral data, facilitate the extraction of valuable information, and could allow the distinction between the different formulation samples during milk coagulation.
2. Materials and Methods
2.1. Milk Sampling and Coagulation
Milk sampling was performed for two years in 2019 and 2021. For each year, a volume of 500 mL of fresh CaM was collected from a local dairy farm of 8 animals (Sahraoui breed) located at Fez, Morocco. Concerning fresh cow milk (CM), in 2019 a volume of 1 L was obtained from a local dairy farm of 30 animals (Holstein breed) located in Marmilhat, France. In 2021, cow milk was purchased from a local retail (label: Coeur de fermier) located in Lempdes, France. This sampling was performed in order to increase the diversity of the milk samples origin. For milk collected in farms, previously sterilized containers were used. For each year, once arrived at the laboratory, milk samples were kept at −20 °C until analysis. CaM was transported by plane to France in refrigerated condition using an icebox. Before analysis milk samples were first thawed at 4 °C for 24 h, kept at room temperature (~20 °C) for 20 min, and warmed to 40 °C (±1 °C) in a water bath. Different mixtures containing different volume fractions of CaM and CM were prepared. The volume fractions (%) of CaM in the different formulations were 100% (i.e., CaM), 75% (i.e., CaM3:CM1, v/v), 50% (i.e., CaM1:CM1, v/v), 25% (i.e., CaM1:CM3, v/v), and 0% (i.e., CM).
2.2. Physicochemical Composition of Milk Mixtures
The pH of the five milk mixtures was measured using a digital pH meter (Testo 205, Testo, Germany). The pH meter was calibrated with standard buffer solutions of pH 4.0 and 7.0 (HANNA instruments). The average composition of milk mixtures was analyzed via the Gerber method for fat, the Kjeldahl method for protein, the colorimetric method for lactose, and dry matter by drying, according to their normative references, ISO 488:2008, ISO 8968-1:2014, and ISO 26462:2010, respectively. The freezing point of milk samples was determined according to the reference method using the thermistor cryoscope (Advanced Cryoscope, Model 4D3, Advanced Instrument, Inc., Norwood, MA, USA). The result of the freezing point was expressed in millicelsius according to the international standard [34]. All the analyses were made as the average of triplicate measurements.
2.3. Texture Profile Analysis
Texture profile analysis (TPA) was performed on milk after coagulation. Before measurement, 5 µL of rennet was added to 20 mL of 40 °C preheated milk poured into a cup (cylinder mold with 20 mm in diameter). The milk was maintained at 40 °C during the coagulation process by a water bath for 115 min to ensure complete coagulation. The TPA measurements were performed using the Kinexus pro+ (Malvern Instruments, Malvern, UK) with an acrylic cylindrical probe presenting a 12.7 mm diameter and a 14 mm high (reference: 04178C74E0). Before measurement, samples were held at 20 °C for 10 min with the Peltier-heating element of the Kinexus pro+ device. The samples were then compressed to 15% of their original height, using two compression cycles. Mechanical characteristics of hardness, springiness, cohesiveness, and gumminess were selected from the two successive uniaxial compression cycles of TPA as reported by Pons and Fiszman [35]. Each test was performed in triplicate on each formulation.
2.4. Acquisition of Mid-Infrared Spectra during Coagulation
MIR spectra were recorded by using a Tensor II Series Fourier transform spectrometer (Bruker, Billerica, MA, USA) mounted with a thermostated ATR ZnSe accessory (6 reflections, incident angle 45°). Measurement range located between 3800 and 900 cm−1 has been considered in this study at a resolution of 4 cm−1. The spectra acquisition was performed with the OPUS software version 7.5 (Bruker, Billerica, MA, USA). To improve the signal-to-noise ratio, 32 scans were recorded per spectrum. Before spectral acquisition and according to the manufacturer’s reference, 0.25 µL/mL of commercial rennet (CHY-MAX® M—Chr. Hansen) was added to the 10 mL of milk mixtures (CaM, CaM3:CM1, CaM1:CM1, CaM1:CM3 and CM (v/v)) previously heated at 40 °C. After gentle mixing by hand (10 s), milk was immediately deposited on a ZnSe ATR accessory warmed at 40 °C. The temperature was maintained during the coagulation experiment by using a Specac temperature controller series 4000 (Eurolabo, Paris, France). During coagulation, the MIR spectra were recorded on the same sample formulation each 5 min for 115 min (i.e., giving a total of 24 spectra). Three replicates were performed per formulation. The spectra were subjected to smoothing by the savgol algorithm (polynomial order: 2, sliding: 11-point spectral window) [36] and subjected to a Standard Normal Variate (SNV) correction by using the PLS toolbox 8.5.2 (Eigenvector Research, Manson, WA, USA) in MATLAB 8.0.0.783 (R2012b) (The MathWorks, Natick, MA, USA).
2.5. Two-Dimensional Correlation Spectroscopy
The two-dimensional correlation spectroscopy-mid-infrared spectra (2DCOS-MIR) were calculated after treatment of the collections of coagulation time-dependent dynamic spectra using an in-house software program in MATLAB. The synchronous and asynchronous 2DCOS spectra were calculated by the generalized 2DCOS algorithm after considering coagulation time (0 to 115 min) as the external perturbation. This technique provides better resolution by simplifying the spectral data, allowing for more distinct band assignments, and offering the potential to explore the sequential order of the measured intensity changes [37]. As previously reported by Noda and Ozaki [37] and Boukria et al. [38], the reference spectra were chosen as the average spectrum. The 2DCOS spectral intensities are organized as a function of wavelength variables. The 2D map presents two orthogonal axes that represent spectral variables, and the third one, normal to the plane, which exhibits the intensity. In the 2DCOS map, the blue regions are defined as negative ones, while the red regions are defined as positive correlation intensities. To highlight detailed differences that can emerge from fat and proteins during coagulation, the 2DCOS analysis was performed separately on two wavelength regions for the five different formulations. The regions between 3000–2800 cm−1 (1) essentially associated to fatty acid acyl-chain vibrations and the 1700–1500 cm−1 (2) usually used for protein structure studies.
2.6. Statistical Analysis
The Tukey test was performed to investigate significant difference (p < 0.05) between means of the physicochemical properties on the one hand, and on the other, of the textural properties of the five milk formulations (CaM, CaM3:CM1, CaM1:CM1, CaM1:CM3, and CM (v/v)) using SPSS Statistics 26.0.0 (SPSS Armonk, NY: IBM Corp.) and Microsoft® Office Excel 2013 (Microsoft Corporation, Santa Rosa, CA, USA). The mean difference between auto-peak spectra intensity identified on the 2DCOS synchronous maps of milk formulations was statistically evaluated by one-way analysis of variance (ANOVA) through LSD test (p < 0.05) using Microsoft® Office Excel 2013 (Microsoft Corporation, Santa Rosa, CA, USA).
2.7. Partial Least Square Discriminant Analysis
PLS-DA is a supervised classification method. The objective of the method is to separate groups of individuals as best as possible. Its fundamental principle is to create new variables Y, of dimension n × k, formed by the indicators of the groups where n and k represent the number of individuals and groups, respectively.
For each MIR wavelength range cited above (1 and 2), the 2DCOS spectra calculated on the five milk formulations (CaM, CaM3:CM1, CaM1:CM1, CaM1:CM3, and CM (v/v)) were concatenated to build a new 3D-2DCOS data cube. This data cube was then analyzed by PLS-DA after unfolding. Before performing PLS-DA, data were split into two data sets. The data recorded during the year 2019 (24 spectra × 5 milk mixtures × 3 repetitions) was used for calibration and cross-validation steps (venetian blinds, number of data splits: 5) and the samples analyzed in the year 2021 (24 spectra × 5 milk mixtures × 3 repetitions) were used for external validation. The optimum number of PLS-DA factors was defined by analyzing the percentage of validation error and the performance of each PLS-DA model was evaluated after considering the sensitivity (Equation (1)), specificity (Equation (2)), accuracy (Equation (3)), and error (Equation (4)) percentages:
3. Results and Discussion
3.1. Physicochemical Composition of Milk Mixtures
The average data of pH, fat, protein, lactose, dry matter, and freezing point obtained for the five milk mixtures used in this study along with their statistical analysis are presented in Table 1. Physicochemical analyses conducted on pure milks showed a significant difference (p < 0.05) between pH values of CaM and CM (i.e., 6.45 ± 0.02 and 6.55 ± 0.02, respectively). This finding agrees with that reported by Gorban and Izzeldin [39]. Moreover, the pH showed a slight decrease when increasing the CaM ratio. CM had the highest content of fat, protein, and dry matter, whereas CaM showed the lowest contents as noted by Kamal, et al. [40]. Therefore, these later decreased significantly (p < 0.05) with increasing the proportion of CaM into CM. However, increasing the CaM proportion in the mixture reduced lactose and freezing point, of which the highest values occurred for pure CaM. Thus, as expected, the composition of milk mixtures is clearly related to the ratio of CaM and CM and their chemical and physicochemical characteristics.

Table 1.
Physicochemical composition of the five milk mixtures.
3.2. Texture Profile Analysis
Hardness, springiness, cohesiveness, and gumminess results were presented in Figure 1 showing how milk mixtures affected the texture profile of the four parameters. The results of the five formulations were compared between them for each parameter separately. Concerning hardness, milk gels containing more than 50% of CM showed a significant difference in hardness compared to pure CaM and CaM3:CM1. These results corroborated with Kamal-Eldin et al. [41] and Abdalla et al. [42] who observed that adding CaM increase the weakness of the gel protein network. Concerning springiness, significant differences (p-value < 0.05) were noted between pure CaM, CM, and gel containing both milks (Figure 1). CaM gel presented the highest value of springiness indicating the springy character of this gel compared to the other samples as reported by Abdalla et al. [42]. Cohesiveness showed significant variation between gel samples. It decreased significantly when increasing the proportion of CaM in samples. CM gel indicated the highest value compared to the others. These results contradicted those of Abdalla et al. [42], who noted that there were no significant differences between mixtures. Gumminess displayed the same behaviors and differences as for cohesiveness. Gels containing up to 75% of CaM exhibited the lowest values of gumminess contrary to CM gel indicating the highest value. Gumminess increased with decreasing CaM ratio in the formulation.
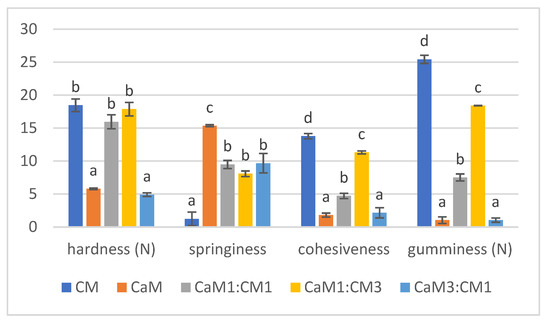
Figure 1.
TPA parameters (hardness, springiness, cohesiveness, and gumminess) of camel milk (CaM), cow milk (CM) and their mixtures (CaM3:CM1, CaM1:CM1, CaM1:CM3). Letters a, b, c and d indicate significant differences for each parameter. In order to represent the different TPA parameters on the same graph, hardness, springiness, cohesiveness and gumminess were multiplied by a factor of 102, 10, 10, and 10, respectively.
The results highlighted that CaM and gel containing higher CaM content (CaM3:CM1) fails to form a firm gel which may be due to low content of total solids, especially casein [43]. Moreover, CaM has smaller fat globules compared to CM which can contribute to the decrease of the gel firmness [44]. Additionally, CM with smaller micelles forms a more compact and harder gel network than CaM with bigger micelles [45,46,47]. This difference could be attributed to the variation in the proportion of κ-casein since the micelle size decreased with the increase of κ-casein proportion [48]. CaM micelles can affect the coherence of the dominant para-casein network of CM, causing weak points in the matrix and reducing the hardness.
CaM (lower-fat milk) would have a more homogeneous and connected network than CM, with fewer structural inhomogeneities caused by the fat. This more connected structure could be why CaM gel had higher springiness because fat breaks up the protein matrix and plays the role of lubricant to provide smoothness and a softer texture [49].
The physicochemical and textural results show that the addition of CaM to CM significantly affected the texture properties of the final product. However, how the CaM and CM micelles interact and fuse to form a coherent matrix remains unclear and requires further investigation using advanced techniques, like MIR spectroscopy. These techniques could provide additional information to characterize structural changes at the molecular level during milk coagulation and their relationship with the final product texture.
3.3. One-Dimensional Description of the MIR Spectra
The MIR spectra of CM during coagulation are shown in Figure 2. MIR spectra exhibited different wavelength bands. The first one between 3800–3000 cm−1 is associated with strong O-H stretching vibrations. The second one from 3000–2800 cm−1 is assigned to C-H stretching of fatty acid [50]. The third one from 1700–1500 cm−1 is generally related to peptide and protein vibrations [51]. The fourth region from 1500–900 cm−1 is usually associated with C-H, C-O-H bending, C-O, C-C, and P=O stretching which is reported as the fingerprint region [52,53].
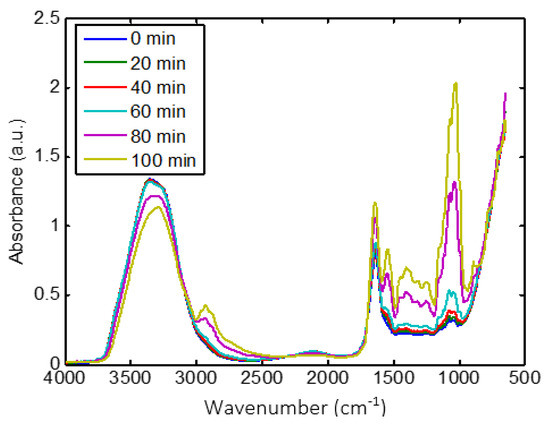
Figure 2.
Overview of the effect of coagulation time on MIR spectra recorded on CM sample.
CM milk coagulation significantly changed the intensities and the shapes of MIR spectra (Figure 2). As coagulation time increased from 0 to 115 min, the intensity of the broad water band (3800–3000 cm−1) decreased, which is associated to the interaction of free water with other components, such as proteins [54]. However, the remaining wavelength ranges showed an increase in intensity. The region between 3000–2800 cm−1 was dominated by two bands at 2921 and 2854 cm−1, which may be attributed to the variation in the physical characteristics of triglycerides in fat globules [30,55]. These changes can certainly be assigned to modifications of the molecular environment of fat globules due to the development of the protein matrix that wrapped them during coagulation [56]. The band observed around 1650 cm−1 is generally assigned to amide I, which is classically used to investigate the secondary structures of proteins, while the variations around 1607 cm−1 are linked to protein aggregation [57]. The absorption band at 1540 cm−1 is attributed to amide II [52]. The changes in intensities related to proteins (1700–1500 cm−1) can be assigned to protein/water interaction and to the modification of casein structure due to proteolytic activity and their rearrangement due to the coagulation process [31,51,58]. Regarding the fingerprint range, the intensity of bands around 1500 to 900 cm−1 increased during coagulation. The band located at 950 cm−1 is related to unsaturated fatty acids, based on the CH out-of-plane deformation [59]. The bands at about 1050, 1100, 1150, 1220, and 1300 cm−1 are linked to the absorbance of phosphate in milk [52,60]. Moreover, the shape of the peak at about 1050 cm−1 is sharpened.
Spectra of the five milk formulations (CaM, CaM3:CM1, CaM1:CM1, CaM1:CM3, and CM (v/v)) at time 0 and 115 min are presented in Figure 3a,b, respectively. The shape of the MIR spectra (Figure 3a) recorded at time 0 min is almost the same between milk formulations with small differences between 3800–3000 and 1500–900 cm−1. These differences could be related to differences between CaM and CM compositions cited above [15]. However, sensitive changes in intensities and shapes of MIR spectral bands were observed between milk formulations at the end of the coagulation time (i.e., 115 min). Although these differences may be attributed to the physicochemical characteristics (Table 1) of the initial mixed milk. This can highlight differences in the structure of milk gels obtained at the end of the coagulation as confirmed by the texture profile of the gel (Figure 2). Despite bands assignment to vibrational molecules, direct observation of 1-D spectral data did not allow a deeper analysis of the effects of coagulation time and milk formulations on spectral changes. Therefore, 2DCOS and PLS-DA were used to more deeply analyze the differences between milk formulations during the coagulation process especially in the fat and proteins spectral ranges.
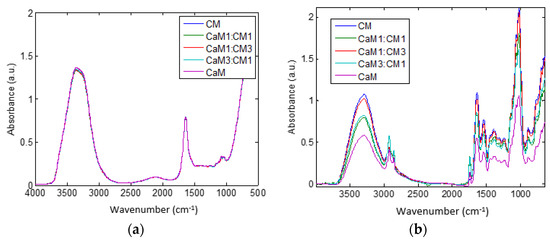
Figure 3.
Spectra of different mixtures of camel milk (CaM) and cow milk (CM) at time (a) 0 min and (b) 115 min. Milk formulations are noted as follow: CaM, 3CaM:1CM, 1CaM:1CM, 1CaM:3CM, and CM (v/v).
3.4. Two-Dimensional MIR Spectra Analysis
2DCOS (Figure 4 and Figure 5) method is very informative to identify sequential and out-of-phase physicochemical variations. The synchronous 2DCOS map is characterized by auto-peaks and cross-peaks. The auto-peaks were used in the present study to identify the autocorrelation intensity changes of the functional group, while the cross-peaks observed in the synchronous map are highlighting intermolecular or intramolecular interaction [61] observed during coagulation time. The asynchronous map is characterized by cross-peaks. Those peaks identify the phase of spectral intensity signal that corresponded to two different wavelengths, so they could contribute to distinguishing overlapping peaks of different components [62].
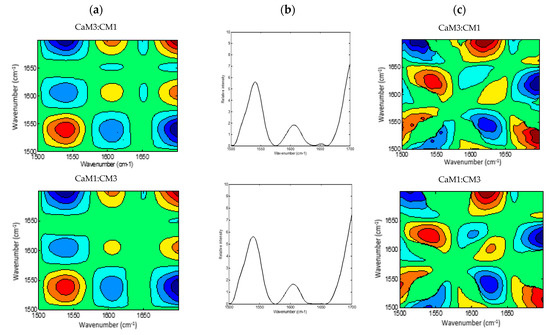
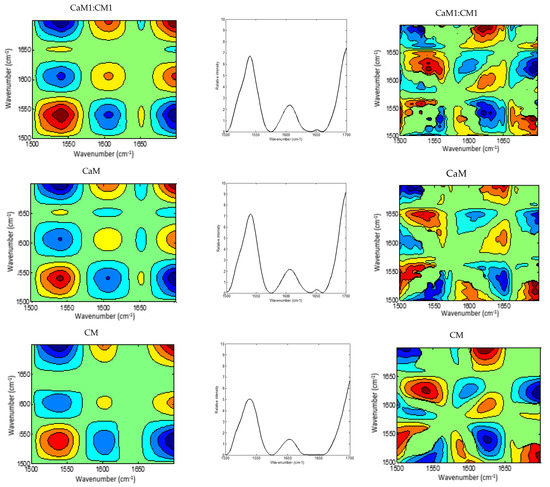
Figure 4.
2DCOS MIR spectra of camel milk (CaM), cow milk (CM) and their mixtures (CaM3:CM1, CaM1:CM1, CaM1:CM3) in protein region: (a) synchronous spectra with their (b) auto-peaks and (c) asynchronous spectra. [The blue regions are defined as negative ones, while the red regions are defined as positive correlation intensities].
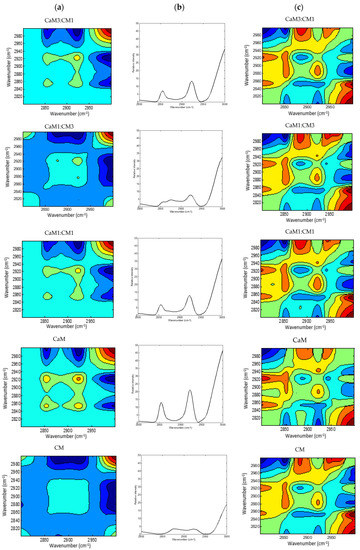
Figure 5.
2DCOS MIR spectra of camel milk (CaM), cow milk (CM) and their mixtures (CaM3:CM1, CaM1:CM1, CaM1:CM3) in fatty acid acyl-chain region: (a) synchronous spectra with their (b) auto-peaks and (c) asynchronous spectra. [The blue regions are defined as negative ones, while the red regions are defined as positive correlation intensities].
A global overview of the 2DCOS maps (Figure 3 and Figure 4), suggested some differences between the five milk formulations during coagulation related to the width, intensity, position, and presence or absence of bands. These differences were both noted in the synchronous and asynchronous maps suggesting coincidental and not straightforward sequence (delayed or accelerated) of physicochemical events during milk coagulation. According to Noda’s rule, the sequence of the spectral intensity variations at variables υ1 and υ2 can be determined based on the sign of the cross peaks at variables υ1 and υ2 in both synchronous and asynchronous 2DCOS-MIR maps. Changes in band intensity at υ1 occur before υ2 when the same signs are observed in synchronous and asynchronous cross-peaks; however, the intensity change in υ2 occurs before υ1 when opposite signs are noted [63].
The region of 1700–1500 cm−1 was selected to produce 2DCOS spectra (Figure 4a,b), which makes the synchronous and asynchronous spectra exhibit specific protein changes. Hence, the synchronous spectra of CaM, CM, and their mixtures highlighted three auto-peaks with different intensities, two strong peaks located at 1540 and 1700 cm−1 and a weak one at 1607 cm−1. Off-diagonal peaks in the synchronous map of the five formulations displayed a negative sign at (1540, 1607 cm−1) and (1540, 1700 cm−1) and a positive one at (1607, 1700 cm−1). Moreover, the synchronous map of samples containing CaM presented a weak negative peak at (1650, 1700 cm−1), those containing up to 75% of CaM showed a negative peak at (1607, 1650 cm−1), although CaM and CaM1:CM1 samples revealed a positive cross-peak at (1540, 1650 cm−1). These differences between formulations during coagulation could be related to protein content, casein structures, and their concentrations in the initial milks.
Regarding the auto-peak intensities, no significant differences between milk samples (p < 0.05) could be observed for peaks located at 1540, 1607, 1700 cm−1 (Figure 6a). However, the peak centered at 1650 cm−1 associated to α-helix vibration [64] presented significant differences between CM and samples containing at least 50% CaM (CaM, CaM1:CM1, and CaM3:CM1). These results highlight differences in the casein aggregation and therefore casein secondary structure and interactions (e.g., protein–protein and protein–water) during milk coagulation [31,51] for milk formulation containing more than 50% of CaM when compared to CM [65].
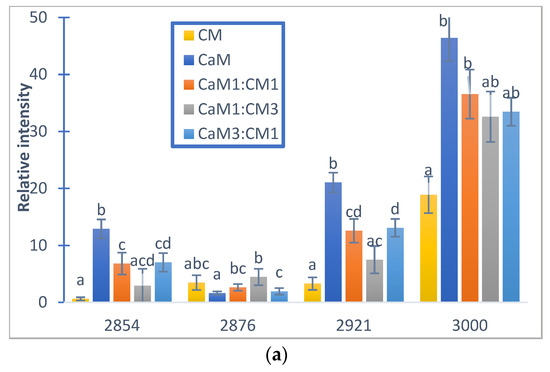
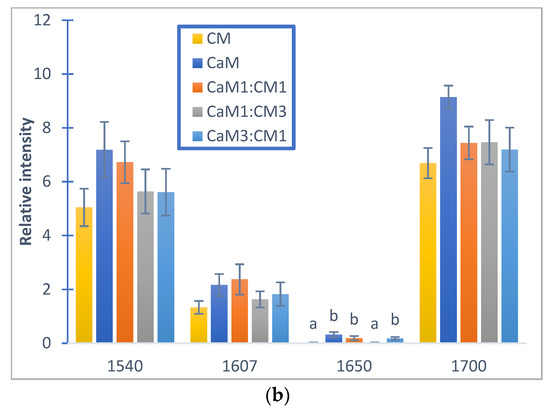
Figure 6.
Relative auto-peak intensity of camel milk (CaM), cow milk (CM) and their mixtures (CaM3:CM1, CaM1:CM1, CaM1:CM3) in: (a) fatty acid acyl-chain region and (b) protein regions. Letters a, b, c and d indicate significant differences. Auto-peaks with different letters are significantly different (p < 0.05).
The asynchronous map displayed six main cross-peaks above the diagonal, two positive peaks at (1540, 1650 cm−1) and (1607, 1700 cm−1) and four negative ones at (1540, 1607 cm−1), (1540, 1700 cm−1), (1607, 1650 cm−1), and (1650, 1700 cm−1). 1607, 1650, and 1700 cm−1 are associated to the amide I band vibration of proteins. The 1607 cm−1 is associated to the intermolecular β-sheet [66], the 1650 cm−1 is associated to α-helix vibration [64] and the 1700 cm−1 can be assigned to the turn structure of proteins [67,68,69]. The 1540 cm−1 can be related to the amide II vibration that is considered more complex than the amide I for secondary structure assignment [51,58].
The different signs of synchronous and asynchronous cross-peaks are presented in Table 2. According to Noda’s theory, the change order of the main four peaks is 1540 cm−1 > 1607 cm−1 > 1650 cm−1 > 1700 cm−1. We hypothesized that changes in those bands can be associated to the physicochemical events occurring during the coagulation of milk by chymosin. This sequence relied on structural modifications in the protein region which presented information on the proteins and on the interaction that this latter can develop with other components, such as ions, water, and other proteins [51].
Table 2.
The results of 2DCOS analysis of MIR spectra in protein region during milk coagulation: peak assignments and the signs of the cross-peaks in synchronous spectra and asynchronous spectra (shown in bracket).
The 1540 cm−1 band modification, describing amide II vibrations, can be related to enzymatic cleavage of the surface κ-caseins of casein micelles [70], which can be associated to the modification of the casein micelle hydration. Indeed, this band is very sensitive to protein hydration due to the high contribution of the N-H bending (40–60% of the potential energy) [71]. The peak at 1607 cm−1 may be linked to the swelling of the micelles and the dissociation of caseins [72]. When the hydrolysis of κ-caseins was considerable, the micelle aggregation started allowing the formation of a gel. The band located at 1650 cm−1, associated to α-helix vibration, revealed the changes in the secondary structure of milk proteins [69]. The 1700 cm−1 peak can be attributed to the modification of the protein-protein interaction [73].
Figure 5a,b presented the 2DCOS synchronous maps and their respective auto-peak spectra calculated on the MIR region (3000–2800 cm−1) region mainly associated to acyl-chain fatty acids. The CM and CaM presented two common auto-peak at 3000 cm−1 (stretching symmetric vibration of C-H of cis double bonds =CH), 2921 cm−1 (symmetric stretching vibration of methylene groups -CH2-), and one specific band located at 2854 cm−1 (asymmetric stretching of methylene groups -CH2-) for CaM and 2876 cm−1 (CH3 symmetric stretching vibration) [74,75] for CM. Those two auto-peaks were also observed during the coagulation of the milk mixtures (i.e., CaM1:CM1, CaM3:CM1, and CaM1:CM3) that exhibited four auto-peaks. Significant differences (p-value < 0.05) in auto-peak intensities were noted between milk samples (Figure 6). For example, the auto-peak located at 3000 cm−1 highlighted a difference in intensities between CM and CaM, CaM1:CM1. CM showed significant differences in intensity compared to the formulation containing more than 50% of CaM at 2921 and 2854 cm−1. However, the auto-peak centered at 2876 cm−1 indicated no significant difference between CM and the other formulations.
In the synchronous map, different cross-peaks can be observed. The cross-peak at (2854 and 2921 cm−1) is positive suggesting a variation of absorbance intensity of those two peaks in the same direction during coagulation. While the opposite was noted between the peak cluster located between 2850–2950 cm−1 and the 3000 cm−1 peak.
Regarding the asynchronous spectra, all the five formulations displayed two negative cross peaks located at (2876, 2921 cm−1) and (2800, 3000 cm−1) with different intensities in addition to a broad positive peak located at (2854, 2921 cm−1).
The different signs of synchronous and asynchronous cross-peaks (Table 3) lead to the sequence of structural modifications in the fatty acid acyl-chain region following the order of 3000 cm−1 > 2854 cm−1 > 2921 cm−1 > 2876 cm−1. Several factors, such as fatty acid compositions, native milk fat globule size, level of fat, and properties of fat globule membrane materials, can influence various properties of cheese. It is known that the average size of fat globules from CaM is smaller than that from CM [44,76] and that this can influence the fat globule and casein interactions [77] and therefore the kinetic of milk fat bands modification during milk coagulation which affects the texture properties of the final product.
Table 3.
The results of 2DCOS analysis of MIR spectra in fatty acid acyl-chain region during milk coagulation: peak assignments and the signs of the cross-peaks in synchronous spectra and asynchronous spectra (shown in bracket).
3.5. PLS-DA Applied to 2DCOS Maps
In order to highlight if differences identified by synchronous and asynchronous maps can discriminate samples during coagulation 2DCOS maps were analyzed by PLS-DA. The performance of the PLS-DA models was evaluated in terms of qualitative analytical validation, such as sensitivity, specificity, accuracy, and error. Sensitivity presents the ability of the model to classify samples belonging to a particular class. If all samples are correctly classified by the model into a given class, then that class sensitivity is equal to 100%. Moreover, specificity refers to the incorrect prediction of validation samples of other classes within a particular class. Therefore, if the model has no error in the prediction of a sample, this model has a specificity equal to 100%. The accuracy is the proportion of correct classification, independent of the class. Regarding the synchronous maps, 2DCOS models associated to protein and fat wavelength ranges give high quality for both calibration and prediction steps (Table 4). Those two models presented no error (0%) and a value of 100% for sensitivity, specificity, and accuracy whatever the milk formulations. Whatever the milk formulation, when considering asynchronous spectra for protein range values of 100% for sensitivity, specificity, and accuracy and an error of 0% when obtained for both calibration and prediction sets. For the fat range, a decrease in the quality of prediction was noted with an increase in the mean error to 13% and a decrease in sensitivity, specificity, and accuracy to respectively 80, 95, and 88%. Those observations suggested that synchronous and asynchronous 2DCOS maps of protein modification provided the best result for classification accuracy during coagulation. These results suggested that synchronous and asynchronous physicochemical events occurring during milk coagulation are sufficiently different to discriminate milk depending on their formulation. Furthermore, these findings can rely on differences in CaM and CM composition. CaM caseins are characterized by different proteins proportions when compared to CM. For instance, CaM has higher β-casein amounts and lower κ-casein and αS1-casein amounts than those of CM [78]. CaM is reported to be totally devoid of the β-lactoglobulin which is the major whey protein of CM, while for CaM, the α-lactalbumin is the main whey protein [79,80]. Moreover, CaM fat contains a higher number of fatty acids with a long chain and a lower quantity of short-chain fatty acids when compared to CM. Additionally, it contains more unsaturated fatty acids than CM, especially essential and polyunsaturated fatty acids [81,82]. All these differences in protein and fat composition between CaM and CM could be useful indications of the differences noticed between milk formulations leading to various physicochemical phenomena that occur during the milk coagulation process.
Table 4.
PLS DA models of the five formulations in fatty acid acyl-chain region and protein regions of synchronous and asynchronous spectra.
4. Conclusions
This study showed the efficacy of 2D-COS MIR spectra analysis to monitor sequential and out-of-phase physicochemical modifications observed during milk coagulation. The proposed strategy is seen to be beneficial in improving the accuracy of discriminant analysis for various samples since its values reached the complete score of 100% for the protein region and 88% for the fat region. In addition, according to the cross-peak symbols in the synchronous spectrum and asynchronous spectrum, the response speed of molecular structure modifications is in accordance with the common milk coagulation process generally observed in enzymatic coagulation, hydrolysis of κ-casein, destabilization of casein micelles, and aggregation. It is found that the addition of CaM had a substantial influence on the textural characteristics of the resulted gels confirming that 2DCOS MIR observations are consistent with textural observations of the gels obtained after milk mixtures coagulation. Therefore, this research yielded a promising methodology to monitor structural modifications at the molecular and macroscopic levels and to discriminate milk mixtures during coagulation through MIR spectroscopy.
Author Contributions
Author Contributions: A.A.-K. co-conceived and designed this study, wrote the paper, analyzed the results, and approved the final draft. E.M.E.H. co-conceived and designed the study and approved the final draft. O.B. co-conceived and designed the study, performed milk sampling, biochemical and spectral analysis, wrote the paper, analyzed the results and approved the final draft. S.S., Y.C. and R.M.A. read, edited and approved the final draft. All authors have read and agreed to the published version of the manuscript.
Funding
This research was funded by the CNRST (Centre National pour la Recherche Scientifique et Technique) through the funding of a research excellence grant (197USMBA) and by UMRF University Clermont Auvergne—INRAE—VetAgro Sup.
Institutional Review Board Statement
Not applicable.
Informed Consent Statement
Not applicable.
Conflicts of Interest
The authors declare no conflict of interest.
References
- Al haj, O.A.; Al Kanhal, H.A. Compositional, technological and nutritional aspects of dromedary camel milk. Int. Dairy J. 2010, 20, 811–821. [Google Scholar] [CrossRef]
- Fukuda, K. Camel milk. In Milk and Dairy Products in Human Nutrition: Production, Composition and Health; John Wiley & Sons: Oxford, UK, 2013; pp. 578–593. [Google Scholar]
- Khalesi, M.; Salami, M.; Moslehishad, M.; Winterburn, J.; Moosavi-Movahedi, A.A. Biomolecular content of camel milk: A traditional superfood towards future healthcare industry. Trends food Sci. Technol. 2017, 62, 49–58. [Google Scholar] [CrossRef]
- Boukria, O.; Wang, J.; Safarov, J.; Gharsallaoui, A.; Leriche, F.; El Hadrami, E.M.; Aït-Kaddour, A. Delineation of molecular structure modification during coagulation of mixed camel and cow milk by mid-infrared spectroscopy and parallel factor analysis. J. Food Process. Preserv. 2021, 46, e15839. [Google Scholar] [CrossRef]
- Ismaili, M.A.; Saidi, B.; Zahar, M.; Hamama, A.; Ezzaier, R. Composition and microbial quality of raw camel milk produced in Morocco. J. Saudi Soc. Agric. Sci. 2019, 18, 17–21. [Google Scholar] [CrossRef]
- Abrhaley, A.; Leta, S. Medicinal value of camel milk and meat. J. Appl. Anim. Res. 2018, 46, 552–558. [Google Scholar] [CrossRef]
- Tasturganova, E.; Dikhanbaeva, F.; Prosekov, A.; Zhunusova, G.; Dzhetpisbaeva, B.; Matibaeva, A. Research of fatty acid composition of samples of bio-drink made of camel milk. Curr. Res. Nutr. Food Sci. 2018, 6, 491–499. [Google Scholar] [CrossRef]
- Singh, R.; Ghorui, S.K.; Sahani, M.S. Camel milk: Properties and processing potential. In The Indian Camel; National Research Center on Camel: Bikaner, India, 2006; pp. 59–73. [Google Scholar]
- El-Agamy, E.I.; Nawar, M.A. Nutritive and immunological values of camel milk: A comparative study with milk of other species. In Proceedings of the 2nd International Camelid Conference. Agroeconomics of Camelid Farming, Almaty, Kazakhstan, 8–12 September 2000; pp. 8–12. [Google Scholar]
- Shamsia, S.M. Nutritional and therapeutic properties of camel and human milks. Int. J. Genet. Mol. Biol. 2009, 1, 052–058. [Google Scholar]
- Agrawal, R.P.; Budania, S.; Sharma, P.; Gupta, R.; Kochar, D.K.; Panwar, R.B.; Sahani, M.S. Zero prevalence of diabetes in camel milk consuming Raica community of north-west Rajasthan, India. Diabetes Res. Clin. Pract. 2007, 76, 290–296. [Google Scholar] [CrossRef]
- Ramet, J.-P. The Technology of Making Cheese from Camel Milk (Camelus dromedarius); Animal Production and Health Paper No. 113; FAO: Rome, Italy, 2001. [Google Scholar]
- Farah, Z.; Bachmann, M.R. Rennet coagulation properties of camel milk. Milchwissenschaft 1987, 42, 689–692. [Google Scholar]
- Bulca, S.; Dumanoğlu, B.; Özdemir, Ö.C. A Study on Mixing Camel Milk with Cow, Sheep and Goat Milk in Different Proportions in Yoghurt Production. Turkish J. Agric.-Food Sci. Technol. 2019, 7, 2095. [Google Scholar] [CrossRef]
- Boukria, O.; El Hadrami, E.M.; Sameen, A.; Sahar, A.; Khan, S.; Safarov, J.; Sultanova, S.; Leriche, F.; Aït-Kaddour, A. Biochemical, Physicochemical and Sensory Properties of Yoghurts Made from Mixing Milks of Different Mammalian Species. Foods 2020, 9, 1722. [Google Scholar] [CrossRef]
- Boukria, O.; El Hadrami, E.M.; Boudalia, S.; Safarov, J.; Leriche, F.; Aït-Kaddour, A. The effect of mixing milk of different species on chemical, physicochemical, and sensory features of cheeses: A review. Foods 2020, 9, 1309. [Google Scholar] [CrossRef]
- Mustafa, E.A.; Tyfor, B.; Tabidi, M.H.; Ahmed, M.E.M. The effect of mixing different percentages of cow milk on the physiochemical characteristics of camel milk yoghurt and the sensory evaluation of yoghurt. World J. Pharmac. Pharma. Sci. 2015, 4, 180–190. [Google Scholar]
- Herbert, S.; Riaublanc, A.; Bouchet, B.; Gallant, D.J.; Dufour, E. Fluorescence Spectroscopy Investigation of Acid-or Rennet-Induced Coagulation of Milk. J. Dairy Sci. 1999, 82, 2056–2062. [Google Scholar] [CrossRef]
- O’callaghan, D.J.; O’Donnell, C.P.; Payne, F.A. Review of systems for monitoring curd setting during cheese making. Int. J. Dairy Tech. 2002, 55, 65–74. [Google Scholar] [CrossRef]
- Nishinari, K.; Kohyama, K.; Kumagai, H.; Funami, T.; Bourne, M.C. Parameters of texture profile analysis. Food Sci. Technol. Res. 2013, 19, 519–521. [Google Scholar] [CrossRef]
- Peleg, M. The instrumental texture profile analysis revisited. J. Texture Stud. 2019, 50, 362–368. [Google Scholar] [CrossRef]
- Nishinari, K.; Fang, Y.; Rosenthal, A. Human oral processing and texture profile analysis parameters: Bridging the gap between the sensory evaluation and the instrumental measurements. J. Texture Stud. 2019, 50, 369–380. [Google Scholar] [CrossRef]
- De Souza Zangirolami, M.; Moreira, T.F.M.; Leimann, F.V.; Valderrama, P.; Março, P.H. Texture profile and short-NIR spectral vibrations relationship evaluated through Comdim: The case study for animal and vegetable proteins. Food Control 2023, 143, 109290. [Google Scholar] [CrossRef]
- Sahar, A.; ur Rahman, U.; Kondjoyan, A.; Portanguen, S.; Dufour, E. Monitoring of thermal changes in meat by synchronous fluorescence spectroscopy. J. Food Eng. 2016, 168, 160–165. [Google Scholar] [CrossRef]
- Sandra, S.; Cooper, C.; Alexander, M.; Corredig, M. Coagulation properties of ultrafiltered milk retentates measured using rheology and diffusing wave spectroscopy. Food Res. Int. 2011, 44, 951–956. [Google Scholar] [CrossRef]
- Loudiyi, M.; Rutledge, D.N.; Montel, M.C. Study of Salt and Heating Effects of Model Cheeses by Synchronous Fluorescence and Rheology Coupled with Chemometrics Tools. In Proceedings of the Congress on Food Structure & Design, Antalya, Turkey, 26–28 October 2016. [Google Scholar] [CrossRef]
- Etzion, Y.; Linker, R.; Cogan, U.; Shmulevich, I. Determination of protein concentration in raw milk by mid-infrared Fourier transform infrared/attenuated total reflectance spectroscopy. J. Dairy Sci. 2004, 87, 2779–2788. [Google Scholar] [CrossRef] [PubMed]
- Lynch, J.M.; Barbano, D.M.; Schweisthal, M.; Fleming, J.R. Precalibration evaluation procedures for mid-infrared milk analyzers. J. Dairy Sci. 2006, 89, 2761–2774. [Google Scholar] [CrossRef]
- Fagan, C.C.; Everard, C.; O’Donnell, C.P.; Downey, G.; Sheehan, E.M.; Delahunty, C.M.; O’Callaghan, D.J. Evaluating mid-infrared spectroscopy as a new technique for predicting sensory texture attributes of processed cheese. J. Dairy Sci. 2007, 90, 1122–1132. [Google Scholar] [CrossRef]
- Loudiyi, M.; Aït-Kaddour, A. Delineation of salts, ripening and gentle heating effects on molecular structure of Cantal-type cheese by Mid-infrared spectroscopy. Food Res. Int. 2018, 105, 221–232. [Google Scholar] [CrossRef]
- Kulmyrzaev, A.; Dufour, É.; Noël, Y.; Hanafi, M.; Karoui, R.; Qannari, E.M.; Mazerolles, G. Investigation at the molecular level of soft cheese quality and ripening by infrared and fluorescence spectroscopies and chemometrics—Relationships with rheology properties. Int. Dairy J. 2005, 15, 669–678. [Google Scholar] [CrossRef]
- Noda, I. Two-dimensional infrared spectroscopy of synthetic and biopolymers. Bull. Am. Phys. Soc. 1986, 31, 520–524. [Google Scholar]
- Noda, I. Generalized two-dimensional correlation method applicable to infrared, Raman, and other types of spectroscopy. Appl. Spectrosc. 1993, 47, 1329–1336. [Google Scholar] [CrossRef]
- AOAC. Official Methods of Analysis; The Association of Official Analytical Chemistry: Washington, DC, USA, 2016. [Google Scholar]
- Pons, M.; Fiszman, S.M. Instrumental texture profile analysis with particular reference to gelled systems. J. Texture Stud. 1996, 27, 597–624. [Google Scholar] [CrossRef]
- Savitzky, A.; Golay, M.J.E. Smoothing and Differentiation of Data by Simplified Least Squares Procedures. Anal. Chem. 1964, 36, 1627–1639. [Google Scholar] [CrossRef]
- Noda, I.; Ozaki, Y. Principle of Two-Dimensional Correlation Spectroscopy. In Two-Dimensional Correlation Spectroscopy: Applications in Vibrational and Optical Spectroscopy; Wiley: Hoboken, NJ, USA, 2004; ISBN 0470012390. [Google Scholar]
- Boukria, O.; El Hadrami, E.M.; Sultanova, S.; Safarov, J.; Leriche, F.; Aït-Kaddour, A. 2D-cross correlation spectroscopy coupled with molecular fluorescence spectroscopy for analysis of molecular structure modification of camel milk and cow milk mixtures during coagulation. Foods 2020, 9, 724. [Google Scholar] [CrossRef]
- Gorban, A.M.S.; Izzeldin, O.M. Mineral content of camel milk and colostrum. J. Dairy Res. 1997, 64, 471–474. [Google Scholar] [CrossRef]
- Kamal, M.; Foukani, M.; Karoui, R. Rheological and physical properties of camel and cow milk gels enriched with phosphate and calcium during acid-induced gelation. J. Food Sci. Technol. 2017, 54, 439–446. [Google Scholar] [CrossRef] [PubMed]
- Kamal-Eldin, A.; Alhammadi, A.; Gharsallaoui, A.; Hamed, F.; Ghnimi, S. Physicochemical, rheological, and micro-structural properties of yogurts produced from mixtures of camel and bovine milks. NFS J. 2020, 19, 26–33. [Google Scholar] [CrossRef]
- Abdalla, A.; Abu-Jdayil, B.; AlMadhani, S.; Hamed, F.; Kamal-Eldin, A.; Huppertz, T.; Ayyash, M. Low-fat akawi cheese made from bovine-camel milk blends: Rheological properties and microstructural characteristics. J. Dairy Sci. 2022, 105, 4843–4856. [Google Scholar] [CrossRef] [PubMed]
- El Zubeir, I.E.M.; Jabreel, S.O. Fresh cheese from camel milk coagulated with Camifloc. Int. J. Dairy Technol. 2008, 61, 90–95. [Google Scholar] [CrossRef]
- El-Zeini, H.M. Microstructure, rheological and geometrical properties of fat globules of milk from different animal species. Pol. J. Food Nutr. Sci. 2006, 15, 147–153. [Google Scholar]
- Ayyash, M.; Abdalla, A.; Abu-Jdayil, B.; Huppertz, T.; Bhaskaracharya, R.; Al-Mardeai, S.; Mairpady, A.; Ranasinghe, A.; Al-Nabulsi, A. Rheological properties of fermented milk from heated and high pressure-treated camel milk and bovine milk. LWT 2022, 156, 113029. [Google Scholar] [CrossRef]
- Li, Q.; Zhao, Z. Acid and rennet-induced coagulation behavior of casein micelles with modified structure. Food Chem. 2019, 291, 231–238. [Google Scholar] [CrossRef]
- Mbye, M.; Ayyash, M.; Abu-Jdayil, B.; Kamal-Eldin, A. The Texture of Camel Milk Cheese: Effects of Milk Composition, Coagulants, and Processing Conditions. Front. Nutr. 2022, 9, 868320. [Google Scholar] [CrossRef]
- Beux, S.; Martino, C.; Ferreira, Z.A.A.; Alessandro, N.; Nina, W. Seasonal effect on milk composition, somatic cell content and milk coagulation properties of Italian Holstein-Friesian cows. Emir. J. Food Agric. 2018, 30, 998–1005. [Google Scholar]
- Romeih, E.A.; Michaelidou, A.; Biliaderis, C.G.; Zerfiridis, G.K. Low-fat white-brined cheese made from bovine milk and two commercial fat mimetics: Chemical, physical and sensory attributes. Int. Dairy J. 2002, 12, 525–540. [Google Scholar] [CrossRef]
- Nicolaou, N.; Xu, Y.; Goodacre, R. Fourier transform infrared spectroscopy and multivariate analysis for the detection and quantification of different milk species. J. Dairy Sci. 2010, 93, 5651–5660. [Google Scholar] [CrossRef] [PubMed]
- Mazerolles, G.; Devaux, M.; Duboz, G.; Duployer, M.; Riou, N.M.; Dufour, E. Infrared and fluorescence spectroscopy for monitoring protein structure and interaction changes during cheese ripening. Lait 2001, 81, 509–527. [Google Scholar] [CrossRef]
- Bellamy, L.J. The Infrared Spectra of Complex Molecules; John Wiley & Sons, Ltd.: London, UK, 1975. [Google Scholar]
- Kizil, R.; Irudayaraj, J.; Seetharaman, K. Characterization of irradiated starches by using FT-Raman and FTIR spectroscopy. J. Agric. Food Chem. 2002, 50, 3912–3918. [Google Scholar] [CrossRef]
- Lapointe-Vignola, C. Science et Technologie du Lait: Transformation du Lait; Presses Inter Polytechnique: École polytechnique de Montréal, QC, Canada, 2002; ISBN 255301029X. [Google Scholar]
- Dufour, E.; Mazerolles, G.; Devaux, M.F.; Duboz, G.; Duployer, M.H.; Mouhous Riou, N. Phase transition of triglycerides during semi-hard cheese ripening. Int. Dairy J. 2000, 10, 81–93. [Google Scholar] [CrossRef]
- Mendelsohn, R.; Anderle, G.; Jaworsky, M.; Mantsch, H.H.; Dluhy, R.A. Fourier transform infrared spectroscopic studies of lipid-protein interaction in native and reconstituted sarcoplasmic reticulum. Biochim. Biophys. Acta (BBA)-Biomembr. 1984, 775, 215–224. [Google Scholar] [CrossRef]
- De Collongue-Poyet, B.; Sebille, B.; Baron, M. Chromatography of the Interferon γ and the analogue II: FTIR analysis. Biospectroscopy 1996, 2, 101–111. [Google Scholar] [CrossRef]
- Guerzoni, M.E.; Vannini, L.; Chaves Lopez, C.; Lanciotti, R.; Suzzi, G.; Gianotti, A. Effect of high pressure homogenization on microbial and chemico-physical characteristics of goat cheeses. J. Dairy Sci. 1999, 82, 851–862. [Google Scholar] [CrossRef]
- Meurens, M.; Baeten, V.; Yan, S.H.; Mignolet, E.; Larondelle, Y. Determination of the conjugated linoleic acids in cow’s milk fat by Fourier transform Raman spectroscopy. J. Agric. Food Chem. 2005, 53, 5831–5835. [Google Scholar] [CrossRef]
- Boubellouta, T.; Galtier, V.; Dufour, É. Effects of added minerals (calcium, phosphate, and citrate) on the molecular structure of skim milk as investigated by mid-infrared and synchronous fluorescence spectroscopies coupled with chemometrics. Appl. Spectrosc. 2009, 63, 1134–1141. [Google Scholar] [CrossRef]
- Noda, I. Two-dimensional infrared (2D IR) spectroscopy: Theory and applications. Appl. Spectrosc. 1990, 44, 550–561. [Google Scholar] [CrossRef]
- Noda, I. Vibrational two-dimensional correlation spectroscopy (2DCOS) study of proteins. Spectrochim. Acta-Part A Mol. Biomol. Spectrosc. 2017, 187, 119–129. [Google Scholar] [CrossRef] [PubMed]
- Sun, S.Q.; Zhou, Q.; Qin, Z. Atlas of Two-Dimensional Correlation Infrared Spectroscopy for Traditional Chinese medicine Identification; Chemical Industry Press: Beijing, China, 2003; p. 3. [Google Scholar]
- Curley, D.M.; Kumosinski, T.F.; Unruh, J.J.; Farrell, H.M., Jr. Changes in the secondary structure of bovine casein by Fourier transform infrared spectroscopy: Effects of calcium and temperature. J. Dairy Sci. 1998, 81, 3154–3162. [Google Scholar] [CrossRef] [PubMed]
- Siddig, S.M.; Sulieman, A.M.E.; Salih, Z.A.; Abdelmuhsin, A.A. Quality characteristics of white cheese (Jibnabeida) produced using camel milk and mixture of camel milk and cow milk. Int. J. Food Sci. Nutr. Eng. 2016, 6, 49–54. [Google Scholar]
- Chen, C.L.P.; Li, H.; Wei, Y.; Xia, T.; Tang, Y.Y. A local contrast method for small infrared target detection. IEEE Trans. Geosci. Remote Sens. 2013, 52, 574–581. [Google Scholar] [CrossRef]
- Byler, D.M.; Susi, H. Examination of the secondary structure of proteins by deconvolved FTIR spectra. Biopolym. Orig. Res. Biomol. 1986, 25, 469–487. [Google Scholar] [CrossRef] [PubMed]
- Grewal, M.K.; Chandrapala, J.; Donkor, O.; Apostolopoulos, V.; Stojanovska, L.; Vasiljevic, T. Fourier transform infrared spectroscopy analysis of physicochemical changes in UHT milk during accelerated storage. Int. Dairy J. 2017, 66, 99–107. [Google Scholar] [CrossRef]
- Barth, A. Infrared spectroscopy of proteins. Biochim. Biophys. Acta (BBA)-Bioenerg. 2007, 1767, 1073–1101. [Google Scholar] [CrossRef] [PubMed]
- Dalgleish, D.G. Analysis by fast protein liquid chromatography of variants of κ-casein and their relevance to micellar structure and renneting. J. Dairy Res. 1986, 53, 43–51. [Google Scholar] [CrossRef]
- Luinge, H.J.; Hop, E.; Lutz, E.T.G.; Van Hemert, J.A.; De Jong, E.A.M. Determination of the fat, protein and lactose content of milk using Fourier transform infrared spectrometry. Anal. Chim. Acta 1993, 284, 419–433. [Google Scholar] [CrossRef]
- Boubellouta, T.; Galtier, V.; Dufour, É. Structural changes of milk components during acid-induced coagulation kinetics as studied by synchronous fluorescence and mid-infrared spectroscopy. Appl. Spectrosc. 2011, 65, 284–292. [Google Scholar] [CrossRef] [PubMed]
- Guinee, T.P.; Fox, P.F. Salt in Cheese: Physical, Chemical and Biological Aspects; In Cheese: Chemistry, Physics and Microbiology, 4th ed.; McSweeney, P.L.H., Fox, P.F., Cotter, P.D., Everett, D.W., Eds.; Academic Press: Cambridge, MA, USA; Elsevier: Amsterdam, The Netherlands, 2017; pp. 317–375. [Google Scholar]
- Casal, H.L.; Mantsch, H.H. Polymorphic phase behaviour of phospholipid membranes studied by infrared spectroscopy. Biochim. Biophys. Acta-Rev. Biomembr. 1984, 779, 381–401. [Google Scholar] [CrossRef]
- Grappin, R.; Lefier, D.; Mazerolles, G. Analysis of milk and dairy products. Serv. Press. Spectrosc. Infrarouge Appl. Anal. 2006, 2, 583–626. [Google Scholar]
- Walter, L.; Shrestha, P.; Fry, R.; Leury, B.J.; Logan, A. Lipid metabolic differences in cows producing small or large milk fat globules: Fatty acid origin and degree of saturation. J. Dairy Sci. 2020, 103, 1920–1930. [Google Scholar] [CrossRef]
- Lamichhane, P.; Kelly, A.L.; Sheehan, J.J. Symposium review: Structure-function relationships in cheese. J. Dairy Sci. 2018, 101, 2692–2709. [Google Scholar] [CrossRef]
- Kappeler, S.R.; Farah, Z.; Puhan, Z. 5′-Flanking regions of camel milk genes are highly similar to homologue regions of other species and can be divided into two distinct groups. J. Dairy Sci. 2003, 86, 498–508. [Google Scholar] [CrossRef]
- Swaisgood, H.E. Characteristics of milk. In Fennema’s Food Chemistry; CRC Press: Boca Raton, FL, USA, 2007; pp. 897–934. ISBN 0429195273. [Google Scholar]
- Laleye, L.C.; Jobe, B.; Wasesa, A.A.H. Comparative study on heat stability and functionality of camel and bovine milk whey proteins. J. Dairy Sci. 2008, 91, 4527–4534. [Google Scholar] [CrossRef] [PubMed]
- Haddadin, M.S.Y.; Gammoh, S.I.; Robinson, R.K. Seasonal variations in the chemical composition of camel milk in Jordan. J. Dairy Res. 2008, 75, 8–12. [Google Scholar] [CrossRef]
- Attia, H.; Kherouatou, N.; Fakhfakh, N.; Khorchani, T.; Trigui, N. Dromedary milk fat: Biochemical, microscopic and rheological characteristics. J. Food Lipids 2000, 7, 95–112. [Google Scholar] [CrossRef]


Disclaimer/Publisher’s Note: The statements, opinions and data contained in all publications are solely those of the individual author(s) and contributor(s) and not of MDPI and/or the editor(s). MDPI and/or the editor(s) disclaim responsibility for any injury to people or property resulting from any ideas, methods, instructions or products referred to in the content. |
© 2023 by the authors. Licensee MDPI, Basel, Switzerland. This article is an open access article distributed under the terms and conditions of the Creative Commons Attribution (CC BY) license (https://creativecommons.org/licenses/by/4.0/).