Article

Surface-Enhanced Raman Spectroscopic Analysis of Flavoenzyme Cofactors: Guidance for Flavin-Related Bio- and Chemo- Sensors

State Key Laboratory of Supramolecular Structure and Materials, College of Chemistry, Jilin University, Changchun 130012, China
*
Author to whom correspondence should be addressed.
Chemosensors 2023, 11(3), 190; https://doi.org/10.3390/chemosensors11030190
Submission received: 15 February 2023 / Revised: 8 March 2023 / Accepted: 10 March 2023 / Published: 12 March 2023
(This article belongs to the Special Issue SERS: Analytical and Biological Challenges)

Abstract

:
Flavin mononucleotides (FMNs) and flavin adenine nucleotide (FAD) play vital roles in the electron-transfer processes in diverse enzymatic reactions. Owing to the isoalloxazine chromophore, flavins are easily detectable by surface-enhanced Raman spectroscopy (SERS), a surface-sensitive technique. However, the details of the adsorption of flavins on SERS-active materials have never been investigated. In this study, a comprehensive SERS analysis of flavins containing lumichrome and lumiflavin on silver nanoparticles was conducted. With the aid of density-functional-theory calculations, our results suggested that the flavin molecules were adsorbed on the silver nanoparticles via the N3 site of the isoalloxazine moiety, which had a stronger adsorption ability than the adenine moiety in the FAD. The SERS spectra of the flavins at different pH values also supported this conclusion. This study demonstrated the feasibility of SERS for the structural characterization of flavins, paving the way for the functional exploration of flavin-labeled detection sensors and flavoprotein researches.

1. Introduction

Riboflavin (RF), also known as vitamin B2, plays a significant role in life activities, especially in humans. A lack of vitamin B2 can cause a range of clinical symptoms, such as scrotal dermatitis, orchitis, and conjunctival congestion [1]. Riboflavin is mainly involved in the electron-transfer processes of various enzymatic reactions in the body as a coenzyme through two types of phosphorylated flavin derivative: flavin mononucleotide (FMN) and flavin adenine dinucleotide (FAD). Of the two, the latter accounts for the clear majority [2]. The core molecular structure of flavin is an isoalloxazine group with a tricyclic ring (as shown in Figure 1A), and this condensed ring, which contains nitrogen and oxygen elements, often has corresponding optical signals. Therefore, RF and its two derivatives have good applicability in labeled and unlabeled spectroscopic detection [3,4,5,6,7].
Raman spectroscopy (RS) has been clearly established over the last century through improved technologies, such as gratings, lasers, confocal microscopy, and nanotechnology. It can therefore provide rich structural information on samples. Surface-enhanced Raman scattering (SERS) spectroscopy is one of the techniques associated with RS. Based on the physical and chemical enhancement generated by the interaction of the nano-substrate with sample molecules and excitation light, SERS provides stronger and richer information on sample characteristics and has the advantages of high selectivity, high sensitivity, and high throughput [8,9]. Furthermore, SERS plays a vital role in various fields, such as nanoscience [10,11], semiconductor science [12,13,14,15], materials science [16,17], life science [18,19,20], and pharmacology [21,22]. Generally, some precious traditional-metal nano-substrates, such as gold and silver [23,24,25], and some transition-metal semiconductor nanomaterials, can exert excellent enhancement effects; the latter facilitate important research applications in the field of optoelectronic science, such as the use of solar-dye cells [26,27].
In the detection and study of flavin molecules and flavin proteins using RS, lasers matching the energy of the first electronically excited state of the molecules are usually selected to perform resonance Raman detection in order to obtain the corresponding structural information [28,29,30,31]. With the invention and development of SERS, some researchers have achieved the label recognition of flavin molecules and the off-label detection of flavin proteins by constructing unique nano-substrates [32,33,34,35]. Although there are many reports on SERS studies of flavin molecules, most of these studies involved the detection and analysis of protein structures. The SERSs of flavin molecules that were either bound with a protein or attached through a chemical bond to a silver surface were studied [36,37]. However, the details of the adsorption of flavins on SERS-active materials have never been investigated. Also, comprehensive analysis of flavins and their photolysis derivatives (LC and LF, Fig 1A) using RS and SERS, has rarely been reported.
We performed density-functional theory (DFT) calculations for the adsorption of LC, LF, RF, FMN, FAD, and an isoalloxazine moiety by introducing Ag atoms. Next, we compared the obtained results with the results of the RS and SERS of the actual samples and determined each characteristic peak. Furthermore, we confirmed the adsorption sites of the isoalloxazine moiety on the Ag-nanoparticle substrate and excluded the possibility of other sites by conducting adsorption-substitution experiments. The purpose of this study is to provide experimental and theoretical support/guidance for bio-sensors and chemo-sensors. The application of SERS is useful either for flavin identification or as a Raman probe for indirectly probing other targets. In both cases, the investigation of flavin adsorption, orientations, and SERS-band assignments is essential. Owing to covalent-bond formation and different molecular orientations, the SERS profiles of flavins usefully differ from their normal Raman spectra. Thus, a comparison of the Raman and SERS fingerprints is of importance for spectral analysis in practical label-free assays. The flavin-labeled sensors are established on the basis of the resonance Raman effect of flavins with an appropriate laser excitation, through which flavins can be selectively enhanced. In this case, the exploration of flavin–metal binding properties is necessary and significant for the experimental optimization of the effective linking of flavin molecules and SERS-active materials.

2. Materials and Methods

2.1. Materials

Silver nitrate (AgNO3) was purchased from Sinopharm Chemical Reagent Co., Ltd., Shanghai, China. Lumichrome, lumiflavin, riboflavin, FMN, FAD, and adenosine triphosphate (ATP) were purchased from Shanghai Aladdin Biochemical Technology Co., Ltd., Shanghai, China. Adenine was purchased from J&K Scientific, Beijing, China. Poly dimethyl diallyl ammonium chloride aqueous solution (PDDA, 20%) was from Sigma-Aldrich Technology Co., Ltd., Shanghai, China. Sodium citrate, sulfuric acid (98%), hydrogen peroxide (30%), ethyl alcohol, acetone, and trichloromethane were purchased from Beijing Chemical Works, Beijing, China. All the flavins were dissolved in a PBS buffer (pH = 7.0, 0.01 M). All chemicals were analytically pure and used directly in this work. The water used in the experiment was 18.25 Ω·cm deionized water generated by a Direct-Pure UP purifier from Rephile Bioscience Co., Ltd., Shanghai, China.

2.2. Methods

2.2.1. Preparation of Ag nanoparticles

The preparation of Ag nanoparticles was based on the protocol reported by Lee and Meisel [38]. In brief, 200 mL of deionised water mixed with 36 mg of AgNO3 solid was boiled to produce small continuous bubbles. Next, 4 mL of a 1 w/w% sodium citrate aqueous solution was rapidly added under vigorous stirring. When the solution turned light yellow, the heating was switched off and the solution was continuously stirred until it cooled to room temperature.

2.2.2. Preparation of Self-Assembly Ag Nanofilm on Glass

Hydroxylation of glass: A glass slide was cut into pieces measuring 5 mm × 5 mm, followed by ultrasonic cleaning in deionized water, ethyl alcohol, acetone, and trichloromethane for 5 min in sequence. These glass pieces were then cleaned two or three times with deionized water. Subsequently, the cleaned glass was mixed with a mixture of hydrogen peroxide (30%) and sulfuric acid (98%) (v/v = 3:7) in a beaker, heated to boiling while stirring with a glass stirrer until no small bubbles formed, and then cooled to room temperature. Finally, the cleaned glass was immersed in deionized water.
Self-assembled Ag films on glass: The hydroxylated glass squares were sunk into a 0.5% PDDA aqueous solution for 30 min, cleaned with water, dried with N2, and immersed in Ag colloid for 6 h. Finally, the self-assembled Ag films were cleaned and dried for further use.

2.2.3. Measurement

The Ag films were immersed in different concentrations of FAD and 10−5 M of LC, LF, RF, FMN, adenine, and ATP, cleaned, and dried by N2. The Raman spectra of these solid samples and Ag films were collected using a Renishaw 1000 Model Confocal Microscope Raman Spectrometer with a 532-nanometer excitation laser. The ultraviolet–visible (UV) spectra and fluorescence spectra were measured in an aqueous PBS buffer with 1-centimeter-long cuvettes by PerkinElmer Lambda 1050 + Ultraviolet–Visible Near-infrared Spectrophotometer and SHIMADZU RF-5301(PC)S Fluorescence Spectrophotometer, respectively. The morphology of the Ag nanoparticles was characterized by transmission-electron microscopy (TEM) using a JEM-2100 system and by scanning-electron microscopy (SEM) using a JEOL JEM-7800F system.

2.2.4. Calculation Method of Density-Functional Theory

The quantitative B3LYP [39,40] method was adopted for density-functional-theory calculations of flavin molecules via the Gaussian 09W program, with the 6-311+G** basis set for H, C, N, O, and P atoms, and the Lanl2dz pseudopotential basis set for Ag atoms. The calculation results were analysed using the VEDA4 program [41] for assignment of the Raman peaks.

3. Results and Discussion

3.1. Characterization of Ultraviolet-Visible Spectroscopic Absorption Spectra of Flavins

The ultraviolet-visible spectroscopy absorption spectra of LC, LF, RF, FMN, and FAD at 10−4 M were characterized, as shown in Figure 1B. The strong absorption band at 214 nm represents the K-band of the conjugated structure of the isoalloxazine ring in the flavin molecule, while that at 267 nm represents the B-band of the benzene ring (Ring I) in the isoalloxazine ring. The absorption band between 350 and 500 nm is the characteristic absorption band of the entire isoalloxazine chromophore. Due to the different conjugation structures of the LC and the LF in Ring II and III and the p–π conjugation effect generated by the lone pair of electrons on the two N atoms in the III ring, the absorption peak of the LC appeared around 387 nm. However, the conjugation effect of the III ring of the LF was stronger and more planar than that of the LC; hence, the absorption peak of the LF was red-shifted to 441 nm. The RF and FMN had a redshift of about 5 nm in their absorption peaks due to the substitution of nucleophiles and phosphate groups. The FAD molecule contained an adenosine group; hence, it had a larger redshift, to 451 nm, than the LF.

3.2. Solid-State Raman Spectra and Theoretical Analysis of Flavin Molecules

3.2.1. LC and LF

The solid-state Raman spectra of the LC and LF were collected separately using a 532-nanometer laser as the excitation light. The integration time was 10 s, with only one integration, and the laser power reaching the sample was 10 mW. The theoretical Raman spectra were analysed by using DFT for both the LC and the LF, as shown in Figures S1 and S2.
The characteristic Raman peaks of the LC were mainly distributed at 200–1800 cm−1 and ~3000 cm−1. The region around 3000 cm−1 was related to the C-H stretching-vibration modes of the benzene ring and the methyl, while the peaks at 1697 and 1734 cm−1 were attributed to the stretching-vibration modes of C2=O and C4=O. The deviation was large, compared with the theoretically calculated vibration modes of the carbonyl group, because most of the frequencies obtained from the theoretical calculation were resonant frequencies, which exclude non-resonant effects. Therefore, the calculated results had some deviation from the actual values, which was more obvious in the carbonyl group. Generally, a correction factor is multiplied by the calculated frequency, and the larger the frequency, the larger the deviation. In some cases, low- and high-frequency regions are multiplied by different correction factors [42,43,44,45]. In this study, we used 0.9960 [46] as the correction factor. The region around 1573 cm−1 was related to the stretching-vibration modes of the benzene-ring carbon skeleton (C-C), while the peaks at 1026, 1339, 1381, and 1464 cm−1 were related to the C-N stretching-vibration mode. The peak at 1280 cm−1 belonged to the C-N-C in-plane bending-vibration modes in Ring II and that at 738 cm−1 belonged to the C-C stretching-vibration modes of Ring I and the ring-breathing-vibration modes of Ring II, while the peaks at 526 602, 652, and 683 cm−1 were related to the C-N in-plane bending-vibration modes in Rings II and III. The related peaks’ attributions are listed in Table S1.
The characteristic Raman peaks of the LF were also mainly distributed within the range of 200–1800 cm−1 and at ~3000 cm−1, and the region around ~3000 cm−1 belonged to the C-H stretching-vibration modes of the benzene ring and the methyl, while the peaks at 1714 and 1752 cm−1 belonged to the C2=O and C4=O stretching-vibration modes. The peaks at 1582, 1621, and 1670 cm−1 were mainly attributable to the stretching-vibration mode of the benzene ring C-C. The peaks at 1360, 1386, 1464, and 1549 cm−1 can be mainly attributed to the C-N and C-C stretching-vibration modes in Ring III. The characteristic peaks at 1079, 1167, 1234, 1283, and 1345 cm−1 were mainly attributed to the C-N and C-C stretching-vibration modes in Ring II. The characteristic peak at 781 cm−1 is attributable to the C4a-C10a-N1 and C4a-C5a-N5 bending-vibration modes; the peak at 738 cm−1 is attributable to the breathing-vibration modes of Ring II and Ring III; and the peak at 681 cm−1 is attributable to the N1-C2-O and N3-C4-O bending-vibration modes. The related peaks’ attributions are listed in Table S2.

3.2.2. RF, FMN, and FAD

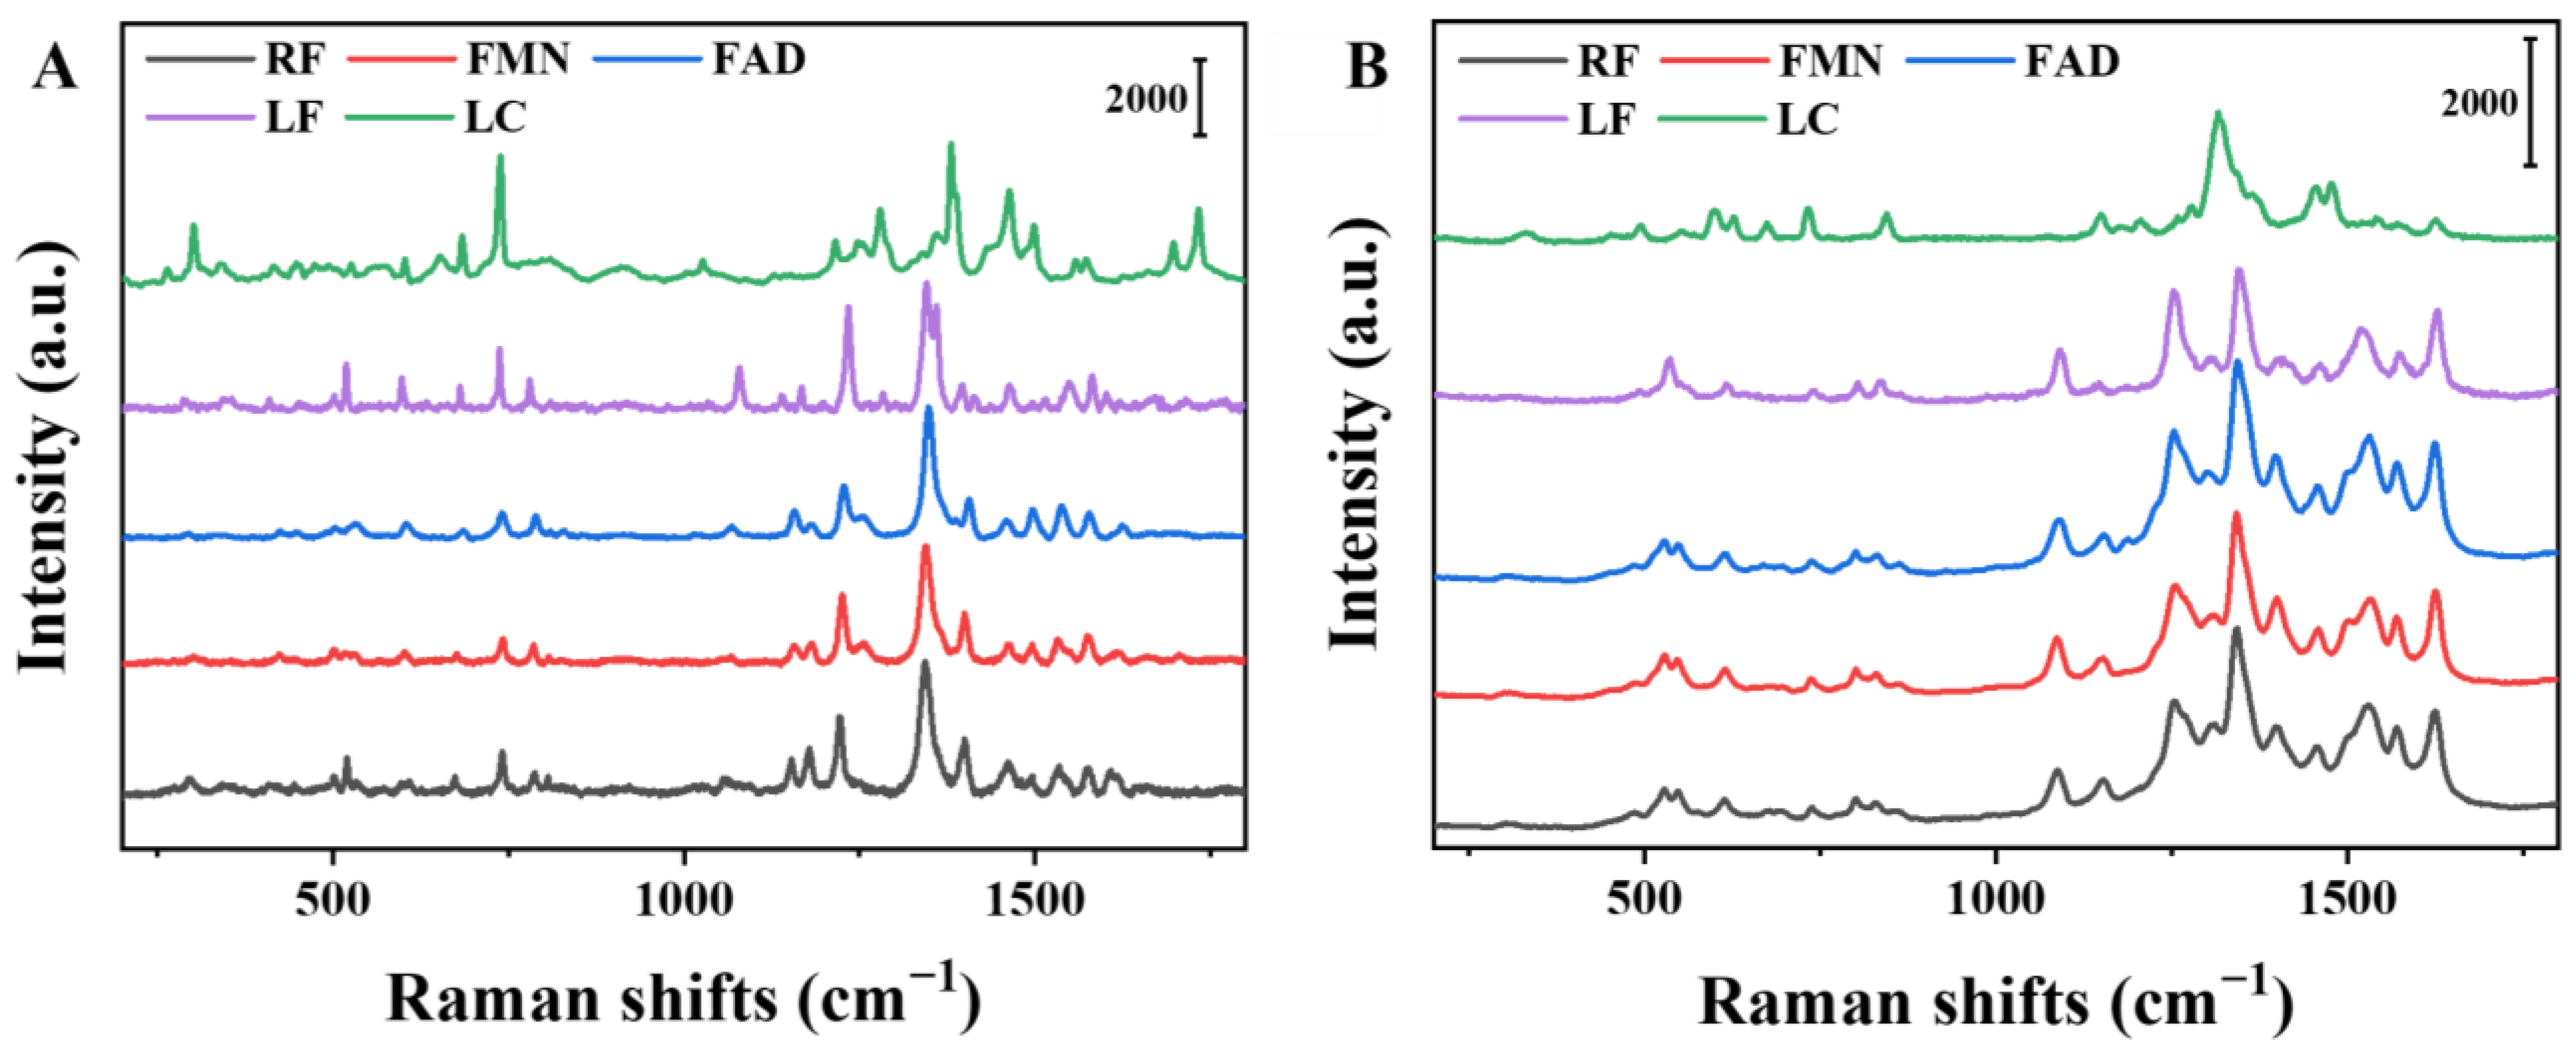
The solid-state Raman spectra of RF, FMN, and FAD were collected separately by using a 532-nanometer laser as the excitation light, with an integration time of 10 s and a laser power of 10 mW, as shown in Figure 2A. The Raman spectra of the three flavin molecules showed that the characteristic peaks in the low-frequency and high-frequency regions had extremely similar positions and intensities. The theoretical analysis of the Raman spectra of the three flavin derivatives (Figure S3A) also indicated a high degree of similarity among the molecules, indicating that the Raman spectra of the flavin molecules can be mainly attributed to their common isoalloxazine chromophores, as shown in the yellow part of Figure 1A. The comparison of the theoretical spectra and the solid Raman spectra of the LC, LF, and FAD, shown in Figure 2A and Figure S3B, indicated that the spectra of the LC were markedly different from those of the LF due to the large difference in the conjugated structures and planarity of Rings II and III. Moreover, while the RF, FMN, and FAD can be regarded as derivatives of the LF, both the theoretical spectra and the experimental solid Raman spectra were highly similar; hence, the peak was possibly attributable to the LF moiety.

3.3. SERS Spectra of Flavin Molecules

3.3.1. Characterization of Ag nanoparticles

The TEM and SEM images, shown in Figure S4A,B, suggested that the average size of the prepared Ag nanoparticles was about 50 nm, and the Ag nanofilm was uniform on the surface of the hydroxylated glass sheet.
The Ag nanoparticles had a maximum absorption band at 429 nm, and the absorption band of the flavin (e.g., FAD) adsorbed on the silver nanoparticles showed a certain redshift, indicating the successful adsorption of the FAD on the Ag nanoparticles, as shown in Figure S4C. The maximum excitation wavelength and maximum emission wavelength of the FAD were 470 nm and 523 nm, respectively; hence, we collected the fluorescence spectra of the Ag colloid, the FAD, and their mixture at the excitation wavelength of 470 nm. As shown in Figure S4D, the fluorescence quenching of the FAD occurred in the presence of the Ag nanoparticles, further indicating that the FAD was adsorbed on the Ag nanoparticles.

3.3.2. SERS Spectra of Flavins

The 532-nanometer Raman spectra of the 10−5 M of the LC, LF, RF, FMN, and FAD adsorbed on the Ag nanofilms were examined separately to obtain their enhanced spectra on the Ag nanoparticles. As shown in Figure 2B and Figure S5, the LC showed more variation in terms of relative intensity and displacement, while the LF and FAD had a large variation in terms of the relative intensity of the C-C, C-N, and C=O Raman peaks of Rings II and III near 1500 cm−1, indicating that the vibrational modes of this part were enhanced and related to their adsorption mode on the Ag nanoparticles. The comparison of the enhanced spectra of the LC and LF with the normal Raman spectra showed that their adsorption modes were different. The related SERS peaks’ attributions are listed in Tables S1 and S2.

3.4. Analysis of FAD Molecules on Ag-Nanoparticle Substrates

3.4.1. Adsorption Time

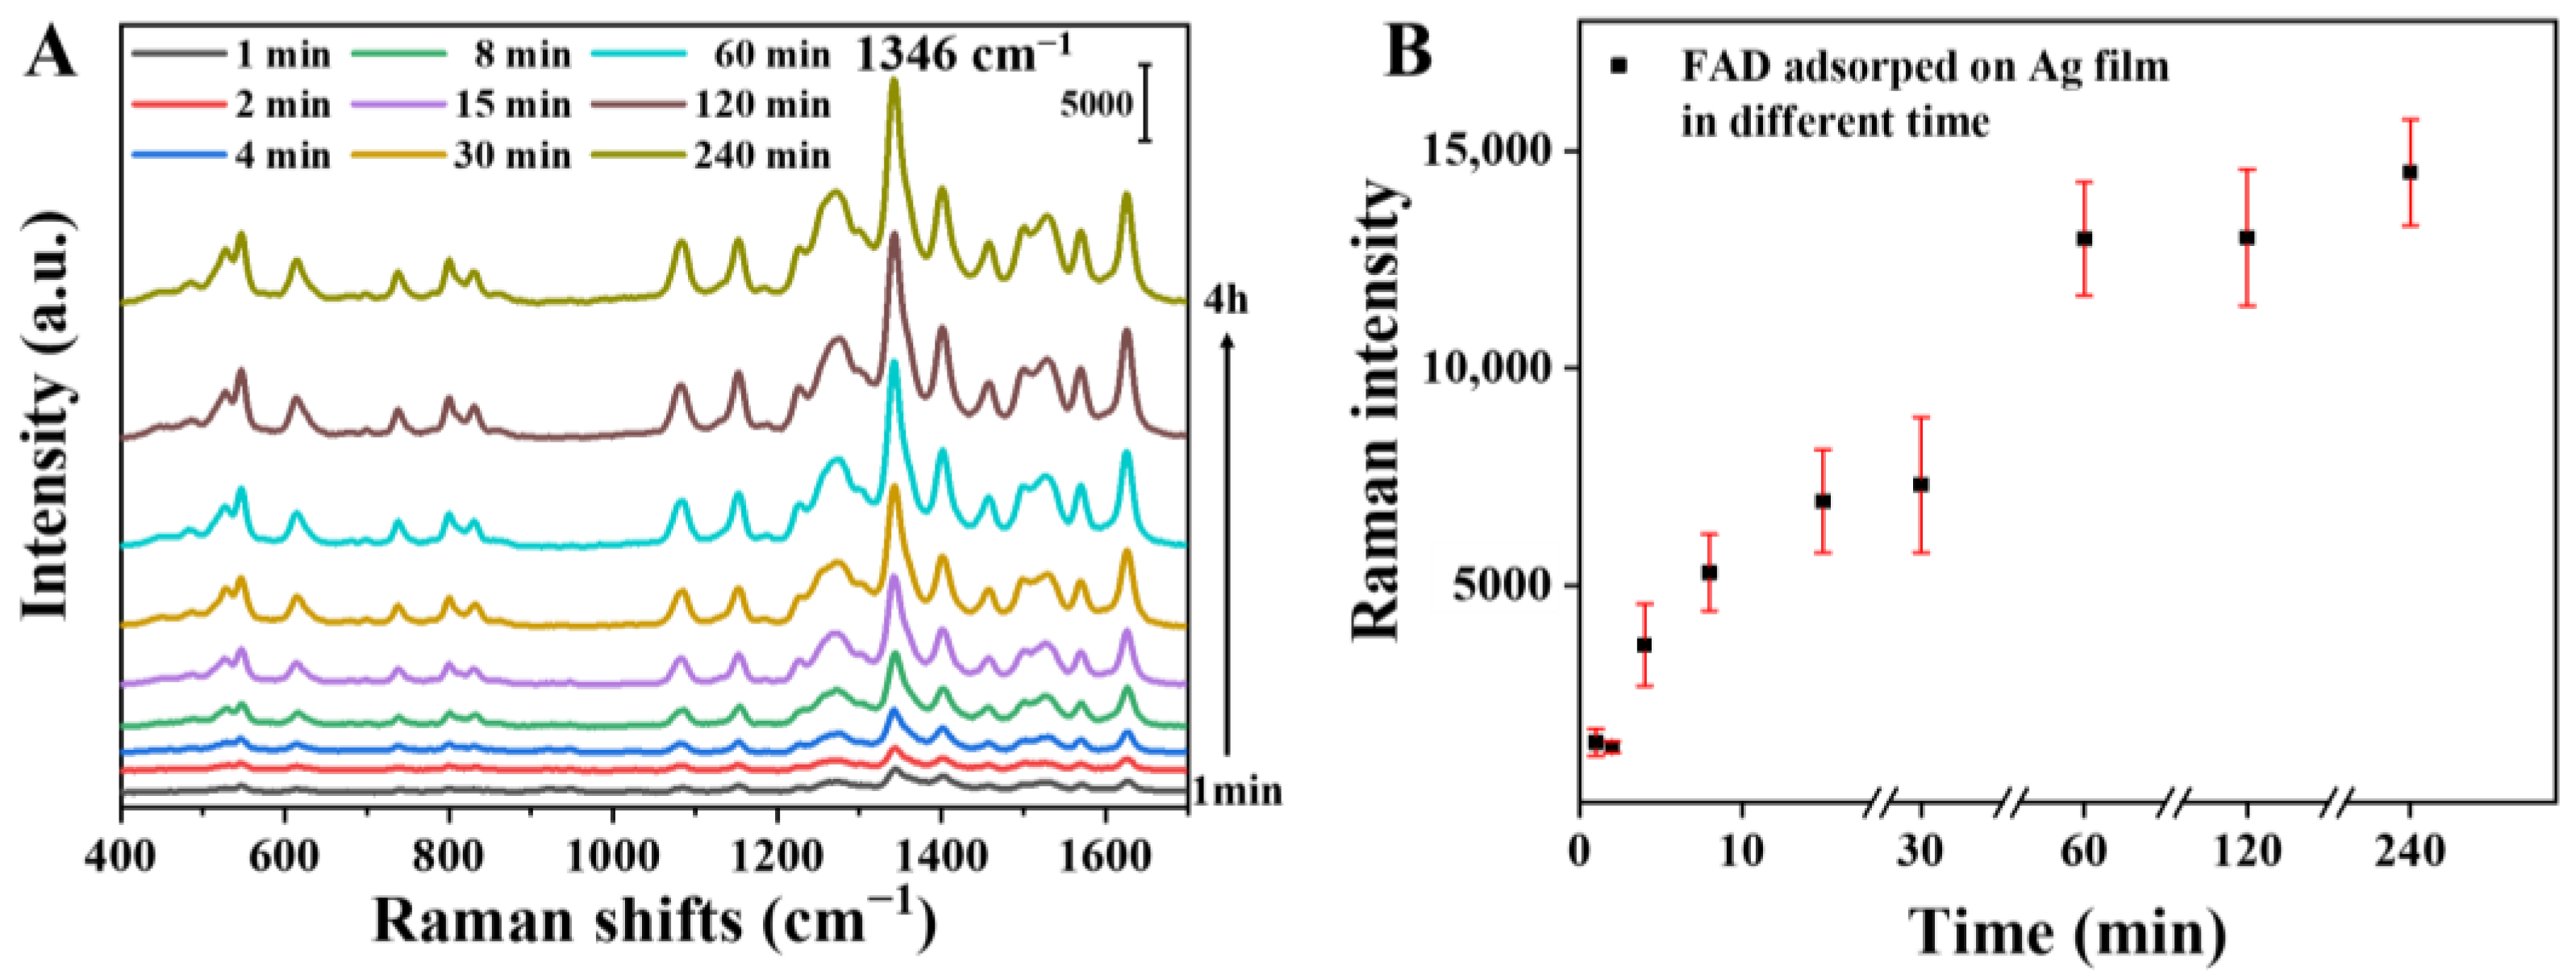
The self-assembled Ag-nanofilm glass slides were immersed in 10−5 M of FAD solution for 1, 2, 4, 8, 15, 30, 60, 120, and 240 min, followed by 532-nanometer Raman spectroscopy, as shown in Figure 3. Taking the Raman peak at 1346 cm−1 as the reference, the signals of the FAD with adsorption times of 1 and 2 min were significantly weaker than those of the other samples soaked for longer times, which could be attributed to the small amount of FAD adsorbed onto the Ag-nanoparticle substrate in a shorter time. As the soaking time increased, the molecules adsorbed on the substrate increased and the peak intensity at 1346 cm−1 was gradually enhanced. Six sets of data were randomly selected for error analysis at each time point. Approximately 1 h later, the adsorption of the FAD on the prepared Ag nanofilm became saturated.

3.4.2. Adsorption Mode

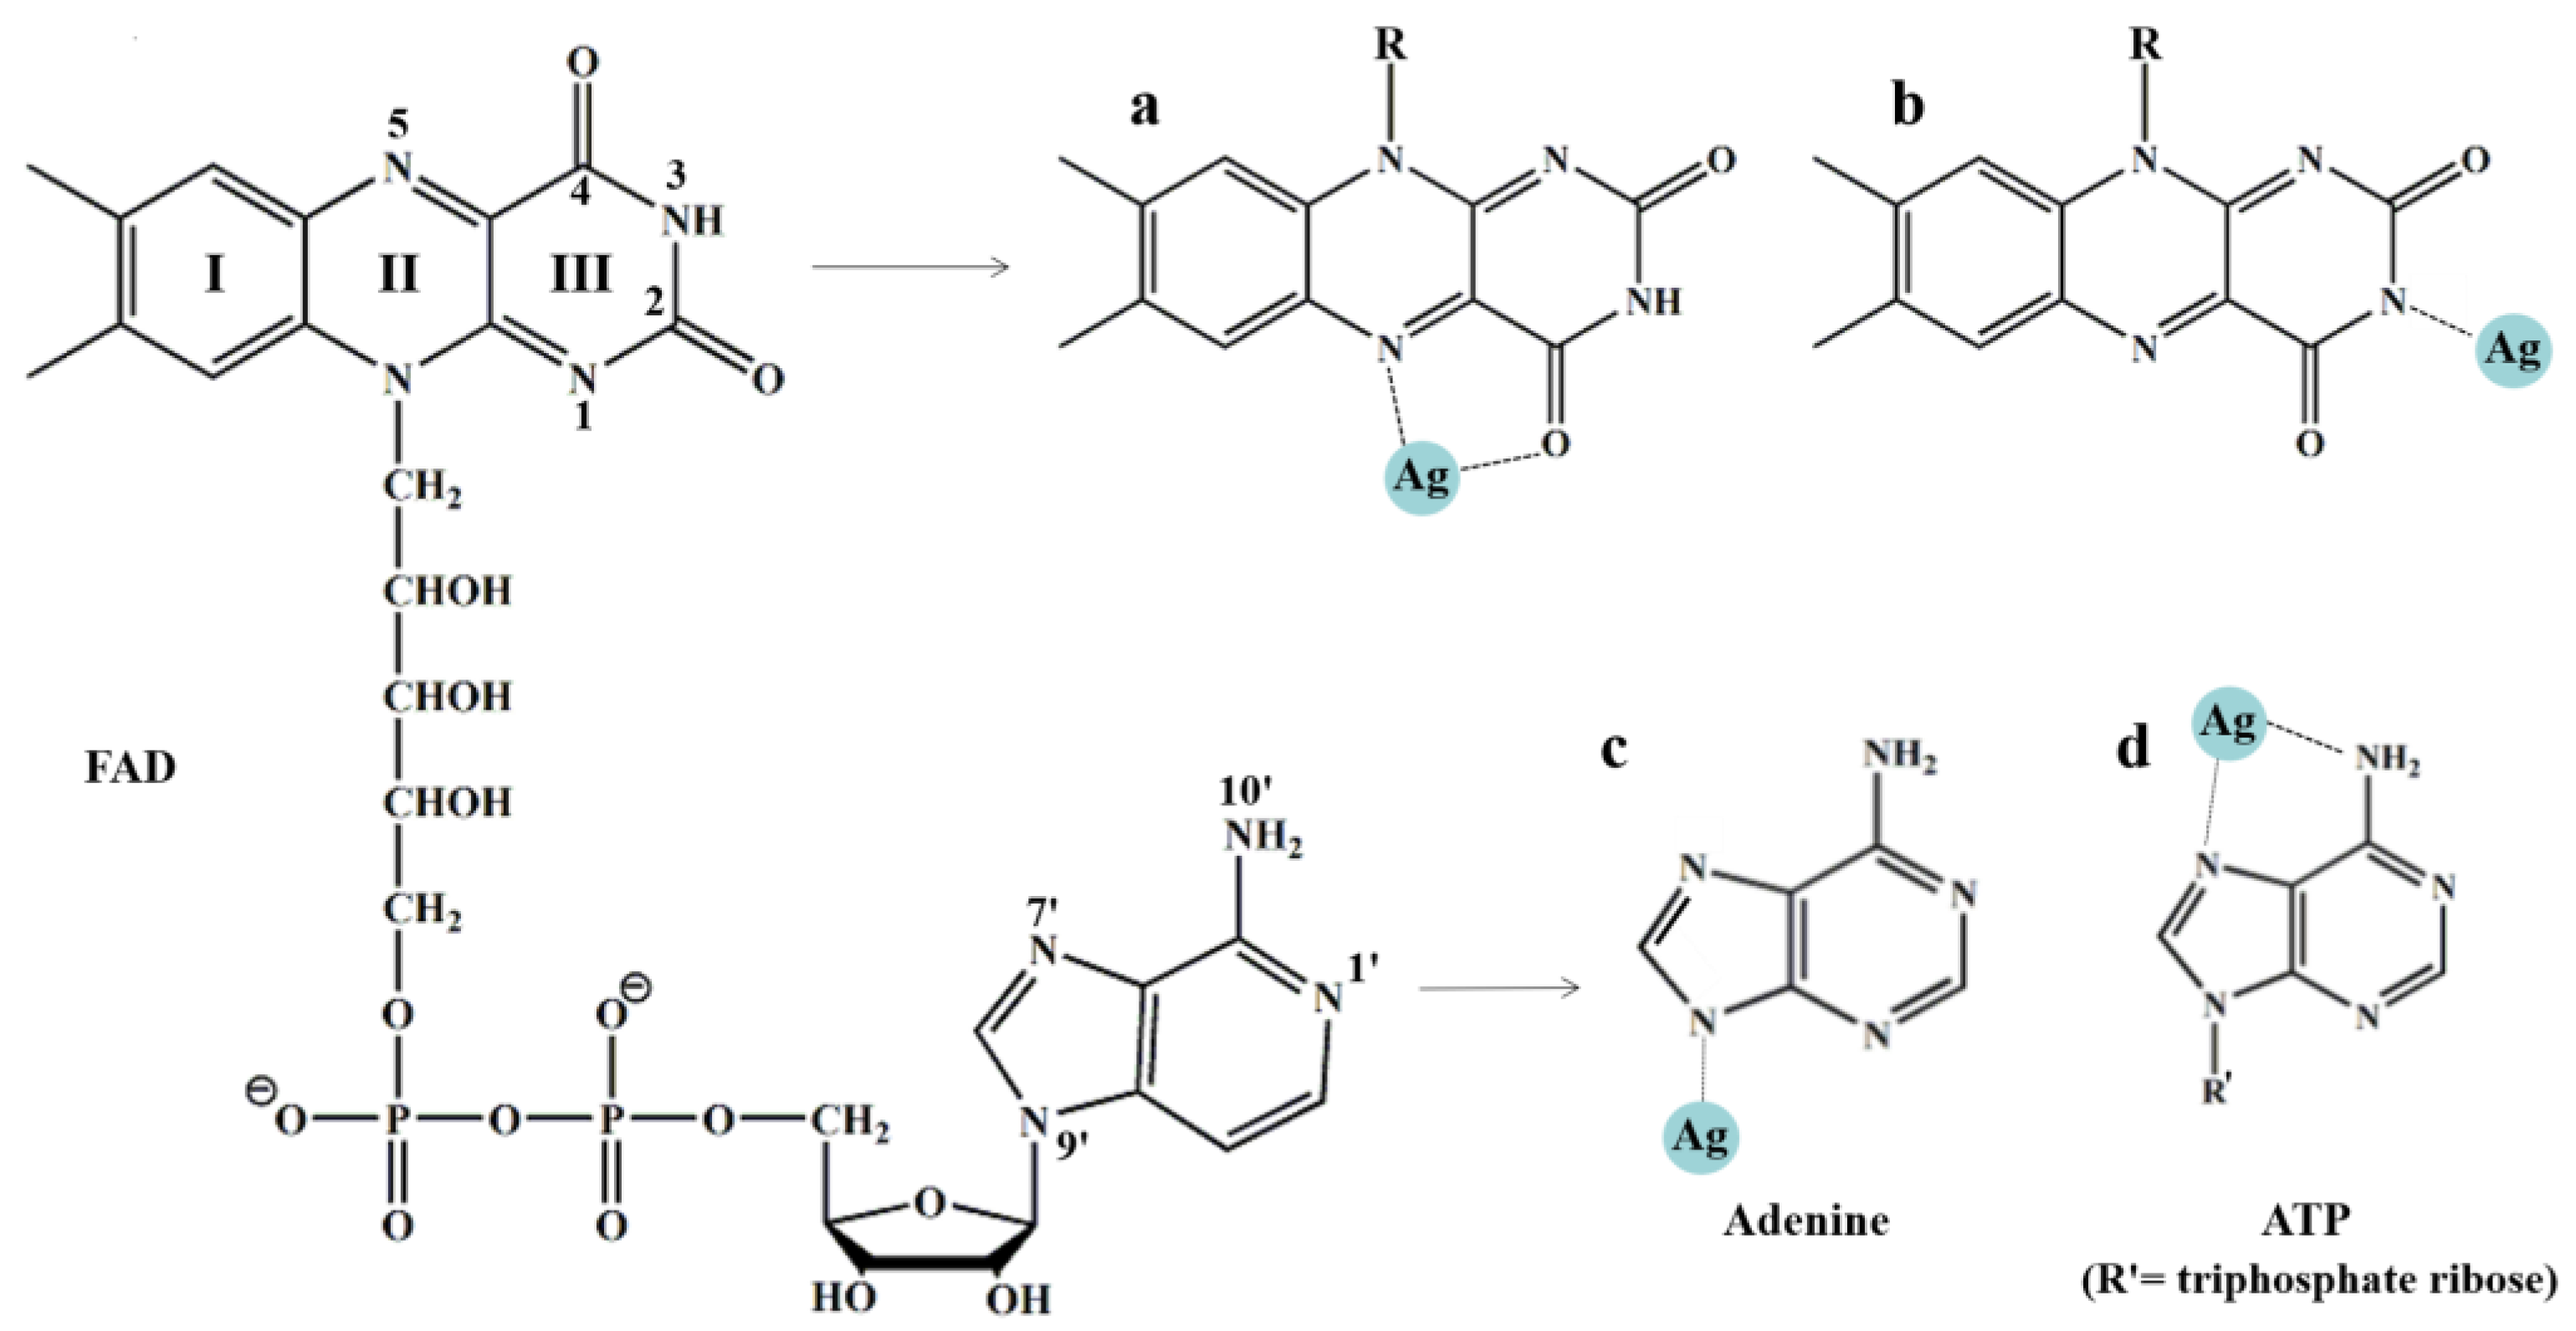
Surface-enhanced Raman spectroscopy probe molecules can be chemically adsorbed on substrates through group sites, such as sulfhydryl, amino, and carboxyl [47,48]. Taking FAD as an example, its molecular structure shows several group sites, N1, N3, and N5, on the isoalloxazine ring and the phosphate group and N on the adenine group.
The SERS spectra of the same concentrations of adenine (A), ATP, RF, FMN, and FAD adsorbed on the Ag nanofilm were collected, as shown in Figure S6A,B. The SERS signals of the three flavin molecules on the Ag nanoparticles were almost consistent. Both adenine and ATP have strong peaks of ring-breathing-vibration modes and are poly-nitrogenous heterocyclic at 730 cm−1 [49]. The characteristic peak information in the high-wavelength band was somewhat different, which can be attributed to the two adsorption modes shown in Scheme 1c,d [50]. The comparison of A and B showed that the flavin molecules also had the characteristic peak of the ring-breathing-vibration modes and were poly-nitrogenous heterocyclic at 738 cm−1. However, the molecular structures of both the RF and the FMN did not contain adenine groups, there was a certain blue shift from 730 cm−1, and their absolute intensities were much lower than those of the adenine and ATP at the same concentration. Therefore, it can be assumed that the flavin molecules were mainly adsorbed on the Ag nanoparticles through the isoalloxazine ring.
There have been several theoretical speculations and discussions on the adsorption mode of the isoalloxazine ring on an Ag-nanoparticle substrate. First, the N10 on the isoalloxazine ring is replaced by a nucleolus, making it unable to act as an adsorption site. As a commonly used electron-transfer coenzyme in living organisms, FAD has active redox properties, with the conjugated structure between N1 and N5 as the redox centre, and it is capable of transferring one or two electrons. Therefore, these two N atoms have high activities, and most of the electron-transfer reactions start with the N5 attack, while N1 has a steric hindrance effect. Therefore, N5 is more likely to play a key role in Ag-nanoparticle chemisorption by FAD. Furthermore, Ag may also coordinate with C4 carbonyl oxygen on Ring III, which forms a more stable five-membered ring structure together with N5 [51], as shown in Scheme 1a. In addition, there is also N3 with H attached to the isoalloxazine ring, similar to N9 on adenine, which may be adsorbed as a N–Ag bond, as illustrated in Scheme 1 b and c. When the H on N9 of A is substituted, as in the case of adenosine triphosphate ATP, it may be adsorbed in the manner shown in Scheme 1d [50].
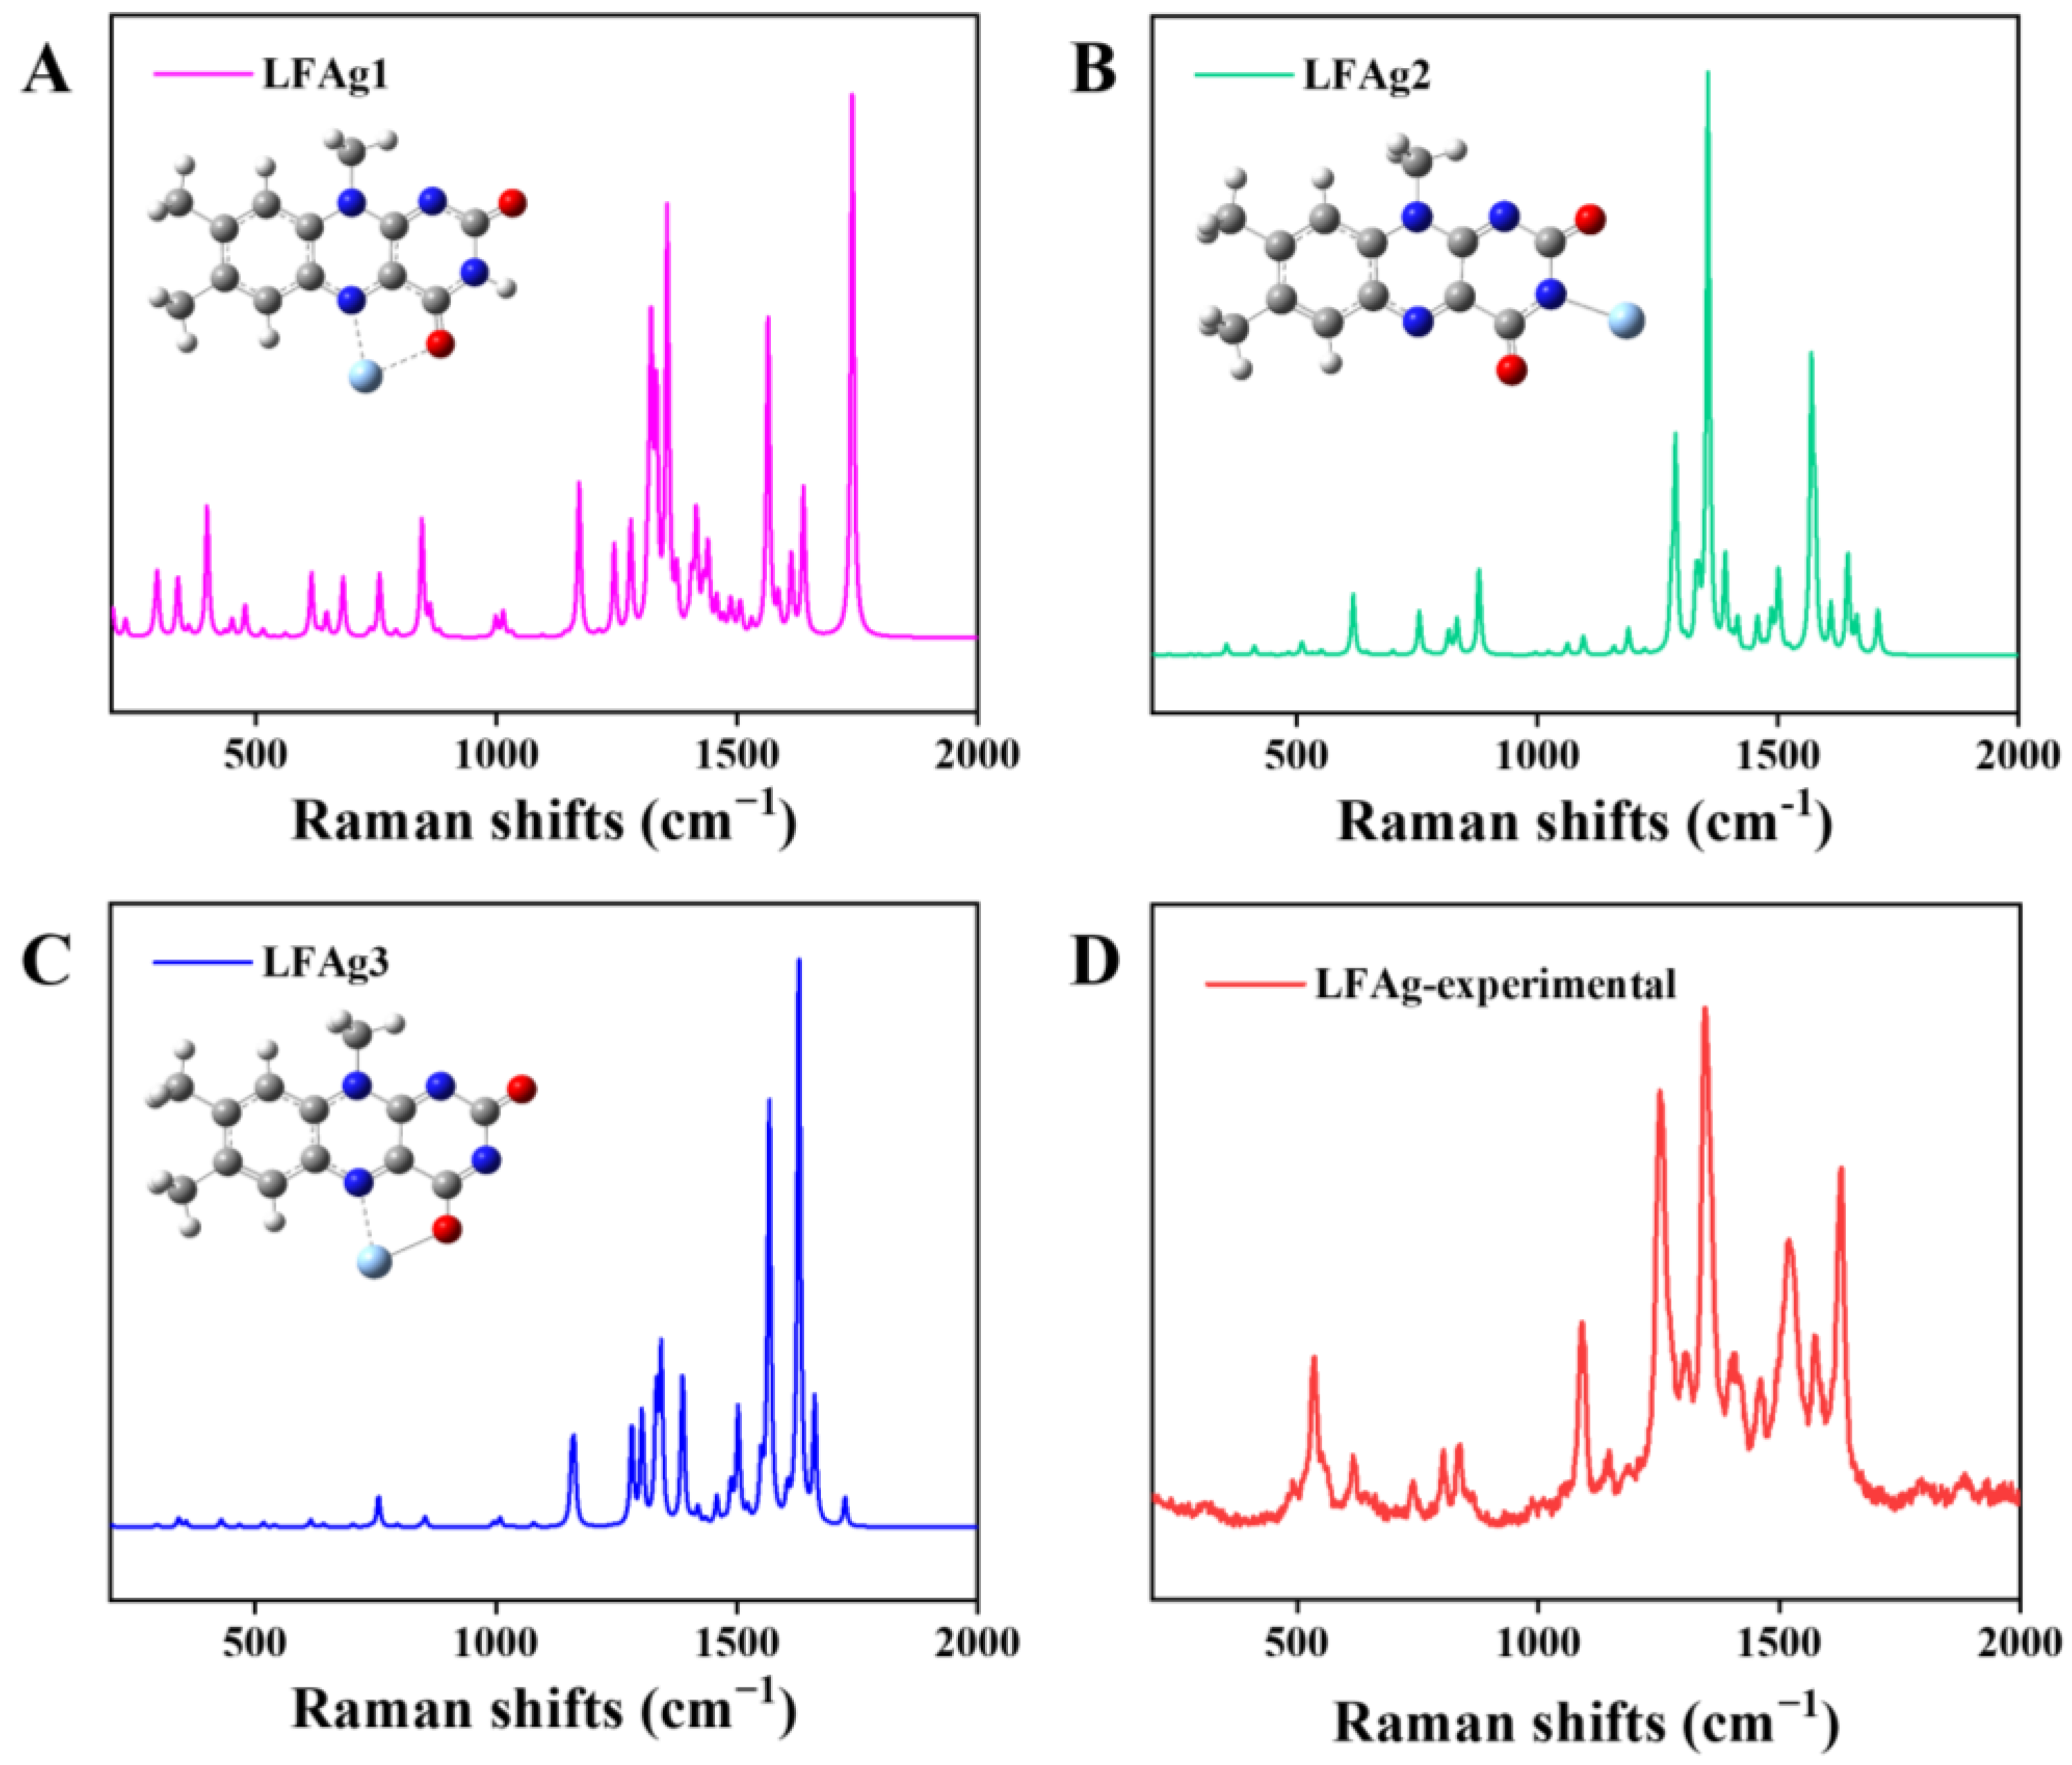
For the two adsorption modes, several adsorption modes were plotted using Gaussian software, as shown in Figure 4, below, and further calculations were performed by using the Lanl2dz pseudopotential group with the addition of Ag under the conditions of the B3LYP quantization method and the 6-311+G** -basis group. The results are shown in the following figure. Comparing the calculated spectra of the LF of these three adsorption modes and the experimental SERS spectra of the LF (Figure 5D), we found that the spectra of the LFAg2 adsorption mode were more consistent with the experimental spectra than the other two. In fact, the adsorption process was chaotic and the flavins preferred the N3 adsorption mode on the Ag nanoparticles. Furthermore, a few molecules may have been adsorbed by the N5.
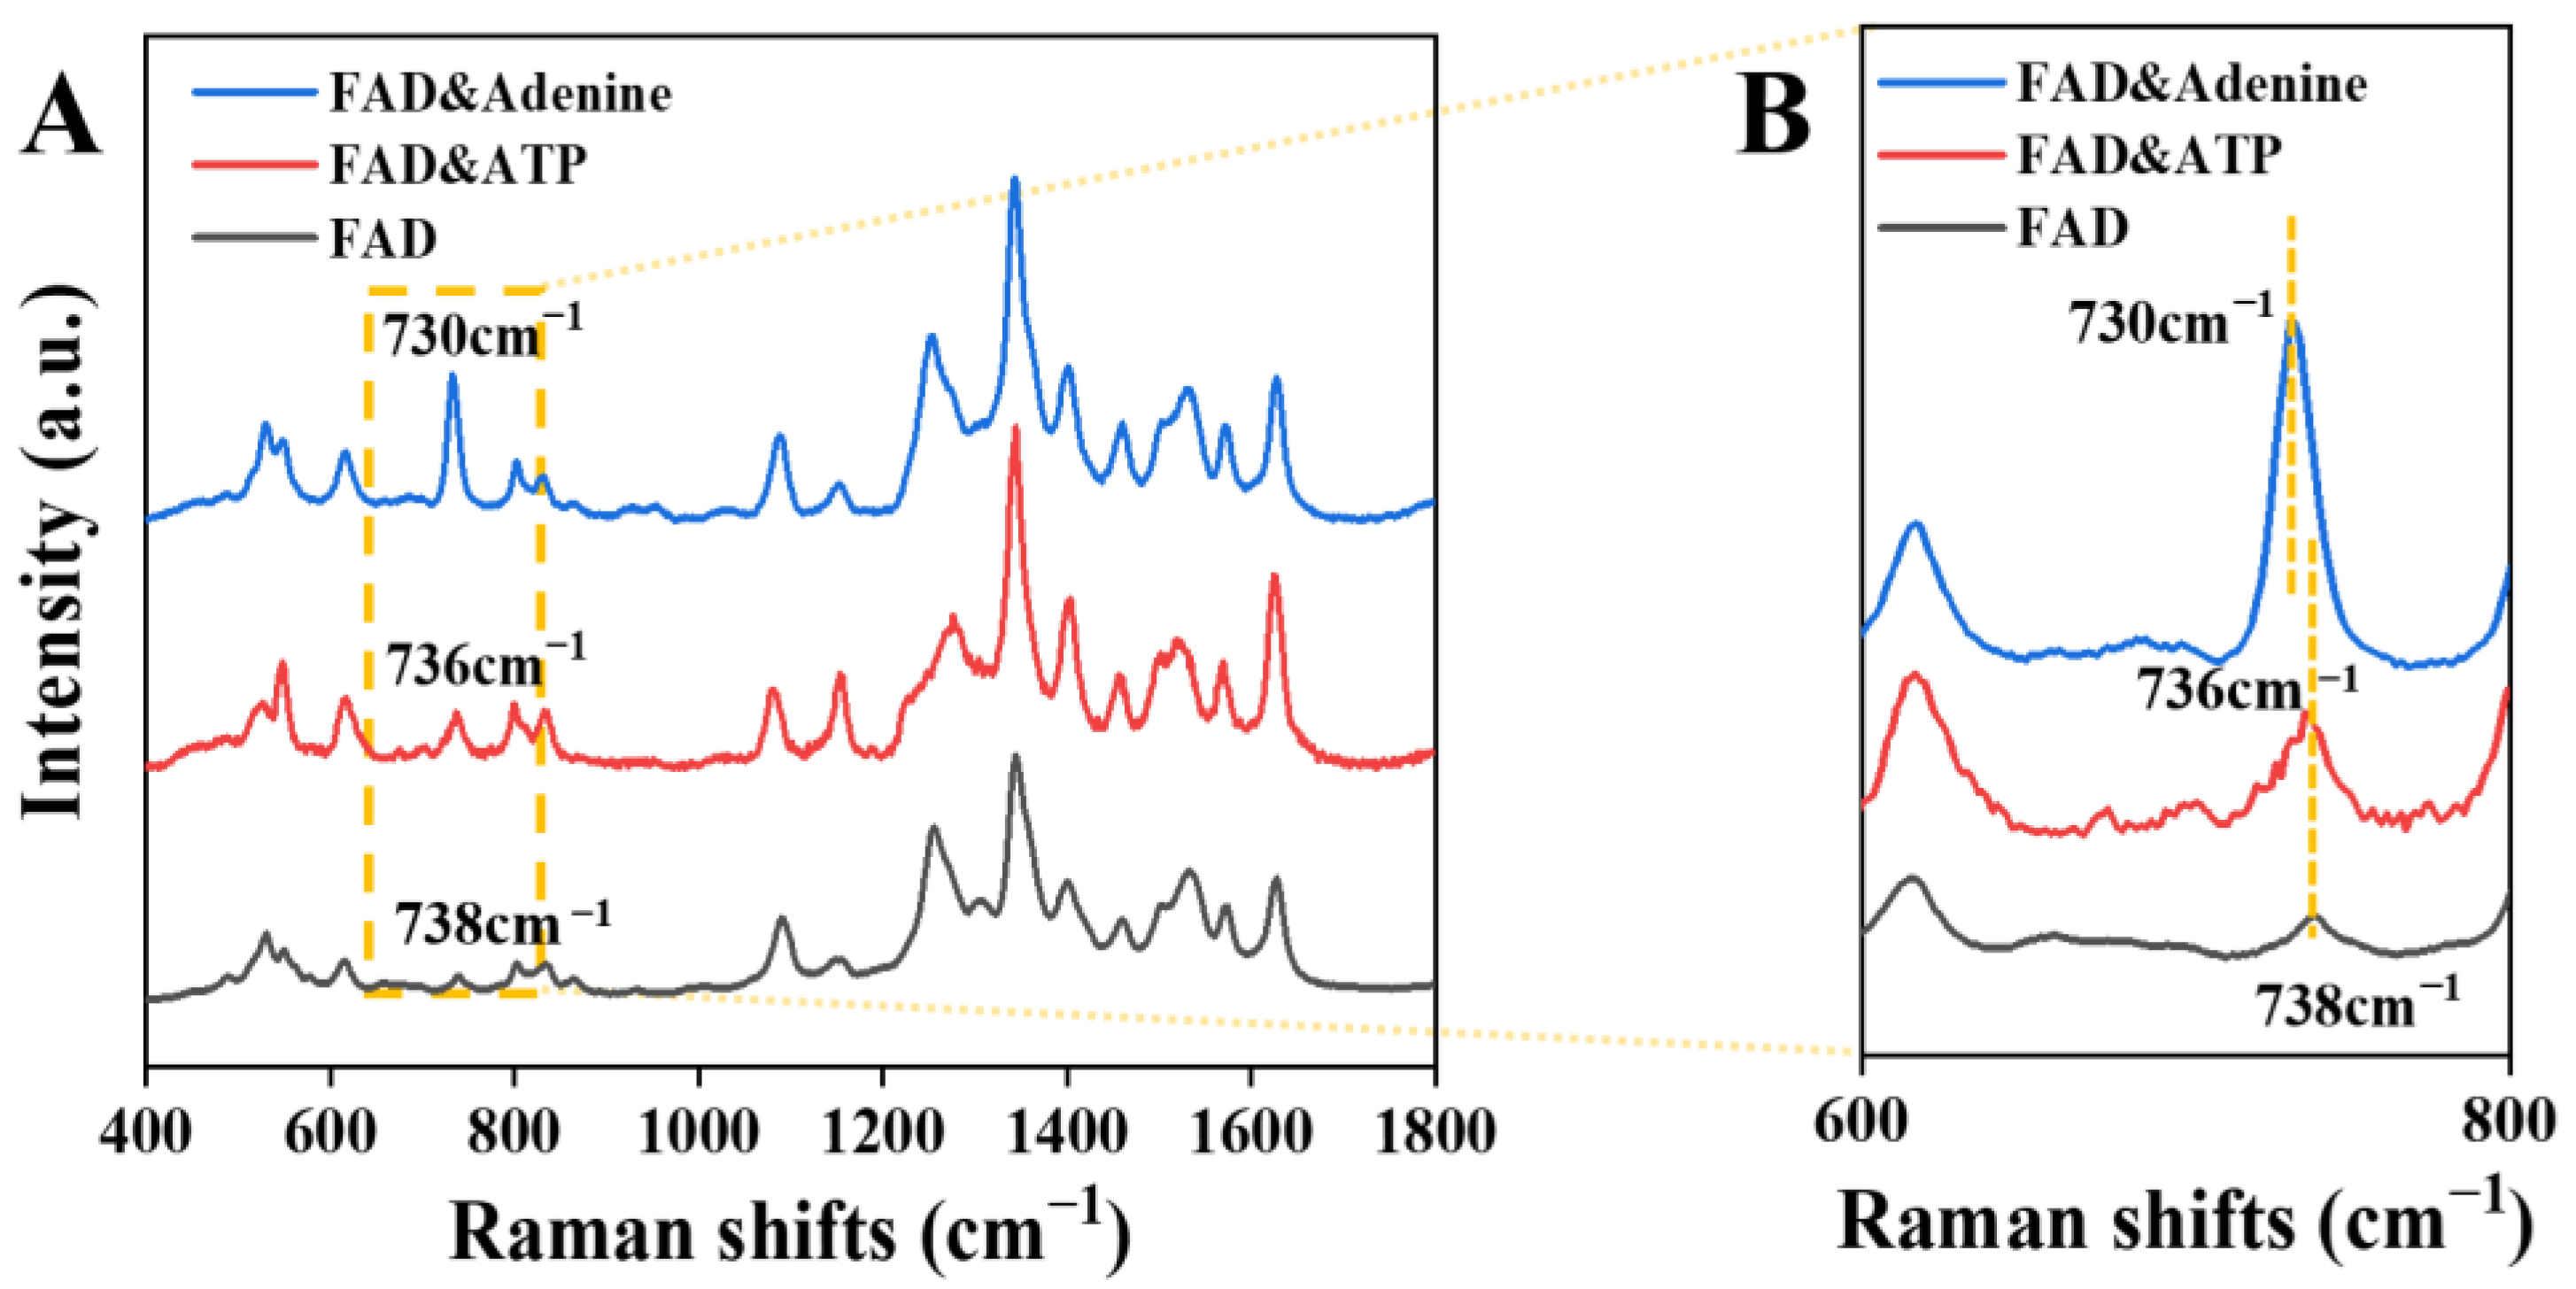
According to the results shown in Figure S6, there was a significant difference between the intensities of the characteristic peaks of the ring-breathing-vibration mode of the nitrogen-containing heterocyclic ring around 730 cm−1 on the Ag nanofilm for the same concentration of flavin molecules, adenine, or ATP. Even the N9 of adenine was substituted with other groups, like ATP, a noticeable peak in the ring-breathing-vibration of the nitrogen-containing heterocycles was still present, which can be attributed to the fact that the flavin molecule was connected to the Ag through the isoalloxazine ring rather than through the adenine moiety. To demonstrate this, we prepared mixed samples of FAD, RF, and FMN, each with adenine or ATP, ensuring that the concentration of all the solute molecules was 10−5 M. Subsequently, the glass pieces assembled with Ag nanofilms were immersed in each of the prepared solutions, followed by washing and drying. These samples were examined by 532-nanaometer-laser Raman spectroscopy, and the results are shown in Figure 5 and Figures S7. According to the spectrum in the yellow dashed region, the intensity of the characteristic peak of the ring-breathing-vibration mode of the nitrogen-containing heterocyclic ring near 730 cm−1 for the sample mixed with adenine was much higher than that of the flavin molecule alone and that of the sample mixed with ATP. The peak of 736 cm−1 might be attributable to the slight adsorption of ATP on the Ag nanofilm with the FAD, contributing to a slight redshift from 738 cm−1.
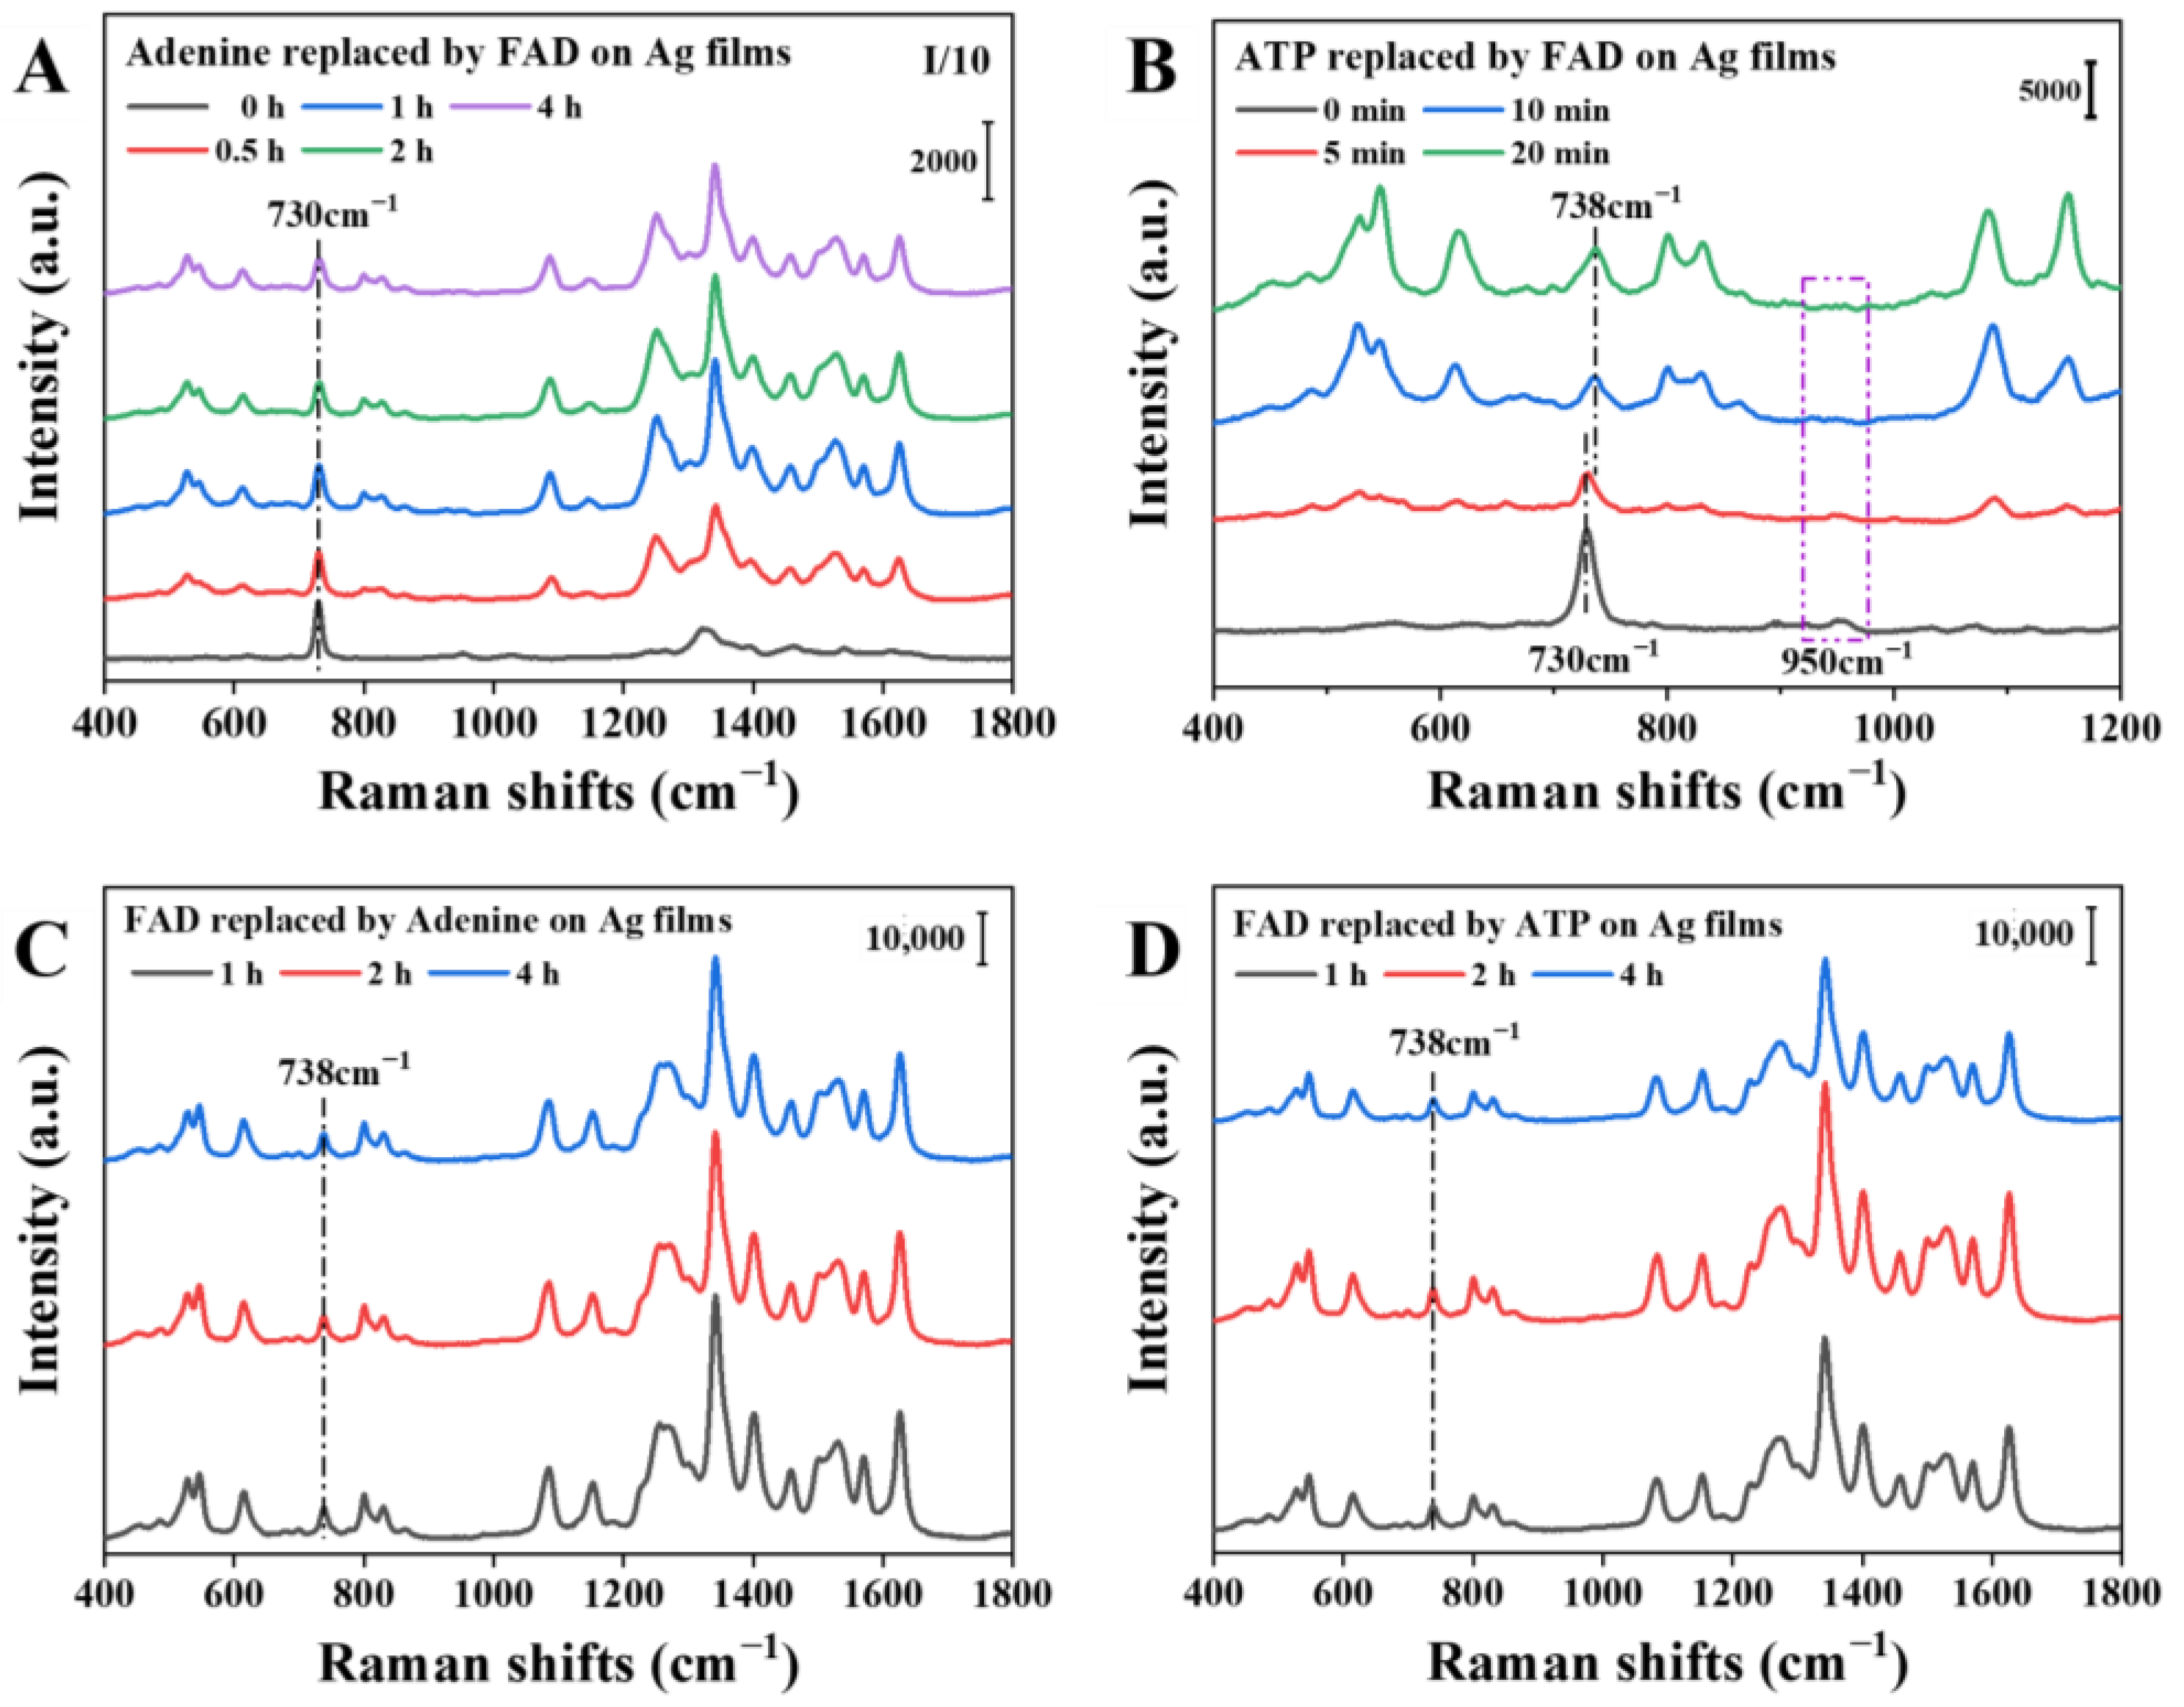
In addition, these results indicate that the adsorption of the N9 of the adenine and the N3 of the isoalloxazine ring on the Ag nanoparticles was stronger than the coordination adsorption of the N7 and N10 of the ATP. To further verify this conclusion, we designed an experiment for the replacement of signal molecules adsorbed on Ag nanofilms by other signal molecules. While ensuring sufficient adsorption time, adenine or ATP adsorbed on glass pieces of Ag nanofilms were soaked in a solution of flavin molecules for a period of time, and the flavin molecules adsorbed on the glass pieces of Ag nanofilms were soaked in a solution of adenine or ATP for a period of time. Next, the samples were removed, cleaned, dried, and subjected to 532-nanometer-laser Raman spectroscopy. The experimental results are shown in Figure 6 and Figure S8.
The characteristic peak at 730 cm−1 indicated the presence of adenine or ATP on the Ag-nanoparticle substrate. As shown in Figure 6A and Figure S8, the characteristic peak of the adenine adsorbed on the Ag-nanofilm glass slides at 730 cm−1 was not displaced or significantly weakened in intensity after it was soaked in RF, FMN, and FAD for 0.5, 1, 2, and 4 h, respectively, indicating that the adsorption capacity of the adenine and isoalloxazine rings on the Ag nanoparticles was comparable and stable.
The ATP showed completely different results. As revealed in Figure 6B, the intensities of the characteristic peaks at 730 and 950 cm−1 diminished after the Ag-nanofilm glass pieces with adenine or ATP were soaked in the FAD solution for 5 min, indicating that the ATP adsorbed on the Ag nanoparticles was rapidly replaced. After 10 min, the ring-breathing-vibration mode of the purine at 730 cm−1 changed to the ring-breathing-vibration mode of isoalloxazine Rings II and III. Moreover, the characteristic peak at 950 cm−1 disappeared, indicating that there were almost no ATP molecules on the Ag nanoparticles. These results indicate that ATP has a weak adsorption capacity on Ag nanoparticles.
We also performed experiments on the substitution of FAD adsorbed on Ag nanoparticles by adenine or ATP, as shown in Figure 6. According to the two spectra of C and D, after a certain substitution time, both only had the ring-breathing-vibration modes of isoalloxazine Rings II and III at 736 cm−1, revealing neither the adenine nor ATP were adsorbed on the Ag nanoparticles to replace the FAD. In the case of the adenine, the possible reason for this was that the fully adsorbed FAD molecule had a large spatial structure, such that there was a small adsorption space on the Ag nanofilm for the adenine, indicating that the adsorption of the adenine was lower than that of the FAD.
Taken together, these results indicate that the N9 of adenine and N3 of isoalloxazine ring have comparable and stable adsorption capacities on Ag nanoparticles, and that these are both stronger than the coordination adsorption of the N7 and N10 of ATP.

3.5. Analysis of Flavin Molecules under Different pH Conditions

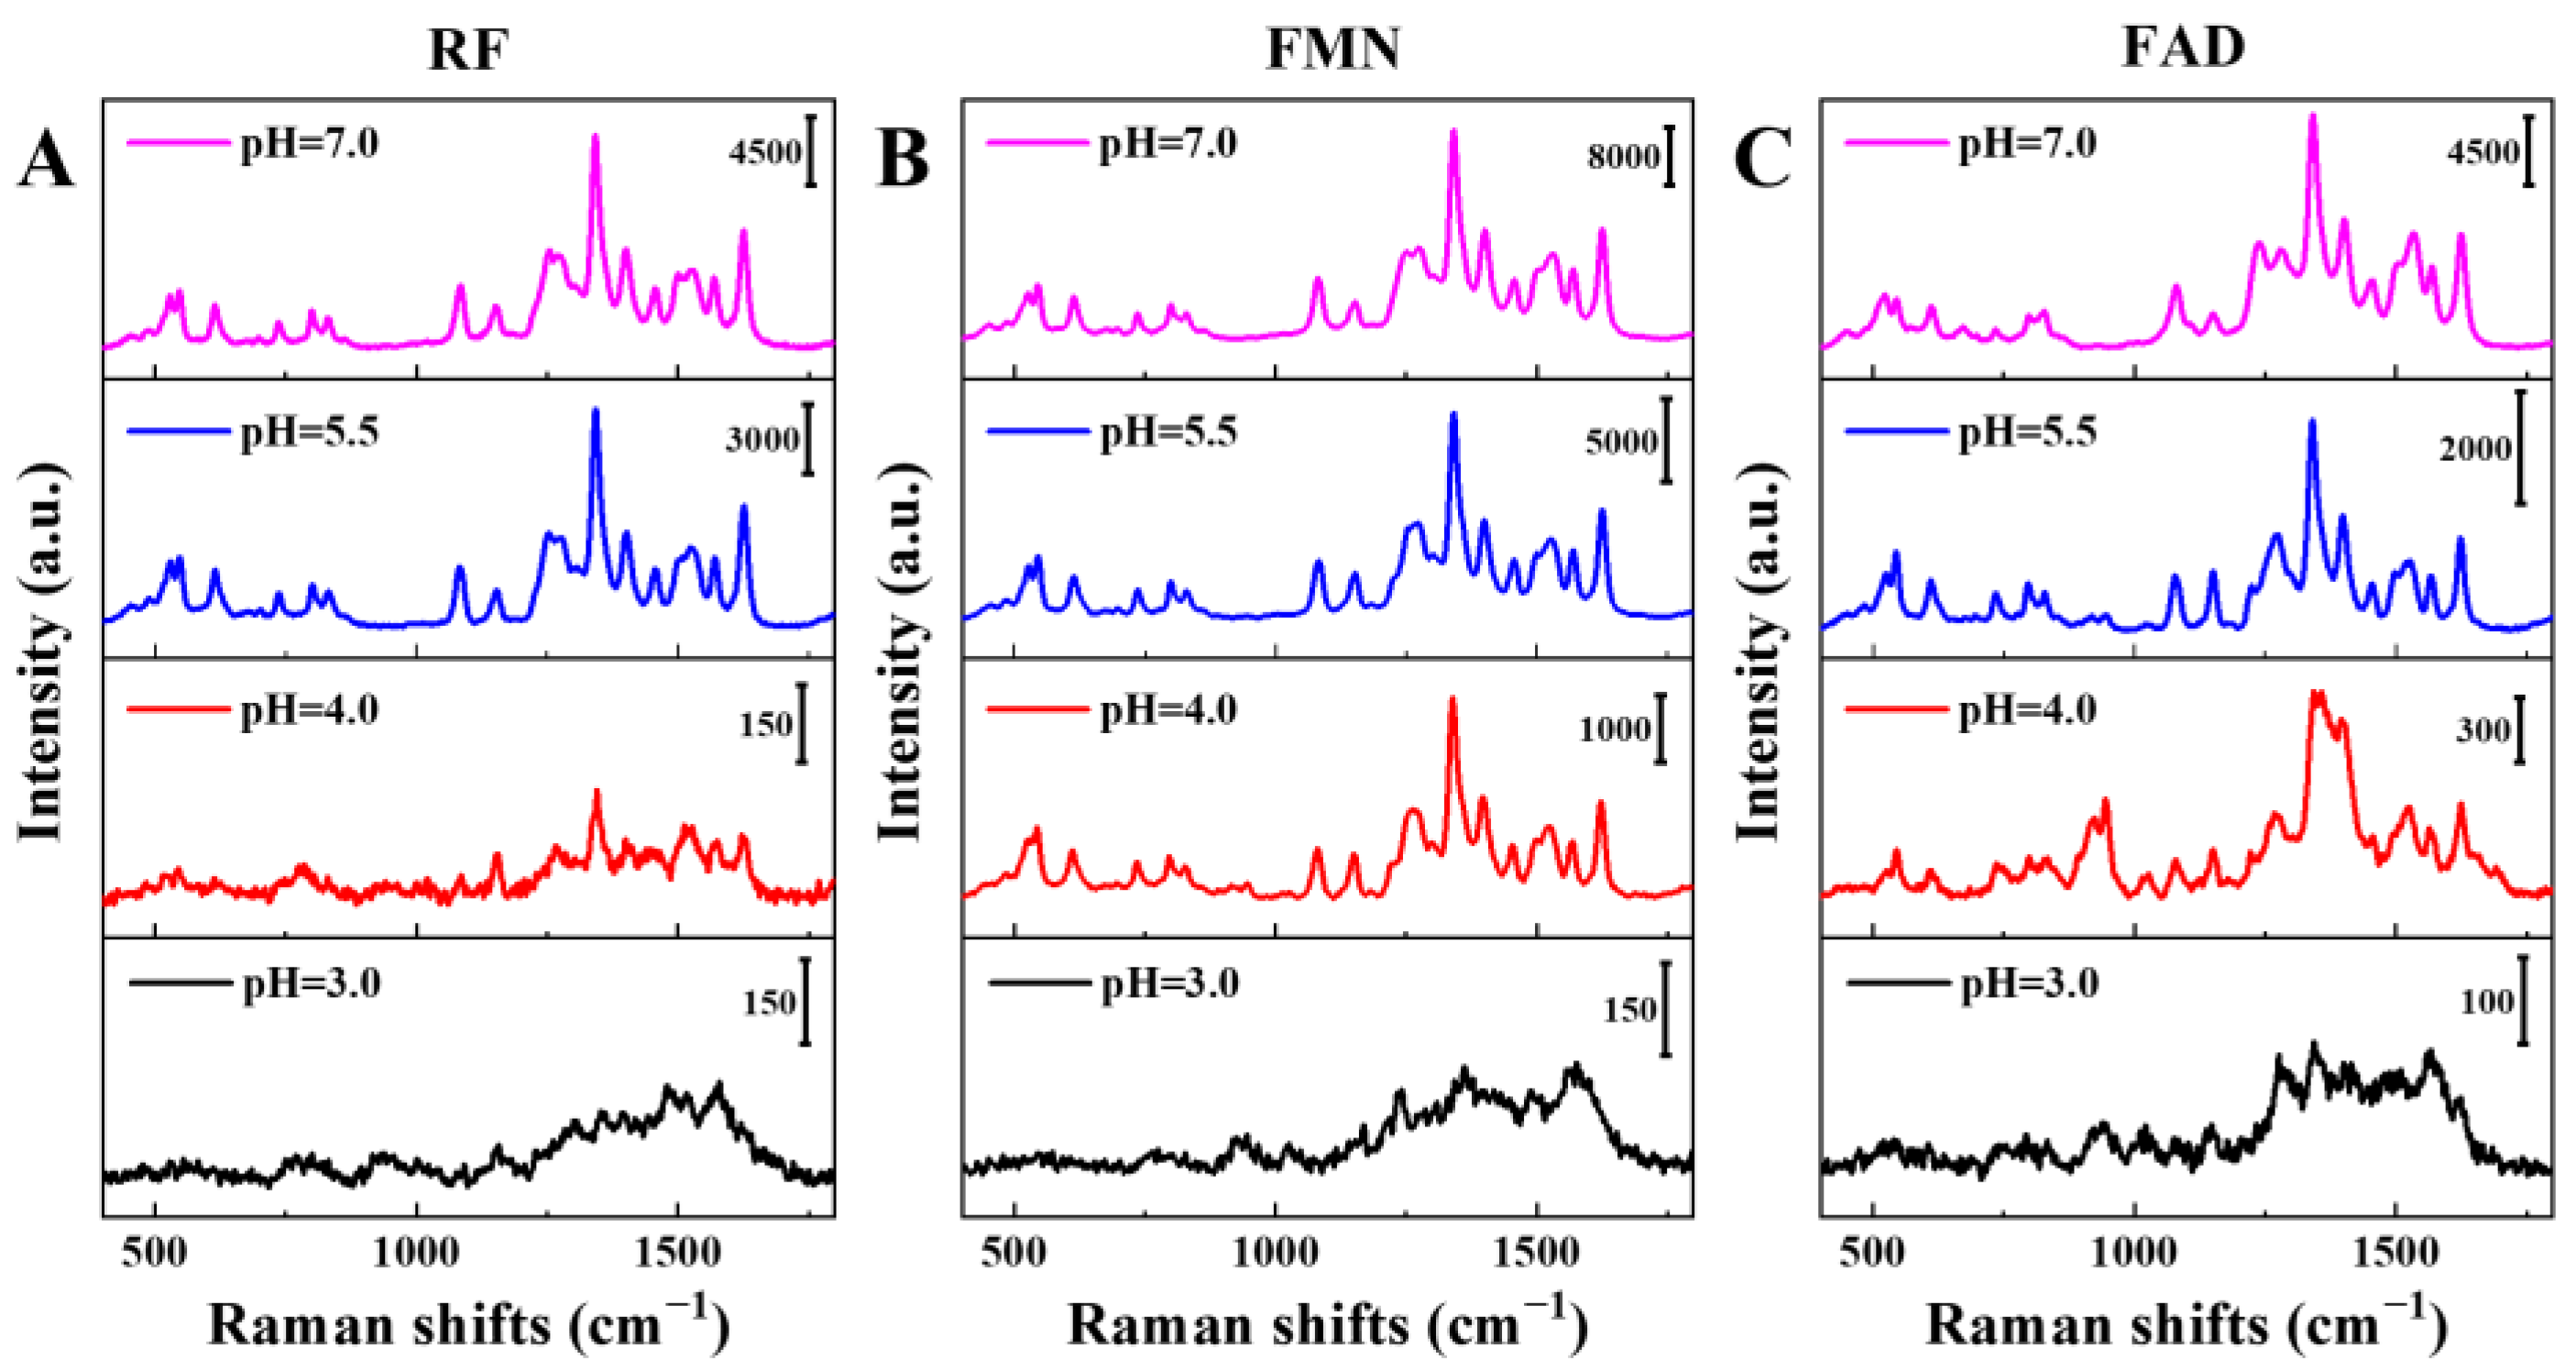
The sp3 hybridization of the N atom in nitrogen-containing compounds leaves a pair of lone electron pairs, which is a classical Lewis base. As an electron donor, the base can be converted to ammonium salt under acidic conditions. The pKa of isoalloxazine is about 10 [52]; therefore, under acidic conditions, the N3 on the isoalloxazine ring is protonated, which may affect the adsorption of flavin molecules on Ag nanoparticles. Since flavins tend to degenerate in basic environments, we prepared 10−5 M solutions of three flavin molecules at pH = 3.0, 4.0, 5.5, and 7.0, and they were adsorbed on Ag-nanofilm glass slides and analysed by 532-nanometer-laser Raman spectroscopy. The results are shown in Figure 7, below. At pH = 3.0, no obvious characteristic peaks of isoalloxazine were observed for the three flavin molecules. Characteristic peaks of isoalloxazine with weak signal intensity appeared on the Ag-nanoparticle substrate at pH = 4.0. At pH = 5.5–7.0, the signal intensity of the flavin molecules was further enhanced, indicating that deprotonated N3 is more favourable for the adsorption of the isoalloxazine ring on Ag nanoparticles.

3.6. Concentration Dependence of Flavin Molecules on Ag-Nanoparticle Substrates

The Ag-nanofilm glass slides were immersed in 10−5, 10−6, 10−7, or 10−8 M FAD solutions for 1 h, and the concentration-dependent spectra of the FAD molecules on the Ag-nanoparticle substrates were obtained by using 532-nanometer-laser Raman spectroscopy, as shown in Figure 8A. With the decrease in the FAD concentration, the number of molecules adsorbed on the Ag-nanoparticle substrates gradually decreased, resulting in a gradual decrease in signal intensity. Moreover, a good linear relationship was observed between 10−6 and 10−8 M (Figure 8B), with a regression equation of y = 184.85 + 46,987.06x and R2 = 0.99717.

4. Conclusions

In this study, flavin molecules were subjected to DFT calculations, solid-state Raman spectroscopy, and SERS study. The planar structure and conjugation system of LC can be changed by attaching other groups to the N10 of isoalloxazine, and this can cause obvious spectral differences in Ag-nanoparticle substrates. The similarities between the Raman spectra of the LF, RF, FMN, and FAD indicates that ribose groups attached to the N10 of isoalloxazine do not affect Raman signals on Ag-nanoparticle substrates. The characteristic Raman peaks can be mainly attributed to the isoalloxazine ring. The DFT calculations, the analysis of the ring-breathing-vibration modes of the nitrogen-containing heterocyclic rings, and the inter-substitution experiments between signal molecules demonstrated that the flavin molecules were adsorbed on the Ag nanoparticles through the N3 site on the isoalloxazine ring rather than through the weaker adenine moiety. These results indicate that deprotonated N3 is favourable to the adsorption of flavin molecules on Ag nanoparticles.
This study summarized the fundamental research on all the flavins based on Raman and SERS spectroscopy, with the aim of elaborating the assignment of SERS-feature peaks on Ag nanoparticles, pointing to the adsorption mode and determining the suitable pH (5.5–7.0) and concentration for working on Ag nanoparticles, thereby paving the way for the functional exploration of flavoproteins and sensors via nano-chip-adsorbed or core-shell-nano-structure-embedded flavins based on SERS.

Supplementary Materials

The following supporting information can be downloaded at: https://www.mdpi.com/article/10.3390/chemosensors11030190/s1, Figure S1: The comparison of the calculated Raman spetrum(black) and the experimental solid Raman spectrum(red) of lumichrome; Figure S2: The comparison of the calculated Raman spetrum(black) and the experimental solid Raman spectrum(red) of lumiflavin; Figure S3: (A) The comparison of calculated Raman spectra of RF, FMN and FAD. (B) The comparison of calculated Raman spectra of LC, LF and FAD; Figure S4: (A) TEM image of Ag nanoparticles; (B) SEM image of the self-assembled silver film; (C) UV spectra of Ag colloid, FAD and mixture of Ag colloid and FAD. The prepared Ag sol was mixed with 10−4 M of FAD at a volume ratio of 9:1, followed by 5-fold dilution. Next, the UV spectra were characterized and compared with the UV spectra of the diluted Ag sol and FAD mix.; (D) Fluorescence emission spectra of Ag colloid, FAD and mixture of Ag colloid and FAD at 470 nm excitation. The concentration of FAD for fluorescence detection was equal to that of the mixture of Ag colloid and FAD with a volume ratio of 9:1 at 10−5 M; Figure S5: Normal Raman (a) and SERS (b) spectra of LC (A), LF (B) and FAD (C); Figure S6: SERS spectra of 10−5 M RF, FMN, FAD, adenine and ATP on Ag film at 532 nm laser; Figure S7: 532 nm laser Raman spectra of RF(A) and FMN (B), mixed with the same concentration of adenine or ATP; Figure S8: 532 nm laser Raman spectra of adenine replaced by RF (A) and FMN (B) on Ag films, respectively; Table S1: Band assignments of Raman and SERS spectra from DFT calculation and experimental results of LC; Table S2: Band assignments of Raman and SERS spectra from DFT calculation and experimental results of LF.

Author Contributions

Conceptualization, B.Z. and X.H.; methodology, Y.L. and H.M.; software, H.M. and J.Z.; validation, Y.L., B.Z. and X.H.; formal analysis, Y.L. and X.H.; investigation, Y.L., H.M., J.Z. and J.W.; resources, B.Z.; data curation, Y.L., J.Z. and J.W.; writing—original draft preparation, Y.L.; writing—review and editing, X.H. and H.M.; visualization, X.H. and J.W.; supervision, B.Z.; project administration, X.H. and B.Z.; funding acquisition, B.Z. All authors have read and agreed to the published version of the manuscript.

Funding

This research was funded by the National Natural Science Foundation of P. R. China, grant number 22011540378, the Development Program of the Science and Technology of Jilin Province, grant number 20220204111YY, and the National Key Research and Development Program of China, grant number 2022YFA1504200.

Institutional Review Board Statement

Not applicable.

Informed Consent Statement

Not applicable.

Data Availability Statement

Not applicable.

Conflicts of Interest

The authors declare no conflict of interest.

References

  1. Pinto, J.T.; Zempleni, J. Riboflavin. Adv. Nutr. 2016, 7, 973–975. [Google Scholar] [CrossRef] [Green Version]
  2. Powers, H.J. Riboflavin (vitamin B-2) and health. Am. J. Clin. Nutr. 2003, 77, 1352–1360. [Google Scholar] [CrossRef] [Green Version]
  3. Viñas, P.; Balsalobre, N.; López-Erroz, C.; Hernández-Córdoba, M. Liquid Chromatographic Analysis of Riboflavin Vitamers in Foods Using Fluorescence Detection. J. Agric. Food Chem. 2004, 52, 1789–1794. [Google Scholar] [CrossRef]
  4. Díez-Pascual, A.M.; García-García, D.; Andrés, M.P.S.; Vera, S. Determination of riboflavin based on fluorescence quenching by graphene dispersions in polyethylene glycol. RSC Adv. 2016, 6, 19686–19699. [Google Scholar] [CrossRef]
  5. Shumyantseva, V.V.; Bulko, T.V.; Petushkova, N.A.; Samenkova, N.F.; Kuznetsova, G.P.; Archakov, A.I. Fluorescent assay for riboflavin binding to cytochrome P450 2B4. J. Inorg. Biochem. 2003, 98, 365–370. [Google Scholar] [CrossRef] [PubMed]
  6. Li, D.; Bie, Z.; Wang, F.; Guo, E. Efficient synthesis of riboflavin-imprinted magnetic nanoparticles by boronate affinity-based surface imprinting for the selective recognition of riboflavin. Analyst 2018, 143, 4936–4943. [Google Scholar] [CrossRef] [PubMed]
  7. He, H.; Muhammad, P.; Guo, Z.; Peng, Q.; Lu, H.; Liu, Z. Controllably prepared molecularly imprinted core-shell plasmonic nanostructure for plasmon-enhanced fluorescence assay. Biosens. Bioelectron. 2019, 146, 111733. [Google Scholar] [CrossRef]
  8. McNay, G.; Eustace, D.; Smith, W.E.; Faulds, K.; Graham, D. Surface-Enhanced Raman Scattering (SERS) and Surface-Enhanced Resonance Raman Scattering (SERRS): A Review of Applications. Appl. Spectrosc. 2011, 65, 825–837. [Google Scholar] [CrossRef] [PubMed]
  9. Cialla, D.; März, A.; Böhme, R.; Theil, F.; Weber, K.; Schmitt, M.; Popp, J. Surface-enhanced Raman spectroscopy (SERS): Progress and trends. Anal. Bioanal. Chem. 2011, 403, 27–54. [Google Scholar] [CrossRef]
  10. Li, J.F.; Huang, Y.F.; Ding, Y.; Yang, Z.L.; Li, S.B.; Zhou, X.S.; Fan, F.R.; Zhang, W.; Zhou, Z.Y.; Wu, D.Y.; et al. Shell-isolated nanoparticle-enhanced Raman spectroscopy. Nature 2010, 464, 392–395. [Google Scholar] [CrossRef]
  11. Wang, H.-L.; You, E.-M.; Panneerselvam, R.; Ding, S.-Y.; Tian, Z.-Q. Advances of surface-enhanced Raman and IR spectroscopies: From nano/microstructures to macro-optical design. Light. Sci. Appl. 2021, 10, 161. [Google Scholar] [CrossRef]
  12. Li, P.; Wang, X.; Zhang, X.; Zhang, L.; Yang, X.; Zhao, B. Investigation of the Charge-Transfer Between Ga-Doped ZnO Nanoparticles and Molecules Using Surface-Enhanced Raman Scattering: Doping Induced Band-Gap Shrinkage. Front. Chem. 2019, 7, 144. [Google Scholar] [CrossRef] [Green Version]
  13. Guo, L.; Mao, Z.; Jin, S.; Zhu, L.; Zhao, J.; Zhao, B.; Jung, Y. A SERS Study of Charge Transfer Process in Au Nanorod–MBA@Cu2O Assemblies: Effect of Length to Diameter Ratio of Au Nanorods. Nanomaterials 2021, 11, 867. [Google Scholar] [CrossRef]
  14. Yang, B.; Wang, Y.; Guo, S.; Jin, S.; Park, E.; Chen, L.; Jung, Y.M. Charge transfer study for semiconductor and semiconductor/ metal composites based on surface-enhanced Raman scattering. Bull. Korean Chem. Soc. 2021, 42, 1411–1418. [Google Scholar] [CrossRef]
  15. Liu, Y.; Ma, H.; Han, X.X.; Zhao, B. Metal–semiconductor heterostructures for surface-enhanced Raman scattering: Synergistic contribution of plasmons and charge transfer. Mater. Horizons 2020, 8, 370–382. [Google Scholar] [CrossRef]
  16. Shan, Y.; Zheng, Z.; Liu, J.; Yang, Y.; Li, Z.; Huang, Z.; Jiang, D. Niobium pentoxide: A promising surface-enhanced Raman scattering active semiconductor substrate. npj Comput. Mater. 2017, 3, 11. [Google Scholar] [CrossRef]
  17. Wang, X.; Zhang, E.; Shi, H.; Tao, Y.; Ren, X. Semiconductor-based surface enhanced Raman scattering (SERS): From active materials to performance improvement. Anal. 2022, 147, 1257–1272. [Google Scholar] [CrossRef] [PubMed]
  18. Ma, H.; Tang, X.; Liu, Y.; Han, X.X.; He, C.; Lu, H.; Zhao, B. Surface-Enhanced Raman Scattering for Direct Protein Function Investigation: Controlled Immobilization and Orientation. Anal. Chem. 2019, 91, 8767–8771. [Google Scholar] [CrossRef] [Green Version]
  19. Wu, X.; Li, Y.; Wang, J.; Zhou, H.; Tang, X.; Yang, Y.; Wang, Z.; Chen, D.; Zhou, X.; Guo, J.; et al. Click-Reaction-Triggered SERS Signals for Specific Detection of Monoamine Oxidase B Activity. Anal. Chem. 2020, 92, 15050–15058. [Google Scholar] [CrossRef]
  20. Zhang, P.; Wang, Y.; Zhao, X.; Ji, Y.; Mei, R.; Fu, L.; Man, M.; Ma, J.; Wang, X.; Chen, L. Surface-enhanced Raman scattering labeled nanoplastic models for reliable bio-nano interaction investigations. J. Hazard. Mater. 2021, 425, 127959. [Google Scholar] [CrossRef]
  21. Plou, J.; Valera, P.S.; García, I.; de Albuquerque, C.D.L.; Carracedo, A.; Liz-Marzán, L.M. Prospects of Surface-Enhanced Raman Spectroscopy for Biomarker Monitoring toward Precision Medicine. ACS Photonics 2022, 9, 333–350. [Google Scholar] [CrossRef] [PubMed]
  22. Markina, N.E.; Goryacheva, I.Y.; Markin, A.V. Surface-Enhanced Raman Spectroscopy for the Determination of Medical and Narcotic Drugs in Human Biofluids. J. Anal. Chem. 2022, 77, 930–947. [Google Scholar] [CrossRef]
  23. Samal, A.K.; Polavarapu, L.; Rodal-Cedeira, S.; Liz-Marzán, L.M.; Pérez-Juste, J.; Pastoriza-Santos, I. Size Tunable Au@Ag Core–Shell Nanoparticles: Synthesis and Surface-Enhanced Raman Scattering Properties. Langmuir 2013, 29, 15076–15082. [Google Scholar] [CrossRef] [Green Version]
  24. Liu, Z.; Yang, Z.; Peng, B.; Cao, C.; Zhang, C.; You, H.; Xiong, Q.; Li, Z.; Fang, J. Highly sensitive, uniform, and reproducible surface-enhanced Raman spectroscopy from hollow Au-Ag alloy nanourchins. Adv. Mater. 2014, 26, 2431–2439. [Google Scholar] [CrossRef]
  25. Bonifacio, A.; Marta, S.D.; Spizzo, R.; Cervo, S.; Steffan, A.; Colombatti, A.; Sergo, V. Surface-enhanced Raman spectroscopy of blood plasma and serum using Ag and Au nanoparticles: A systematic study. Anal. Bioanal. Chem. 2014, 406, 2355–2365. [Google Scholar] [CrossRef]
  26. Wang, X.; Li, P.; Han, X.X.; Kitahama, Y.; Zhao, B.; Ozaki, Y. An enhanced degree of charge transfer in dye-sensitized solar cells with a ZnO-TiO 2/N3/Ag structure as revealed by surface-enhanced Raman scattering. Nanoscale 2017, 9, 15303–15313. [Google Scholar] [CrossRef]
  27. Guo, L.; Mao, Z.; Ma, C.; Wu, J.; Zhu, L.; Zhao, B.; Jung, Y.M. Charge Transfer in 4-Mercaptobenzoic Acid-Stabilized Au Nanorod@Cu2O Nanostructures: Implications for Photocatalysis and Photoelectric Devices. ACS Appl. Nano Mater. 2021, 4, 381–388. [Google Scholar] [CrossRef]
  28. Schmidt, J.; Coudron, P.; Thompson, A.W.; Watters, K.L.; McFarland, J.T. Hydrogen bonding between flavin and protein: A resonance Raman study. Biochemistry 1983, 22, 76–84. [Google Scholar] [CrossRef]
  29. Murgida, D.H.; Schleicher, E.; Bacher, A.; Richter, G.; Hildebrandt, P. Resonance Raman spectroscopic study of the neutral flavin radical complex of DNA photolyase fromEscherichia coli. J. Raman Spectrosc. 2001, 32, 551–556. [Google Scholar] [CrossRef]
  30. Schelvis, J.P.M.; Pun, D.; Goyal, N.; Sokolova, O. Resonance Raman spectra of the neutral and anionic radical semiquinones of flavin adenine dinucleotide in glucose oxidase revisited. J. Raman Spectrosc. 2006, 37, 822–829. [Google Scholar] [CrossRef]
  31. Green, D.; Roy, P.; Hall, C.R.; Iuliano, J.N.; Jones, G.A.; Lukacs, A.; Tonge, P.J.; Meech, S.R. Excited State Resonance Raman of Flavin Mononucleotide: Comparison of Theory and Experiment. J. Phys. Chem. A 2021, 125, 6171–6179. [Google Scholar] [CrossRef] [PubMed]
  32. Zeiri, L.; Efrima, S. Surface-enhanced Raman spectroscopy of bacteria: The effect of excitation wavelength and chemical modification of the colloidal milieu. J. Raman Spectrosc. 2005, 36, 667–675. [Google Scholar] [CrossRef]
  33. Xu, B.-B.; Ma, Z.-C.; Wang, L.; Zhang, R.; Niu, L.-G.; Yang, Z.; Zhang, Y.-L.; Zheng, W.-H.; Zhao, B.; Xu, Y.; et al. Localized flexible integration of high-efficiency surface enhanced Raman scattering (SERS) monitors into microfluidic channels. Lab Chip 2011, 11, 3347–3351. [Google Scholar] [CrossRef]
  34. Qi, G.; Wang, Y.; Zhang, B.; Sun, D.; Fu, C.; Xu, W.; Xu, S. Glucose oxidase probe as a surface-enhanced Raman scattering sensor for glucose. Anal. Bioanal. Chem. 2016, 408, 7513–7520. [Google Scholar] [CrossRef]
  35. Hernández-Sánchez, D.; Villabona-Leal, G.; Saucedo-Orozco, I.; Bracamonte, V.; Pérez, E.; Bittencourt, C.; Quintana, M. Stable graphene oxide–gold nanoparticle platforms for biosensing applications. Phys. Chem. Chem. Phys. 2017, 20, 1685–1692. [Google Scholar] [CrossRef]
  36. Maskevich, S.; Strekal, N.; Artsukevich, I.; Kivach, L.; Chernikevich, I. Surface enhanced Raman scattering investigation of protein-bound flavin adenine dinucleotide structure. J. Mol. Struct. 1995, 349, 5–8. [Google Scholar] [CrossRef]
  37. Abdelsalam, M.; Bartlett, P.N.; Russell, A.; Baumberg, J.J.; Calvo, E.J.; Tognalli, N.G.; Fainstein, A. Quantitative Electrochemical SERS of Flavin at a Structured Silver Surface. Langmuir 2008, 24, 7018–7023. [Google Scholar] [CrossRef] [PubMed]
  38. Lee, P.C.; Meisel, D. Adsorption and surface-enhanced Raman of dyes on silver and gold sols. J. Phys. Chem. 1982, 86, 3391–3395. [Google Scholar] [CrossRef]
  39. Becke, A.D. Density-functional exchange-energy approximation with correct asymptotic behavior. Phys. Rev. A 1988, 38, 3098–3100. [Google Scholar] [CrossRef] [PubMed]
  40. Becke, A.D. Density-functional thermochemistry III. The role of exact exchange. J. Chem. Phys. 1993, 98, 5648–5652. [Google Scholar] [CrossRef] [Green Version]
  41. Jamróz, M.H. Vbrational energy distribution analysis (VEDA): Scopes and limitations Spectrochim. Acta. A 2013, 114, 220–230. [Google Scholar] [CrossRef]
  42. Scott, A.P.; Radom, L. Harmonic vibrational frequencies: An evaluation of Hartree− Fock, Møller− Plesset, quadratic configuration interaction, density functional theory, and semiempirical scale factors. J. Phys. Chem. 1996, 100, 16502–16513. [Google Scholar] [CrossRef]
  43. Merrick, J.P.; Moran, D.; Radom, L. An Evaluation of Harmonic Vibrational Frequency Scale Factors. J. Phys. Chem. A 2007, 111, 11683–11700. [Google Scholar] [CrossRef]
  44. Alecu, I.M.; Zheng, J.; Zhao, Y.; Truhlar, D.G. Computational Thermochemistry: Scale Factor Databases and Scale Factors for Vibrational Frequencies Obtained from Electronic Model Chemistries. J. Chem. Theory Comput. 2010, 6, 2872–2887. [Google Scholar] [CrossRef]
  45. Laury, M.L.; Carlson, M.J.; Wilson, A.K. Vibrational frequency scale factors for density functional theory and the polarization consistent basis sets. J. Comput. Chem. 2012, 33, 2380–2387. [Google Scholar] [CrossRef]
  46. Kashinski, D.O.; Chase, G.M.; Nelson, R.G.; Di Nallo, O.E.; Scales, A.N.; VanderLey, D.L.; Byrd, E.F.C. Harmonic Vibrational Frequencies: Approximate Global Scaling Factors for TPSS, M06, and M11 Functional Families Using Several Common Basis Sets. J. Phys. Chem. A 2017, 121, 2265–2273. [Google Scholar] [CrossRef]
  47. Ouyang, L.; Zhu, L.; Jiang, J.; Tang, H. A surface-enhanced Raman scattering method for detection of trace glutathione on the basis of immobilized silver nanoparticles and crystal violet probe. Anal. Chim. Acta 2014, 816, 41–49. [Google Scholar] [CrossRef]
  48. Hussain, S.; Pang, Y. Surface geometry of tryptophan adsorbed on gold colloidal nanoparticles. J. Mol. Struct. 2015, 1096, 121–128. [Google Scholar] [CrossRef]
  49. Maruyama, Y.; Ishikawa, M.; Futamata, M. Surface-Enhanced Raman Scattering of Single Adenine Molecules on Silver Colloidal Particles. Chem. Lett. 2001, 30, 834–835. [Google Scholar] [CrossRef]
  50. Papadopoulou, E.; Bell, S.E.J. Structure of Adenine on Metal Nanoparticles: pH Equilibria and Formation of Ag+ Complexes Detected by Surface-Enhanced Raman Spectroscopy. J. Phys. Chem. C 2010, 114, 22644–22651. [Google Scholar] [CrossRef]
  51. Holt, R.E.; Cotton, T.M. Surface-enhanced resonance Raman and electrochemical investigation of glucose oxidase catalysis at a silver electrode. J. Am. Chem. Soc. 1989, 111, 2815–2821. [Google Scholar] [CrossRef]
  52. Choudhury, S.D.; Vir, P.; Mohanty, J.; Bhasikuttan, A.C.; Pal, H. Selective prototropism of lumichrome in cationic micelles and reverse micelles: A photophysical perspective. RSC Adv. 2016, 6, 6111–6124. [Google Scholar] [CrossRef]
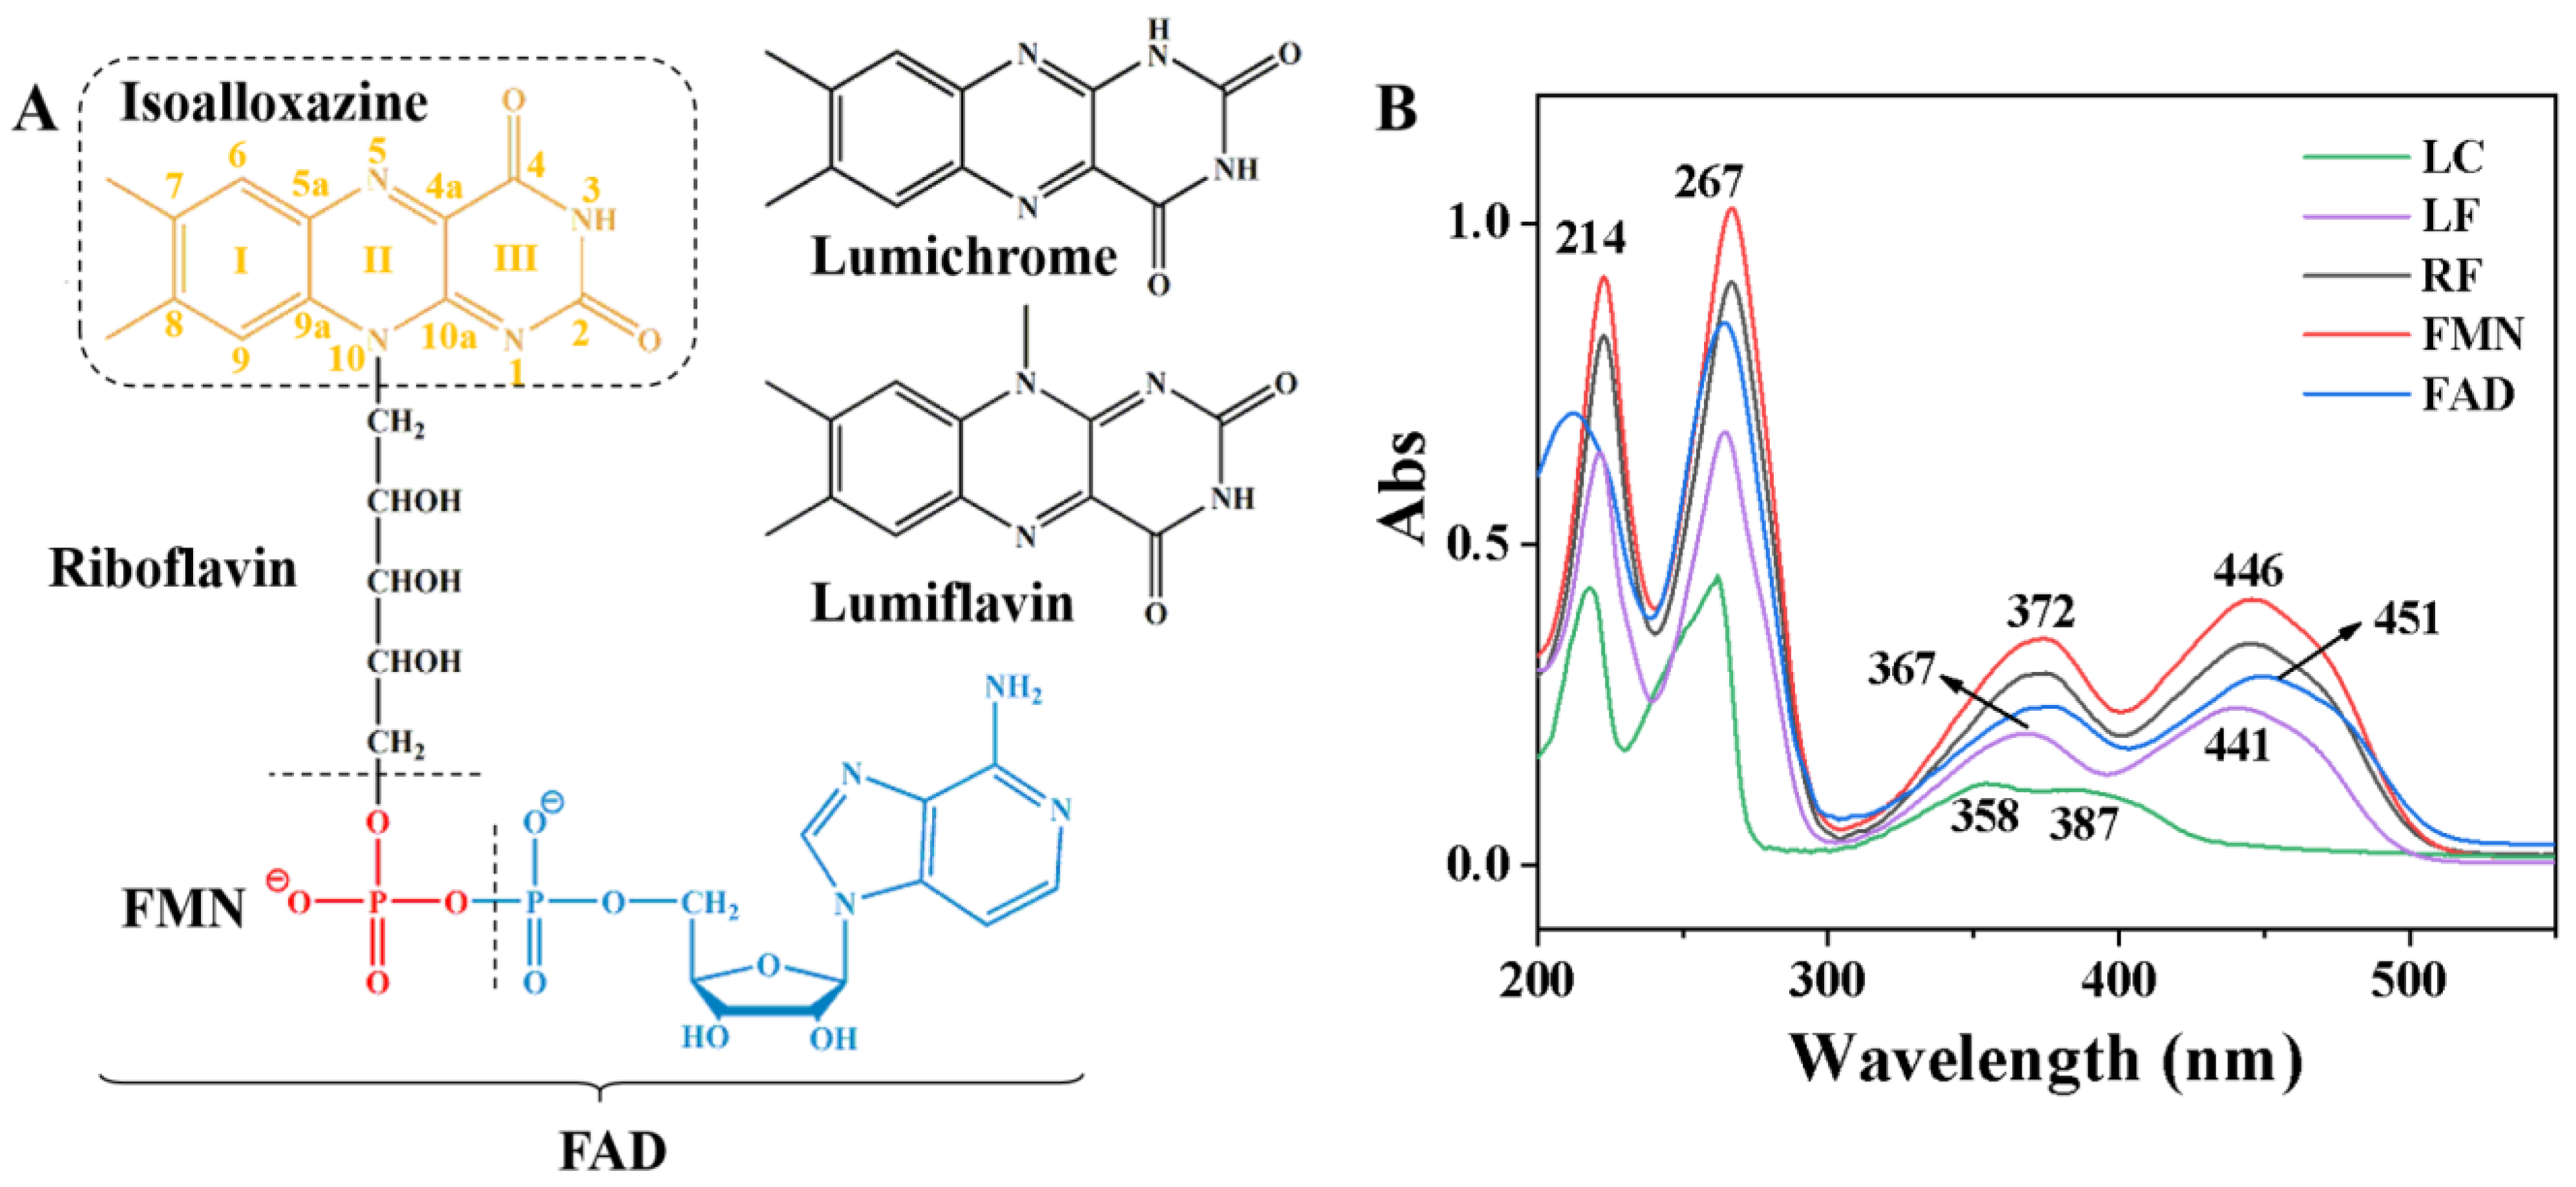
Figure 1. (A) Structures of lumichrome (LC), lumiflavin (LF), riboflavin (RF), flavin mononucleotide (FMN) and flavin adenine dinucleotide (FAD); (B) UV absorption spectra of LC, LF, RF, FMN, and FAD.
Chemosensors 11 00190 g001
Figure 2. Normal Raman (A) and SERS (B) spectra of LC, LF, FAD, FMN, and RF.
Chemosensors 11 00190 g002
Figure 3. (A) The SERS spectra of 10−5 M FAD on Ag nanofilm at 1, 2, 4, 8, 15, 30, 60, 120, 240 min immersed time, respectively; (B) the adsorption curve of 10−5 M FAD on Ag nanofilm with respect to time based on 1346 cm−1.
Chemosensors 11 00190 g003
Scheme 1. Possible modes of adsorption on Ag nanoparticles of FAD, adenine, and ATP.
Chemosensors 11 00190 sch001
Figure 4. The DFT calculations three complexes (AC) of LF combined with Ag atom and the experimental SERS spectrum (D) of LFAg.
Chemosensors 11 00190 g004
Figure 5. (A) The 532-nanometer laser Raman spectra of the FAD mixed with the same concentration of adenine or ATP. (B) The magnified spectra of the yellow dotted line area of spectra A.
Chemosensors 11 00190 g005
Figure 6. The 532-nanometer-laser Raman spectra of adenine (A) and ATP (B) replaced by FAD on Ag nanofilms, respectively, and the 532-nanometer-laser Raman spectra of FAD replaced by adenine (C) and ATP (D) on Ag nanofilms, respectively. The replacement time were marked above the color line.
Chemosensors 11 00190 g006
Figure 7. The 532-nanometer-laser Raman spectra of RF (A), FMN (B), and FAD (C) on Ag nanofilms under pH of 3.0, 4.0, 5.5, and 7.0, respectively.
Chemosensors 11 00190 g007
Figure 8. (A) The 532-nanometer-laser Raman spectra of 10−5, 10−6, 10−7, and 10−8 M FAD on Ag nanofilms; (B) standard curve of intensity of 1626 cm−1 for the concentration of FAD. The regression equation is y = 184.85 + 46,987.06x, R2 = 0.99717.
Chemosensors 11 00190 g008
Disclaimer/Publisher’s Note: The statements, opinions and data contained in all publications are solely those of the individual author(s) and contributor(s) and not of MDPI and/or the editor(s). MDPI and/or the editor(s) disclaim responsibility for any injury to people or property resulting from any ideas, methods, instructions or products referred to in the content.