Article

Novel SAW Temperature Sensor with Pt/Ti/AlN/Mo/AlN/Si Structure for High Temperature Application

1
Department of Precision Instruments, Tsinghua University, Beijing 100084, China
2
Department of Materials Physics and Chemistry, University of Science and Technology Beijing, Beijing 100083, China
3
Qiyuan Laboratory, Beijing 100094, China
4
MEMS Institute of Zibo National High-Tech Industrial Development Zone, Zibo 255000, China
5
State Key Laboratory of Dynamic Measurement Technology, North University of China, Taiyuan 030051, China
6
National Key Laboratory of Science and Technology on Micro/Nano Fabrication, School of Electronics Information and Electrical Engineering, Shanghai Jiao Tong University, 800 Dongchuan Road, Shanghai 200240, China
*
Author to whom correspondence should be addressed.
These authors contributed equally to this work.
Chemosensors 2023, 11(4), 225; https://doi.org/10.3390/chemosensors11040225
Submission received: 8 March 2023 / Revised: 30 March 2023 / Accepted: 4 April 2023 / Published: 6 April 2023
(This article belongs to the Section Materials for Chemical Sensing)

Abstract

:
In this paper, a surface acoustic wave (SAW) temperature sensor with a Pt/Ti/AlN/Mo/AlN/Si structure was prepared, and the high temperature characteristics of the sensors at 20–600 °C under different electrode metallization rates (ղ) were measured. It was found that frequent device mutation occurred in the first high-temperature test, and that the mutation point decreased with the increase in the electrode metallization rate (ղ). In the subsequent test, the data became stable, the sensor’s center frequency increased, the return loss (S11) decreased and the factor of merit (Q) increased. After annealing the same sensors at 600 °C for 30 min, they could achieve performance improvement in the first test, meaning that proper annealing can improve sensor performance. In addition, the annealed SAW sensor was tested in the temperature range of 20–1000 °C, which met the requirement of a temperature range of 20–900 °C, its f–T curve was linear, the factor of merit (Q) was 34.5 and the sensitivity was 46.6 KHz/K.

1. Introduction

Temperature detection, whether in industrial production or daily life, has received great attention. However, in aerospace [1,2], geothermal research [3], turbine engines [4] and other fields, when monitoring super high temperatures, traditional temperature sensors generally require transmission lines and power supplies, such as thermocouples and optical fibers, which lead to cumbersome wiring, interference with working conditions and even accidents, so it is very difficult to implement temperature measurement for high-speed objects or objects in confined spaces [5]. Therefore, passive wireless sensors have irreplaceable advantages. Although infrared temperature measurement, LC resonator temperature measurement and reflective antenna temperature measurement can achieve a passive wireless state, they are limited by factors such as poor anti-electromagnetic interference ability, large size and short wireless transmission distance. SAW stands for acoustic surface waves, which are waves that propagate on the surface or interface of elastomers, and the wave speed is much smaller than that of electromagnetic waves; therefore, they can be used in the development of miniature devices. SAW devices have the advantages of being passive wireless devices [6,7], having strong antiinterference ability, being of a small size, being low-priced, being compatible with the MEMS process and large-scale manufacturing, and being an important means to achieve high temperature measurement in harsh and closed environments [8,9,10]. SAW resonant sensors generally consist of interdigital electrodes (IDTs), reflective barriers, and piezoelectric substrates, which can be piezoelectric films, piezoelectric single crystals, and piezoelectric ceramics. Piezoelectric films are generally grown on substrates such as diamond, sapphire, SiC and Si. Compared to traditional piezoelectric materials such as quartz, lithium niobate (LN), and potassium lanthanum silicate (LGS), AlN has a higher melting point of up to 2000 °C [11], good piezoelectric characteristics below 1150 °C [12], and higher sound velocity (5500 m/s in the a-axis and 11,345 m/s in the c-axis) [13], therefore often being used in the preparation of SAW devices [13,14,15,16]. Additionally, because it has the best piezoelectric properties and the highest sound velocity in the (002) orientation, the preparation of AlN in the (002) orientation is a goal.
Single-crystal Si is a common substrate, and AlN is used as a piezoelectric material; the research of G. F. Iriarte [17] found that the bottom electrode layer affects the growth of AlN films, which in turn affects their electroacoustic performance. HOANG Trang [18] found that adding a Mo bottom electrode layer under the AlN layer could increase the gain of the SAW filter, and experiments showed that its frequency increased, the loss decreased, and the electromechanical coupling coefficient increased. Therefore, in this paper, Mo was selected as the bottom electrode material to promote the growth of AlN in the (002) orientation and improve the electromechanical coupling coefficient of the device [17,18,19,20]. At the same time, the AlN seed layer was added to alleviate the problem of large lattice mismatch between Si and Mo. Of course, it also had another role in helping the AlN piezoelectric layer to grow. Pt has a melting point of 1768 °C, which gives good oxidation resistance and high temperature stability, so Pt was selected as the IDT electrode material, and Ti was added as the adhesion layer to prevent the precious Pt metal from falling off due to poor adhesion with AlN. The SAW temperature sensor with a Pt/Ti/AlN/Mo/AlN/Si structure was prepared, and the AlN grown by this structure had a good (002) orientation. The high-temperature RF test set consisted primarily of a vector network analyzer (E5061B, Keysight) and a high-temperature tube furnace. In the test of the temperature sensitivity characteristics of the sensor, we found that the frequency–temperature relationship (f–T) curve of the sensor after multiple high-temperature tests had higher linearity and a more stable performance than the sample tested once did, its return loss (S11) value became smaller, and the figure of merit Q became larger, which means that the overall performance of the device was significantly improved. This phenomenon is discussed in detail in this article.

2. Design and Simulation

The design of the sensor structure was simulated using the simulation software COMSOL Multiphysics. The main resonant mode of the sensor was designed as a Rayleigh resonant mode, which has two modes: a symmetric mode and antisymmetric mode, as shown in Figure 1a,b. Among them, the eigenfrequencies corresponding to the symmetric mode became the resonant frequency, and the eigenfrequencies corresponding to the opposing modes became the inverse resonant frequency.
It is known that the appropriate bottom electrode layer has a positive effect on the electromechanical coupling coefficient of the device and the growth of the piezoelectric layer as discussed in the Introduction [17,18,19,20], so we first simulated the center frequency of the overall structure of the device to verify the positive effect of the AlN seed layer on the sensor; the two structures were Pt/Ti/AlN/Mo/AlN/Si and Pt/Ti/AlN/Mo/Si. The material data used for the simulation are shown in Table 1 and Table 2, and the simulation results are summarized in Table 3. The resonant frequency of a device with a seed layer is 197.8 MHz, and the center frequency of a device without a seed layer is also 197.8 MHz. Based on the simulation results, firstly, it was believed that the addition of an AlN seed layer would not have a negative impact on the device; secondly, due to the limitations of the simulation, the quality of each layer of film in the simulation was consistent, the real growth of the film would be affected by the substrate’s structure, and the seed layer would generally promote the growth of the specific orientation of the piezoelectric layer, so the Pt/Ti/AlN/Mo/AlN/Si structure was adopted in this article.
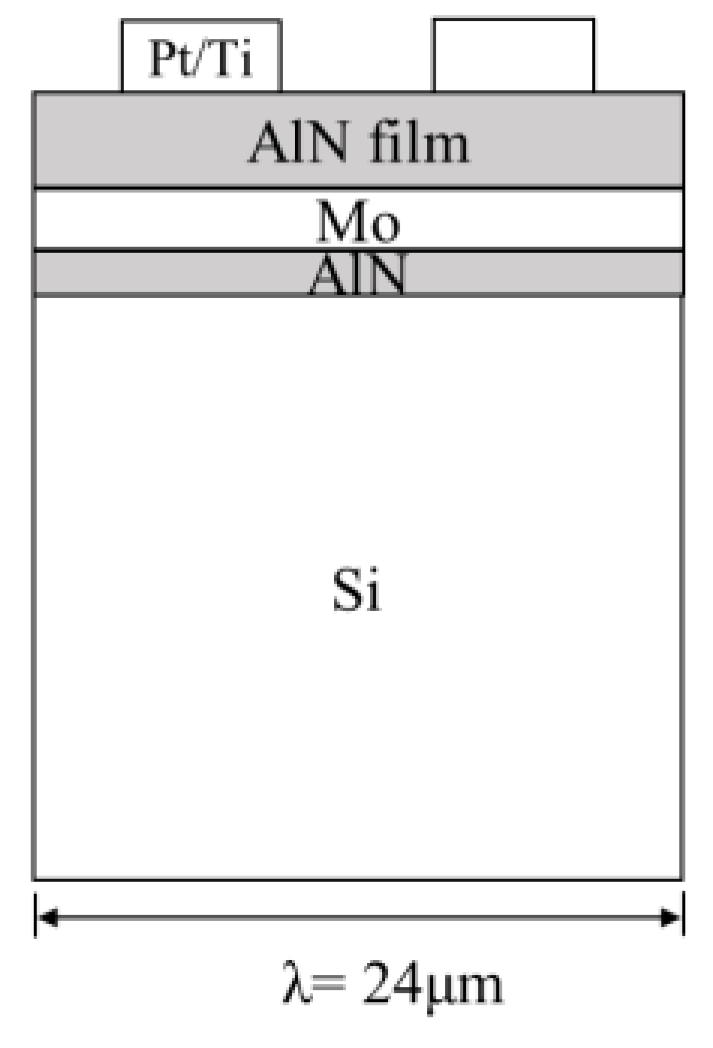
In addition, we simulated the influence of sensor film thickness and electrode structure parameters on a sensor’s performance, and combined the experiences and process conditions cited in the literature to obtain the final sensor structure data. The simulation showed that the resonant frequency decreases with an increase in the thickness of the electrode, but that the stability of a too-thin electrode will be poor at a high temperature, so the electrode thickness was designed to be 200 nm ± 10 nm. According to the experience of the process and the simulation results, it is believed that the film easily crackes when the thickness of the AlN piezoelectric layer is too high, and that the piezoelectric excitation effect is poor when it is too thin, so the AlN design was chosen to be 1 μm. Combined with the experiences and process conditions cited in the literature experience, the wavelength (λ) was designed to be 24 μm, the pore size (W) was 90λ, the number of reflected gate pairs (Nr) and interdigital electrode pairs (Nt) was 100 pairs, and the interdigital spacing (P) was 12 μm. These are summarized in Table 4.
In addition, there were three device structures with different metallization rates (ղ) (Sample 1: ղ = 25%; Sample 2: ղ = 50; and Sample 3: ղ = 67%), and the interdigital electrode widths were 3, 6 and 8 μm, respectively. The electrode metallization rate (ղ) is the ratio of the width of the interdigital electrode strip to its interval in the single-period interdigital space (P).

3. Materials and Methods

AlN films were deposited by the commonly used reactive radio frequency magnetron sputtering method (Sigma fxP, SPTS), RF-250W and a substrate temperature of 200 °C. X-ray diffraction (XRD) was used to analyze the crystal orientation of the deposited AlN thin films, the full width at half of the maximum (FWHM) value reflected its orientation consistency, and the smaller the value, the better the orientation. The deposition of other thin films like Pt/Ti are also by magnetron sputtering deposition. Field emission scanning electron microscopy (SEM) was used to monitor film surface topography, thickness, and facet structure.
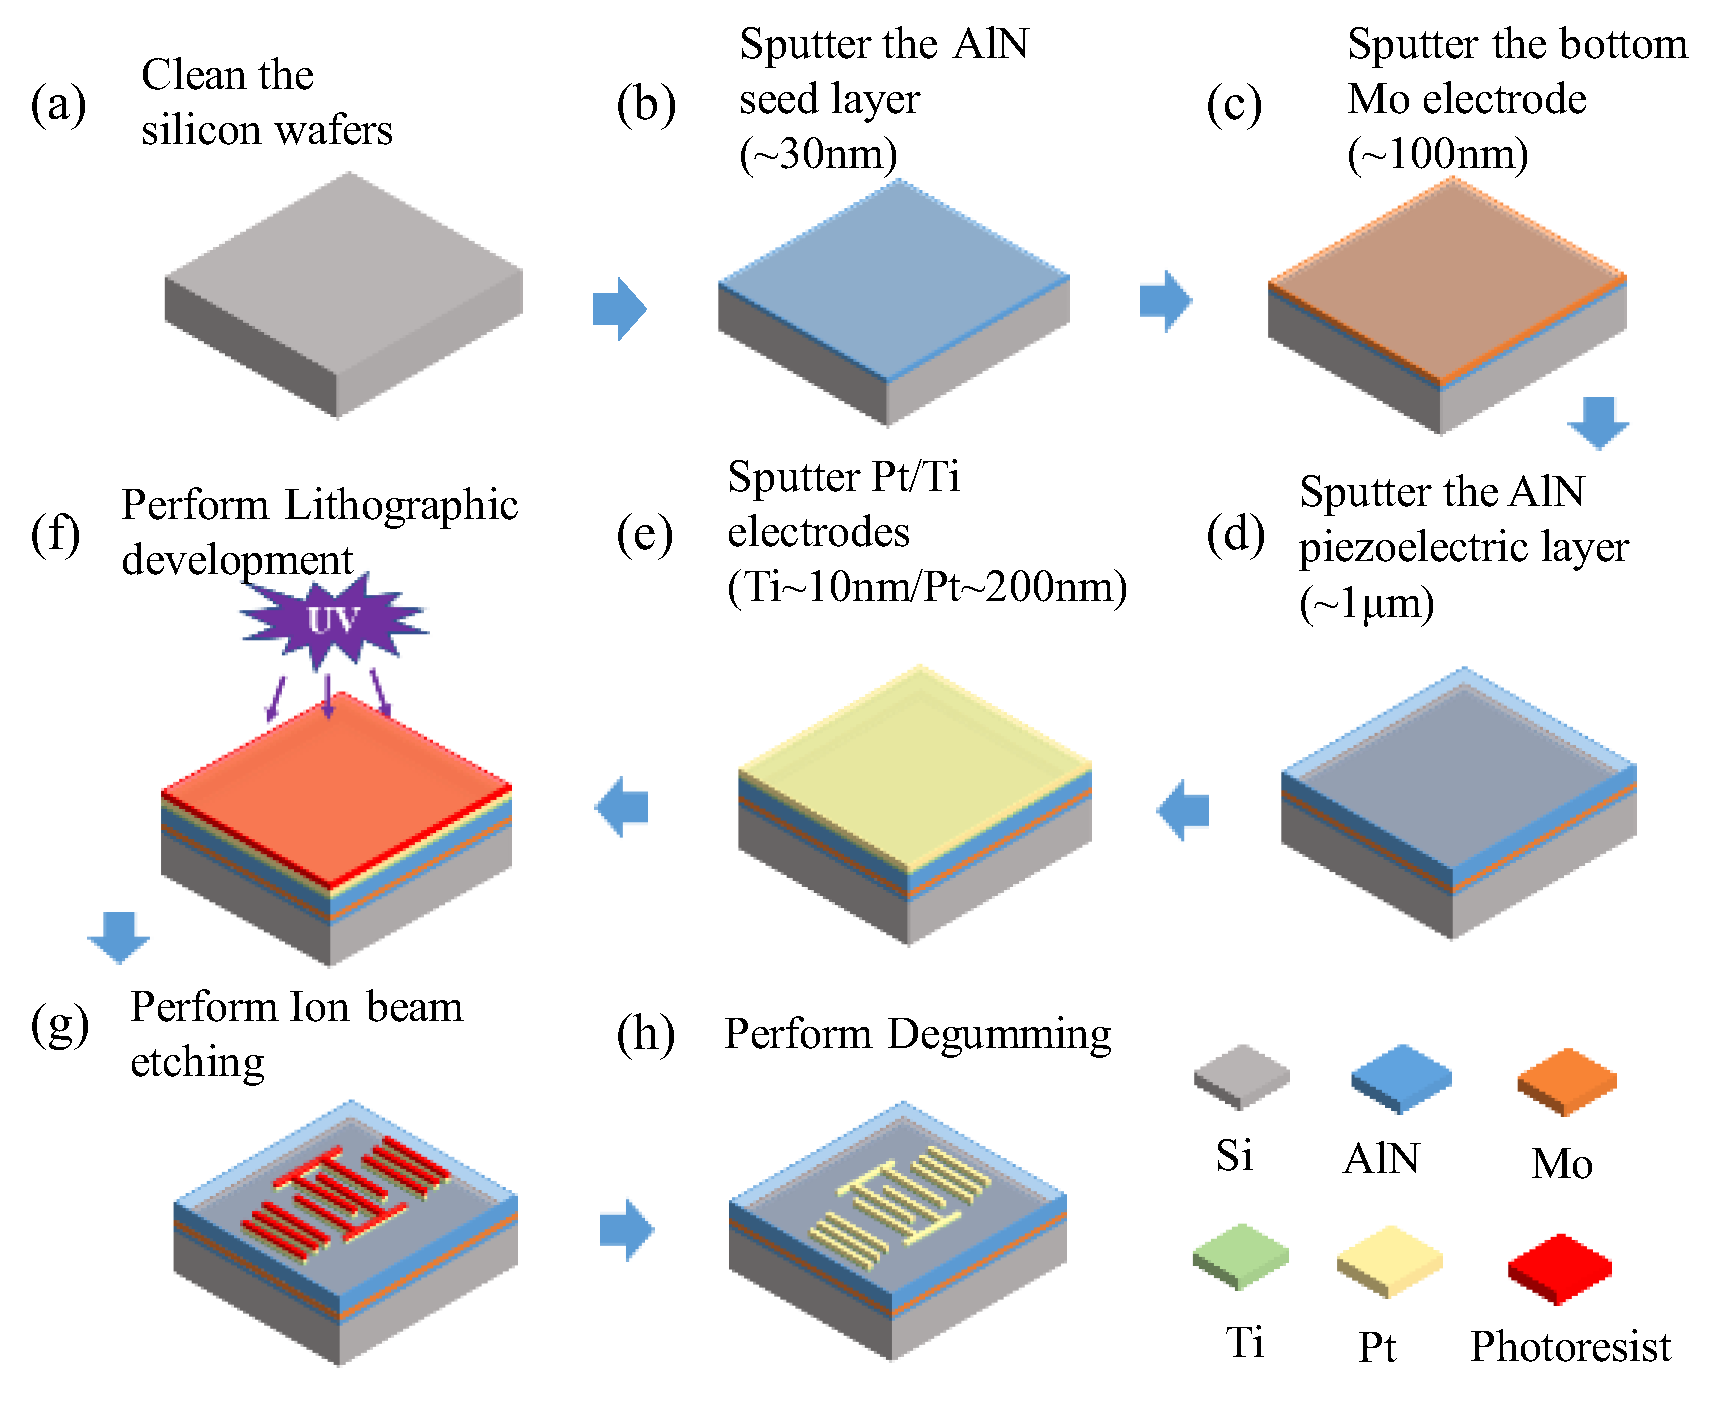
The sensor preparation process firstly involved cleaning the Si sheet, and then magnetron sputtering was performed to grow a 30 nm AlN seed layer, 100 nm Mo bottom electrode layer and 1 μm AlN piezoelectric layer. Sputtering was performed to grow a 10 nm Ti and 200 nm Pt upper electrode layer, and then photolithographic development was performed. Then, through ion beam etching (IBE), Pt/Ti films were etched into the shape of the interdigital electrode, and degumming was finally performed. The specific process steps are shown in Figure 2. The schematic diagram of Pt/Ti/AlN/Mo/AlN/Si SAW sensors is shown in Figure 3.
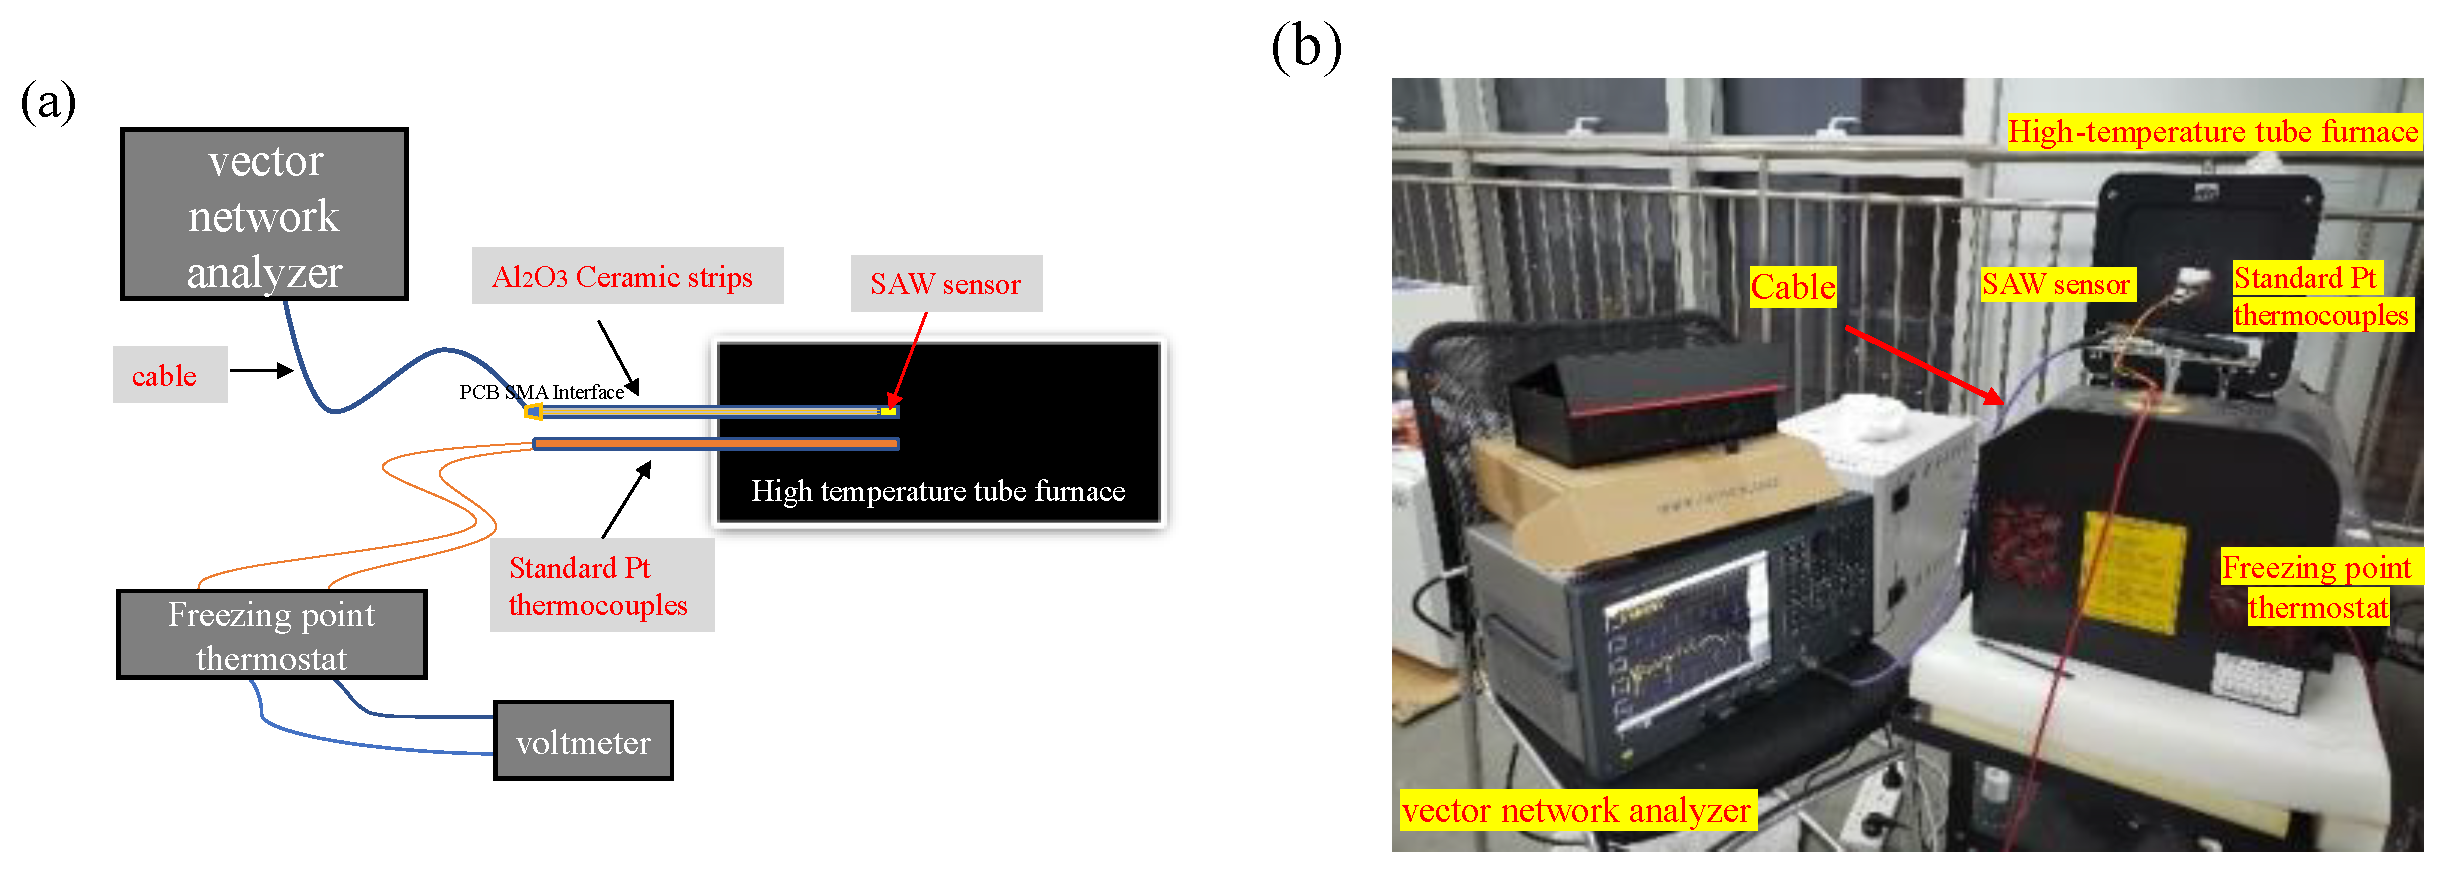
In order to perform the high-temperature test, the sensor was first packaged in a simple high-temperature resistant package: the sensor was glued to a ceramic strip of a length of 60 cm with high-temperature resistant inorganic glue (Ausband A520), the sensor pad and PCB were then connected through wires, and the connection point was bonded with Pt paste. The end with the adhesive sensor was extended by about 50 cm into the high-temperature tube furnace (DTL-600, DTK-01, DEARTO) with a high temperature range and could be heated to 1200 °C. Tubular furnaces have the property of precise temperature control to ensure accurate temperature measurements. We connected the PCB to the vector network analyzer (E5061B, Keysight) through an RF cable, which set the sweep range to be from 30 MHz to 500 MHz; the number of sweep points was 1800, and the intermediate frequency bandwidth was 10 KHz. The vector network analyzer was used to detect the change of S-parameter S11 and frequency in sensors with the temperature, and to obtain the relationship between frequency and temperature (f–T). They had a linear relationship, which is explained in the next formula. The schematic and physical diagrams of the experimental setup are shown in Figure 4a,b, respectively.
The temperature characteristic equation represents the relationship between temperature and frequency in a SAW sensor [21]:
f r = f 0 1 + A T T 0 + B T T 0 2 + C T T 0 3 + Λ
where T0 is the reference temperature, T is the detection temperature, f0 is the resonant frequency corresponding to the reference temperature (T0), and A, B, and C are the first, second, and third order frequency temperature coefficients, respectively. When the piezoelectric material is determined, the temperature coefficients of the second order and later orders are small and negligible.
The relationship between the resonant frequency and the amount of temperature change can be simplified by the resonant frequency expression:
f r = V SAW λ SAW
where λSAW is the SAW wavelength, which is related to the interdigital transducer finger spacing and acoustic reflection grid array, and the size change caused by temperature change is small. VSAW is the SAW velocity, and the change in VSAW relative to the SAW propagation speed is negligible.
d f f = d V SAW V SAW d λ SAW λ SAW d V SAW V SAW
d f f = 1 V SAW V SAW T dT = AdT
where A is the first frequency temperature coefficient. It can also be expressed as TCF, which represents the sensitivity of the temperature sensor. According to the above Equation (4), the temperature of the object to be measured can be obtained through a measurement of the frequency and the f–T relationship. From this formula, we can also find that the change in frequency and temperature is linear, that is, that the f–T curve tends to be linear.
In previous tests, it was found that the frequency of the sample did not change significantly with the temperature before it reached 300 °C, and that there was a good f–T relationship above 300 °C. Therefore, in the following test, in order to ensure the accuracy of the experiment, when testing the sensor at high temperatures, data was collected every 20 K below 300 °C and every 50 K above 300 °C by a network analyzer.

4. Results and Discussion

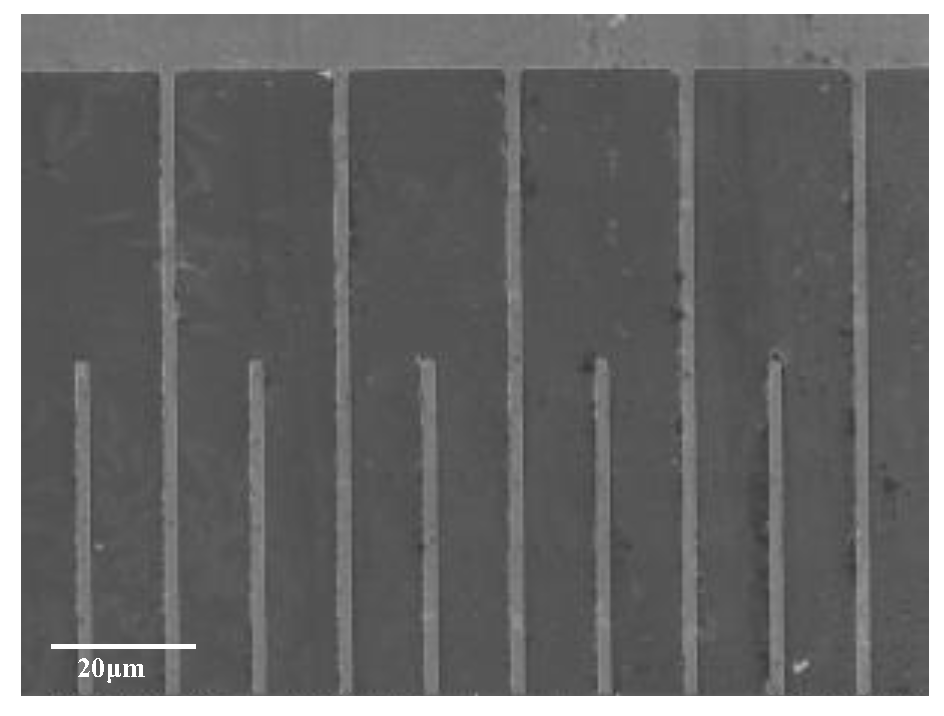
The XRD test found that the AlN in the AlN/Mo/AlN/Si structure had a (002) orientation at about 36.1° and a full width at the half maxumym (FWHM) of 0.21°, showing a higher C-axis orientation. SEM was performed on a cross-sectional plane, showing a columnar structure, validating the results of the XRD test as shown in Figure 5. The results show that the AlN/Mo/AlN/Si structure grew a good C-axis AlN piezoelectric film. The cross-finger electrode morphology of the vegetation was observed by SEM, and the electrode morphology was good, as shown in Figure 6.
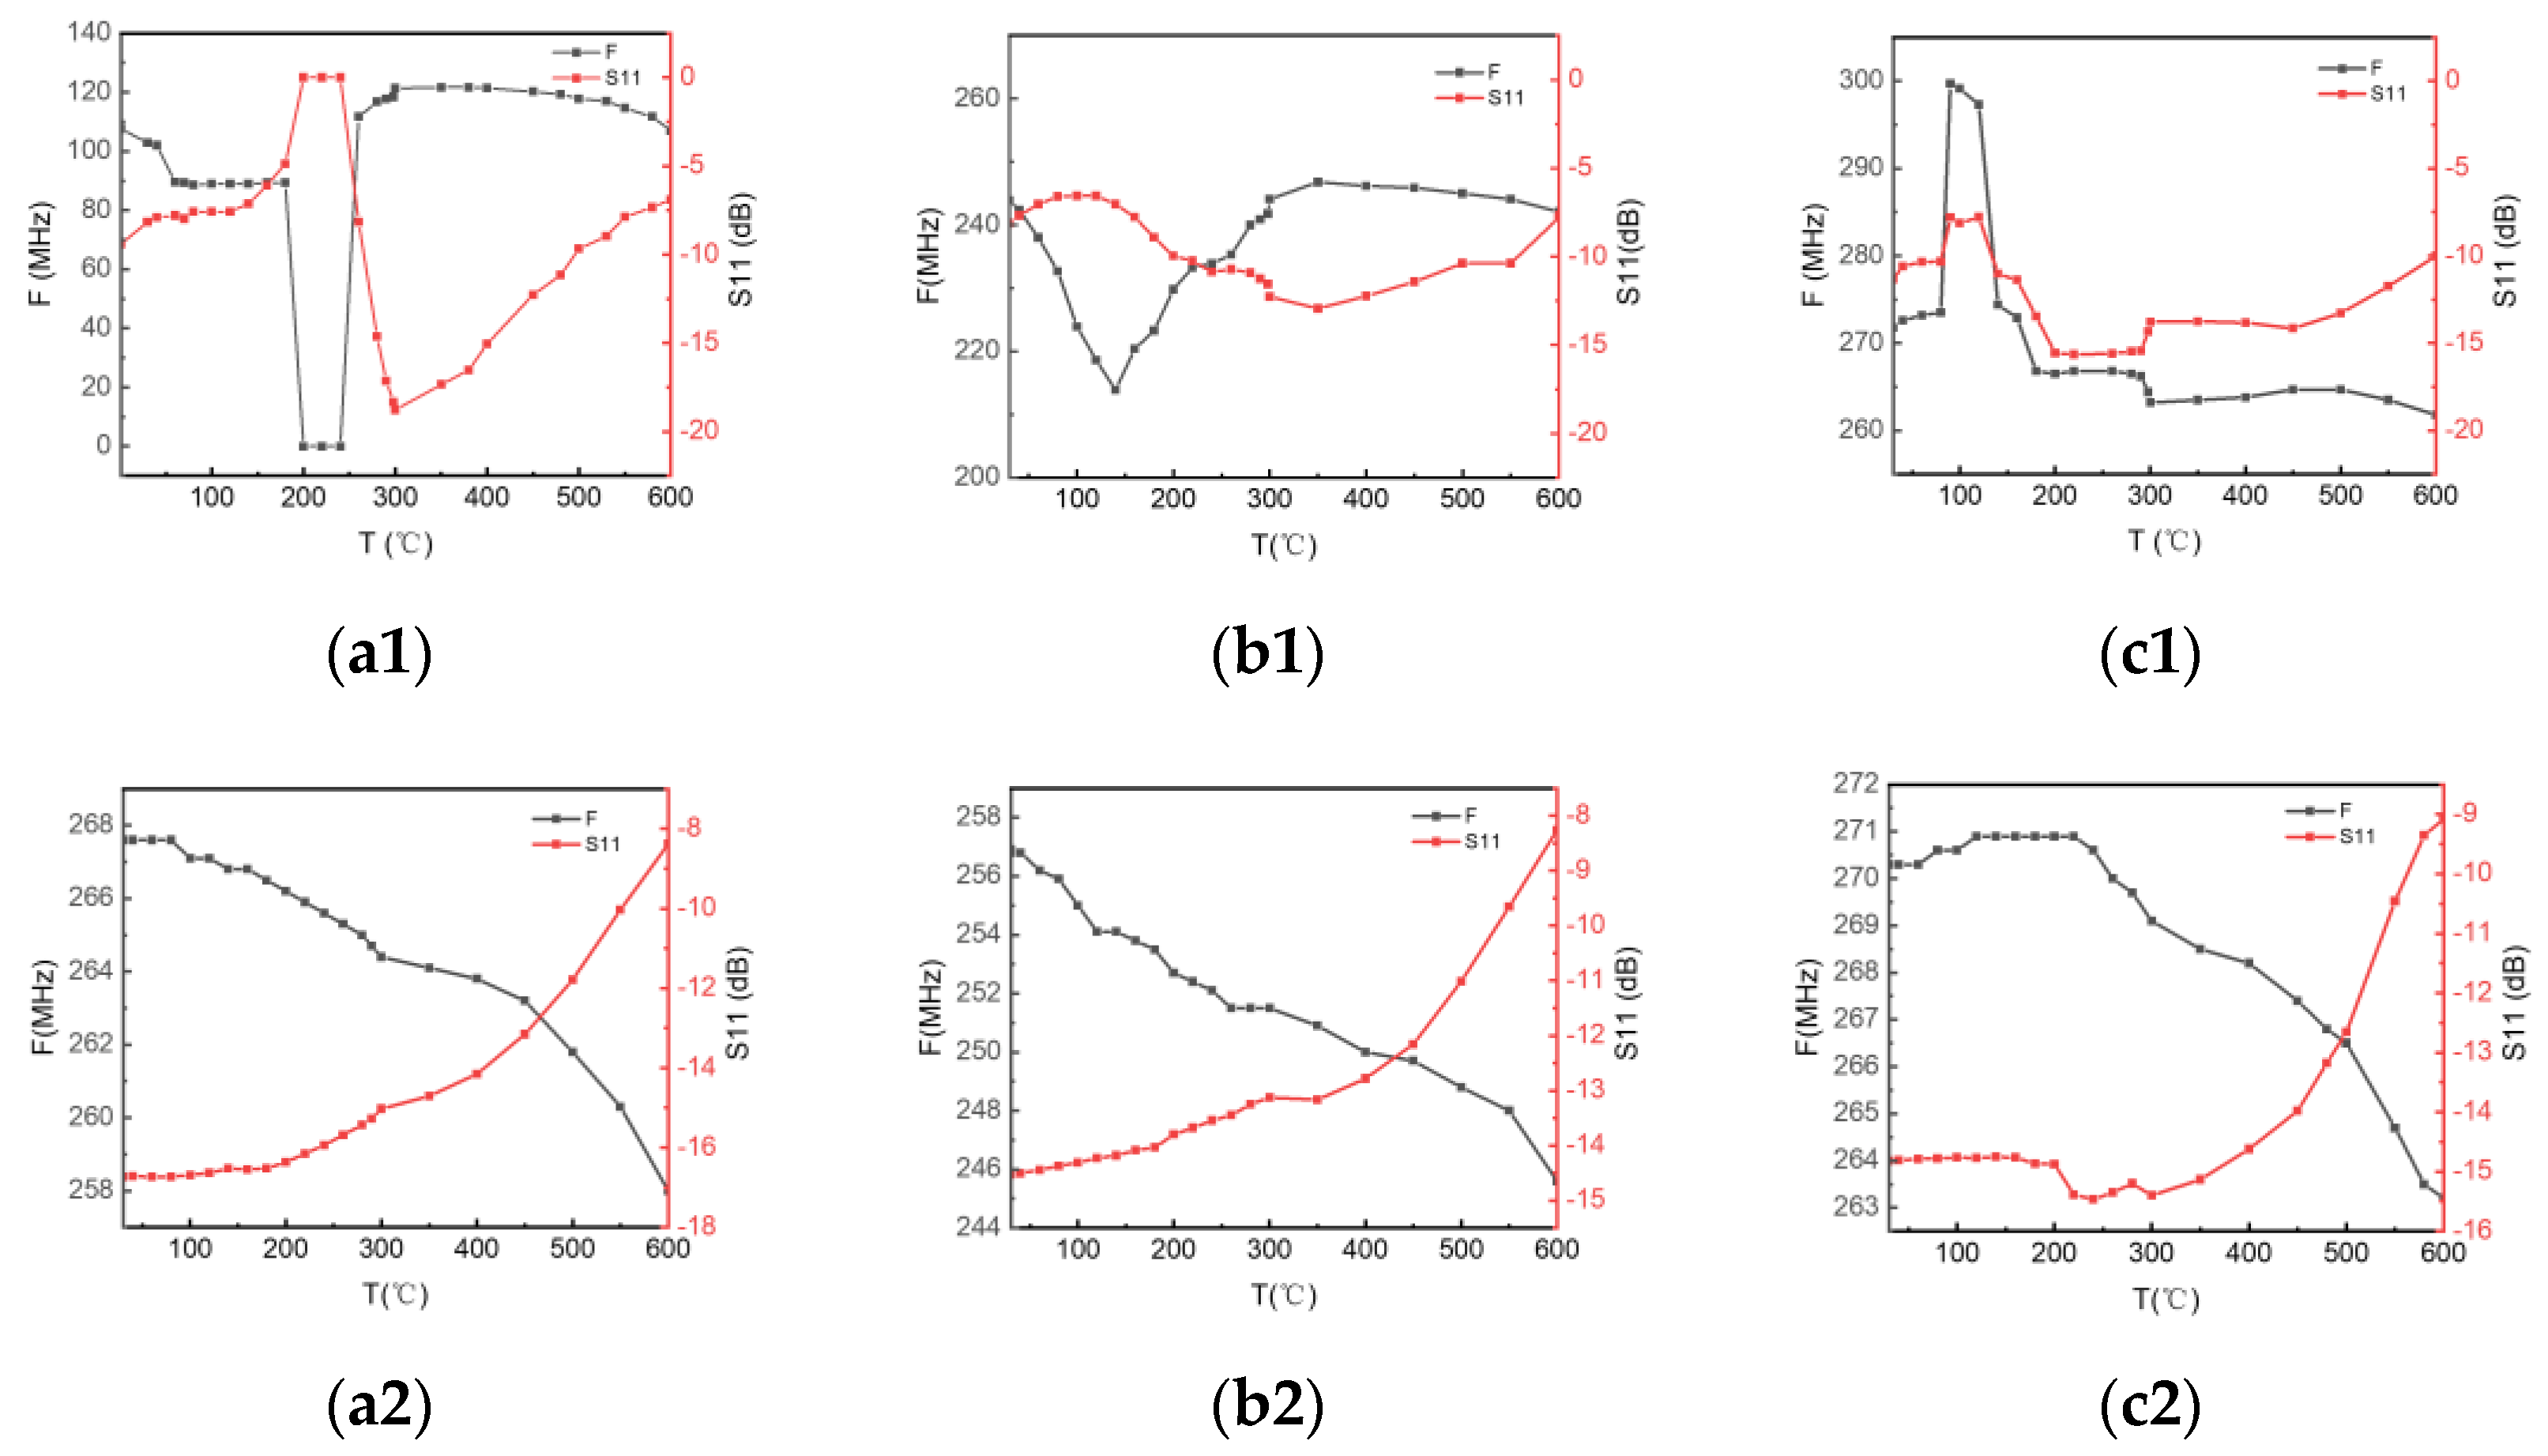
The high-temperature test was carried out in the temperature range of 20–600 °C, and Samples 1, 2 and 3 were tested multiple times; we found that the first test result was very different from the result of the second test, and that the data became stable after multiple tests. Figure 7 shows the temperature–frequency–S11 relationship (T–f–S11) between Samples 1, 2, and 3. Figure 7(a1,b1,c1) shows the results obtained after the first high-temperature test; Figure 7(a2,b2,c2) shows the data that became stable after multiple tests; Figure 7(a3,b3,c3) shows the comparison of the twice-recorded test results of Samples 1, 2 and 3 at 300 °C, respectively.

4.1. Analysis of the First Temperature Test

Observing Figure 7(a1,b1,c1), it can be seen that as the temperature increases, the frequency change is unstable or even unchanged, and a large change occurs at a certain temperature point, called the “mutation point”. In Sample 1 (ղ = 25%), the point is T = 200 °C; in Sample 2 (ղ = 50%), the point is T = 140 °C; and in Sample 3 (ղ = 67%), the point is T = 100 °C. It can be found that the higher the metallization rate, the smaller the temperature point at which the mutation occurs. At the same time, we can also find that the T-S11 curve has a “maximum loss point”. In Sample 1 (ղ = 25%), the point is T = 200 °C; in Sample 2 (ղ = 50%), the point is T = 120 °C; and in Sample 3 (ղ = 67%), the point is T = 100 °C. Additionally, the higher the metallization rate is, the sooner the “maximum loss point” appears.
As can be seen from Equation (2), there are two factors that affect the change in the frequency of the sensor, which are the piezoelectric film and metal electrode. On the other hand, the propagation of surface acoustic waves is also largely influenced by these two factors. Generally, as can be seen from Equations (3)–(5), the influence of the electrode is very small, and the frequency and temperature relationship is linear. However, it is clear that the f–T curve in Figure 7(a1,b1,c1) does not have a linear relationship, and that the change in the “mutation point” is related to the metallization rate, which indicates that the electrode has a greater influence at this time. Changes in the T–S11 curve can also prove this. We consider the maximum point of S11 to be the maximum point of the thermal loss of electrode resistance. In terms of the influence of the metallization rate, electrode loading effects are also known to affect device performance [22], and the coverage of interdigital electrodes on piezoelectric thin films and their boundaries also affects SAW propagation.

4.2. Analysis after Multiple Temperature Tests

Observing the data after multiple tests, as shown in Figure 7(a2,b2,c2), it can be seen that the f–T curves have a better linear relationship than those in Figure 7(a1,b1,c1). Additionally, as the temperature increases, the frequency decreases. It can be seen from Equation (5) that in the case of stable performance of the piezoelectric film, the increase in temperature will lead to a decrease in the velocity on the AlN film, and because of Equation (2), when the wavelength is fixed, the frequency is positively correlated with the velocity, so the frequency is negatively correlated with the temperature. At the same time, the return loss (S11) increases with increasing temperature, which means that as the temperature increases, the performance of the device decreases.
Δ V R V R 0 = k m Δ m m 0 + k s Δ s s 0 k τ Δ T T 0 +
where VR0 is the reference velocity, m0 is the reference mass density, T0 is the reference temperature, and km, ks, and kτ are the corresponding correlation coefficients.
Comparing (a2), (b2) and (c2) in Figure 7, it can be seen that the slopes of the f–T curves are different, that is, the sensitivity (ΔfT) is different, and the calculation shows that the sensitivity of Sample 1 is 14.77 KHz/K, the sensitivity of Sample 2 is 17.27 KHz/K, and the sensitivity of Sample 3 is 12.34 KHz/K. These are summarized in Table 5. The comparison shows that Sample 2 (when ղ = 50%) has the highest temperature sensitivity, which means that when ղ = 50%, the interdigital electrode is a uniform IDT, and that it has the greatest promotion effect on the propagation of the acoustic surface and the electromechanical coupling ability of the device.
Carefully observing the slope of the f–T curves, we find that with 300 °C as a turning point, the slope of the f–T curve changes slightly below and above 300 °C. Additionally, it can be seen that the slope of the T–S11 curve also has 300 °C as a turning point; especially, the slope increases significantly after 300 °C, which means that the loss rate of the device becomes larger and the sensor performance decreases faster.

4.3. Comparison of the First Test and Multiple Tests

Comparing the data of T = 300 °C after the first test with the multiple tests performed, as shown in (a3), (b3) and (c3) in Figure 7, it is clear that the S11 curve of the multiple tests in (b3) and (c3) has a higher frequency and lower return loss. However, (a3) is anomalous, and it is easy to see that the resonant frequency in the first test is very different from that after multiple tests. As reported in the literature [23], when the velocity of the substrate is higher than that of the piezoelectric film, multiple modes of SAW can exist in the same SAW resonator at the same time. Additionally, because we designed the AlN seed layer, we think that the peak that appeared in the first test may not have been a Rayleigh mode excited by the AlN piezoelectric layer, but the wave of other modes excited by the AlN seed layer. Therefore, the frequency change between the first test and the multiple tests performed after is very large, which may have been due to the instability of the AlN piezoelectric layer film, or because of its special IDT structure (ղ = 25%), but more detailed content needs to be further investigated
Additionally, the Q value of the sample that had undergone multiple tests was calculated by the figure of merit (Q) calculation shown in Equation (6).
Q = f r Δ f , 3 d B
where fr is center frequency, and Δf,3dB is the 3 dB bandwidth of the sensor. The figure of merit (Q) refers to the energy utilization of the device, which represents the relationship between stored energy and consumed energy, and can also be expressed by the resonant frequency and 3 dB bandwidth in Equation (5). It is known by the calculations that were performed that the Q value of Sample 1 is 34.8, the Q value of Sample 2 is 19.8 and the Q value of Sample 3 is 25.5. These are summarized in Table 5. The comparison shows that Sample 1 (when ղ = 25%) has the largest figure of merit (Q). We think this has to do with its minimal metallization rate.
Comparing Figure 7(a1,b1,c1) with Figure 7(a2,b2,c2), the curve of the latter has higher linearity and stronger regularity, indicating that the temperature measurement performance of the SAW sensor was better and that the stability was higher after multiple tests. We believe that this is mainly due to internal stresses, poor crystallinity or defects in the film, which can be eliminated by annealing [24,25,26].

4.4. Comparison before and after Annealing

To validate our hypothesis, the above three samples were annealed to compare device performance before and after annealing. Since the previously tested samples were tested at temperatures of up to 600 °C, the samples were annealed at 600 °C for 30 min. The annealed samples were also subjected to high-temperature tests at 20–600 °C. Figure 8 shows the f–T relationship before and after annealing, and it can be found that the frequency of the annealed sample is significantly higher than that of the unannealed sample, and that its f–T relationship is also more stable and linear. In particular, the annealed samples performed very well in the first high-temperature test. This means that proper annealing can indeed improve the performance of the device.

4.5. High-Temperature Test of Annealed Sensor

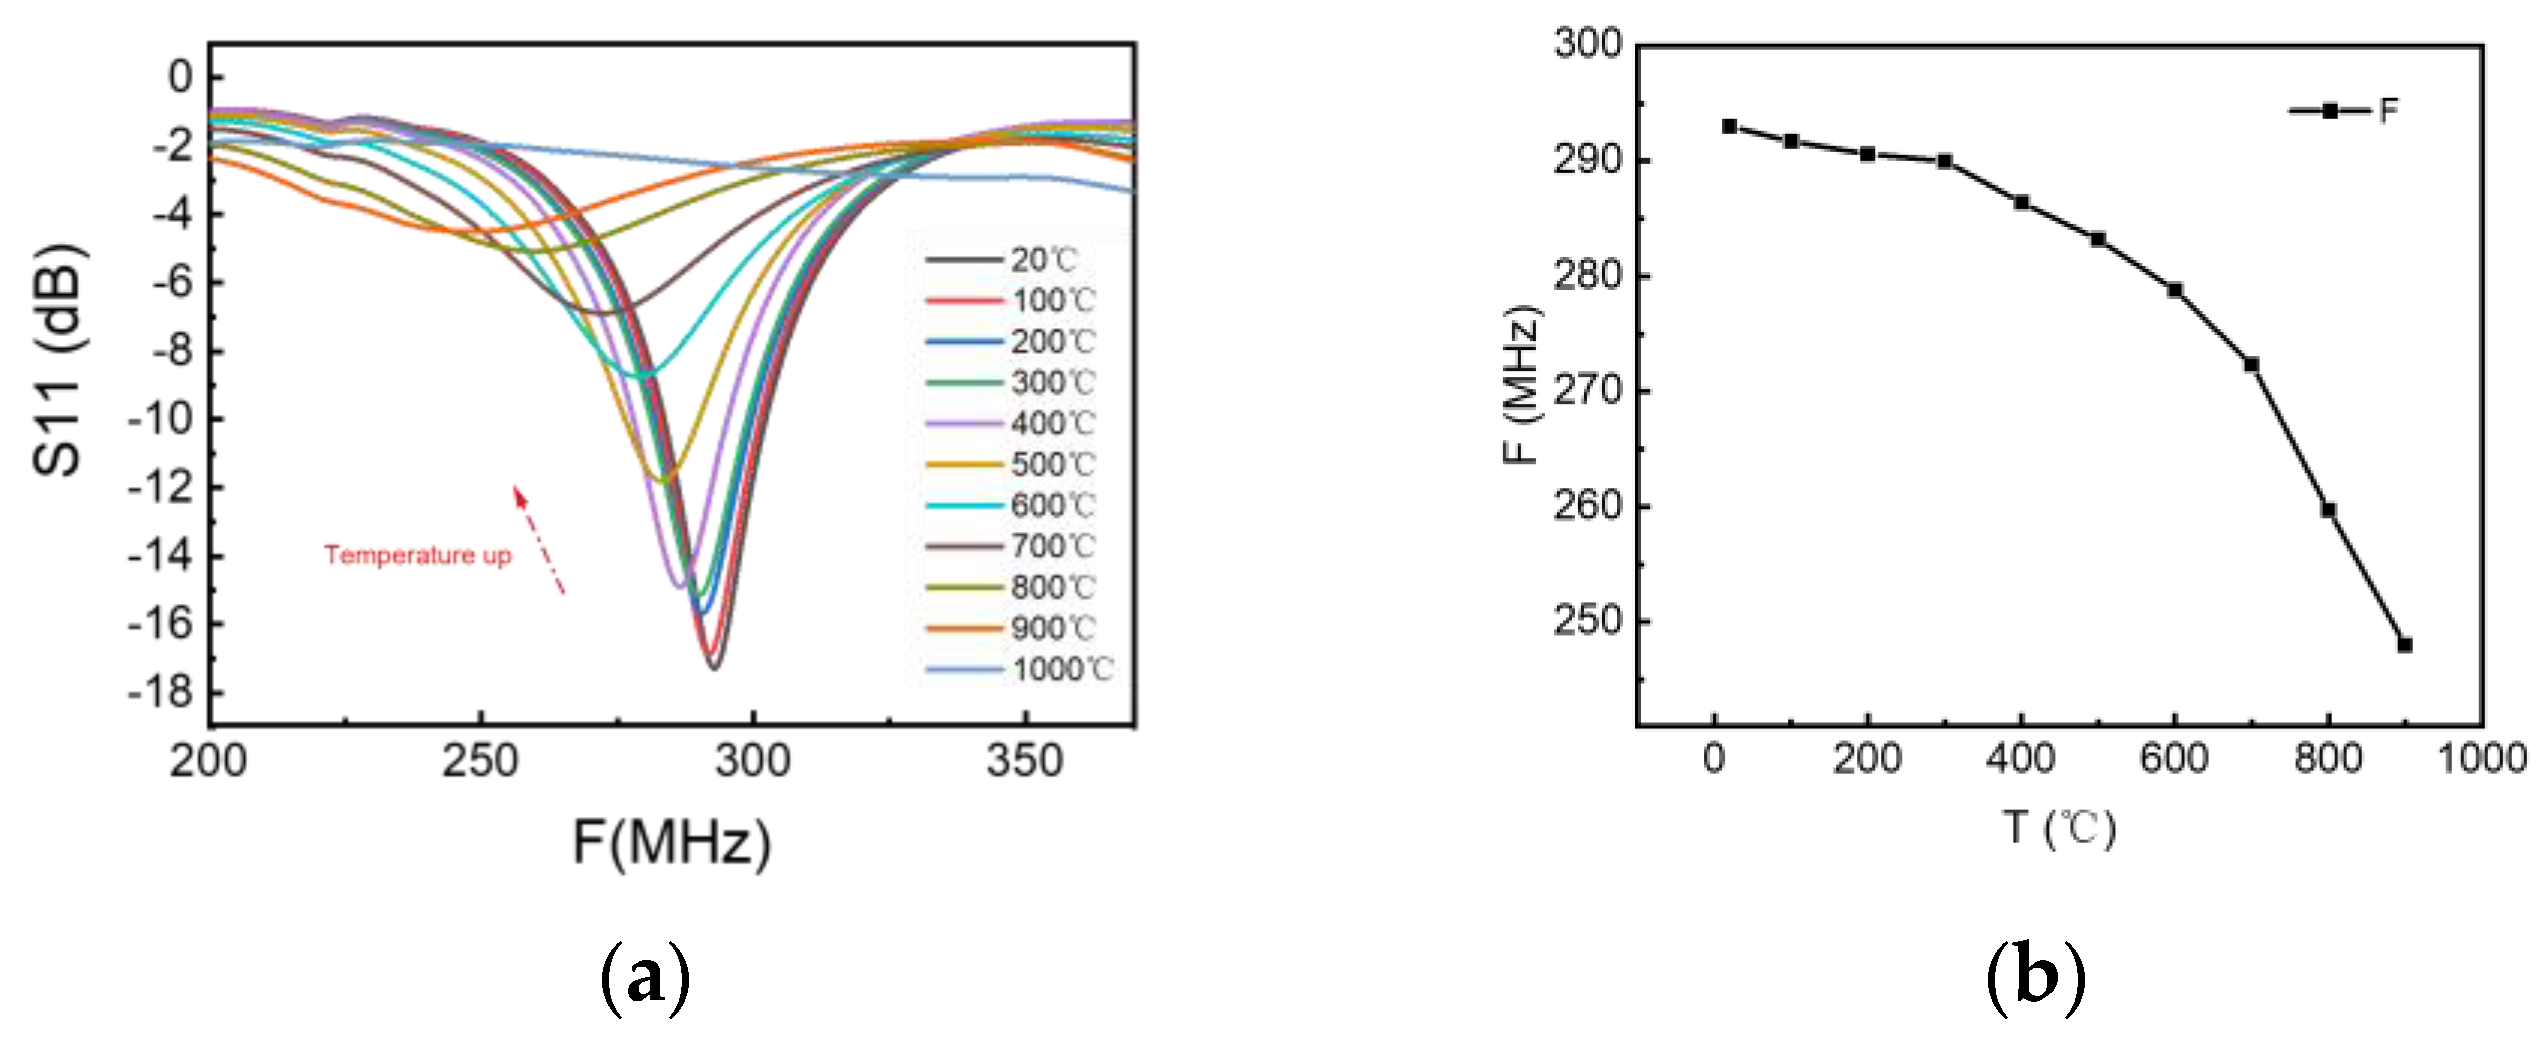
Since the annealed sample exhibited relatively stable temperature sensitivity characteristics in the first test, we believed that it had great potential to perform well tests with a wider temperature range. Therefore, we carried out a high-temperature test at 20–1000 °C on the sensor annealed for 30 min at 600 °C to explore the maximum temperature measurement range of a Pt/Ti/AlN/Mo/AlN/Si-structured SAW temperature sensor. Using the vector network analyzer to obtain a stable S11 curve, Figure 9 shows the S11 curve (a) and f–T relationship (b) of Sample 1, from which it can be seen that the device has a significant peak at 20–900 °C. However, the peak disappears at 1000 °C, indicating device failure. It can be seen that the sample can perform temperature measurement from 20 °C to 900 °C; its figure of merit (Q) is calculated to be 34.5, and the sensitivity is calculated to be 46.6 KHz/K.
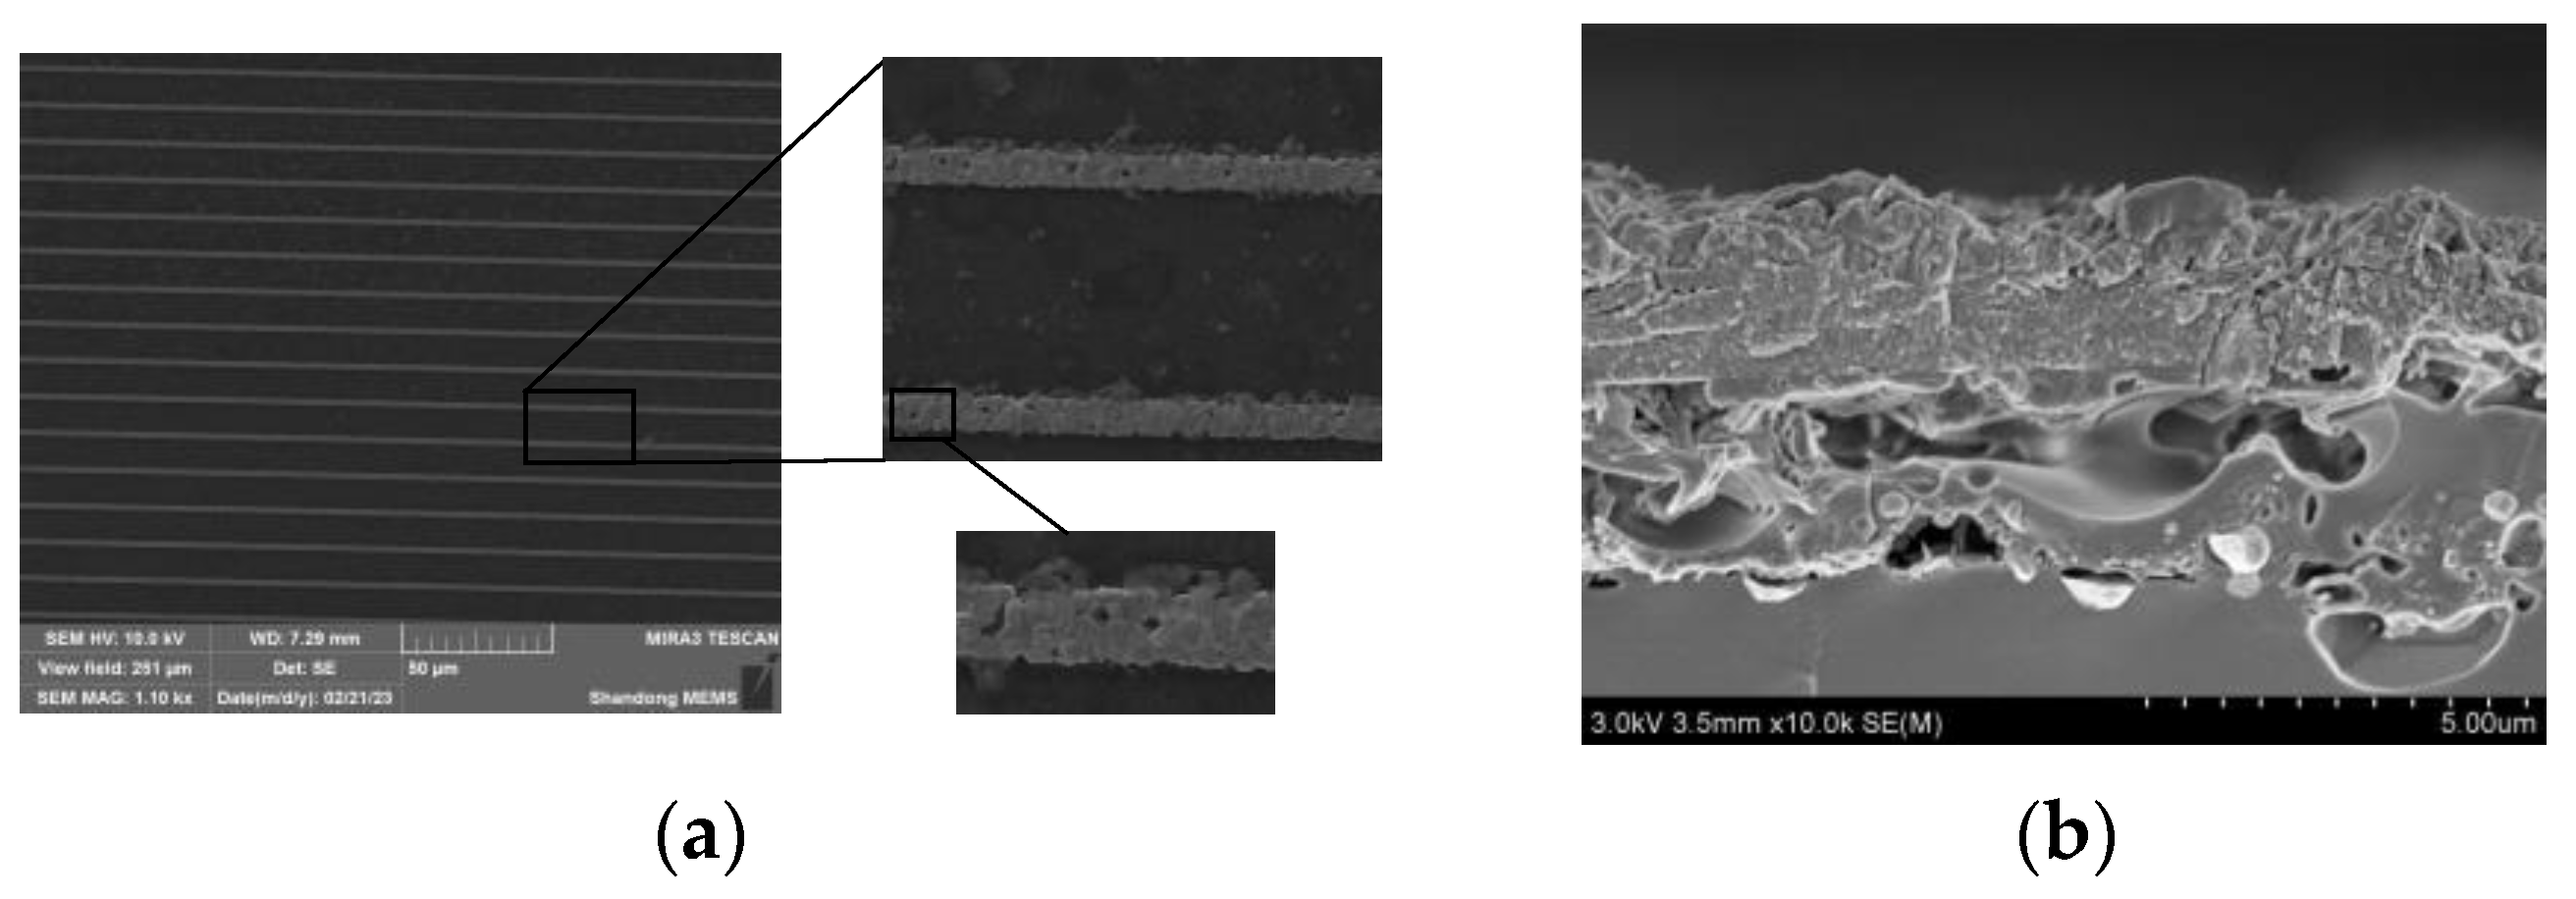
Figure 10a shows the Pt electrode that failed after the 20–1000 °C test, which has large particles and cavities caused by Pt recrystallization and agglomeration at high temperatures [27]. Figure 10b shows the cross-sectional view of the device, and that the multilayer film structure of AlN/Mo/AlN/Si underwent oxidative deformation at a high temperature. The morphology of the AlN layer changed greatly, as reported in the literature [28], and the AlN exposed to air began to oxidize at 800–900 °C, the rate of which abruptly increased at 1000 °C. Moreover, since the coefficient of thermal expansion of AlN (4.5 × 10⁻⁶/K) is different from that of Mo (5.35 × 10⁻⁶/K), this mismatch played a driving role, so that the contact surface of the two had a large split layer after high-temperature oxidation and cooling. This proves that the sensor’s structure fails at high temperatures and also explains why it has no peak at 1000 °C.

5. Conclusions

In conclusion, after XRD and SEM characterization, it was found that the AlN piezoelectric layer grown by the AlN/Mo/AlN/Si structure had a good (002) orientation. Through high-temperature RF test experiments, it was found that the frequency and temperature curves of devices prepared with a Pt/Ti/AlN/Mo/AlN/Si structure produce mutation points due to the unstable properties of films and electrode deformation before annealing. The value of the mutation point is related to the size of the electrode. After annealing at 600 °C for 30 min, the center frequency of the device increased and S11 decreased. The annealed device had a good linear f–T curve under the high-temperature test conducted at temperatures from 20 °C to 900 °C, but at the same time, the device electrode was partially damaged at high temperatures, and the AlN was oxidized and split the contact surface due to its mismatch with Mo’s coefficient of thermal expansion. The replacement of the bottom electrode material and the addition of a protective layer to the upper electrode are considered viable steps to improve the performance of the device.

Author Contributions

Conceptualization, Y.R., Y.W., H.D., C.Z. and J.T.; data curation, Y.C. (Yang Chen), M.S. and Y.C. (Yiyang Chen); formal analysis, Y.C. (Yang Chen), Y.W. and H.D.; funding acquisition, Y.R., Y.W. and M.S.; investigation, Y.C. (Yang Chen), Y.D., Y.C. (Yiyang Chen) and J.T.; methodology, Y.C. (Yang Chen), Y.W., M.S., Z.S., C.Z. and J.T.; project administration, Y.R. and Y.W.; resources, Y.R., M.S., Y.D., Z.S., H.D. and C.Z.; software, Y.D. and Y.C. (Yiyang Chen); supervision, Y.R., Z.S. and J.T.; validation, Y.C. (Yang Chen); writing—original draft, Y.C. (Yang Chen); Writing—review and editing, Y.R. and Y.W. All authors have read and agreed to the published version of the manuscript.

Funding

This research was funded by The National Key Research and Development Program of China, 2020YFB2009103.

Institutional Review Board Statement

Not applicable.

Informed Consent Statement

Not applicable.

Data Availability Statement

Not applicable.

Acknowledgments

The authors acknowledge the MEMS Institute of Zibo National High-Tech Industrial Development Zone for providing technical support.

Conflicts of Interest

The authors declare no conflict of interest.

References

  1. Korashy, A.; Attia, H.; Thomson, V.; Oskooei, S. Characterization of fretting wear of cobalt-based superalloys at high temperature for aero-engine combustor components. Wear 2015, 330–331, 327–337. [Google Scholar] [CrossRef]
  2. Jurgens, R.F. High-Temperature Electronics Applications in Space Exploration. IEEE Trans. Ind. Electron. 1982, IE-29, 107–111. [Google Scholar] [CrossRef] [Green Version]
  3. Schmitt, A.K.; Hulen, J.B. Buried rhyolites within the active, high-temperature Salton Sea geothermal system. J. Volcanol. Geotherm. Res. 2008, 178, 708–718. [Google Scholar] [CrossRef]
  4. Fonseca, M.A.; English, J.M.; Arx, M.v.; Allen, M.G. Wireless micromachined ceramic pressure sensor for high-temperature applications. J. Microelectromech. Syst. 2002, 11, 337–343. [Google Scholar] [CrossRef] [Green Version]
  5. Mrosk, J.W.; Berger, L.; Ettl, C.; Fecht, H.J.; Fischerauer, G.; Dommann, A. Materials issues of SAW sensors for high-temperature applications. IEEE Trans. Ind. Electron. 2001, 48, 258–264. [Google Scholar] [CrossRef]
  6. Kang, A.; Zhang, C.; Ji, X.; Han, T.; Li, R.; Li, X. SAW-RFID enabled temperature sensor. Sens. Actuators A Phys. 2013, 201, 105–113. [Google Scholar] [CrossRef]
  7. Fachberger, R.; Bruckner, G.; Knoll, G.; Hauser, R.; Biniasch, J.; Reindl, L. Applicability of LiNbO/sub3/, langasite and GaPO/sub4/ in high temperature SAW sensors operating at radio frequencies. IEEE Trans. Ultrason. Ferroelectr. Freq. Control 2004, 51, 1427–1431. [Google Scholar] [CrossRef]
  8. Shu, L.; Peng, B.; Yang, Z.; Wang, R.; Deng, S.; Liu, X. High-Temperature SAW Wireless Strain Sensor with Langasite. Sensors 2015, 15, 28531–28542. [Google Scholar] [CrossRef] [Green Version]
  9. Rodríguez-Madrid, J.G.; Iriarte, G.F.; Williams, O.A.; Calle, F. High precision pressure sensors based on SAW devices in the GHz range. Sens. Actuators A Phys. 2013, 189, 364–369. [Google Scholar] [CrossRef] [Green Version]
  10. Martin, L.C.; Wrbanek, J.D.; Fralick, G.C. Thin film sensors for surface measurements [in aerospace simulation facilities]. In Proceedings of the ICIASF 2001 Record, 19th International Congress on Instrumentation in Aerospace Simulation Facilities (Cat. No.01CH37215), Cleveland, OH, USA, 27–30 August 2001; pp. 196–203. [Google Scholar] [CrossRef]
  11. Kim, T.; Kim, J.; Dalmau, R.; Schlesser, R.; Preble, E.; Jiang, X. High-temperature electromechanical characterization of AlN single crystals. IEEE Trans. Ultrason. Ferroelectr. Freq. Control 2015, 62, 1880–1887. [Google Scholar] [CrossRef]
  12. Turner, R.C.; Fuierer, P.A.; Newnham, R.E.; Shrout, T.R. Materials for high temperature acoustic and vibration sensors: A review. Appl. Acoust. 1994, 41, 299–324. [Google Scholar] [CrossRef]
  13. Lin, C.-M.; Chen, Y.-Y.; Felmetsger, V.V.; Lien, W.-C.; Riekkinen, T.; Senesky, D.G.; Pisano, A.P. Surface acoustic wave devices on AlN/3C–SiC/Si multilayer structures. J. Micromech. Microeng. 2013, 23, 025019. [Google Scholar] [CrossRef]
  14. Wu, S.; Ro, R.; Lin, Z.-X.; Lee, M.-S. Rayleigh surface acoustic wave modes of interdigital transducer/(100) AlN/(111) diamond. J. Appl. Phys. 2008, 104, 064919. [Google Scholar] [CrossRef]
  15. Naumenko, N.; Nicolay, P. AlN/Pt/LN structure for SAW sensors capable of operating at high temperature. Appl. Phys. Lett. 2017, 111, 073507. [Google Scholar] [CrossRef]
  16. Floer, C.; Elmazria, O.; Naumenko, N.; Bartoli, F.; Ghanbaja, J.; Aubert, T.; Hage-Ali, S. AlN/Pt/LN-Y128 Packageless Acoustic Wave Temperature Sensor. IEEE Trans. Ultrason. Ferroelectr. Freq. Control 2021, 68, 2315–2318. [Google Scholar] [CrossRef] [PubMed]
  17. Iriarte, G.F.; Bjurstrom, J.; Westlinder, J.; Engelmark, F.; Katardjiev, I.V. Synthesis of c-axis-oriented AlN thin films on high-conducting layers: Al, Mo, Ti, TiN, and Ni. IEEE Trans. Ultrason. Ferroelectr. Freq. Control 2005, 52, 1170–1174. [Google Scholar] [CrossRef]
  18. Hoang, T.; Rey, P.; Vaudaine, M.H.; Robert, P.; Benech, P. Effect of Mo layer on performance of AlN/Si SAW filter. In Proceedings of the 2008 IEEE International Frequency Control Symposium, Honolulu, HI, USA, 19–21 May 2008; pp. 615–618. [Google Scholar] [CrossRef]
  19. Li, C.; Liu, X.-Z.; Peng, B.; Shu, L.; Li, Y.-R. AlN-based surface acoustic wave resonators on platinum bottom electrodes for high-temperature sensing applications. Rare Met. 2016, 35, 408–411. [Google Scholar] [CrossRef]
  20. Sung, C.C.; Chiang, Y.F.; Ro, R.; Lee, R.; Wu, S. Effects of conducting layers on surface acoustic wave in AlN films on diamond. J. Appl. Phys. 2009, 106, 124905. [Google Scholar] [CrossRef]
  21. Burgess, J.W.; Hales, M.C. Temperature coefficients of frequency in LiNbO3 and LiTaO3 plate resonators. Proc. Inst. Elect. Eng. 1976, 123, 499–504. [Google Scholar] [CrossRef]
  22. Kan, M.-Q.; Du, J.-K.; He, L.-W. In Analysis on saw device of LiNbO3 film with multi-layered media. In Proceedings of the 2017 Symposium on Piezoelectricity, Acoustic Waves, and Device Applications (SPAWDA), Chengdu, China, 27–30 October 2017; pp. 476–480. [Google Scholar] [CrossRef]
  23. Li, Q.; Qian, L.; Fu, S.; Song, C.; Zen, F.; Pan, F. Characteristics of one-port surface acoustic wave resonator fabricated on ZnO/6H-SiC layered structure. J. Phys. D Appl. Phys. 2018, 51, 145305. [Google Scholar] [CrossRef]
  24. Miyake, H.; Lin, C.-H.; Tokoro, K.; Hiramatsu, K. Preparation of high-quality AlN on sapphire by high-temperature face-to-face annealing. J. Cryst. Growth 2016, 456, 155–159. [Google Scholar] [CrossRef] [Green Version]
  25. Herth, E.; Fall, D.; Rauch, J.-Y.; Mourtalier, V.; Guisbiers, G. Thermal annealing of AlN films for piezoelectric applications. J. Mater. Sci. Mater. Electron. 2020, 31, 4473–4478. [Google Scholar] [CrossRef]
  26. Yoshizawa, R.; Miyake, H.; Hiramatsu, K. Effect of thermal annealing on AlN films grown on sputtered AlN templates by metalorganic vapor phase epitaxy. Jpn. J. Appl. Phys. 2018, 57, 01AD05. [Google Scholar] [CrossRef]
  27. Auberta, T.; Elmazria, O.; Assouar, B.; Bouvot, L.; Oudich, M. Surface acoustic wave devices based on AlN/sapphire structure for high temperature applications. Appl. Phys. Lett. 2010, 96, 203503. [Google Scholar] [CrossRef]
  28. Lee, J.W.; Radu, I.; Alexe, M. Oxidation behavior of AIN substrate at low temperature. J. Mater. Sci. Mater. Electron. 2002, 13, 131–137. [Google Scholar] [CrossRef]
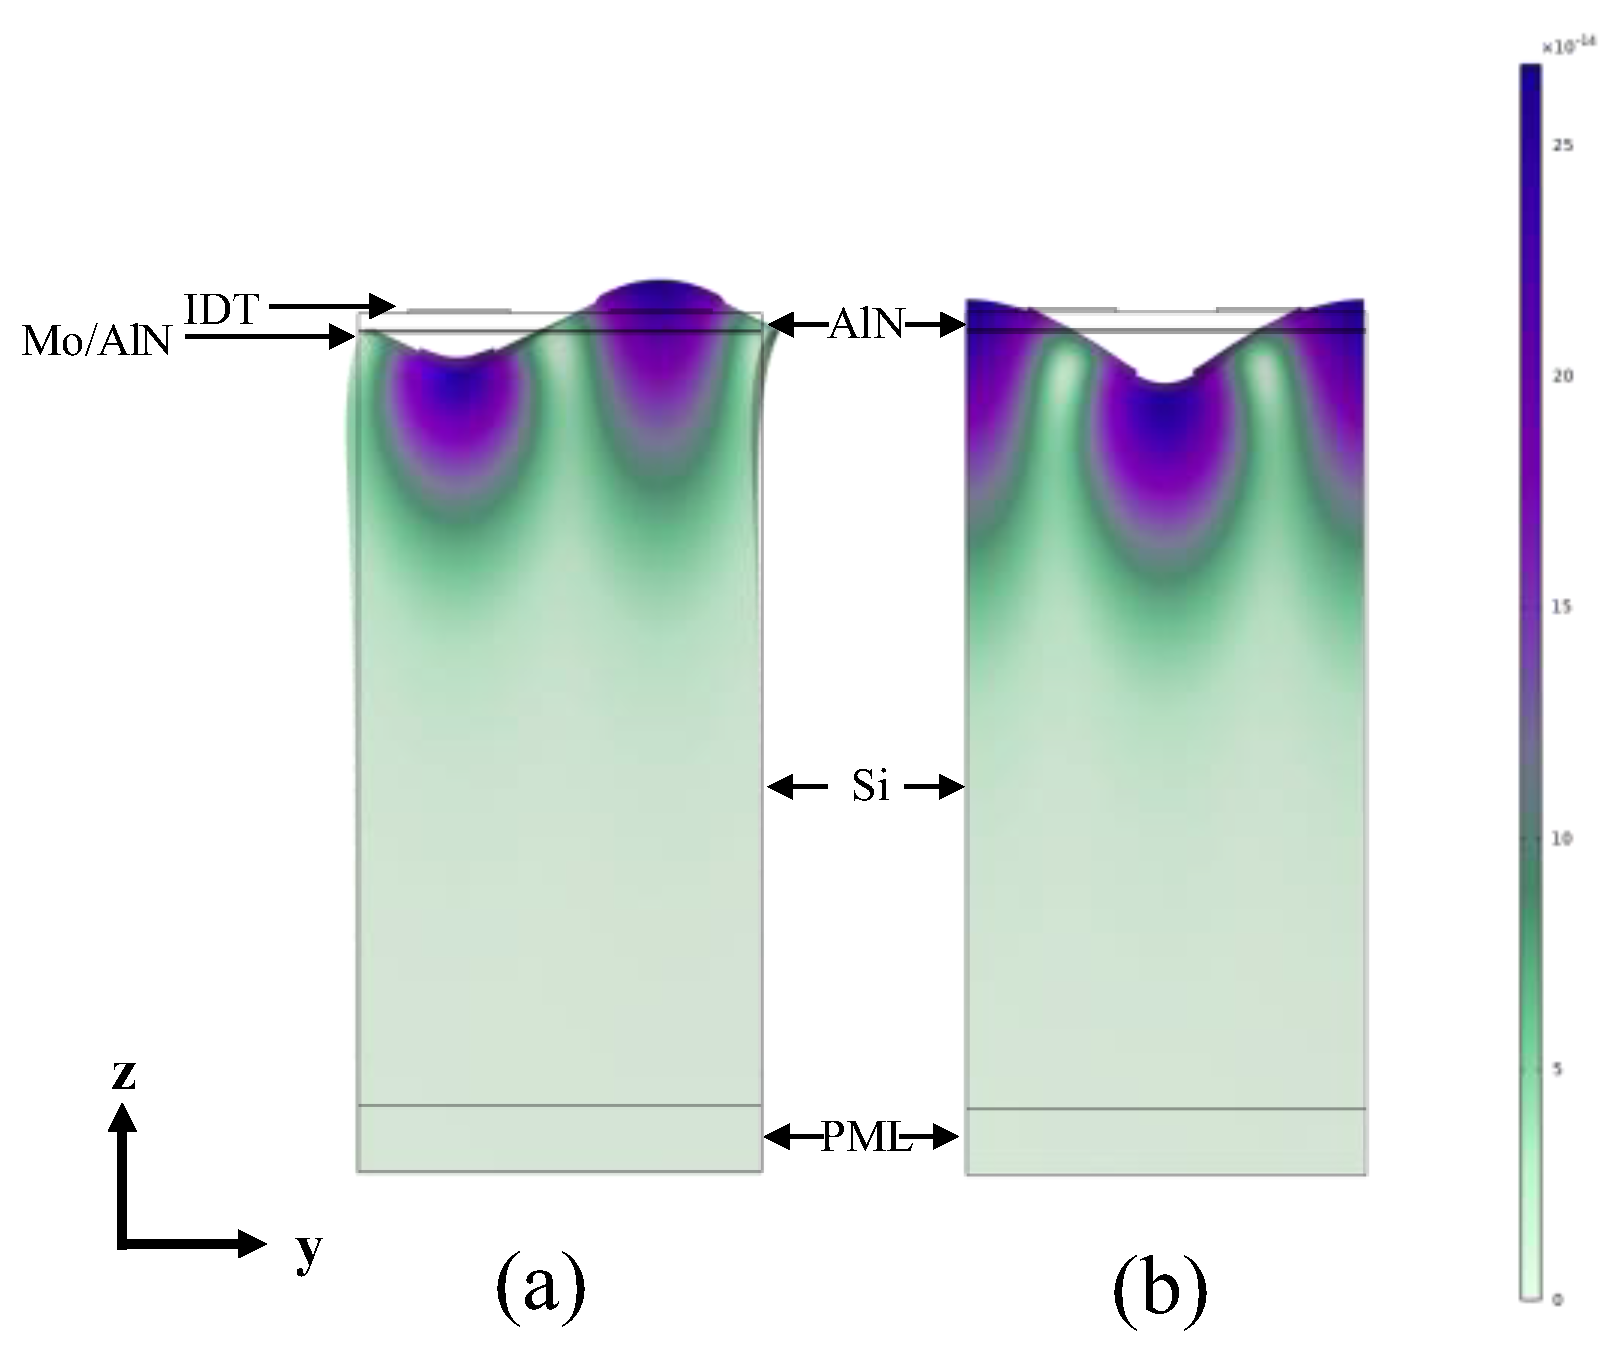
Figure 1. (a) Antisymmetric mode; (b) symmetric mode.
Chemosensors 11 00225 g001
Figure 2. Fabrication process of Pt/Ti/AlN/Mo/AlN/Si SAW sensors.
Chemosensors 11 00225 g002
Figure 3. The schematic diagram of Pt/Ti/AlN/Mo/AlN/Si SAW sensors.
Chemosensors 11 00225 g003
Figure 4. (a) Schematic diagram of high-temperature test; (b) physical diagram of high-temperature test.
Chemosensors 11 00225 g004
Figure 5. (a) XRD curve of AlN thin film; (b) SEM results of AlN thin film.
Chemosensors 11 00225 g005
Figure 6. SEM results of Pt electrode.
Chemosensors 11 00225 g006
Figure 7. T−f−S11 curve: (a1,a2) Sample 1 (ղ = 25%), (b1,b2) Sample 2 (ղ = 50%), and (c1,c2) Sample 3 (ղ = 67%); S11 curve: (a3) Sample 1 (ղ = 25%), (b3) Sample 2 (ղ = 50%) and (c3) Sample 3 (ղ = 67%).
Chemosensors 11 00225 g007aChemosensors 11 00225 g007b
Figure 8. f–T curve comparison before and after annealing: (a) Sample 1 (ղ = 25%), (b) Sample 2 (ղ = 50%) and (c) Sample 3 (ղ = 67%).
Chemosensors 11 00225 g008
Figure 9. High−temperature test curve of a temperature range of 20−1000 °C: (a) S11 curve and (b) f−T curve.
Chemosensors 11 00225 g009
Figure 10. (a) Pt electrode that failed after a 20−1000 °C test; (b) cross-sectional view of a failed sensor after a 20−1000 °C test.
Chemosensors 11 00225 g010
Table 1. Material constant and temperature coefficient of AlN.
Material Constant Temperature Coefficient
AlNAlN
Density
(kg/m3)
ρ3260(10−6/K)−14.69
Elasticity constant
(GPa)
C11345(10−4/K)0.8
C121251.8
C131201.6
C14--
C333951
C441180.5
Piezoelectric constant
(C/m2)
e15−0.48(10−4/K)-
e31−0.58-
e331.55-
Dielectric constant
(10−11 F/m)
ε118.2(10−4/K)-
ε339.5-
Coefficient of thermal expansion
(ppm/K)
α11 5.27
α334.15
Table 2. Material data.
PtTiMoSi
Density
(kg/m3)
21,450450610,2002329
Relative permittivity11111.7
Young’s modulus (Pa)168 × 109115.7 × 109312 × 109170 × 109
Poisson’s ratio0.380.3210.310.28
Table 3. Simulation results.
SampleResonant Frequency/MHzInverse Resonant Frequency/MHz
Pt/Ti/AlN/Mo/AlN/Si197.8191.1
Pt/Ti/AlN/Mo/Si197.8191.2
Table 4. Electrode structure parameters.
IndexNumeric Value
wavelength λ24 μm
pore size W90 λ
interdigital spacing P12 μm
reflected gate pairs Nr100 pairs
interdigital electrode pairs Nt100 pairs
Table 5. Sensor performance.
SampleMetallization RateSensitivity/KHz K−1Q
125%14.7734.8
250%17.2719.8
367%12.3425.5
Disclaimer/Publisher’s Note: The statements, opinions and data contained in all publications are solely those of the individual author(s) and contributor(s) and not of MDPI and/or the editor(s). MDPI and/or the editor(s) disclaim responsibility for any injury to people or property resulting from any ideas, methods, instructions or products referred to in the content.