Article

Ziziphus spina-christi Leaf-Derived Carbon Dots as a Fluorescence Nanosensor to Evaluate Rifaximin Antibacterial via Inner Filter Effect: Greenness and Whiteness Studies

by
Mohamed A. El Hamd
1,2,*,
Marzough Aziz Albalawi
3,
Hassanien Gomaa
4,
Bassam Shaaban Mohammad
5,
Rady F. Abdul-Kareem
6,
Reem H. Obaydo
7,
Wejdan T. Alsaggaf
8,
Safaa F. Saleh
9,10,
Manal A. Alossaimi
11 and
Mohamed A. Abdel-Lateef
12,*
1
Department of Pharmaceutical Sciences, College of Pharmacy, Shaqra University, Shaqra 11961, Saudi Arabia
2
Department of Pharmaceutical Analytical Chemistry, Faculty of Pharmacy, South Valley University, Qena 83523, Egypt
3
Department of Chemistry, Alwajh College, University of Tabuk, Tabuk 71491, Saudi Arabia
4
Department of Chemistry, Faculty of Science, Al-Azhar University, Assiut 71524, Egypt
5
Department of Pharmaceutical Analytical Chemistry, Faculty of Pharmacy, Menoufia University, Shebin El-Kom 32928, Egypt
6
Department of Pharmaceutical Analytical Chemistry, Faculty of Pharmacy (Boys), Al-Azhar University, Nasr City 11751, Egypt
7
Department of Analytical and Food Chemistry, Faculty of Pharmacy, Ebla Private University, Idlib P.O. Box 5, Syria
8
Department of Chemistry, Faculty of Science, King Abdulaziz University, Jeddah 21551, Saudi Arabia
9
Department of Pharmaceutical Chemistry, College of Pharmacy, Jazan University, Jazan 45142, Saudi Arabia
10
Department of Pharmaceutical Analytical Chemistry, Faculty of Pharmacy, Fayoum University, Fayoum 63514, Egypt
11
Department of Pharmaceutical Chemistry, College of Pharmacy, Prince Sattam bin Abdulaziz University, Al-Kharj 11942, Saudi Arabia
12
Department of Pharmaceutical Analytical Chemistry, Faculty of Pharmacy, Al-Azhar University, Assiut Branch, Assiut 71524, Egypt
*
Authors to whom correspondence should be addressed.
Chemosensors 2023, 11(5), 275; https://doi.org/10.3390/chemosensors11050275
Submission received: 15 March 2023 / Revised: 23 April 2023 / Accepted: 25 April 2023 / Published: 3 May 2023

Abstract

:
Rifaximin (RFX) is a non-absorbable antibiotic with broad-spectrum efficacy. It treats travelers’ diarrhea, irritable bowel syndrome, non-systematic bacterial diarrhea, bowel infections, overgrowth syndrome, and enteric infections. In this work, carbon dots prepared from Ziziphus spina-christi leaves’ powders are utilized as a green fluorometric biosensor for the assessment of RFX. The morphological lineaments of the prepared carbon dots were recognized by using TEM and SEM techniques. The prepared carbon dots manifest a fluorescence emission peak at 432 nm after an excitation fluorescence peak at 366 nm. The absorbance band of RFX (absorbance peaks at 370 nm and 443 nm) could be thoroughly overlapped with fluorescence excitation/emission bands of the produced carbon dots. A fluorometric tool has been designed and validated for the evaluation of RFX reliant on the inner filter effect methodology, in which the produced carbon dots act as an inner filter effect fluorophore and RFX as an inner filter effect absorber. The quenching degree in the fluorescence activity of the prepared carbon dots depended on the concentration of RFX. The analytical parameters were checked and directed for successfully applied assessment of RFX concentration in different pharmaceutical formulations. The proposed tool’s greenness and eco-friendliness profile was evaluated using the most recent greenness assessment tool, which is the complementary green analytical procedure index (Complex-GAPI) and the Analytical GREEnness metric (AGREE). Additionally, using the recently released White Analytical Chemistry (WAC) tool, the whiteness characteristic—which indicated the method’s sustainability—was investigated.

1. Introduction

Gastrointestinal diseases account for mortality, substantial morbidity, and cost. Among them is irritable bowel syndrome disease, which is accompanied by abdominal discomfort and changes in bowel habits or soreness without organic illness. Gastroenterologists and primary care physicians commonly encounter and receive irritable cases of bowel syndrome. The prevalence of the disease has been determined as high as 28% on referrals to gastroenterologists and 12% on regular visits to primary care physicians [1].
The bacterial overgrowth of intestinal gut flora has a pathological role and can partially explain irritable bowel syndrome [2,3]. Both of them participated in symptoms such as changes in bowel habits, bloating, and abdominal discomforts [3]. Another type of gastrointestinal disease is hepatic encephalopathy disorder, which is considered one of the main complications of advanced hepatic disease. The first-line drugs in the treatment of hepatic encephalopathy are non-absorbed disaccharides, e.g., lactitol and lactulose. However, long-term therapy by disaccharides is ineffective and develops intolerable adverse effects for patients [4]. Most of the time, non-absorbable antibiotics are used instead of disaccharides to treat hepatic encephalopathy [5]. Rifaximin (RFX) (Figure 1) is a substantially non-absorbed antibacterial drug with broad-spectrum activity against a wide range of bacteria such as aerobic, Gram-negative, anaerobic, and Gram-positive [6]. RFX is utilized in treating traveler’s diarrhea, irritable bowel syndrome, non-systematic diarrhea caused by bacteria, bowel infections, tuberculosis, overgrowth syndrome, and enteric infections [4,6,7,8]. Due to its non-absorbability, no systemic side effect has been reported of this drug with a high safety level for treating acute and chronic conditions of all ages with varied underline health problems [4,9].
A limited range of analytical methodologies was reported for determining RFX, generally involving some chromatographic methods [10,11], one voltammetric method [12], and a few spectrophotometric methods [13,14,15,16]. Although these chromatographic methodologies can yield high selectivity and sensitivity for determining RFX, they are relatively expensive and necessitate sample pretreatments, time consumption, and instrumental challenges. In addition, spectrophotometric methodologies lack sensitivity. Therefore, there is an imperious demand to generate a facile, selective, sensitive, and rapid methodology to estimate the concentration of rifaximin.
The spectrofluorimetric technique is one of the common spectroscopic techniques used for determining active pharmaceutical ingredients. It has been reported to analyze the active pharmaceutical ingredients either by measuring their native fluorescence intensity, their ability to quench the fluorescence intensity of a fluorescence reagent, or switching on their fluorescence intensity by the fluorogenic reagent. Recently, nanomaterials have been widely applied for the determination of active pharmaceutical ingredients or their extraction from biological and pharmaceutical samples. Fluorescent nano-sensing systems have received much interest owing to the advantages of desirable selectivity, portability, simplicity in operation, exceptional sensitivity, and real-time detection [17,18,19]. Carbon dots is one of the fluorescence carbon nanomaterials with a size of less than 10 nm. In contrast to semiconductor quantum dots and traditional organic fluorescent dyes, carbon dots have various remarkable features, including favorable low toxicity, simple synthesis routes, high photostability, adequate solubility in water, and feasible modulation [20,21].
The design and implementation of fluorescence-emitted probes based on carbon dots have garnered the attention of a large number of researchers, and they have been utilized for the estimation of target analytes. Numerous analytical approaches have been developed and implemented at the current time based on various quenching mechanisms between the specific target analytes and fluorophores. One of these quenching mechanisms is the inner filter effect that is generated by absorbing the fluorescence excitation light of the fluorophore and/or the fluorescence emission light of the fluorescent reagent by the target analyte (absorber or quencher), and the absorbance band of the targeted absorber or quencher should be overlapped with the excitation or/and emission bands of the applied fluorophore [22].
It offers the feasibility of converting the classical colorimetric detection approach into the fluorescence detection protocol, which leads to overcoming the inherent shortcomings of the colorimetric system, such as poor repeatability, complicated interfering factors, and/or inferior detection sensitivity [22]. The degree of quenching in the fluorescence intensity of the fluorophore by the inner filter effect can be attained by modifying the concentration of the target analyte [23]. Herein, we are approaching a facile, low-cost, green, and effective spectrofluorimetric methodology for RFX determination in pharmaceutical dosage forms based on the mechanism of the inner filter mechanism. To the best of our knowledge, this suggested analytical method is considered the first green fluorescent-spectrometric methodology for accurate and reliable RFX determination.
In order to determine what constitutes a green carbon dots synthesis, the 12 principles of Green Chemistry (GAC) were looked at and studied [24]. However, according to the GAC perspective, the type of solvents and reagents used in the developed analysis and the amount of waste generated, are the most variables that distinguish between the development of sophisticated spectroscopic procedures [25].
Throughout the developed tool, ingredients such as water and ethanol, which are secure and replenishable, and completely abide by the twelve GAC principles, were utilized. Moreover, the employed spectroscopic tool, which is a more environmentally friendly part of GAC [26,27], was applied. The developed tool was regarded as a green and ecologically friendly approach because it used small amounts of the chosen solvents and natural and renewable raw materials of the reagent (Ziziphus spina-christi leaves’ powders) along with the lower energy of the used instrument [28].

2. Materials and Methods

2.1. Solutions and Materials

Rifaximin (RFX) was obtained from Al-Andalous Co. (6 October; City, Egypt). Gastrobiotic-coated tablets® labeled to contain 200 mg of RFX with batch number 210771 were obtained from the local market. The standard solution of RFX was prepared by dissolving 5 mg of RFX powder in 10 mL of ethanol, then the container was filled to 50 mL with water. Leaves of Ziziphus spina-christi were collected from agricultural fields.

2.2. Instruments

All intensities of the fluorescence measurements were recorded on an FS2 spectrofluorimeter (Scinco Co., Seoul, Republic of Korea). UV-spectrophotometer (Shimadzu Co., Kyoto, Japan) and JEM-100CX II electron microscope (JEOL Co., Tokyo, Japan) devices were used for absorbance spectra and transmission electron microscope (TEM) images, respectively.

2.3. Preparation of Carbon Dots

The hydrothermal method was used to create carbon dots from the powdered and dried leaves of Ziziphus spina-christi. Briefly, 20 mL of concentrated orthophosphoric acid was added to 4 g of finely powdered Ziziphus spina-christi leaves, which had been soaked in the appropriate amount of water. The mixture was then heated at 220 °C for 7 h. The mixture was then centrifuged for 30 min at 4000 rpm while being cooled to room temperature. The supernatant was separated, put through a 0.45 μm filtration membrane, and stored until it was required for the proposed work [29,30].

2.4. General Procedures for Fluorescence Assay and Pharmaceutical Samples

A 0.8 mL volume from the prepared carbon dots solution and 0.6 mL from phosphate buffer (pH = 6.0) were mixed several times into a series of 10 mL flasks. Different concentrations from RFX standard solution (the final RFX concentrations ranged from 0.4 to 5.0 µg/mL) were added to flasks, and the volume of flasks was completed to 10 mL with water. All of the fluorescence emission measurements were recorded at 435 nm under excitation at 373 nm. For pharmaceutical samples, ten Gastrobiotic-coated tablets® (200 mg per tablet) were weighed and powdered. Then, a suitable amount of the prepared powder (nearly equivalent to 50 mg of RFX) was accurately weighed. The weighed RFX powder was extracted by adding 50 mL of absolute ethanol, and the mixture was filtered out through filter paper. An appropriate volume from the ethanolic solution was diluted with water, and the general procedures were run.

3. Results and Discussion

3.1. Size, Morphological, FTIR, and Fluorescence of the Prepared Carbon Dots

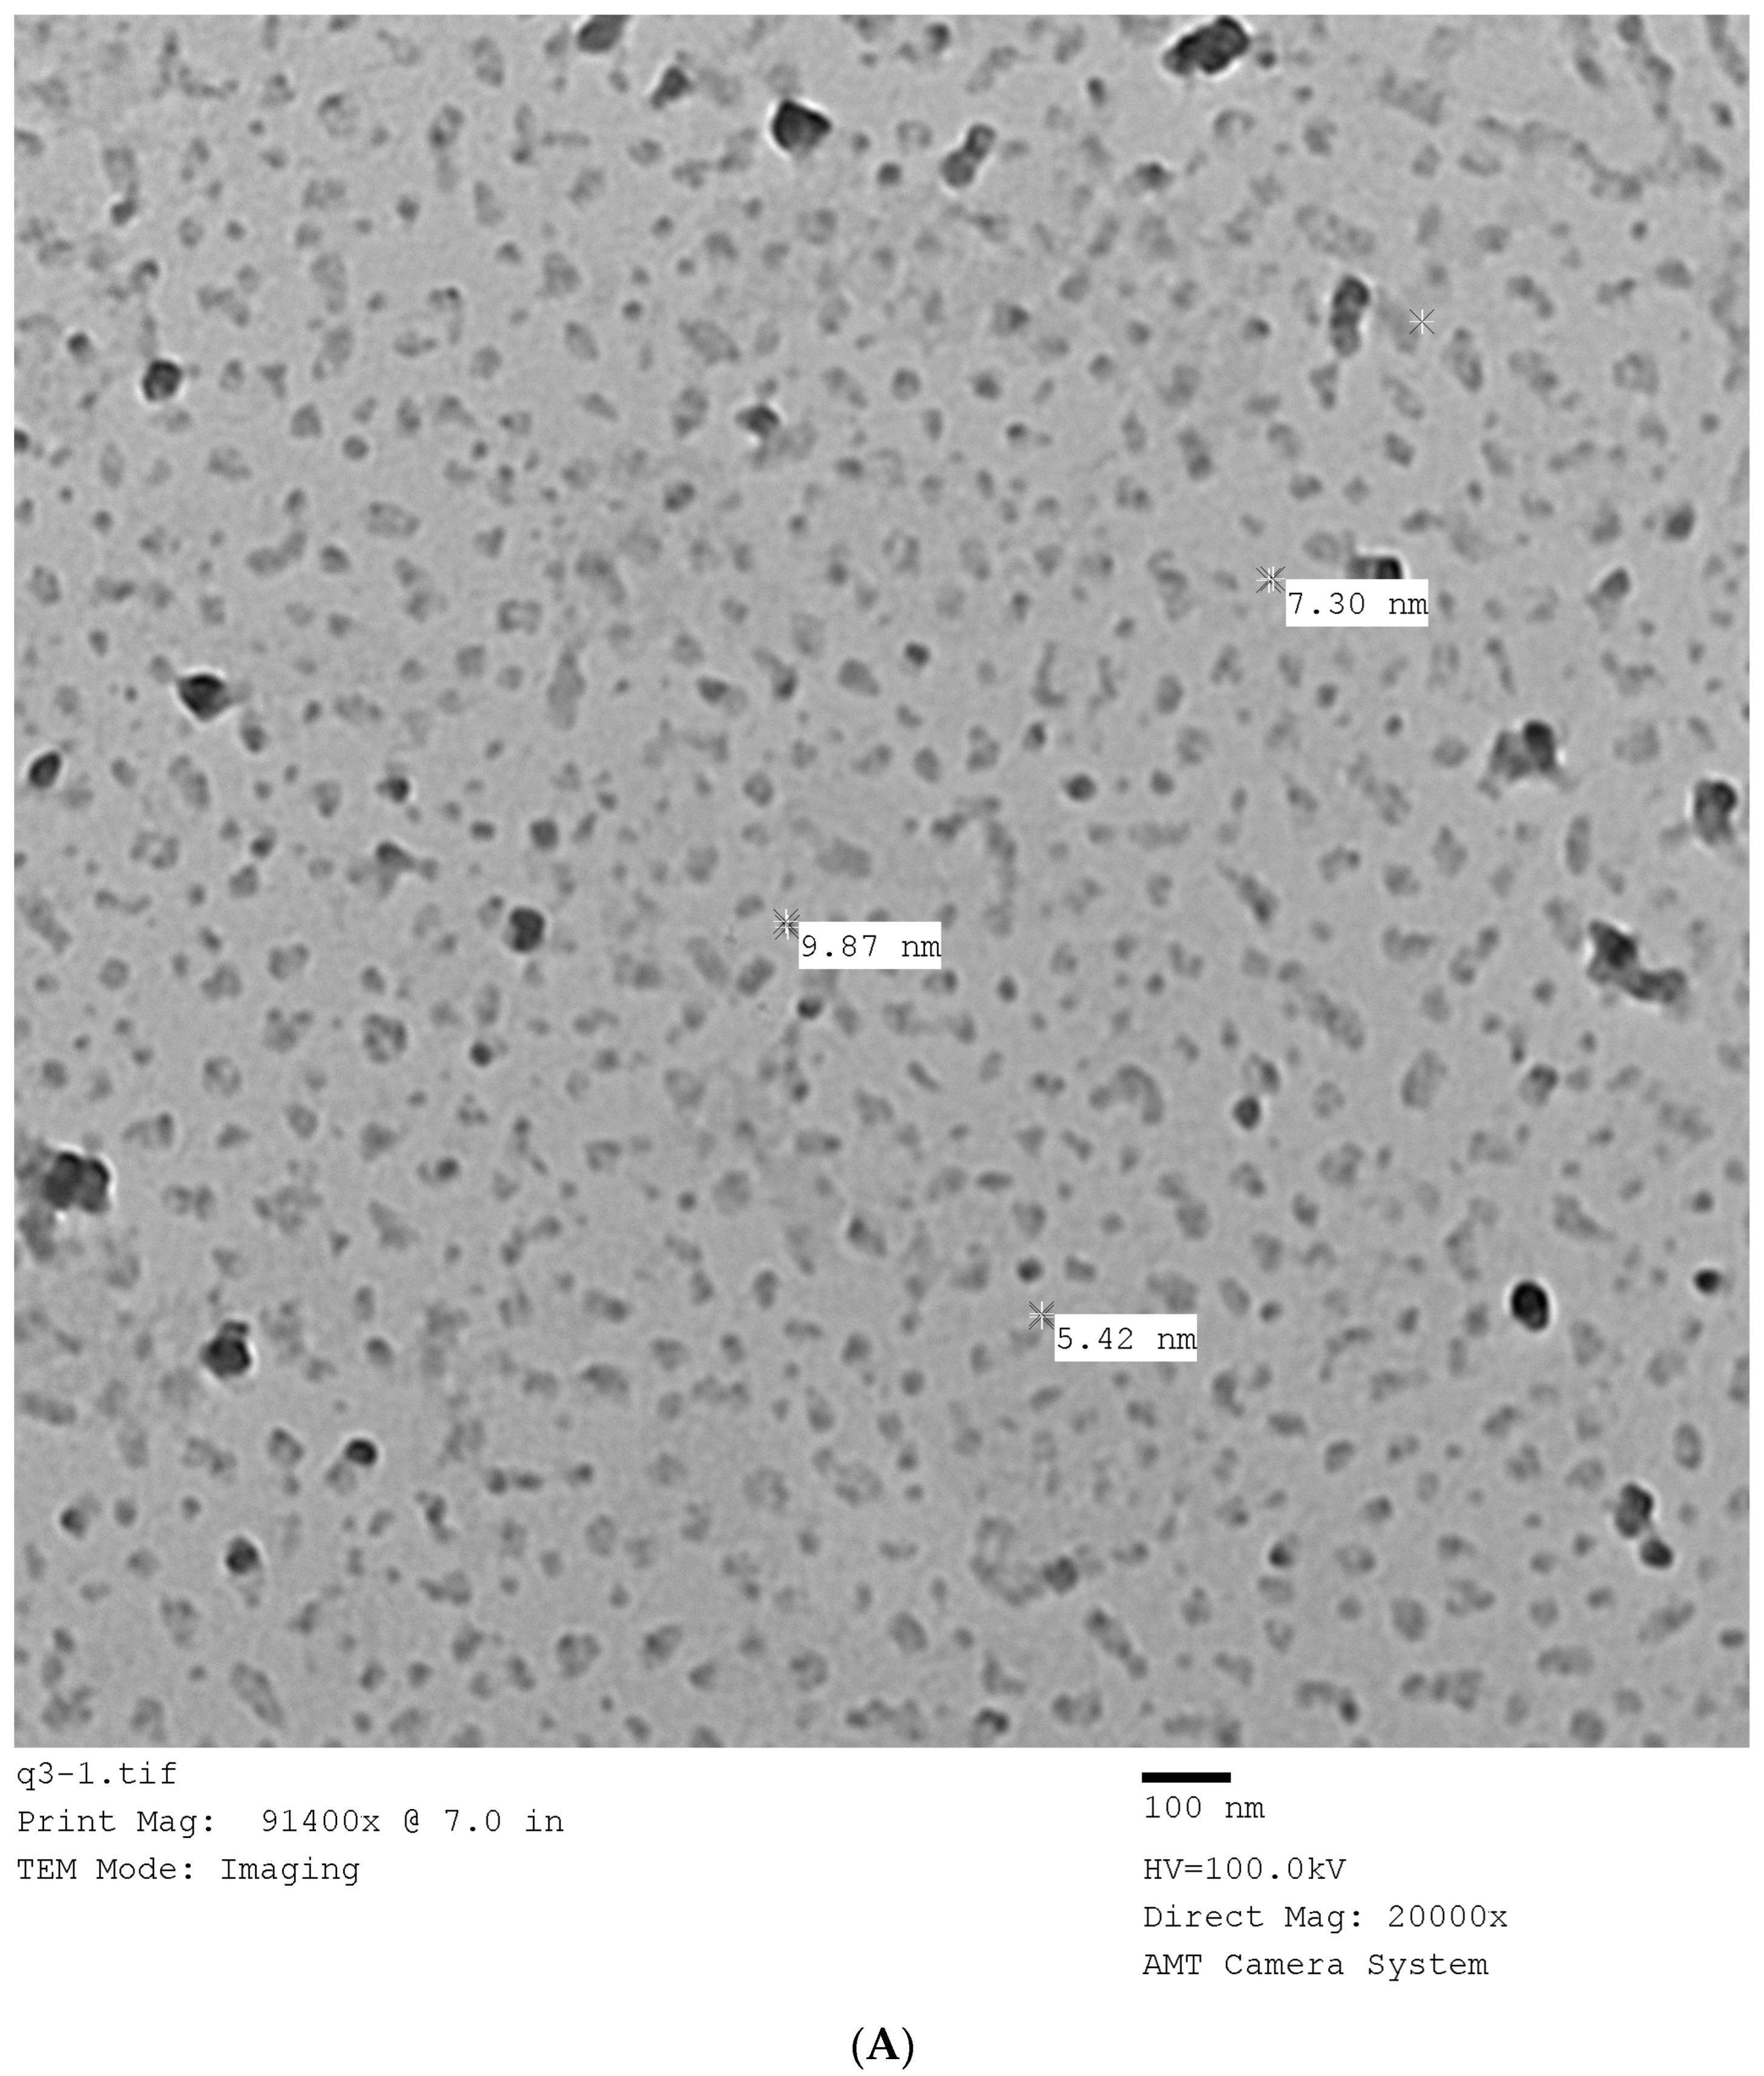
The nano-size for the produced carbon dots was characterized by TEM. A characteristic TEM image for the produced carbon dots is showcased in Figure 2A, which elucidates the tiny size distribution under 10 nm. The fluorescence excitation spectrum and the fluorescence emission spectrum for the produced carbon dots in the aqueous solution were investigated. As offered in Figure 2B, the produced carbon dots display an emission peak at 435 nm and an excitation peak at 373 nm.
Furthermore, the Fourier transform infrared (FTIR) spectrum in Figure 2C enabled the recognition of surface functional groups of the prepared carbon dots. As offered in Figure 2C, the strong peak at 3441.42 cm−1 is related to the O-H stretched surface attached to the phenolic group. The peak at 2921.78 cm−1 is related to the C-H stretching vibration of aromatic compounds [31].
The appearance of a strong absorbance peak at 1634.86 cm−1 is related to the presence of the carbonyl group.

3.2. Fluorescence Sensing of RFX by Inner Filter Effect

To confirm that the quenching of the fluorescence activity of the produced carbon dots was caused by the inner filter effect, the absorbance spectrum for RFX was consequently carried out. As offered in Figure 3A,B, the UV–visible absorbance spectrum of RFX at the UV–visible region possesses two peaks at 370 nm and 443 nm that are closely overlapped with the peak of the fluorescence excitation spectrum at 373 nm and the peak of the emission spectrum at 435 of the produced carbon dots, respectively. As a result of this, the inner filter effect takes place, and the fluorescence activity of the produced carbon dots is successfully quenched due to the competitive absorbance [32].

3.3. Optimizing the Determination of RFX by Carbon Dots

To obtain maximum quenching efficacy by RFX on the fluorescence activity of carbon dots, conditions of the medium, such as pH, the volume of carbon dots solution, and the time of the reaction, were investigated and optimized.
The findings of the current study showed that quenching decreased in an acidic pH. However, in an alkaline pH, the carbon dots’ fluorescence activity entirely decreased. The study took advantage of this fact by using phosphate buffer at a pH of 6.0 because it had a good quenching effect on the fluorescence intensity of the carbon dots produced in the pH range of 4 to 7.5, as shown in Figure 4.
Furthermore, the quenching in the fluorescence gradually increased with the increase in the volume of the prepared carbon dots up to 0.7 mL; therefore, 0.8 mL from the aqueous solution of carbon dots was used in this work (Figure 4). In addition, it was found that the quenching of the fluorescence intensity of the prepared carbon dots by the RFX solution instantaneously occurred. Therefore, we presented an efficient method for the determination of RFX.

3.4. Fluorescence Quantum Yield ( ϕ )

The fluorescence quantum yield for the prepared carbon dots can be calculated by the equation [33,34].
ϕ = ϕ   r h o d a m i n e   B × F   C a b o n   d o t s A   C a r b o n   d o t s × A   r h o d a m i n e   B F   r h o d a m i n e   B
where ϕ is the quantum yield of the prepared carbon dots, ϕ   r h o d a m i n e   B is the quantum yield of rhodamine B, F is the integrated fluorescence intensity for the prepared carbon dots and rhodamine B, and A is the absorbance for rhodamine B and the prepared carbon dots. It was found that the ϕ value for the prepared carbon dots was 18.54%.

3.5. Validation and Analytical Parameters

The validation process for determining RFX by carbon dots was performed according to the International Council for Harmonization of Technical Requirements for Pharmaceuticals for Human Use (ICH) guidelines [35].

3.5.1. Linear Range and LOD Value

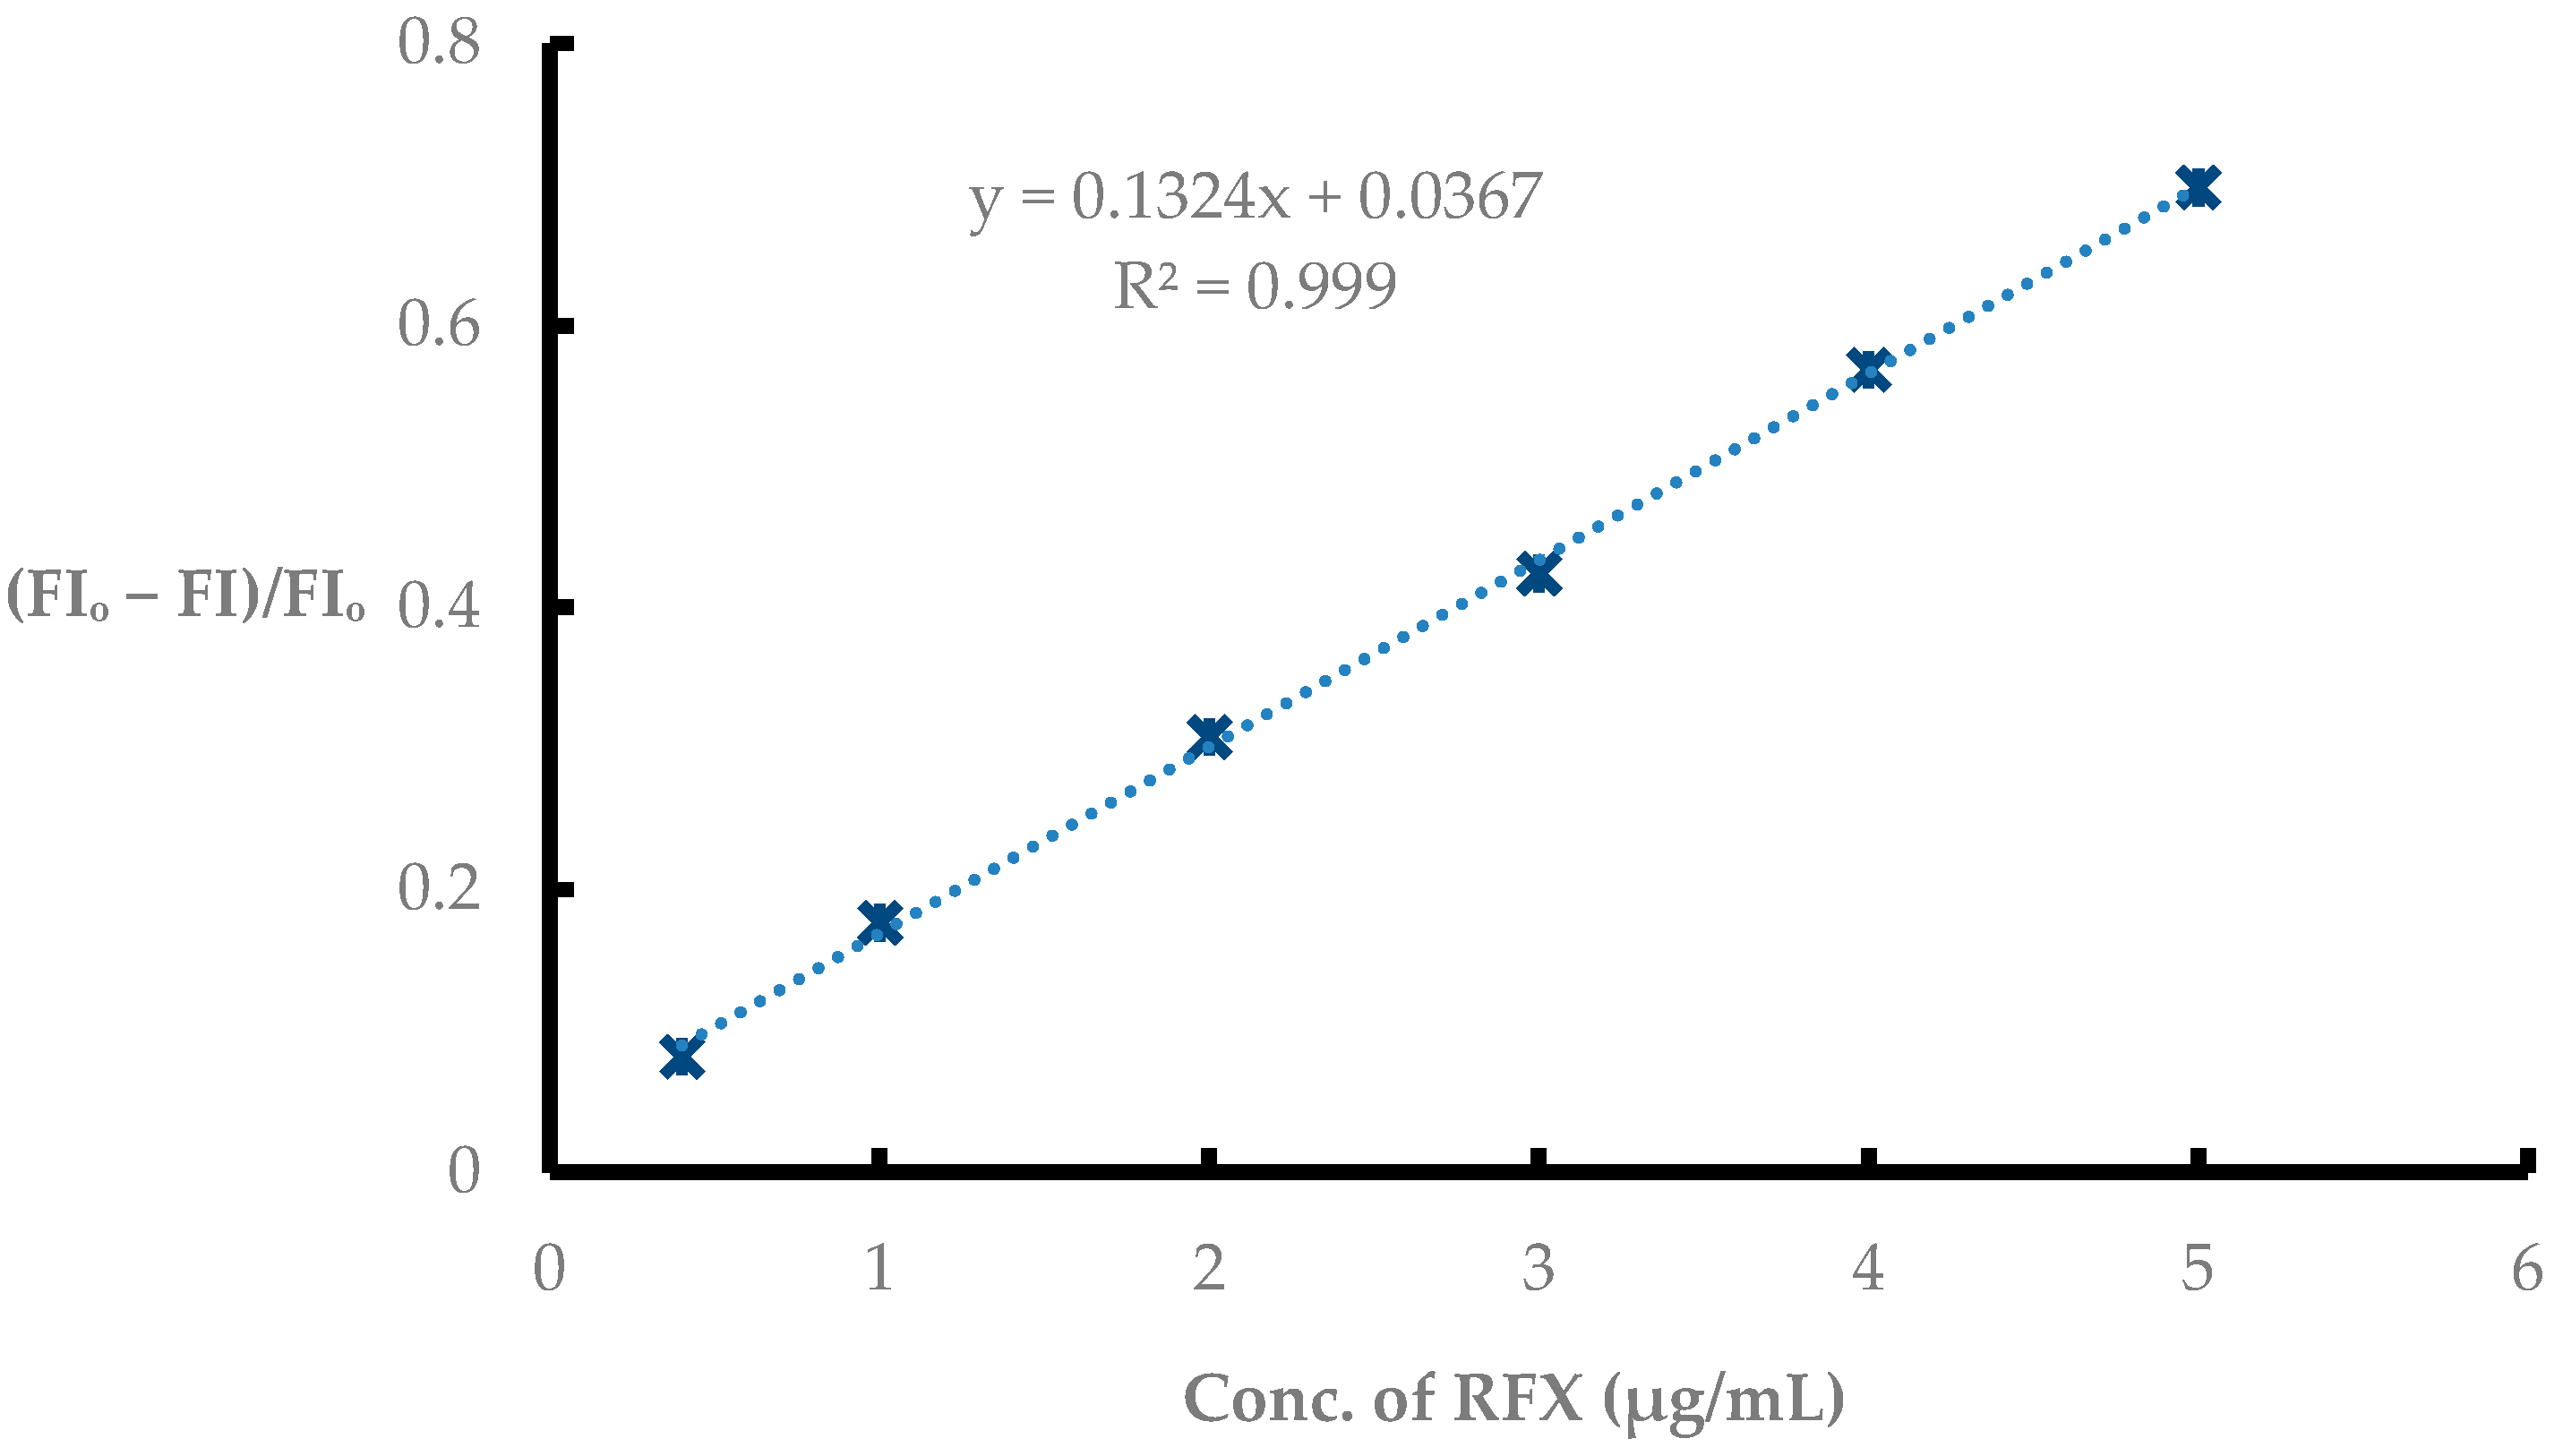
After plotting the (FIo − FI)/FIo against RFX concentrations, (FIo = fluorescence intensity of carbon dots without RFX, FI = fluorescence intensity of carbon dots in the presence of RFX), the linear range was 0.4–5.0 µg/mL with the regression equation of y = 0.1324 x + 0.0367 and r2 = 999 (Figure 5). The slope, intercept, and other parameters are presented in Table 1. According to the equation of LOD = 3.3 × 3SD/slope [34,36], the determined LOD value is 0.155 µg/mL.

3.5.2. Accuracy, Precision, and Robustness

Precision: Intra-day precision of the proposed method was tested by analyzing three replicates of the standard working solutions of the investigated drug at three different concentration levels. The experiments were repeated for three consecutive days to determine the inter-day precision (n = 3). The results of intra-day and inter-day precisions are summarized in Table 2. The calculated RSD% values for the studied drug ranged from 0.85 to 2.0, which indicates good repeatability and reproducibility of the proposed procedure. Accuracy: The accuracy of the proposed method was checked at three concentration levels of the drug concentrations. The results were expressed in percentage recovery and relative standard deviation. As shown in Table 2, the% recovery values ranged from 99.84% to 101.17%, indicating good accuracy of the developed method and its suitability for quality control measurements. Robustness: The robustness of the proposed method was determined by studying the effect of minor changes on the experimental conditions on the ΔF of the formed complex. Finally, it was found that the current method is not influenced by minor changes in the optimum conditions, confirming its robustness.

3.5.3. Selectivity Study

The selectivity study was restricted to the typical tablet excipients such as starch, lactose, carboxymethylcellulose, dextrose, mannitol, and sorbitol since RFX is only administered solely in a tablet dosage form. According to the results presented in Table 3, the excipients found in most pharmaceutical tablets have no impact on how RFX is determined using the suggested method.

3.6. Application to Pharmaceutical Analysis

Gastrobiotic tablets® (as a sample of RFX) were analyzed by the proposed method. The recovery and SD values were obtained with an acceptable state (99.70 ± 1.74). Furthermore, the obtained results were statistically compared with the reported spectrophotometric method [13] by using F-test and student t-test, and the statistical results were within the accepted levels as the t-value was 1.087 and F-value was 0.539 (tabulated values at 95% confidence limit were F = 6.338 and t = 2.306).

4. Greenness and Whiteness Evaluation for the Proposed Tool

The term GAC is used here for the development tool to indicate the ecological responsibility and energy-saving generated profiles [37,38]. There are several ways to scale how eco-friendly an analytical process is; in this instance, the new greenness rating tools (Complex-GAPI) [39] and (AGREE) [40] were used. Evaluation of the sustainability of the proposed method was achieved through the whiteness assessment approach (White Analytical Chemistry) [41].

4.1. Assessment of the Proposed Method’s Greenness by Complex-GAPI

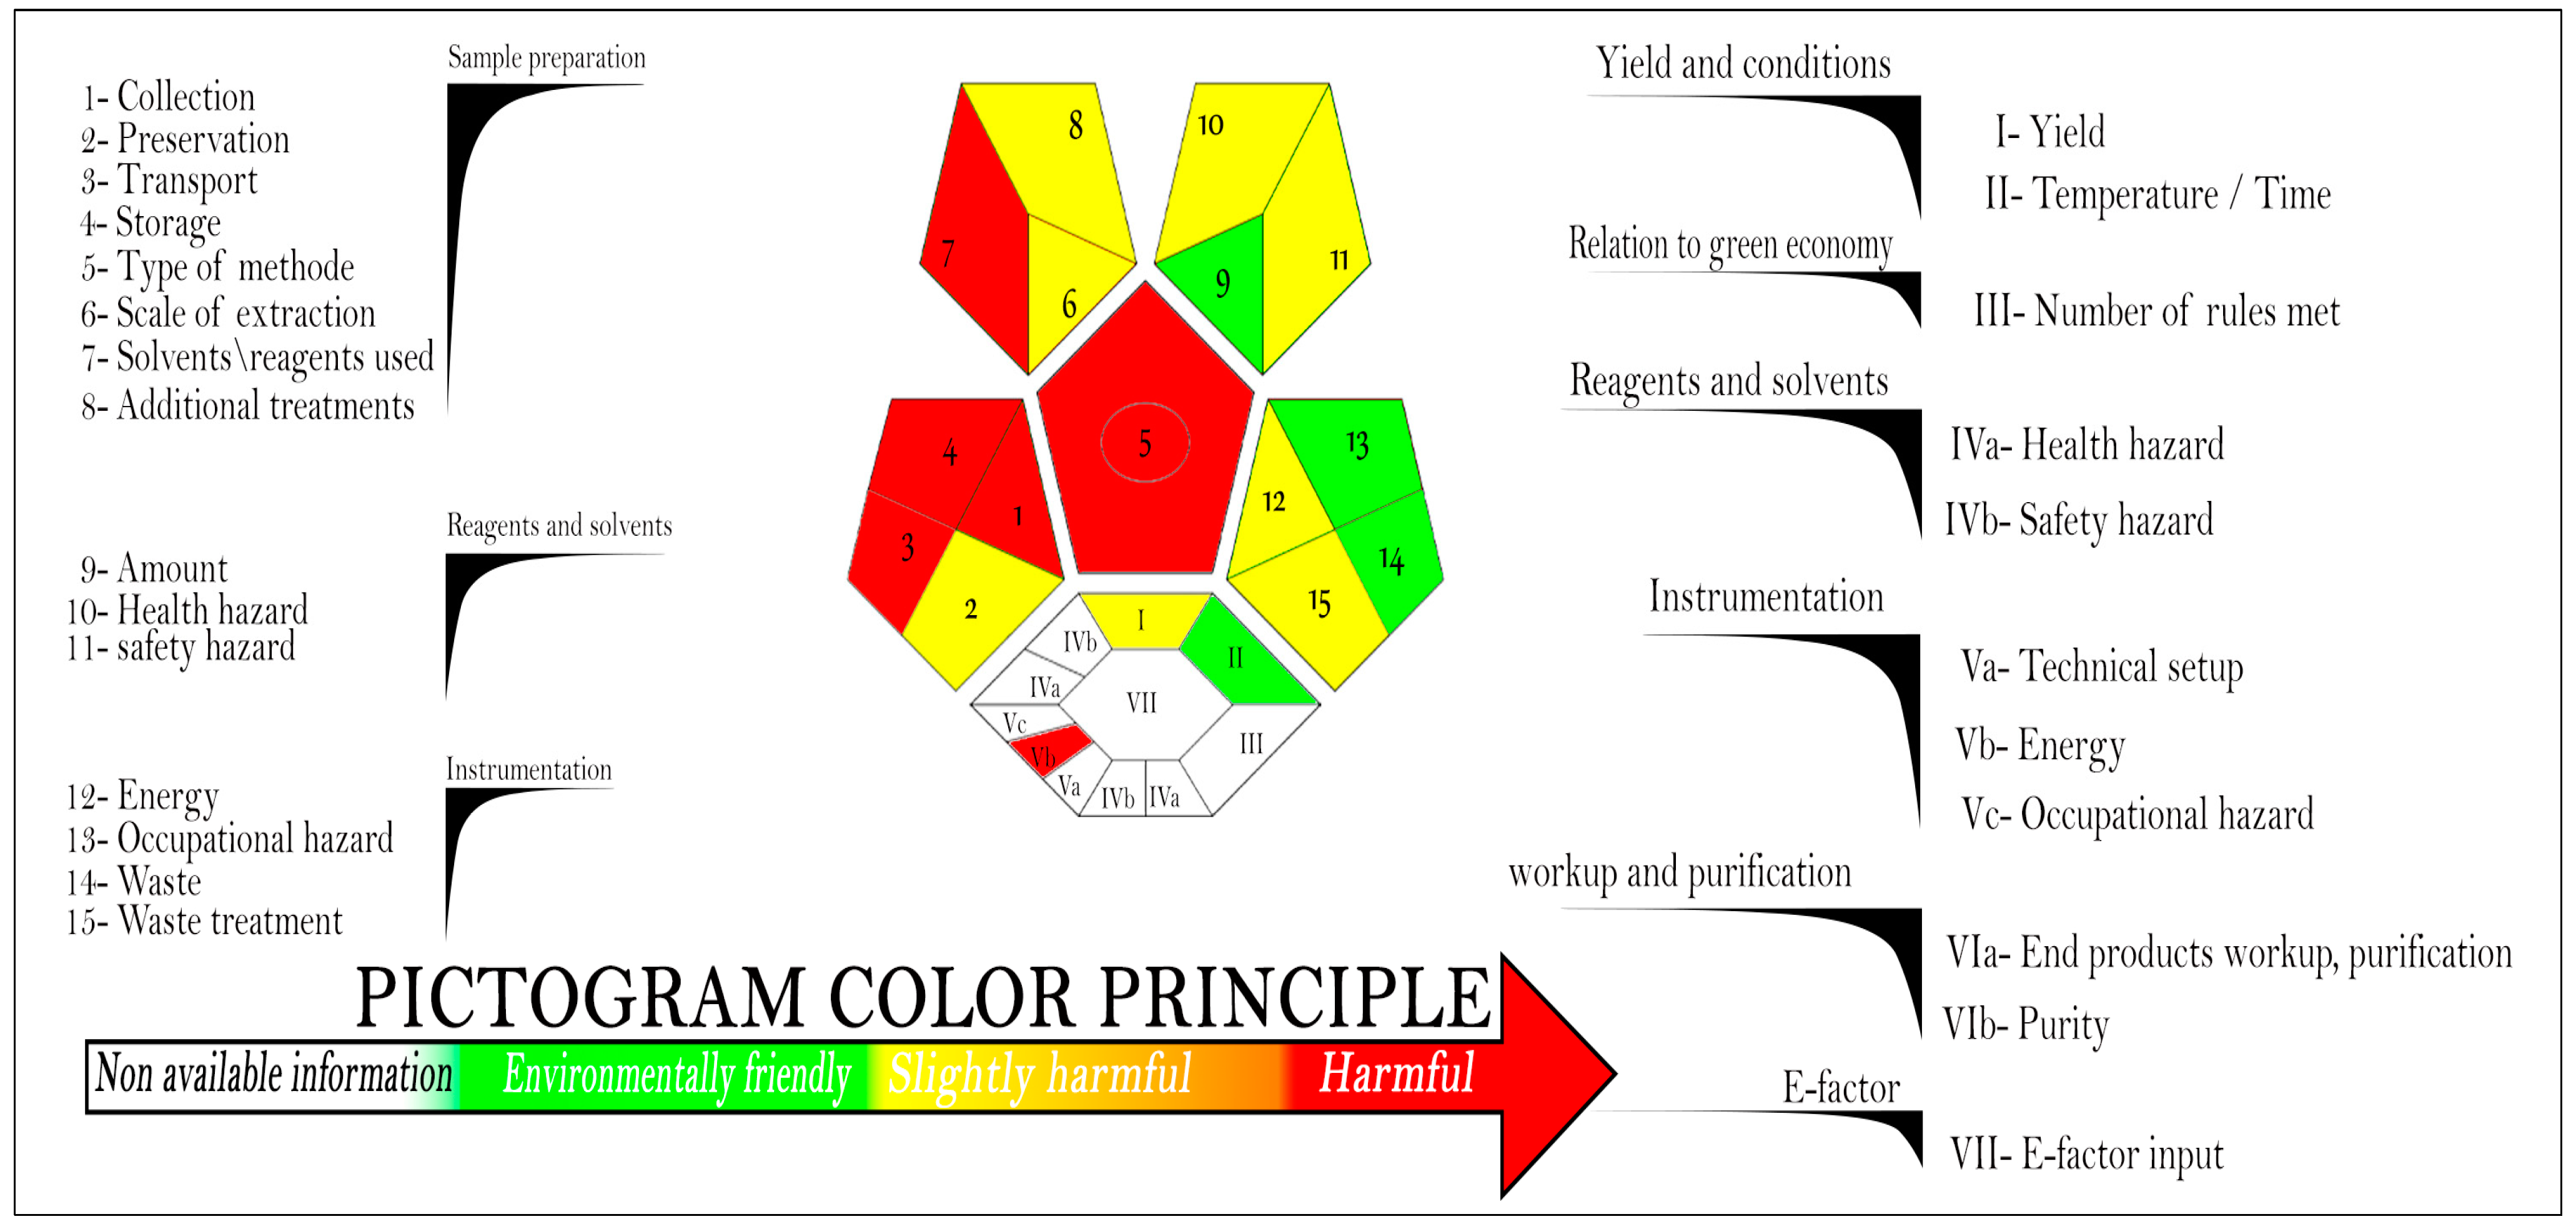
The brand-new, environmentally friendly analytical process tool Complex-GAPI is free software that covers every step of an analytical procedure, from sample preparation through sample transportation, preservation, and storage, as well as the final sample preparation and analysis. It also includes the procedures and actions taken before using the general analytical methodology. Furthermore, it has the ability to assess the green character that is used in the suggested fluorescence technique [42,43,44]. The pictogram made for GAPI is enlarged by the Complex-GAPI metric by including a second hexagonal field at the bottom. This field reflects the pre-analysis processes’ “green” nature. The E-factor value is derived from the number of solvents, reagents, and generated waste products; a low value denoted environmental friendliness, while a large value denoted increased waste production and undesirable environmental consequences. When the applicable method is used for qualifying and quantification, the hexagonal’s center ring is visible; if it is only used for qualification, there is no circle. For each stage, the Complex-GAPI tool employs two or three levels of evaluation utilizing a color scale. The resulting color pictograph, which ranges from white through red, green, and yellow, can be used to evaluate and quantify the low, high, and medium environmental consequences linked to each stage of the pre-analysis procedure and the analytical approach (the color scale was clarified in Figure 6). Each area represents various features of the described processes and analytical protocol; in Figure 6, a green fill is added to that area if particular green conditions are met. White is used to color any information that is not available [45].
As presented in Figure 7, the two red areas in the pentagram representing sample collection, preservation, and transport in the pharmaceutical industry are significant due to their proximity to the manufacturing setting and quality control center. The ten green sections of the developed tool serve as evidence that it is more environmentally friendly. Because the process is not sol-vent-free, waste was produced, some parameters displayed a yellow color, and there was no waste treatment. Our suggested method involves heating at 230 °C for seven hours with concentrated orthophosphoric acid, which represents the pre-analysis procedure, in the hexagonal portion of the pentagrams at their bottom. All of the aforementioned procedures correspond to the red zone. After being centrifuged for an hour at a speed of 4000 rpm, the sample was then stored at 4 °C. Additionally, no purification step is necessary, which corresponds to the white region, and 20 mL of ortho-phosphoric acid waste is produced when making carbon dots, which has an impact on the value of (E-factor). According to the validity results in Table 1 and Table 2, the developed fluorescence tool used for qualification and quantification of RFX makes the hexagonal center ring visible in the middle of the gap-complex hexagon.

4.2. Assessment of the Proposed Method’s Greenness by AGREE Tool

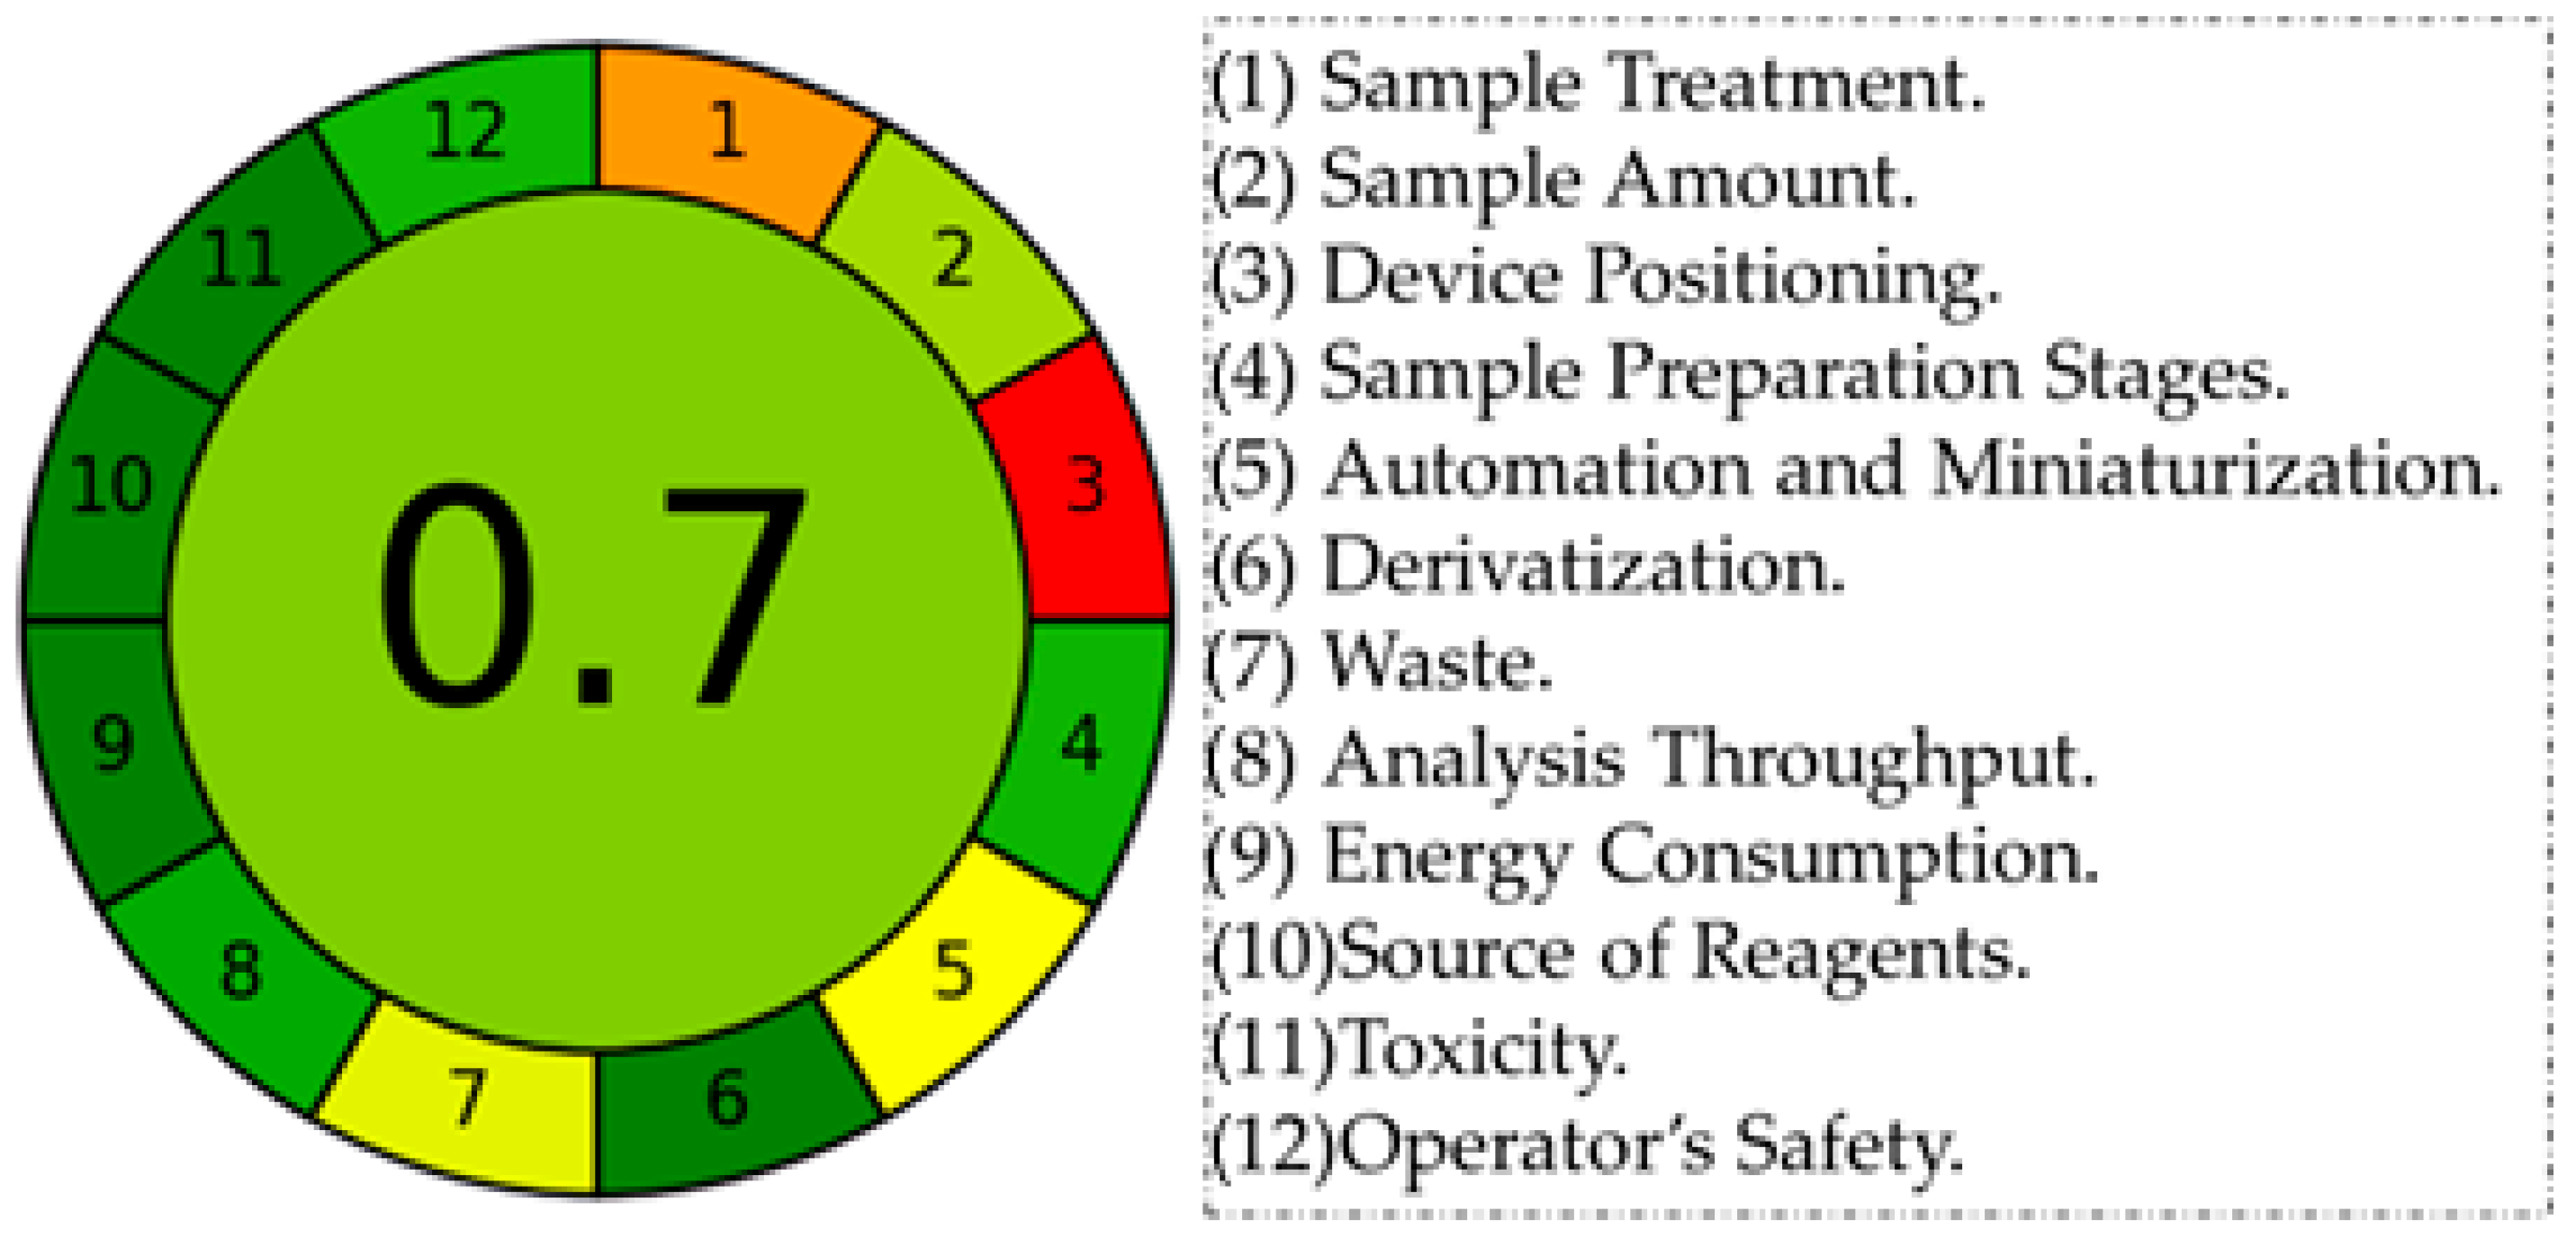
A circular pictograph like a clock with 12 numbers is provided by the free and open-source AGREE software; each number represents one of the 12 GAC’s concepts and takes the value from zero to one. This scale corresponds to the deep red to the deep green color spectrum. The final average numerical value produced from the 12 data is represented by the middle number in the AGREE pictograph, which is colored appropriately to the final results [46].
The assessment process is made simple by freely available software that is open source and downloaded from https://pubs.acs.org/doi/10.1021/acs.analchem.0c01887 (accessed on 10 March 2023).
The AGREE score for the proposed spectrofluorometric method used for determining RFX is (0.70), as shown in Figure 8, and this score confirms the greenness of the developed method.
Supplementary Graph S1 displays the full scores for the suggested spectrofluorometric method with a description of how well each of the twelve GAC principles was satisfied and how it affected the rating of greenness. However, this tool does not provide in its evaluation criteria any information regarding the validity of the analytical processes or green’s character related to the pre-analysis steps done before the analytical procedure performing.

4.3. White Analytical Chemistry (WAC)

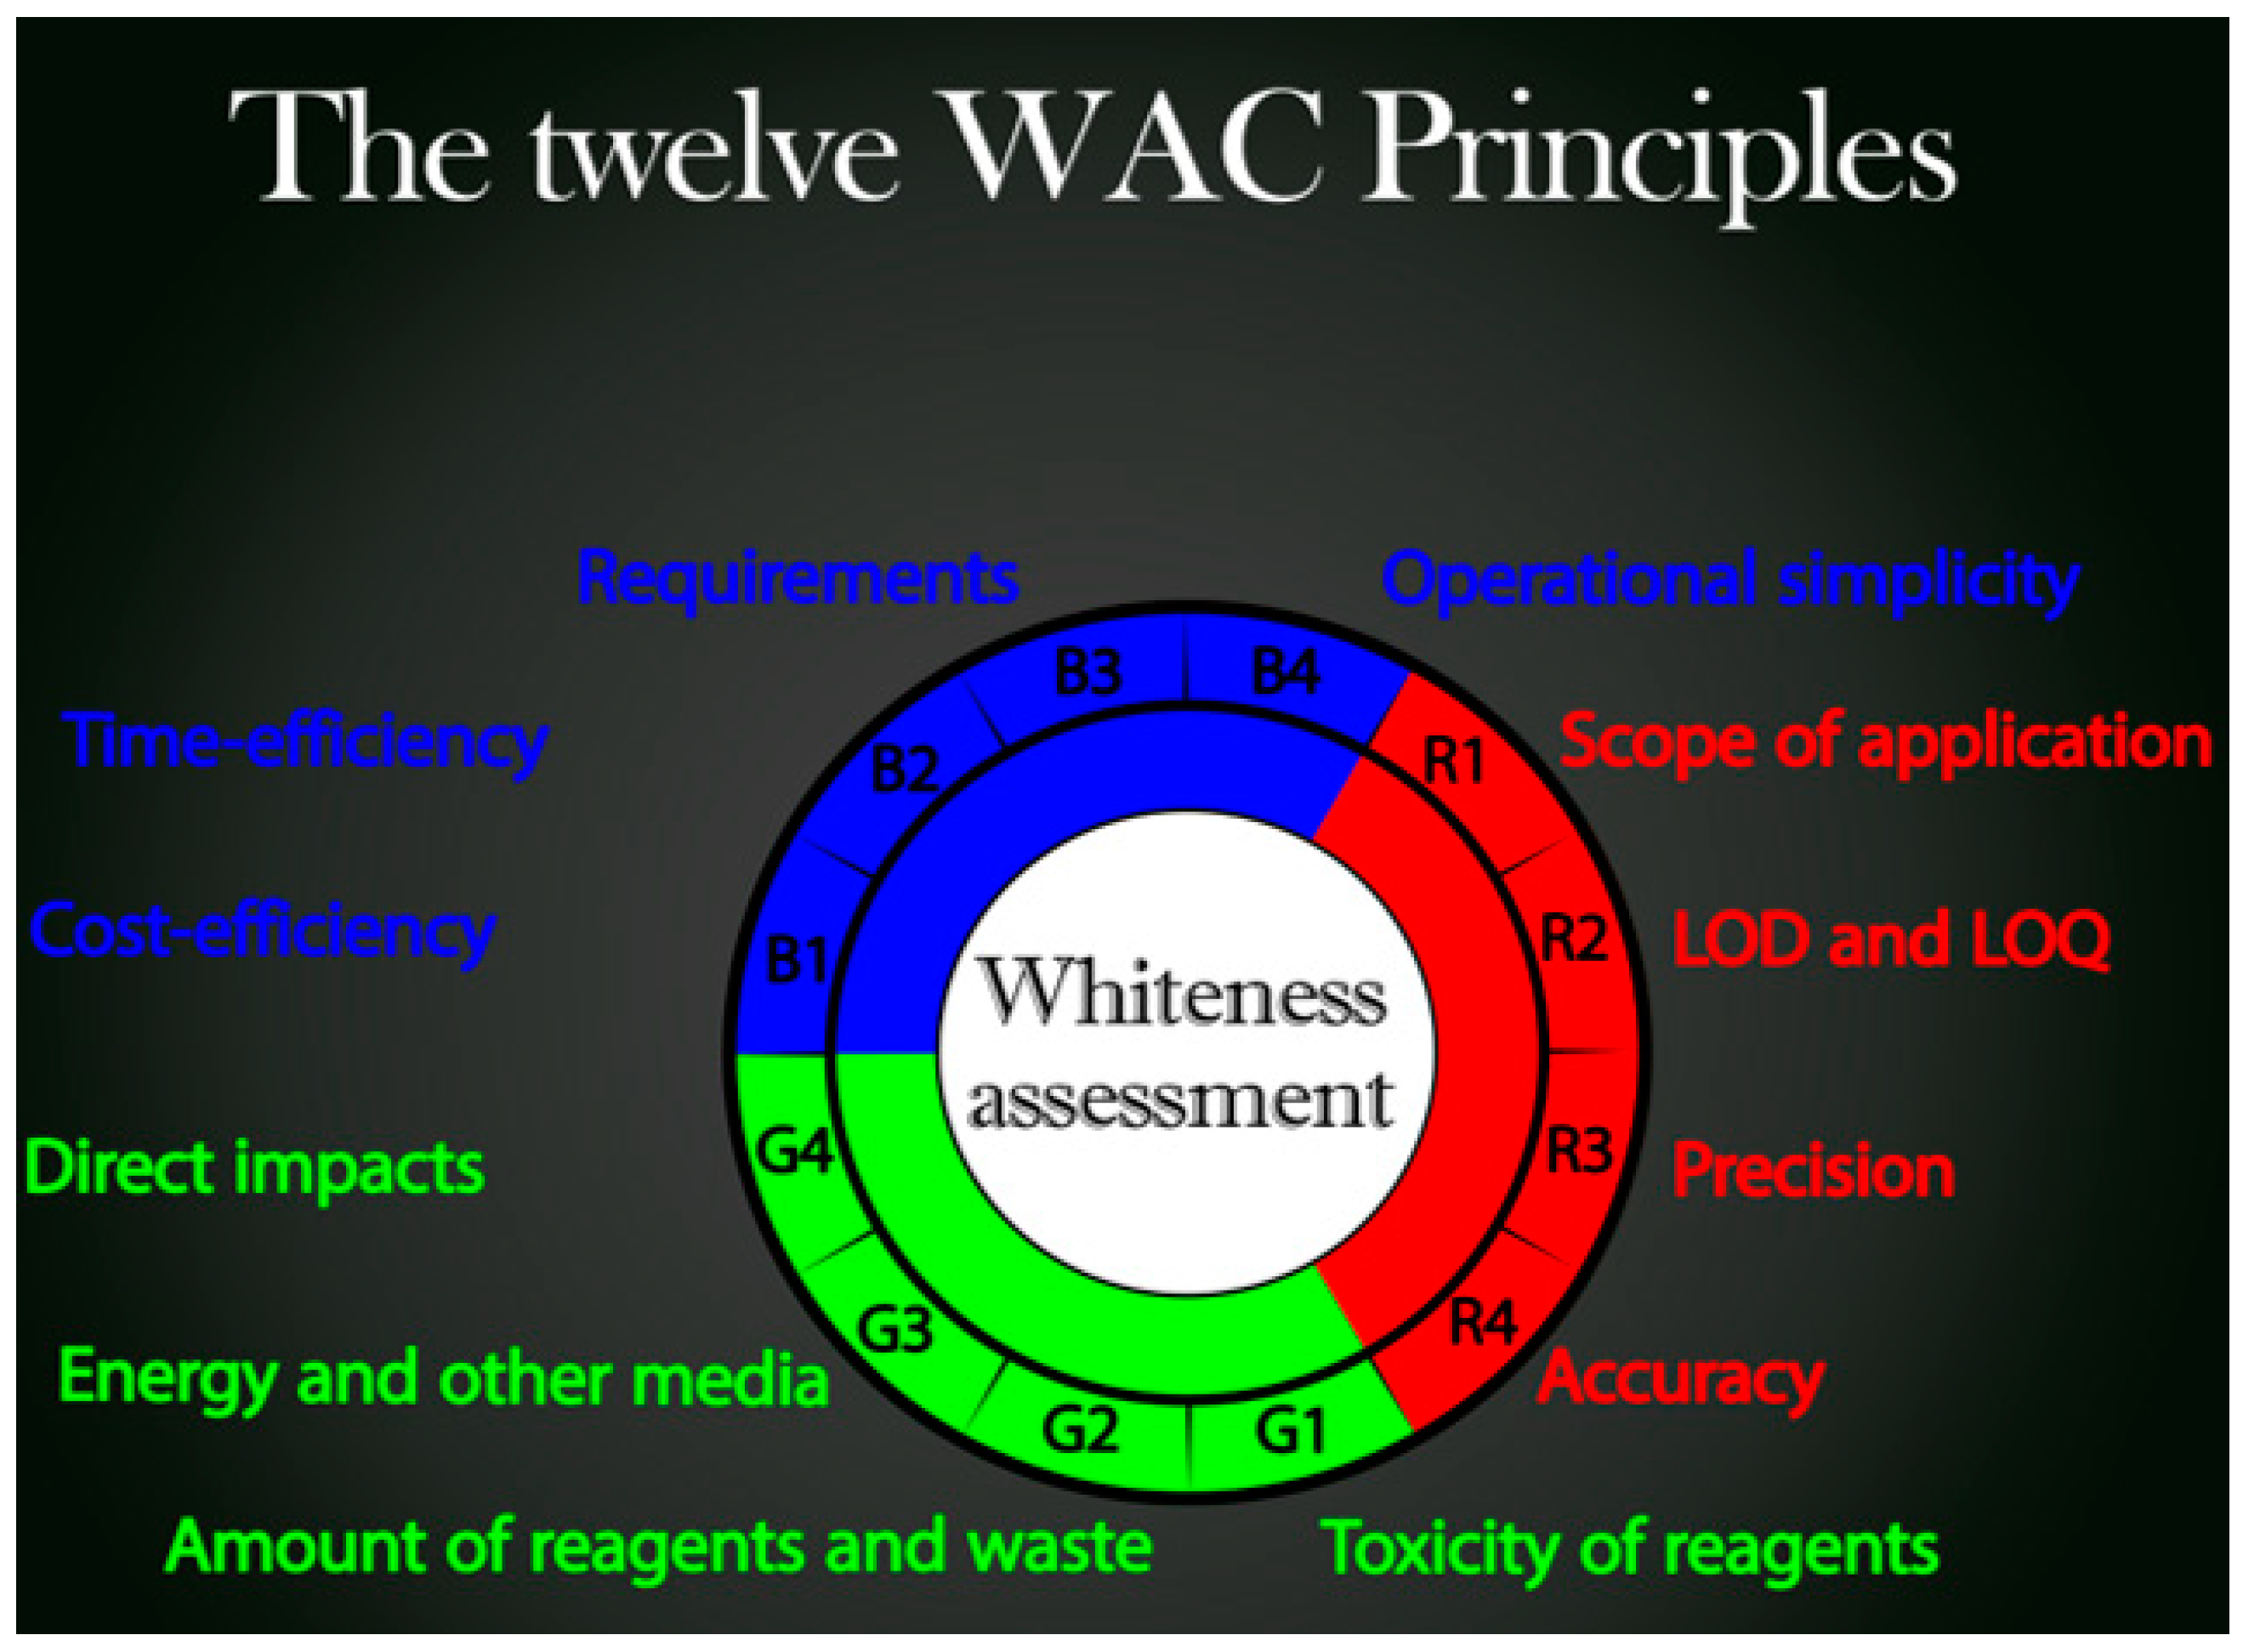
The WAC tool generally evaluates and categorizes developed analytical methods as white methods or not. Their evaluations are connected to several productive working (red and blue scores) and environmental issues (green scores). Thus, the color white is created by combining these three primary colors (green, red, and blue) [47,48].
The 12 concepts of the WAC tool were created by combining the essential concepts of GAC (G1, G2, G3, and G4) [5], with four red concepts related to the validity of the methods (R1, R2, R3, and R4) and four blue economic concepts (B1, B2, B3, and B4). Figure 9 clarifies each previous symbol related to WAC concepts. All WAC concepts should be understood to be crucial for achieving a sustainable analytical method.
The RFX presented in the commercial tablet dosage forms with eco-friendly features was successfully quantified using the suggested spectrofluorimetric tool. The drug was dissolved in 10 mL of ethanol, which is regarded as a green solvent; the remaining volume of the sample was then completed with green distilled water as a diluting solvent. Moreover, the linearity ranged between 0.4 and 5.0 μg per mL with a LOD value of 0.155 µg/mL, indicating the sensitivity and suitability of the introduced tool for the determination of different RFX I matrices.
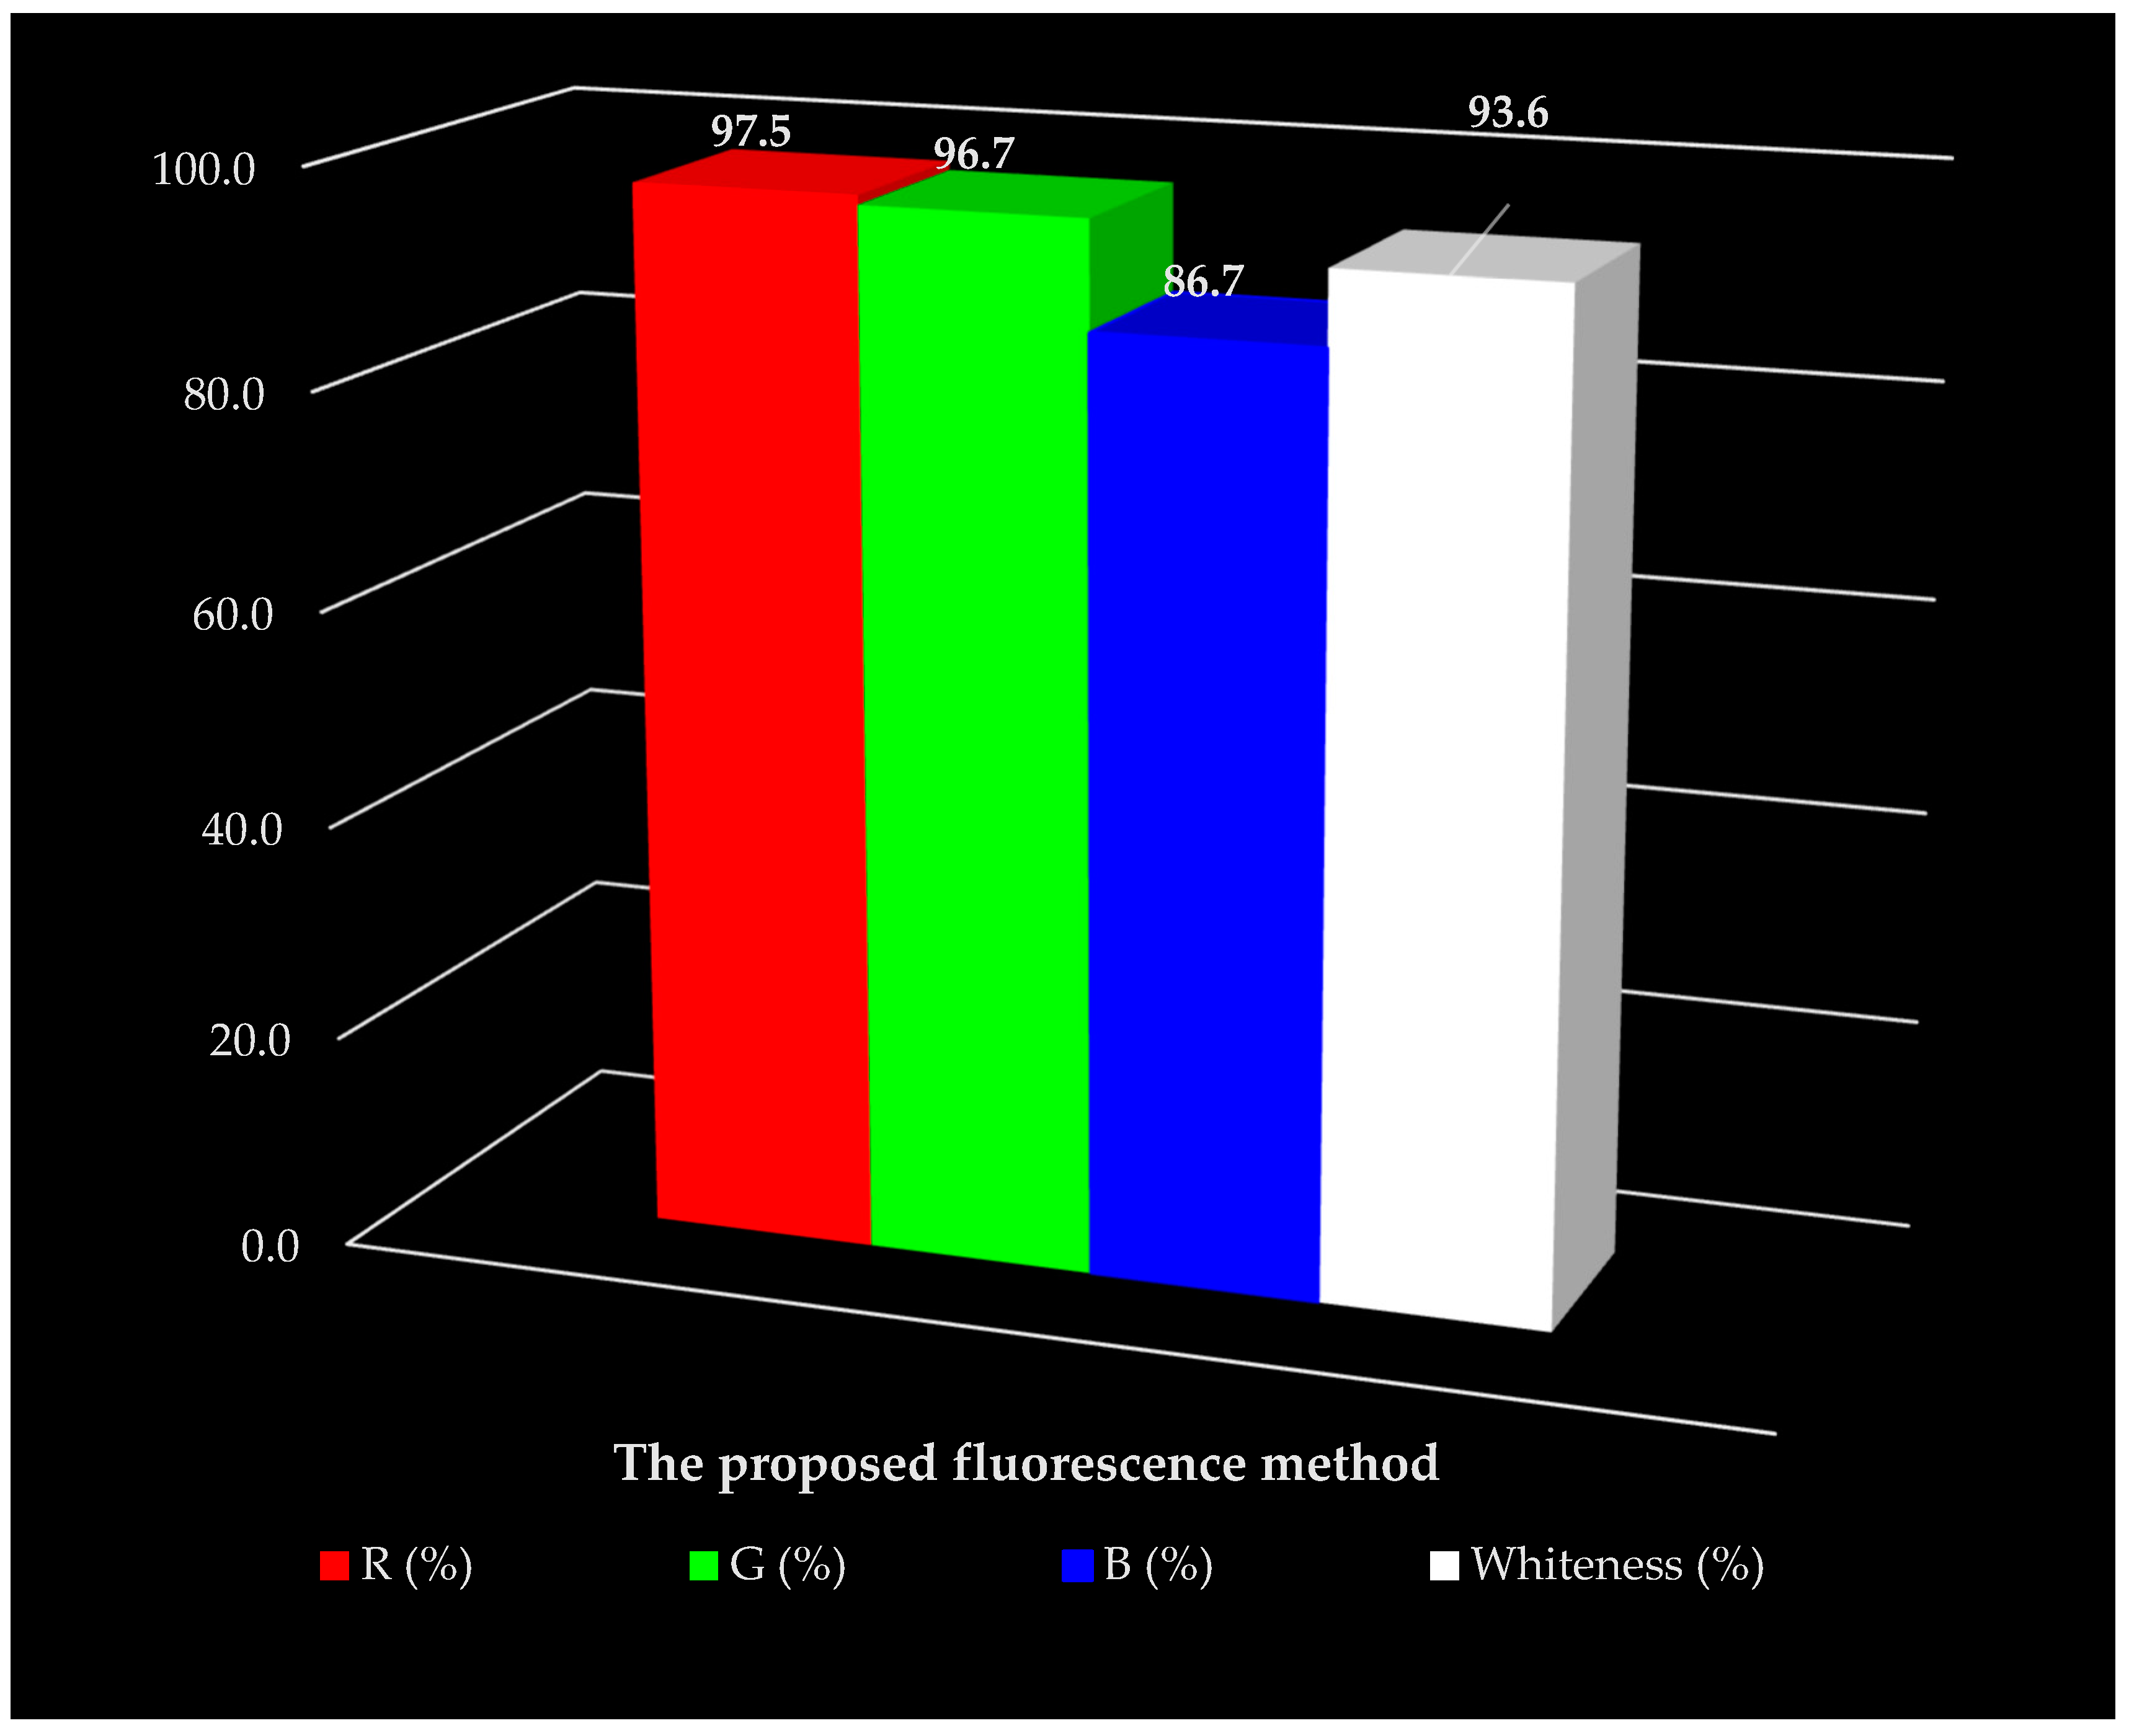
As the results revealed, the suggested method had an average (RED) WAC principal trueness value of 97.5% across all validation parameters, which is excellent. The highest (GREEN) G (%) result of almost 96.7%, an average value, is when using less of the green solvent such as ethanol and producing less waste by using water as a diluting solvent (G1 and G2 principles).
However, the utilized carbon dots required a lengthy preparation process, and since europium chloride was used in their creation, the pricey evaluation of the (BLUE) features also yielded a subpar result of about 86.7%. (B1 and B2 principles).
However, the suggested spectrofluorimetric tool is the first method to use these features in the determination of RFX antibiotic drugs. The method had an acceptable whiteness score (an average of the predetermined RED, GREEN, and BLUE) is approximately 94%, which indicated the sustainable whiteness of the proposed tool (Figure 10), and more details related to the score obtained by WAC tool can be found in Table 4.

5. Conclusions

In conclusion, the first fluorescence method was developed as a sensing platform that relied on the fluorescence activity of carbon dots and the strategy of the inner filter effect. In this system, RFX can act as a light absorber, whereas the absorbance spectrum of RFX is thoroughly overlapped with the two fluorescence spectra (emission and excitation) of carbon dots. Based on this sensing platform, the proposed green and sustainable white spectrofluorimetric tool for the determination of RFX was designed and validated either in bulk powder or in its pharmaceutical dosage form. Compared to the advantages of prior spectroscopic techniques utilized to determine RFX, the fundamental merits of the current methodology are its simplicity, low cost, adequate sensitivity, and selectivity toward RFX reflected on the high score in G complex, AGREE, and WAC assessment tools. The comparison of the three previously mentioned metrics shows that all metrics are uncomplicated to use when evaluating greenness data of the developed method due to the open programs and the Excel data sheet that are simple to use and can be downloaded for free. The evaluation result of the AGREE metrics immediately appeared in a digitally colored pictograph with a number which provided us with a rapid visual impression of the greenness of the method. The Complex-GAPI pictograph is produced after the analyzer in Complex-GAPI chooses the suitable parameters from drop-down boxes that correspond to the pre-analysis technique related to the sample preparation and the analysis stages. The AGREE tool does not include this criterion. In the WAC tool, the validity principle of the developed method is directly related to the obtained sustainability score; this property with green and economic principles is connected to produce the 12 WAC principles and the final whiteness score. Just the WAC tool takes the validity of the developed analytical method into consideration for the final score of the environmental and sustainability evaluation. The developed fluorescence method allows for accurate and precise RFX determination, which has led to its use in quality control and laboratory research.

Author Contributions

Conceptualization, M.A.A.-L.; Methodology, M.A.A.-L.; Software, M.A.E.H., B.S.M. and R.F.A.-K.; Validation, M.A.E.H., M.A.A. (Marzough Aziz Albalawi), H.G., B.S.M., R.F.A.-K., R.H.O., W.T.A., S.F.S., M.A.A. (Manal A. Alossaimi) and M.A.A.-L.; Formal analysis, M.A.E.H., B.S.M. and R.F.A.-K.; Investigation, M.A.E.H., H.G., B.S.M., R.F.A.-K., R.H.O., W.T.A., S.F.S., M.A.A. (Manal A. Alossaimi) and M.A.A.-L.; Resources, M.A.E.H., B.S.M. and R.F.A.-K.; Data curation, M.A.E.H., M.A.A. (Marzough Aziz Albalawi), H.G., B.S.M., R.F.A.-K., R.H.O., W.T.A., S.F.S. and M.A.A. (Manal A. Alossaimi); Writing—review & editing, M.A.E.H., M.A.A. (Marzough Aziz Albalawi), H.G., B.S.M., R.F.A.-K., R.H.O., W.T.A., S.F.S. and M.A.A. (Manal A. Alossaimi); Visualization, M.A.A.-L.; Supervision, M.A.A.-L. All authors have read and agreed to the published version of the manuscript.

Funding

This research received no external funding.

Institutional Review Board Statement

Not Applicable.

Informed Consent Statement

Not Applicable.

Data Availability Statement

The datasets generated during and/or analyzed during the current study are available from the corresponding author upon reasonable request.

Acknowledgments

The authors would like to thank the Deanship of Scientific Research at Shaqra University for supporting this work.

Conflicts of Interest

The authors declare no conflict of interest.

References

  1. Mitchell, C.M.; Drossman, D.A. Survey of the AGA Membership Relating to Patients with Functional Gastrointestinal Disorders. Gastroenterology 1987, 92, 1282–1284. [Google Scholar] [CrossRef] [PubMed]
  2. Pimentel, M.; Morales, W.; Chua, K.; Barlow, G.; Weitsman, S.; Kim, G.; Amichai, M.M.; Pokkunuri, V.; Rook, E.; Mathur, R.; et al. Effects of Rifaximin Treatment and Retreatment in Nonconstipated IBS Subjects. Dig. Dis. Sci. 2011, 56, 2067–2072. [Google Scholar] [CrossRef] [PubMed]
  3. Bae, S.; Lee, K.J.; Kim, Y.-S.; Kim, K.-N. Determination of Rifaximin Treatment Period According to Lactulose Breath Test Values in Nonconstipated Irritable Bowel Syndrome Subjects. J. Korean Med. Sci. 2015, 30, 757–762. [Google Scholar] [CrossRef] [PubMed]
  4. Rao, R.N.; Shinde, D.D.; Agawane, S.B. Rapid determination of rifaximin in rat serum and urine by direct injection on to a shielded hydrophobic stationary phase by HPLC. Biomed. Chromatogr. 2009, 23, 563–567. [Google Scholar] [CrossRef] [PubMed]
  5. Sama, C.; Morselli-Labate, A.M.; Pianta, P.; Lambertini, L.; Berardi, S.; Martini, G. Clinical effects of rifaximin in patientswith hepatic encephalopathy intolerant or nonresponsive to previous lactulose treatment: An open-label, pilot study. Curr. Ther. Res. 2004, 65, 413–422. [Google Scholar] [CrossRef]
  6. Steffen, R.; Sack, D.A.; Riopel, L.; Jiang, Z.-D.; Stürchler, M.; Ericsson, C.D.; Lowe, B.; Waiyaki, P.; White, M.; DuPont, H.L. Therapy of travelers’ diarrhea with rifaximin on various continents. Am. J. Gastroenterol. 2003, 98, 1073–1078. [Google Scholar] [CrossRef]
  7. Pimentel, M.; Lembo, A.; Chey, W.D.; Zakko, S.; Ringel, Y.; Yu, J.; Mareya, S.M.; Shaw, A.L.; Bortey, E.; Forbes, W.P. Rifaximin Therapy for Patients with Irritable Bowel Syndrome without Constipation. N. Engl. J. Med. 2011, 364, 22–32. [Google Scholar] [CrossRef]
  8. Pimentel, M.; Park, S.; Mirocha, J.; Kane, S.V.; Kong, Y. The effect of a nonabsorbed oral antibiotic (rifaximin) on the symptoms of the irritable bowel syndrome: A randomized trial. Ann. Intern. Med. 2006, 145, 557–563. [Google Scholar] [CrossRef]
  9. Sharara, A.I.; Aoun, E.; Abdul-Baki, H.; Mounzer, R.; Sidani, S.; ElHajj, I. A Randomized Double-Blind Placebo-Controlled Trial of Rifaximin in Patients with Abdominal Bloating and Flatulence. Am. J. Gastroenterol. 2006, 101, 326–333. [Google Scholar] [CrossRef]
  10. Rao, R.N.; Vali, R.M.; Shinde, D.D. On-line 2D-LC-ESI/MS/MS determination of rifaximin in rat serum. Biomed. Chromatogr. 2009, 23, 1145–1150. [Google Scholar] [CrossRef]
  11. Rao, R.N.; Vali, R.M.; Rao, A.V.P. Determination of rifaximin in rat serum by ionic liquid based dispersive liquid-liquid microextraction combined with RP-HPLC. J. Sep. Sci. 2012, 35, 1945–1952. [Google Scholar] [CrossRef]
  12. Abdellatef, R.; Khaled, E.; Hendawy, H.A.; Hassan, R.Y. Manganese Dioxide (MnO2)/Fullerene-C60-Modified Electrodes for the Voltammetric Determination of Rifaximin. J. Anal. Test. 2021, 5, 341–349. [Google Scholar] [CrossRef]
  13. Kogawa, A.C.; Salgado, H.R.N. Quantification of Rifaximin in Tablets by Spectrophotometric Method Ecofriendly in Ultraviolet Region. Scientifica 2016, 2016, 3463405. [Google Scholar] [CrossRef]
  14. Brbaklic, V.; Kogawa, A.C.; Salgado, H.R.N. Quantification of Rifaximin in Tablets by an Environmentally Friendly Visible Spectrophotometric Method. Curr. Pharm. Anal. 2017, 13, 532–537. [Google Scholar] [CrossRef]
  15. Kogawa, A.C.; Salgado, H.R.N. Spectrophotometry in Infrared Region: A New, Low Cost and Green Way to Analyze Tablets of Rifaximin. Curr. Pharm. Anal. 2018, 14, 108–115. [Google Scholar] [CrossRef]
  16. Prajapati, K.V.; Raj, H.A.; Jain, V.C. Simultaneous determination of mesalazine and rifaximin in synthetic mixture using spectrophotometric technique (simultaneous equation method). Asian J. Pharm. Anal. 2016, 6, 61–67. [Google Scholar] [CrossRef]
  17. Abdel-Lateef, M.A. Utilization of the peroxidase-like activity of silver nanoparticles nanozyme on O-phenylenediamine/H2O2 system for fluorescence detection of mercury (II) ions. Sci. Rep. 2022, 12, 6953. [Google Scholar] [CrossRef]
  18. Abdel-Lateef, M.A.; Almahri, A. Spectrofluorimetric determination of α-difluoromethylornithine through condensation with ninhydrin and phenylacetaldehyde: Application to pharmaceutical cream and spiked urine samples. Chem. Pap. 2021, 76, 741–748. [Google Scholar] [CrossRef]
  19. Abdel-Lateef, M.A.; Alzahrani, E.; Pashameah, R.A.; Almahri, A.; Abu-Hassan, A.A.; El Hamd, M.A.; Mohammad, B.S. A specific turn-on fluorescence probe for determination of nitazoxanide based on feasible oxidation reaction with hypochlorite: Applying cobalt ferrite nanoparticles for pre-concentration and extraction of its metabolite from real urine samples. J. Pharm. Biomed. Anal. 2022, 219, 114941. [Google Scholar] [CrossRef]
  20. Han, Z.; Long, Y.; Pan, S.; Liu, H.; Yang, J.; Hu, X. Efficient one-pot synthesis of carbon dots as a fluorescent probe for the selective and sensitive detection of rifampicin based on the inner filter effect. Anal. Methods 2018, 10, 4085–4093. [Google Scholar] [CrossRef]
  21. AlSalem, H.S.; Binkadem, M.S.; Al-Goul, S.T.; Abdel-Lateef, M.A. Synthesis of green emitted carbon dots from Vachellia nilotica and utilizing its extract as a red emitted fluorescence reagent: Applying for visual and spectroscopic detection of iron (III). Spectrochim. Acta Part A Mol. Biomol. Spectrosc. 2023, 295, 122616. [Google Scholar] [CrossRef] [PubMed]
  22. Chen, S.; Yu, Y.-L.; Wang, J.-H. Inner filter effect-based fluorescent sensing systems: A review. Anal. Chim. Acta 2018, 999, 13–26. [Google Scholar] [CrossRef] [PubMed]
  23. Yan, F.; Sun, Z.; Pang, J.; Jiang, Y.; Zheng, W. Functionalized carbon dots of thiazole derivatives based on inner filter effect for tetracyclines detection. Dye. Pigment. 2020, 183, 108673. [Google Scholar] [CrossRef]
  24. Gałuszka, A.; Migaszewski, Z.; Namiesnik, J. The 12 principles of green analytical chemistry and the SIGNIFICANCE mnemonic of green analytical practices. TrAC Trends Anal. Chem. 2013, 50, 78–84. [Google Scholar] [CrossRef]
  25. Armenta, S.; De La Guardia, M. Green Spectroscopy: A Scientometric Picture. Spectrosc. Lett. 2009, 42, 277–283. [Google Scholar] [CrossRef]
  26. Lotfy, H.M.; Obaydo, R.H.; Sakur, A.A. Evaluation of assay and in-vitro dissolution profile of certain fixed-dose combination using green analytical method. In Annales Pharmaceutiques Françaises; Elsevier Masson: Îledefrance, France, 2020; Volume 79, pp. 3–15. [Google Scholar] [CrossRef]
  27. Obaydo, R.H.; Sakur, A.A. A Green Analytical Method using Algorithm (PCCA) for Extracting Components’ Contribution from Severely Overlapped Spectral Signals in Pharmaceutical Mixtures. Res. J. Pharm. Technol. 2019, 12, 4332–4338. [Google Scholar] [CrossRef]
  28. Shahraki, H.S.; Ahmad, A.; Bushra, R. Green carbon dots with multifaceted applications—Waste to wealth strategy. Flatchem 2021, 31, 100310. [Google Scholar] [CrossRef]
  29. Abdel-Lateef, M.A.; Albalawi, M.A.; Al-Ghamdi, S.N.; Mahdi, W.A.; Alshehri, S.; El Hamd, M.A. Determination of metanil yellow dye in turmeric powder using a unique fluorescence Europium doped carbon dots. Spectrochim. Acta Part A Mol. Biomol. Spectrosc. 2023, 287, 122124. [Google Scholar] [CrossRef]
  30. Albalawi, M.A.; Gomaa, H.; El Hamd, M.A.; Abourehab, M.A.S.; Abdel-Lateef, M.A. Detection of Indigo Carmine dye in juices via application of photoluminescent europium-doped carbon dots from tannic acid. Luminescence 2022, 38, 92–98. [Google Scholar] [CrossRef]
  31. Ghafarloo, A.; Sabzi, R.E.; Samadi, N.; Hamishehkar, H. Sensitive and selective spectrofluorimetric determination of clonazepam using nitrogen-doped carbon dots. J. Photochem. Photobiol. A Chem. 2019, 388, 112197. [Google Scholar] [CrossRef]
  32. Ma, Y.; Song, Y.; Ma, Y.; Wei, F.; Xu, G.; Cen, Y.; Shi, M.; Xu, X.; Hu, Q. N-doped carbon dots as a fluorescent probe for the sensitive and facile detection of carbamazepine based on the inner filter effect. New J. Chem. 2018, 42, 8992–8997. [Google Scholar] [CrossRef]
  33. Abdel-Lateef, M.A.; Almahri, A. Micellar sensitized Resonance Rayleigh Scattering and spectrofluorometric methods based on isoindole formation for determination of Eflornithine in cream and biological samples. Spectrochim. Acta Part A Mol. Biomol. Spectrosc. 2021, 258, 119806. [Google Scholar] [CrossRef]
  34. Almahri, A.; Abdel-Lateef, M.A. Application of Hantzsch reaction for sensitive determination of eflornithine in cream, plasma and urine samples. R. Soc. Open Sci. 2021, 8, 210366. [Google Scholar] [CrossRef]
  35. ICH Harmonised Tripartite Guideline Q2 (R1), Validation of Analytical Procedures. Text and Methodology, Current Step 4 Versions, Parent Guideline on Methodology Dated November 1996, Incorporated in November 2005. Available online: https://database.ich.org/sites/default/files/Q2%28R1%29%20Guideline.pdf (accessed on 10 March 2023).
  36. Almahri, A.; Abdel-Lateef, M.A. Applying different spectroscopic techniques for the selective determination of daclatasvir using merbromin as a probe: Applications on pharmaceutical analysis. Luminescence 2021, 36, 1544–1552. [Google Scholar] [CrossRef]
  37. Anastas, P.T.; Warner, J.C. Green chemistry. Frontiers 1998, 640, 1998. [Google Scholar]
  38. Abdel-Lateef, M.A.; Almahri, A.; Alzahrani, E.; Pashameah, R.A.; Abu-Hassan, A.A.; El Hamd, M.A. Sustainable PVP-Capped Silver Nanoparticles as a Free-Standing Nanozyme Sensor for Visual and Spectrophotometric Detection of Hg2+ in Water Samples: A Green Analytical Method. Chemosensors 2022, 10, 358. [Google Scholar] [CrossRef]
  39. Płotka-Wasylka, J.; Wojnowski, W. Complementary green analytical procedure index (ComplexGAPI) and software. Green Chem. 2021, 23, 8657–8665. [Google Scholar] [CrossRef]
  40. Pena-Pereira, F.; Wojnowski, W.; Tobiszewski, M. AGREE—Analytical GREEnness Metric Approach and Software. Anal. Chem. 2020, 92, 10076–10082. [Google Scholar] [CrossRef]
  41. Nowak, P.M.; Wietecha-Posłuszny, R.; Pawliszyn, J. White Analytical Chemistry: An approach to reconcile the principles of Green Analytical Chemistry and functionality. TrAC Trends Anal. Chem. 2021, 138, 116223. [Google Scholar] [CrossRef]
  42. Sajid, M.; Płotka-Wasylka, J. Green analytical chemistry metrics: A review. Talanta 2021, 238, 123046. [Google Scholar] [CrossRef]
  43. Martínez, J.; Cortés, J.F.; Miranda, R. Green Chemistry Metrics, A Review. Processes 2022, 10, 1274. [Google Scholar] [CrossRef]
  44. Chanduluru, H.K.; Sugumaran, A. Assessment of greenness for the determination of voriconazole in reported analytical methods. RSC Adv. 2022, 12, 6683–6703. [Google Scholar] [CrossRef] [PubMed]
  45. El-Eryan, R.T.; Toubar, S.S.; Ashour, A.A.; Elshahed, M.S. Application of analytical Eco-Scale and Complex-GAPI tools for green assessment of a new simple nanoparticle modified carbon paste electrode method for voltammetric determination of mosapride citrate in pharmaceutical dosage form and human plasma. Microchem. J. 2022, 178, 107347. [Google Scholar] [CrossRef]
  46. Kayali, Z.; Obaydo, R.H.; Sakur, A.A. Spider diagram and sustainability evaluation of UV-methods strategy for quantification of aspirin and sildenafil citrate in the presence of salicylic acid in their bulk and formulation. Heliyon 2023, 9, 15260. [Google Scholar] [CrossRef]
  47. Lotfy, H.M.; Obaydo, R.H.; Nessim, C.K. Spider chart and whiteness assessment of synergistic spectrophotometric strategy for quantification of triple combination recommended in seasonal influenza—Detection of spurious drug. Sustain. Chem. Pharm. 2023, 32, 100980. [Google Scholar] [CrossRef]
  48. El-Hanboushy, S.; Marzouk, H.M.; Fayez, Y.M.; Abdelkawy, M.; Lotfy, H.M. Sustainable spectrophotometric determination of antihypertensive medicines reducing COVID-19 risk via paired wavelength data processing technique—Assessment of purity, greenness and whiteness. Sustain. Chem. Pharm. 2022, 29, 100806. [Google Scholar] [CrossRef] [PubMed]
Figure 1. Chemical structure of rifaximin.
Chemosensors 11 00275 g001
Figure 2. Characterization of the produced carbon dots: (A) for TEM; (B) for excitation and emission fluorescence spectra, (C) for FTIR spectrum.
Chemosensors 11 00275 g002aChemosensors 11 00275 g002b
Figure 3. (A) For the absorbance spectrum for rifaximin and (B) for quenching the fluorescence emission spectrum of the produced carbon dots by rifaximin.
Chemosensors 11 00275 g003
Figure 4. Effect of pH and volume of the reagent on the quenching of the fluorescence intensity of the prepared carbon dots for determining RFX (3.0 µg/mL).
Chemosensors 11 00275 g004
Figure 5. Construction of the calibration curve for the determination of RFX by the proposed spectrofluorimetric method.
Chemosensors 11 00275 g005
Figure 6. The Complex-GAPI pictogram, with specific fields of the new hexagonal graphic grouped and color-coded for clarifying the theory of greenness evaluation and each block’s explanation.
Chemosensors 11 00275 g006
Figure 7. The result of the GAPI-complex for assessing the proposed spectrofluorometric method and the preparation of carbon dots.
Chemosensors 11 00275 g007
Figure 8. Evaluation of the proposed spectrofluorometric method using AGREE tool in accordance with the 12 GAC criteria.
Chemosensors 11 00275 g008
Figure 9. The 12 principles of the WAC tool and the criteria related to each symbol (G1, G2, G3, G4, B1, B2, B3, B4, R1, R2, R3, and R4).
Chemosensors 11 00275 g009
Figure 10. The whiteness results for the fluorescence method used to determine RFX.
Chemosensors 11 00275 g010
Table 1. Analytical parameters for the determination of RFX by the proposed method.
Statistical ParameterResult
λexem373 nm/435 nm
Linear range (µg/mL)0.4–5.0
Intercept0.0367
Standard error of intercept6.2 × 10−3
Standard error8.1 × 10−3
Slope0.123
Standard error of the slope 2.0 × 10⁻³
LOD (µg/mL)0.155
Correlation coefficient (r)0.9995
The determination coefficient (r2)0.9990
Table 2. Evaluation of accuracy and precision for the determination of RFX by the proposed method.
Validation Parameterμg/mL%Recovery ± RSD
Intra-day precision1.0101.57 ± 1.47
3.098.40 ± 1.01
4.0100.35 ± 1.71
Inter-day precision1.097.67 ± 2.08
3.099.80 ± 1.36
4.0100.43 ± 0.85
Accuracy1.0100.21 ± 1.92
2.099.84 ± 1.97
4.0101.17 ± 1.25
Table 3. Analysis of RFX in the presence of some common excipients by the proposed method.
ExcipientThe Amount Added (μg/mL)RFX (μg/mL)% Recovery ± SD (n = 3)
Starch10.03.099.05 ± 0.68
Dextrose10.03.098.22 ± 0.79
Lactose10.03.0101.32 ± 1.32
Mannitol10.03.0100.58 ± 1.71
Carboxymethylcellulose10.03.099.89 ± 1.04
Sorbitol10.03.098.87 ± 1.40
Table 4. Evaluation of the fluorescence method for determination of RFX according to the 12 principles of WAC, performed using the WAC tool.
The Proposed Method
R1: Scope of application100.0G1: Toxicity of reagents90.0B1: Cost-efficiency80.0
R2: LOD and LOQ100.0G2: Amount of reagents and waste100.0B2: Time-efficiency100.0
R3: Precision90.0G3: Energy and other media100.0B3: Requirements75.0
R4: Accuracy100.0G4: Direct impacts96.7B4: Operational simplicity91.7
97.596.786.7
93.6
Disclaimer/Publisher’s Note: The statements, opinions and data contained in all publications are solely those of the individual author(s) and contributor(s) and not of MDPI and/or the editor(s). MDPI and/or the editor(s) disclaim responsibility for any injury to people or property resulting from any ideas, methods, instructions or products referred to in the content.