Article

Recyclable Multifunctional Magnetic Fe3O4@SiO2@Au Core/Shell Nanoparticles for SERS Detection of Hg (II)

1
Information Materials and Intelligent Sensing Laboratory of Anhui Province, Institute of Physical Science and Information Technology, Anhui University, Hefei 230601, China
2
School of Chemical and Environmental Engineering, Anhui Polytechnic University, Wuhu 241000, China
3
Anhui Graphene Engineering Laboratory, Key Laboratory of Structure and Functional Regulation of Hybrid Materials, Ministry of Education, Institutes of Physical Science and Information Technology, Anhui University, Hefei 230601, China
4
School of Materials Science and Engineering, Anhui University, Hefei 230601, China
*
Authors to whom correspondence should be addressed.
Chemosensors 2023, 11(6), 347; https://doi.org/10.3390/chemosensors11060347
Submission received: 6 April 2023 / Revised: 31 May 2023 / Accepted: 5 June 2023 / Published: 15 June 2023

Abstract

:
Mercury ions can be enriched along the food chain and even low concentrations of mercury ions can seriously affect human health and the environment. Therefore, rapid, sensitive, and highly selective detection of mercury ions is of great significance. In this work, we synthesized Fe3O4@SiO2@Au three-layer core/shell nanoparticles, and then modified 4-MPy (4-mercaptopyridine) to form a SERS sensor. Mercury ions in water can be easily captured by 4-MPy which were used as the reporter molecules, and the concentration of mercury ions can be evaluated based on the spectral changes (intensification and reduction of peaks) from 4-MPy. After the mercury ion was combined with the pyridine ring, the peak intensity at 1093 cm−1 increased with the concentration of mercury ion in the range of 10 ppm–1 ppb, while the Raman intensity ratio I (416 cm−1)/I (436 cm−1) decreased with the increase of mercury ion concentration. This magnetically separatable and recyclable SERS sensor demonstrates good stability, accuracy, and anti-interference ability and shows the potential to detect actual samples. Furthermore, we demonstrate that the probe is applicable for Hg2+ imaging in macrophage cells.

1. Introduction

Heavy metal ions are among the main pollutants of environmental waters, in particular, the Hg (II) ions have been a concern for a long time due to its serious damage to human health and the environment [1,2]. According to the legislative controls directed by U. S. Environmental Protection Agency (USEPA), the maximum concentration of Hg (II) in drinking water is limited to 2 μg/L (2 ppb, 10 nM) [3]. In China, according to the National Drinking Water Quality Standards (GB5749-2006), the concentration limit of Hg (II) in drinking water is 1 μg/L (1 ppb, 5 nM) [4]. The pollution of the Hg2+ ions can prevent nutrient absorption and photosynthesis progresses in plants [5] and cause chronic poisoning of animals [6]. The Hg2+ exposure, even at relatively low concentrations, impairs human health and causes serious diseases including broken immune systems [7,8], kidney damage [9,10], nervous injury [11,12], memory disorders [13], and cognitive impairment [14]. Routine detection methods for trace Hg (II) include atomic fluorescence spectrometry (AFS) [15] inductively coupled plasma mass spectrometry (ICP-MS) [16], and atomic absorption/emission spectroscopy (AAS/AES) [17,18]. However, most of these techniques require higher-cost instruments or tedious sample processing, which made them high cost, time –consuming, and unsuitable for on-site analysis. Therefore, it is quite necessary to develop a highly specific and sensitive method for the instant detection of mercury and its compounds such as Hg (II) ion in environmental water systems.
Surface-enhanced Raman scattering (SERS) spectroscopy is a vibrational spectroscopy of adsorbed species on plasmonic nanomaterials with the advantages of rapid detection, high sensitivity, and high selectivity [19]. In the past ten years, SERS has been introduced to a variety of scenarios, especially in the fields of environmental analysis [20] and monitoring, biological detection [21], reaction mechanism [22], biological imaging [23], and so on due to its unique fingerprint spectrum, rapid data collection, and single-molecule sensitivity (according to reports, the enhancement factor of single-molecule SERS is as high as 1014–1015) [24].
Generally, the monatomic species are known to have no Raman scattering cross section, making it difficult to analyze directly by SERS spectroscopy [25]. Therefore, SERS detection of Hg (II) ions usually uses indirect methods. Raman reporter molecules are usually introduced to indirectly check the presence of Hg (II) ions in the sample [26]. The detection of Hg (II) ions can be realized by “turning on” or “turning off” the SERS signal of the Raman reporter. Wang et al. adopted rhodamine B as the reporter molecule. With the addition of Hg (II) ions, the rhodamin B was desorbed from the Au NPs surface, resulting in a decrease of SERS signal from rhodamine B [27]. Kang et al. used Hg (II) ions and silver nanoparticles (Ag-NP) that were coated with the dialkyne 1,4-diacetylene benzene (DEB) by chemical reaction, which led to the aggregation of Ag-NPs and then a remarkable SERS signal intensity enhancement at 2146 cm−1 [28]. Duan et al. demonstrated that the Au NPs aggregated with the treatment of Bismuthiol II. The presence of Hg (II) ions can reverse the aggregation of AuNPs induced by Bismuthiol II, leading to a decrease in the SERS signal [29]. There are also research reports using T-Hg (II)-T metallo-base pair for mercury ion capture and detection. For example, Chung et al. synthesized Au/Ag core/shell nanoparticles conjugated with DNA chains. With the addition of Hg (II) ions, the immobilized DNA was released from the NP surface to form a T-Hg (II)-T hairpin structure [30], after the introduction of the label, the detection limit reached 10 ppm. Xu et al. prepared gold nanoparticles chains by the modification of DNA through the T-Hg (II)-T interaction, thereby significantly enhancing the Raman signals [31]. Although these methods can easily observe the increase and the decrease of the SERS signal intensity, some interfering factors including pH value, temperature, and other ions could introduce dramatic fluctuations in the spectrum and lead to false positives. Therefore, it is a challenge to develop a SERS sensor that can accurately and sensitively identify mercury ions in a relatively complex environment.
Among the various types of SERS sensor, we focus on the multifunctional Fe3O4@SiO2@Au nanoparticles due to the following reasons. Fe3O4@SiO2@Au is a three-layer core/shell nanostructure and the core is a Fe3O4 nanoparticle with super paramagnetism. The introduction of Magnetic Nanoparticles (MNPs) into SERS can effectively separate and enrich the target from complex environmental samples [32]. It also reduces the interference of the matrix in the sample to improve the accuracy and sensitivity of the detection result [33]. The magnetic responsiveness of MNP makes it reusable, thereby reducing test costs and secondary environmental pollution [34]. The silicon dioxide is coated on the ferro ferric oxide core, which can not only flexibly adjust the size of the entire core/shell structure, but also prevent the oxidation and aggregation of the core [35]. Gold nanoparticles have good stability, SERS activity, and good biological compatibility, which increases their ability to recognize pollutants in organisms [36].
In this work, Fe3O4@SiO2@Au magnetic nanoparticles were synthesized first and then modified with 4-mercaptopyridine (4-MPy) as the SERS signal reporter. Herein, 4-MPy is an excellent multifunctional SERS reporter molecule which has a thiol group that can bind to the gold surface, a pyridine ring with high Raman activity, and can easily capture mercury ions [37]. Therefore, in this work, 4-MPy molecule works as a surface modifier to effectively capture and detect the target Hg (II) ions. 4-MPy not only acts as a Raman Reporter but also serves as an indispensable Hg ion receptor. Mercury ions induced changes in the electronic distribution in 4-MPy, which caused a number of characteristic spectral changes including peak blue shift and Raman signal enhancement. With the addition of the Hg ions, the SERS signal of 4-MPy changes dramatically, including the appearance of a new peak located at 416 cm−1 and the Raman signal intensity enhancement at 1093 cm−1. In order to figure out the reasons for these Raman signal variations, the hybrid density functional (h-DFT) calculation is introduced to validate the electron distribution in pyridine and the reorientation of 4-MPy on the Au surface. Making use of the peak intensity enhancement at 1093 cm−1, we show that indirect determination of mercury ion concentration can be achieved with a good linear relationship between 10 ppm–1 ppb. In addition, the intensity ratio at I (416 cm−1)/I(436 cm−1) can also be used to judge the concentration of mercury ions. This allows the presented sensor to have multiple judgment rules for identifying Hg (II) ions. In addition, the sensor has excellent stability, selectivity, reproducibility, and recyclability. We have also successfully applied this sensor to Hg (II) ions monitoring in macrophages through Raman imaging.

2. Materials and Methods

2.1. Reagents and Materials

Ethylene glycol (EG), anhydrous ferric chloride (FeCl3), sodium acetate (NaAc), tetraethoxysilane (TEOS), sodium hydroxide (NaOH), ammonium hydroxide (NH3·H2O), Chloroauric acid (HAuCl4·4H2O), 4-mercaptopyridine (4-MPy, C5H4NS), ethanol (C2H5OH), formaldehyde (CH2O), and bovine serum albumin (BSA) purchased from Sinopharm Chemical Reagent Co., Ltd. (Shanghai, China). Ethylene imine polymer (PEI, MW ≈ 1800), Poly (4-styrenesulfonic acid-co-maleic acid) sodium salt (PSSMA, Mw ≈ 20 000, SS: MA = 1:1), Tetrakis(hydroxymethyl)phosphonium chloride (THPC), HgCl2, BaCl2·2H2O, CaCl2, NiCl2·6H2O, CoCl2·6H2O, MgSO4, CuSO4·5H2O, MnSO4·H2O, CrCl3·6H2O, AgNO3, NaCl, KCl, Pb(NO3)2, NaF, NaNO3, K2CO3, KH2PO4, and Na2HPO4·12H2O were bought from Aladdin. Dulbecco’s modified eagle medium (DMEM) high glucose cell culture medium was bought from Thermo Fisher, fetal bovine serum (FBS) was bought from Biowest, and penicillin−streptomycin solution (PSS) was bought from Solarbio.

2.2. Instrumentations

Scanning electron microscope (SEM) Hitachi SU8010 and transmission electron microscope (TEM, JEM-2010) were utilized for surface morphology, core/shell structure, and element composition. Measurement was implemented with a LabRAM HR Evolution spectrometer (HORIBA, Kyoto, Japan), equipped with a 785 nm laser (0.7 mW on sample), and a 50 × long working distance objective. The exposure time for each point was 30 s. The Raman mapping of SERS sensor test was carried out at 1 μm step size, with an integration time of 10 s per spectrum. For statistical analysis, Raman scans of 3600 points were recorded to obtain a large number of nanoparticles for the data set.

2.3. Synthesis of Fe3O4@SiO2@Au NPs

The synthesis process includes three stages: (1) synthesis of superparamagnetic Fe3O4 NPs, (2) encapsulation of Fe3O4 NPs with SiO2 shells, and (3) connection of Au NPs to Fe3O4@SiO2 surface.

2.3.1. Synthesis of Monodisperse Fe3O4 MNPs

The magnetic particles were synthesized by using a non-autoclave solvent-thermal method according to the reported method with minor modifications [38]. Typically, 40 mL ethylene glycol and 0.65 g FeCl3 were sequentially added into a 50 mL Erlenmeyer flask. After dissolution of the precursor, 1.0 g PSSMA and 0.1 mL H2O were added. Magnetic stirring was used for 1 h to obtain a homogeneous mixture, and then, 0.6 g NaOH was added to mixture. Finally, the magnetic bar was removed, and the solution was heated to 190 °C in Muffle furnace for 9 h followed by cooling to room temperature. The obtained black powder was washed with ethanol and water alternately. Finally, Fe3O4 MNPs were re-dispersed in 30 mL H2O.

2.3.2. Synthesis of Fe3O4@SiO2 MNPs

The method of synthesizing Fe3O4@SiO2 is based on the improved Stöber method of previous research [39]. The thickness of the SiO2 shell can be controlled by adjusting the molar ratio of TEOS, water, and ammonia. Typically, in a three-necked flask, 12 mL of aqueous dispersion of Fe3O4 NPs, 80 mL of ethanol, and 0.8 mL of ammonium hydroxide were mixed together and sonicated for 20 min. With mechanical stirring, 0.5 mL TEOS was dropwise injected into the solution. The reaction system was kept at 25 °C for 4 h. Consequently, the black precipitates of Fe3O4@SiO2 MNPs were washed with water 3 times. Finally, Fe3O4@SiO2 MNPs were redispersed in 30 mL H2O.

2.3.3. Functionalization of Fe3O4@SiO2 MNPs Surfaces

Fe3O4@SiO2 -PEI MNPs were synthesized by PEI self-assembly process [40]. The surface of silica nanoparticles can be easily modified by PEI. Typically, 0.5 g PEI was dissolved in 50 mL of deionized water by ultrasonication for 15 min. Then, 15 mL Fe3O4@SiO2 was dispersed in the PEI solution under mechanical stirring at room temperature for 10 h, during which PEI gradually self-assembled on the silica cores. The obtained Fe3O4@SiO2-PEI MNPs were centrifuged and washed 3 times with deionized water to remove the excess PEI. Finally, the PEI-functionalized Fe3O4@SiO2 MNPs were dispersed in 30 mL water.

2.3.4. Preparation of Gold Nanoparticles

The preparation method of 1–3 nm gold seeds follow the method developed by Duff et al. [41]. Specifically, 5 mL of 1 M NaOH was added to 450 mL of ultrapure water and 10 mL of 50 mM THPC was added under magnetic stirring. After 10 min, 0.36 mL of 1.0 M HAuCl4·3H2O was added and after stirring for 30 min, the gold seed solution was stored and aged at 4 °C for a week.

2.3.5. Preparation of Gold-Attached Fe3O4@SiO2 MNPs

According to the fact that negatively charged gold nanoparticles can be attached to the PEI functionalized silica core, the gold-attached Fe3O4@SiO2 nanocomposites were prepared through self-assembly [42]. Firstly, 10 mL Fe3O4@SiO2-PEI and 75 mL gold seed were added into 75 mL water, and the mixture reacted overnight to form SiO2@PEI-Au seed. Then, washed three times with water to remove excess unattached small gold nanoclusters, in order to avoid the growth of pure gold particles during the formation of the gold shell. Finally, the Fe3O4@SiO2-Au MNPs were dispersed in 6 mL water.

2.3.6. Preparation of Three-Layer Core/Shell Fe3O4@SiO2@Au Magnetic Nanocomposites

The three-layer core/shell Fe3O4@SiO2@Au MNPs were prepared by self-assembly, seed-mediated growth process and chemical reduction. A kind of plating solution containing reducible gold salt must be prepared in advance. In a conical flask, 0.1 g of potassium carbonate was dissolved in 400 mL of water. After stirring for 15 min, 6 mL of 1% HAuCl4 in water were added to obtain HAuCl4 plating solution. HAuCl4 plating solution was stored for a minimum of 48 h in the dark [43]. Finally, 1 mL Fe3O4@SiO2-Au was injected into 100 mL HAuCl4 plating solution with mechanical stirring. After ultrasonic for 5 min, 30 μL formaldehyde were added to reduce the HAuCl4. When the reaction solution turns purple–red, the reaction was stopped and the product was collected by magnetic separation and wash with water three times to obtain the three-layer core/shell Fe3O4@SiO2@Au magnetic nanocomposites [44].

2.4. Enhancement Factor (EF) Calculation

The magnetic nanoparticles were immersed in 4-MPy solution at different concentrations to prepare functionalized SERS sensor. As shown in Figure S1, a concentration of 10−5 M 4-MPy solution modified magnetic nanoparticles obtained the best SERS signal.
On another aspect, the SERS signals of the 4-MPy modified on the MNPs surface and the normal Raman signals of 4-MPy were compared. The average EF value was calculated according to the previous literature [45]:
E F = C R a m a n C S E R S I S E R S I R a m a n
where the ISERS and IRaman represent the Raman signal intensity recorded from the 4-MPy modified MNPs and from 4-MPy solution, respectively. The corresponding CSERS and CRaman are the concentration of 4-MPy on MNPs and the concentration of 4-MPy generating normal Raman signal. The SERS and normal Raman spectra of the 4-MPy were tested by micro confocal Raman spectrometer (HORIBA, Kyoto, Japan). The 100× objective lens and 785 nm laser was used. The concentration of the 4-MPy for normal Raman test was 10−3 M, and the concentration of the 4-MPy modified on MNPs was 10−5 M. The laser power lighted at samples was approximately 0.7 mW. The baseline correction was conducted by the Labspec 6 software. The intensity of the Raman peak located 1093 cm−1 was adopted to calculate the EF value, and the estimated average EF value was about 5.24 × 10⁴.

2.5. SERS Measurements of Hg (II) Ions

The magnetic SERS sensor was incubated with different concentrations of Hg (II) ions for 30 min. The reaction was stopped by removing the core/shell nanoparticles from the mixture through magnetic separation. After washing with pure water twice, 5 μL of the nanoparticle’s suspension was dropped on aluminum foil paper for Raman recording. The solution of the metal ions metal ions (Zn2+, Ca2+, Na+, Mg2+, Mn2+, Pb2+, Ba2+, Cu2+, Ag+, Ni2+, Cr3+ and Co2+), anions (PO43−, NO3, Cl, F, CO32−, CH3COO, H2PO4, HPO42−), protein (BSA) and humic acid were tested as the same procedure [46]. For the reusing performance test, an EDTA solution (10−3 M) was incubated with the nanoparticles solution for 1 h to refresh the nanoparticles. Different concentrations of Hg (II) ions (10 ppm–1 ppb) were mixed with the actual water samples collected from Chaohu lake to simulate polluted water. The particle suspension in the lake water was removed by double-layer filter paper, and then filtered with a 0.22 μm microporous filter [47,48]. The Raman test of the simulated samples was under the same condition.

2.6. Detection of Mercury Ions in Cells

J774 A1 murine macrophage cells were purchased from the Cellcook (Guangzhou, China). The cells were cultured in high-glucose Dulbecco’s Modified Eagle Medium (Gibco, Billings, MT, USA), supplemented with 10% fetal bovine serum (Gibco, Billings, USA) and 1% penicillin-streptomycin (Gibco, Billings, USA), and maintained at 37 °C in 95% air and 5% CO2 gas mixture [49,50].
For detection of mercury ions in cells, 4 × 10⁵ cells were seeded in the CaF2 coverslips in fresh medium for 24 h. The cells were then exposed to Fe3O4@SiO2@Au/4MPy in serum-free medium. After 24 h incubation, the culture medium was removed, and the cells were quickly maintained with PBS and Hg (II) ions for 1 h. Cells were fixed with 10% neutral buffered formalin (with approximately 4% of formaldehyde) for 15min. As prepared cells were used for the cell Raman mapping. Due to getting high SERS signal from the nanoparticles, the 785 nm laser (0.75 mW, integration time 25 s, 50 × LWD objective lens) was adopted to do the mapping. Additionally, then, for the same mapping area, 532 nm laser (5 mW, integration time 20 s, 50 × LWD objective lens) was used for cell mapping. All the Raman data was treated by Labspec 6 including baseline correction, smoothing, and normalization.

3. Results and Discussion

3.1. Fabrication and Characterization of Fe3O4@SiO2@Au

The ferroferric oxide nanoparticles were synthesized by an improved solvent-thermal method [51]. This method adjusts the amount of NaOH to change the crystallinity of ferroferric oxide without high temperature. Therefore, ordinary glass containers such as conical flasks can be used instead of using a hydrothermal kettle for the reaction. Compared with the polytetrafluoroethylene liner, the glass container is easier to clean. Since the reaction is not sensitive to the presence of limited oxygen, thus avoiding the tedious work of deoxidation. In addition, the size of the magnetic particles can be controlled by controlling the amount of H2O added.
Through the Stöber reaction, silicon dioxide can be readily coated on Fe3O4 to form Fe3O4@SiO2 core/shell microspheres. The thickness of the shell can be easily adjusted by changing the amount of EtOH added. The SiO2 shell layer can avoid the aggregation and oxidation of Fe3O4 particles in the harsh liquid environment, and provide a site for Au seed deposition. The core/shell microspheres maintain the morphological characteristics of pure Fe3O4 in addition to maintaining a larger particle size of about 220 nm. The positive charges and primary amine groups on the PEI can achieve rapid assembly of negatively charged particles. In this way, the positively charged PEI layer adsorbed negatively charged 1–3 nm Au NPs on the surface of Fe3O4@SiO2-PEI NPs. These small AuNPs were firmly attached to Fe3O4@SiO2-PEI NPs through the covalent bonds between -NH. Then, based on the seed-mediated method, using 1–3 nm AuNPs as the binding sites, the HAuCl4 plating solution was reduced by formaldehyde to form a continuous gold shell. Finally, Fe3O4@SiO2@Au was soaked in a 4-MPy solution for 0.5 h to obtain a layer of 4-MPy modification. The synthetic route of composite microspheres is shown in Figure 1.
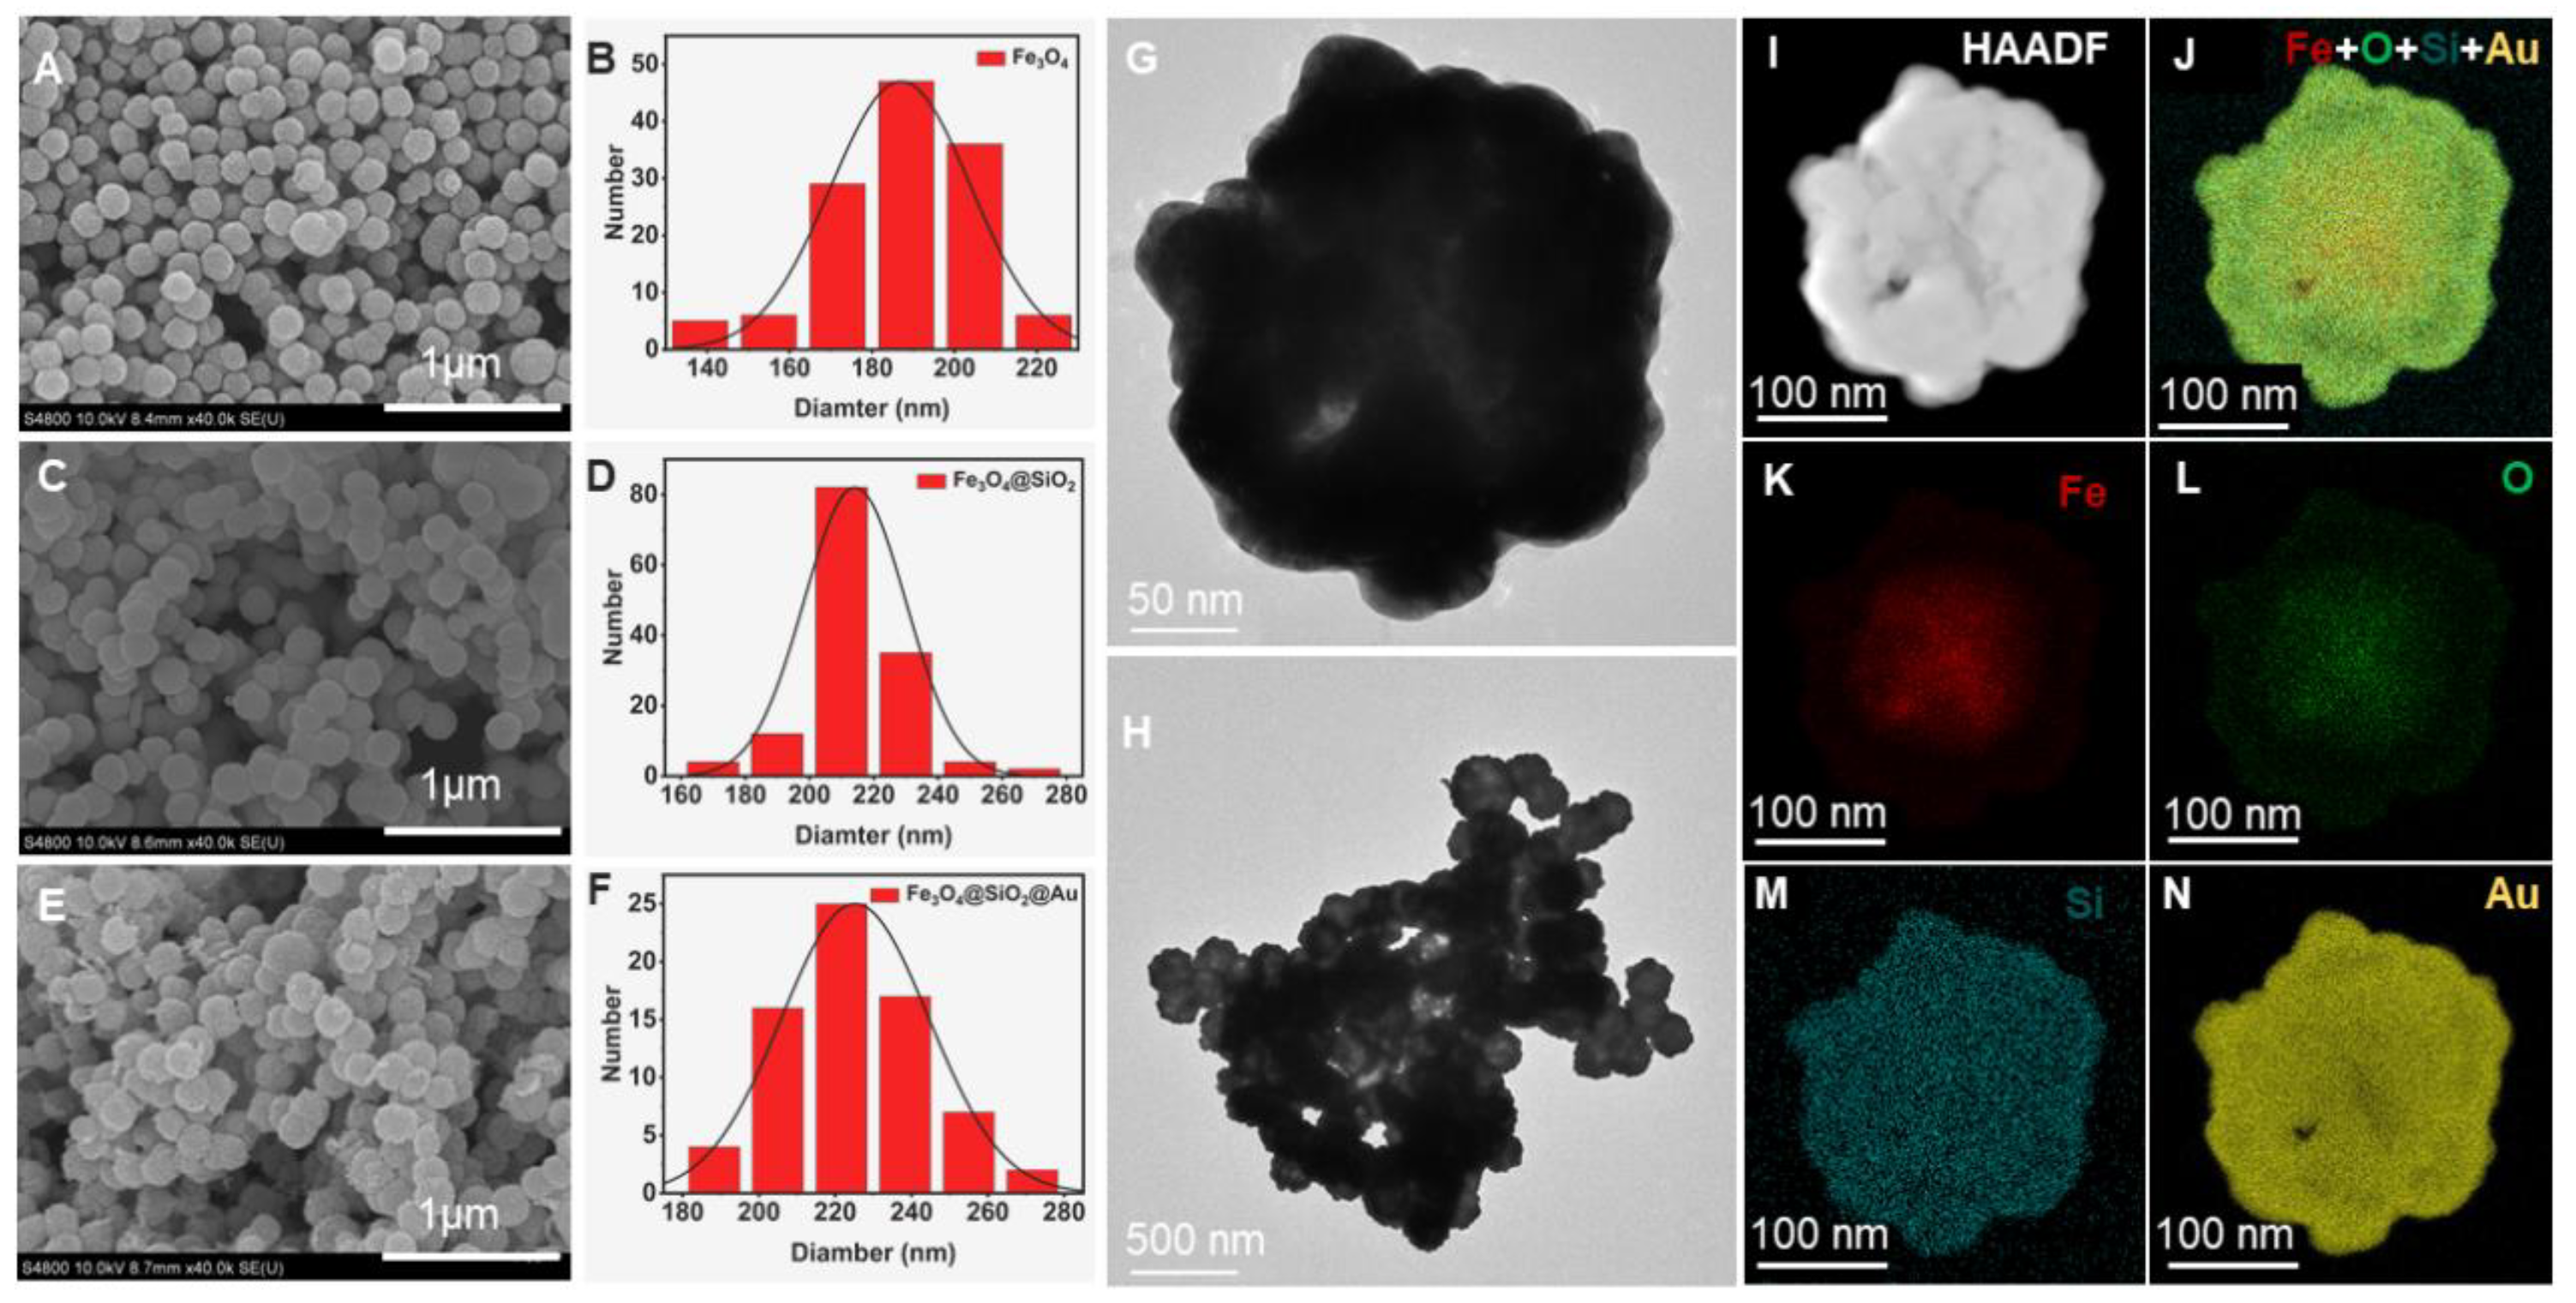
TEM and SEM (Figure 2) were used to analyze and inspect the morphology of samples obtained at different stages. It can be seen from SEM that the synthesized nanoparticles have relatively uniform particle sizes and good dispersibility. From the results of the particle size calculation, it can be concluded that the average diameter of the Fe3O4 core is 185 nm, the thickness of the silica shell is 13 nm, and the gold shell is 8 nm. TEM and element maps demonstrate the presence of Si and Au, which further proved the successful synthesis of a three-layer core/shell structure, being in agreement with the SEM observations.

3.2. SERS Measurement of Hg (II) Ions

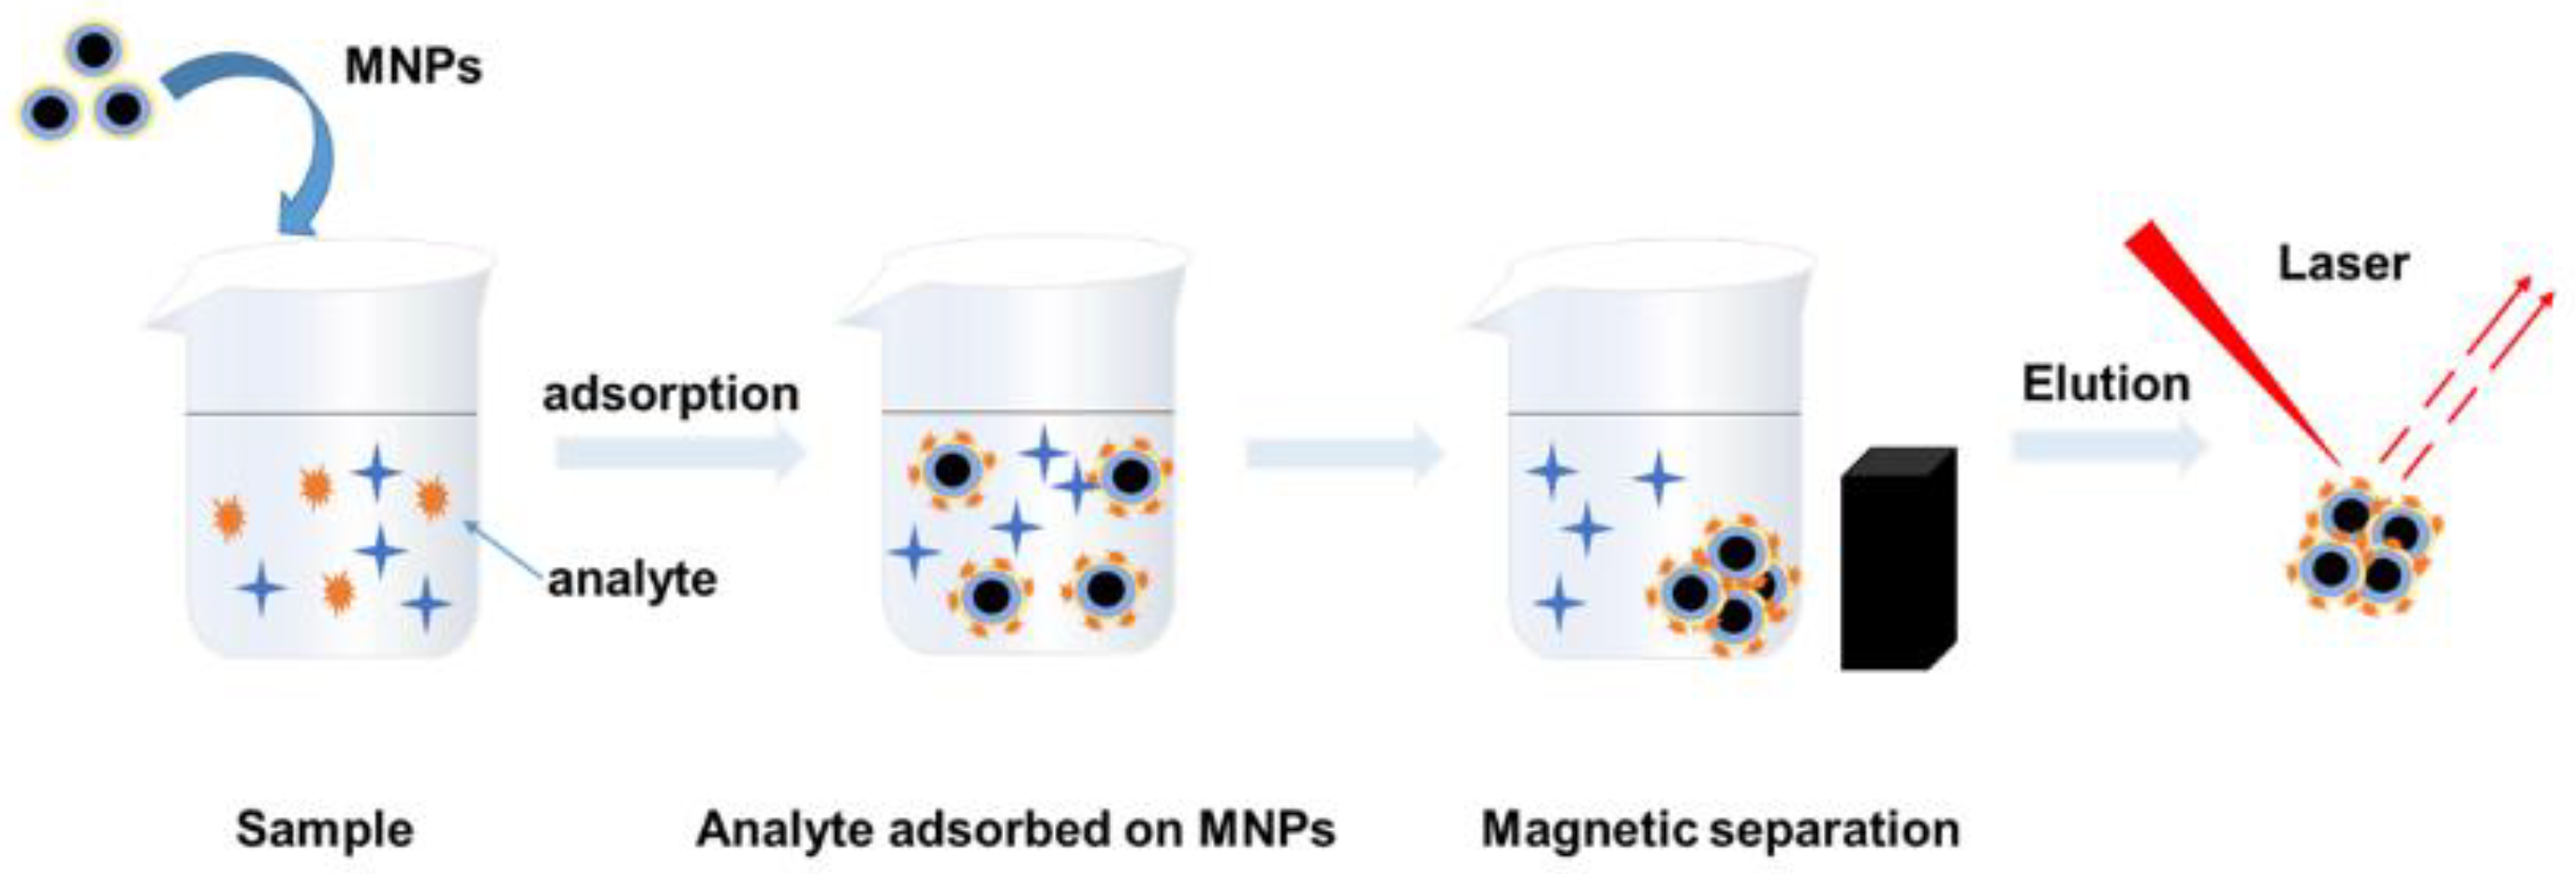
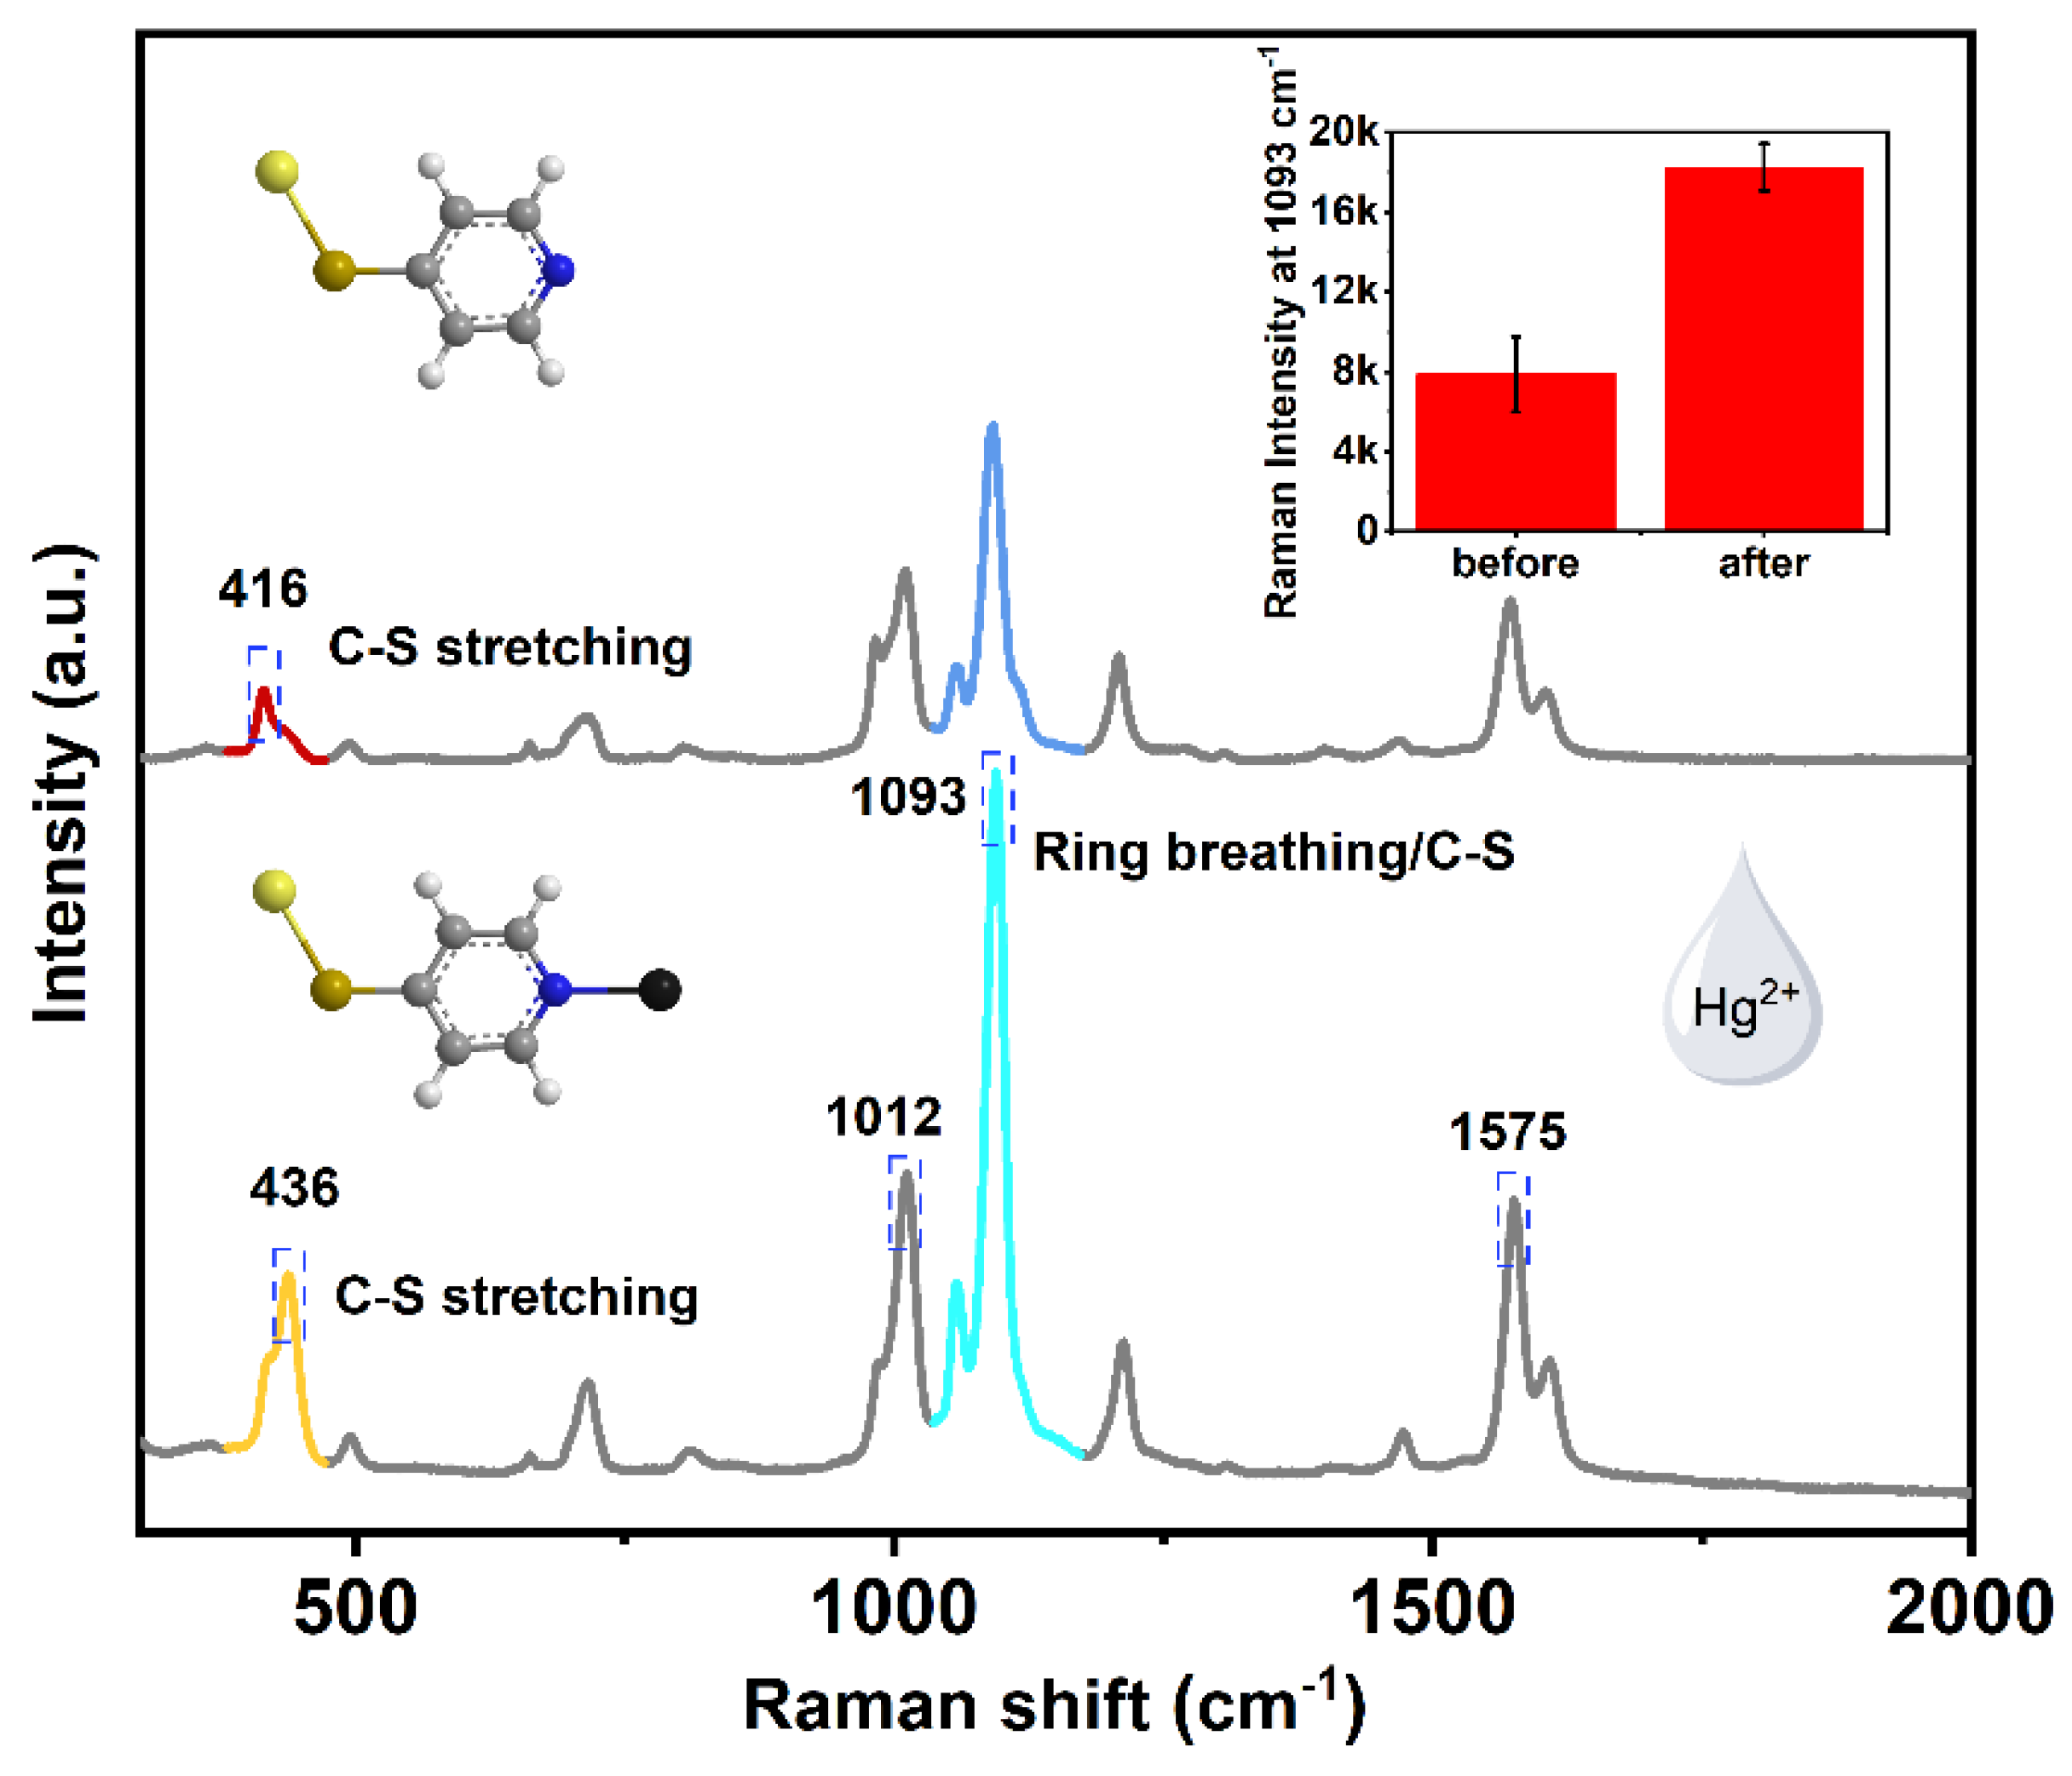
Scheme 1 shows the actual detection flow chart. The magnetic SERS nanoparticles were incubated with the water sample for 0.5 h, and then magnetically separated for Raman measurements. Figure 3 compares the Raman spectra of magnetic SERS nanoparticles before and after the addition of mercury ions. It can be seen that after the combination of mercury ions, the overall intensity of the 4-MPy was enhanced, as proved by the peaks at 1012 cm−1, 1575 cm−1, and 1093 cm−1. At 416 cm−1 and 436 cm−1, there was a blue shift of the peaks. Additionally, the attribution of Raman peaks of 4-MPy modified on magnetic microspheres can be found in Table 1. The corresponding intensity ratio of 416 cm−1/436 cm−1 can be also used as a reference for the quantification of Hg (II) ions. Therefore, unlike traditional methods that only rely on changes in spectral intensity of the characteristic fingerprints, we can accurately identify Hg (II) ions through multiple features including the intensity and the ratio value of the peaks.
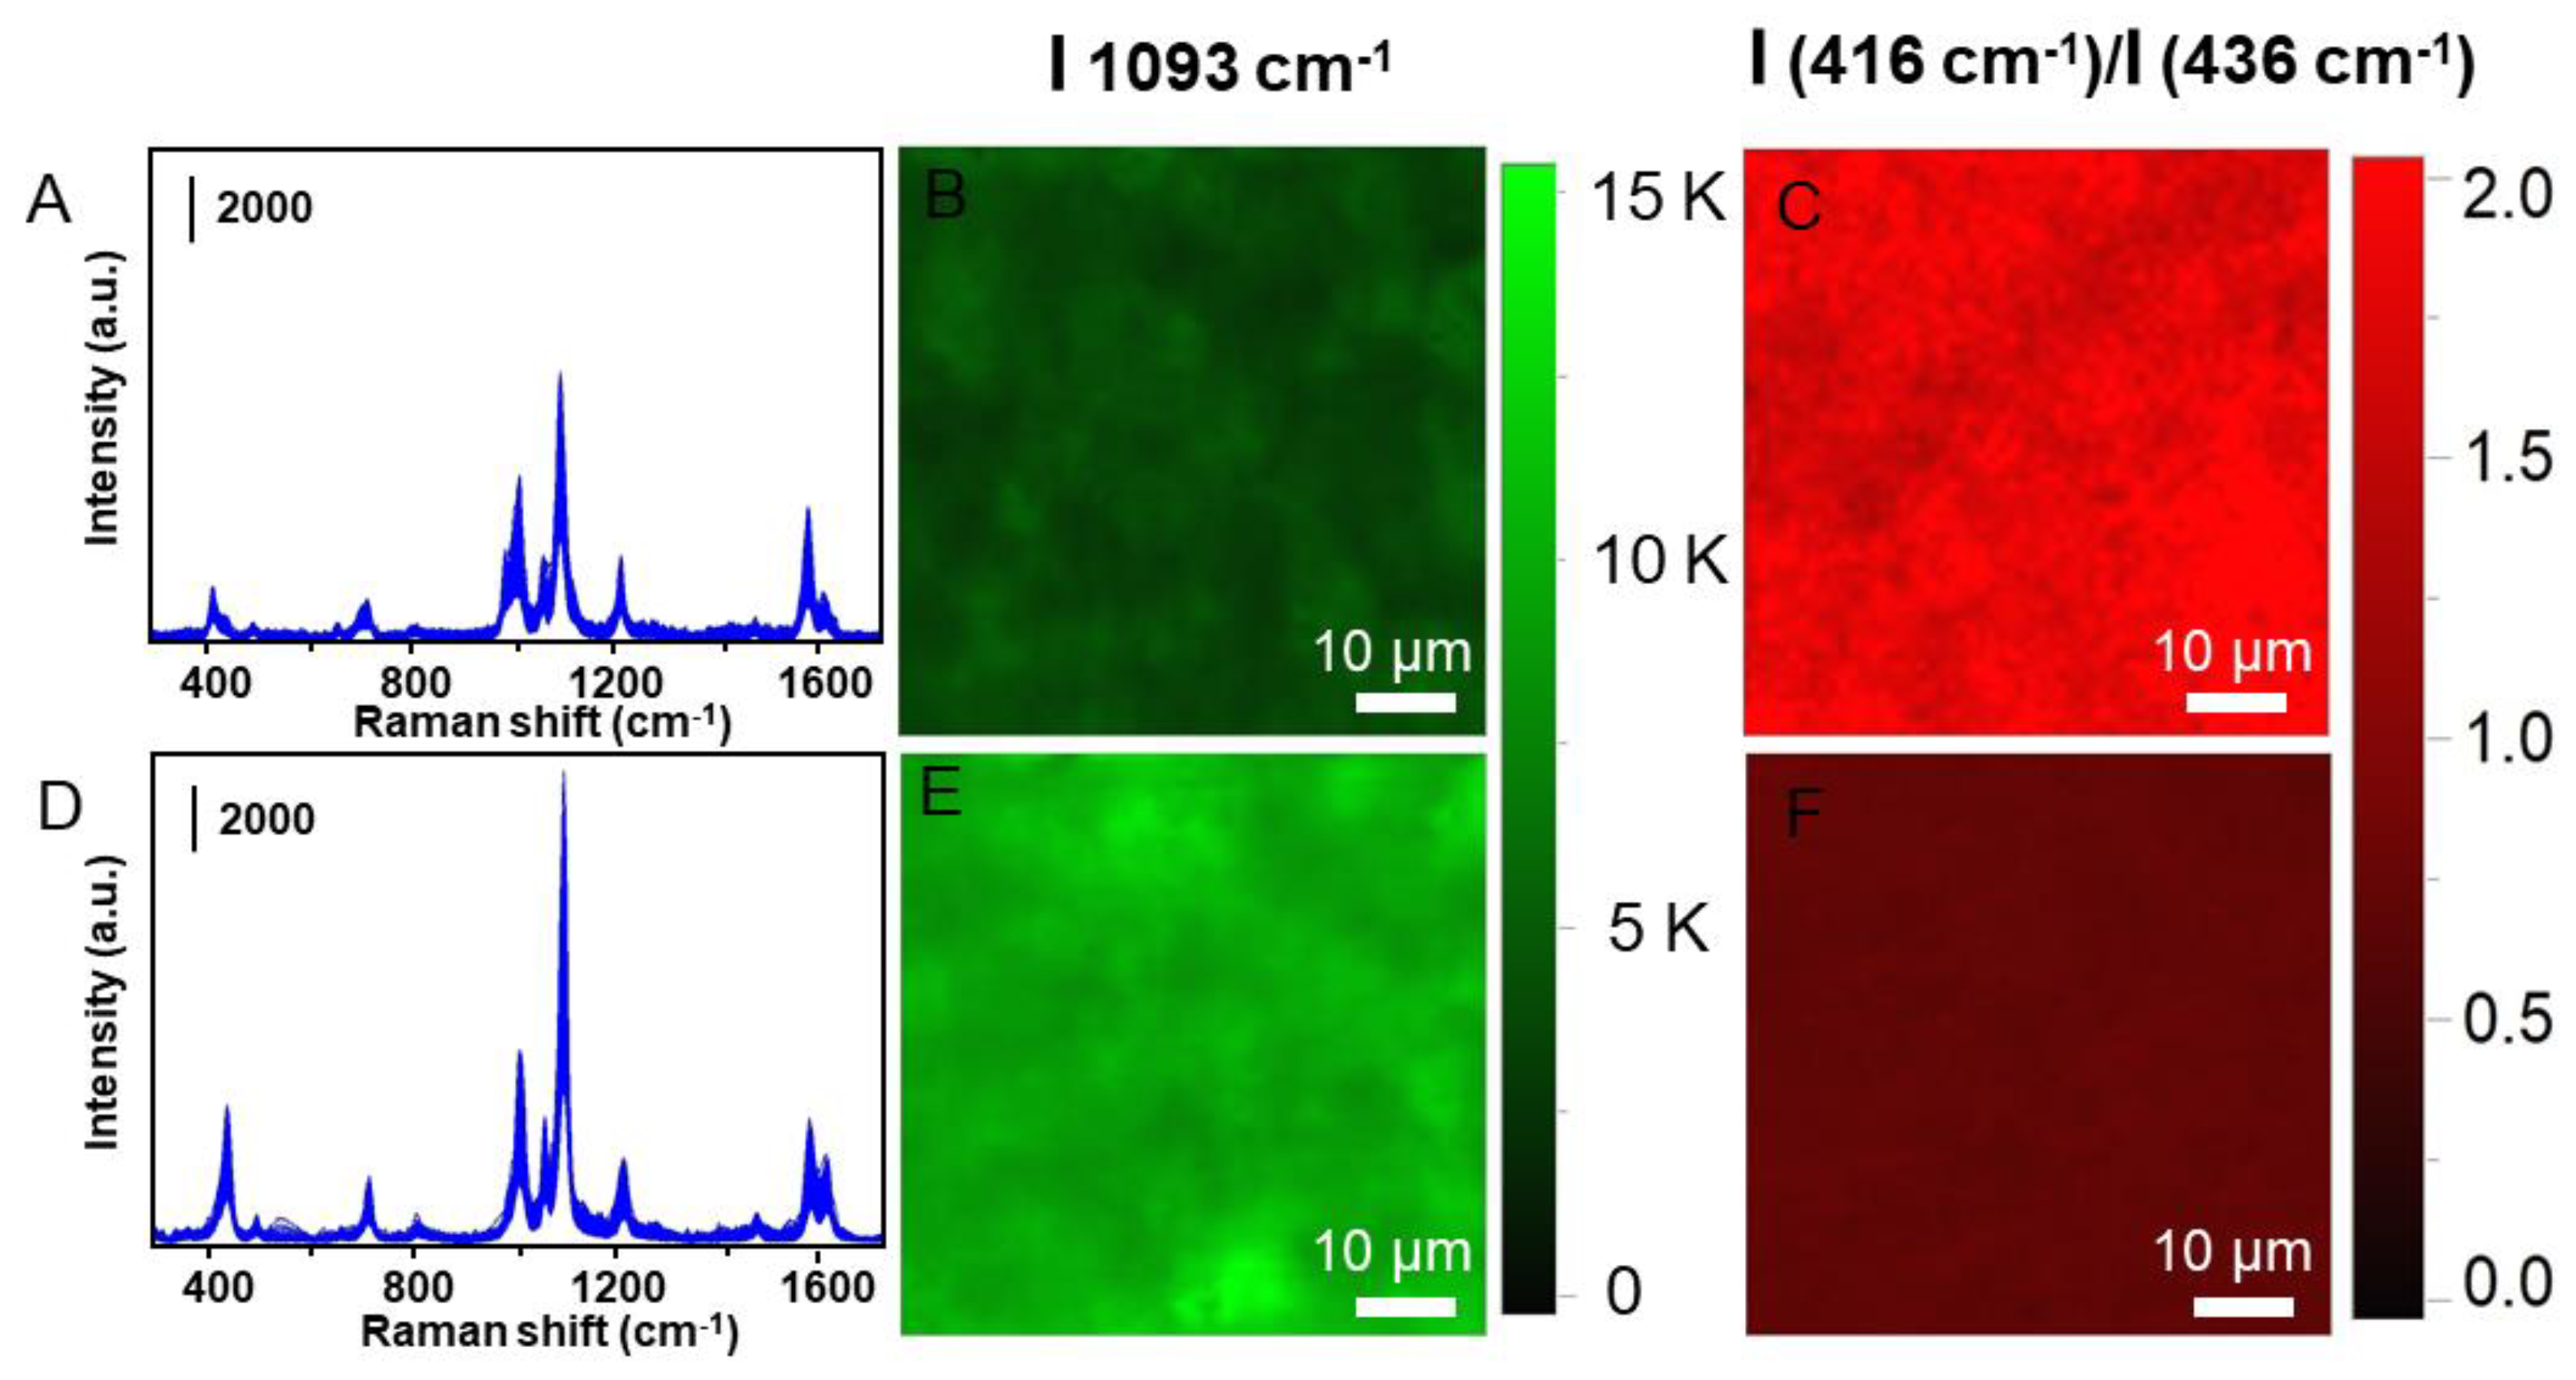
The Raman signal uniformity of the Fe3O4@SiO2@Au/4-MPy microspheres is particularly important for quantitative analysis and the Raman mapping experiment was directed conducted so as to confirm the signal uniformity. As shown in Figure 4, the highly overlapped SERS spectra without addition of mercury ions show good reproducibility. After treatment with mercury ions, the fluctuation of the SERS spectrum increases slightly, which may be induced by the structure changes produced by the incorporation of mercury ions. For Raman mapping measurement, an area of 60 μm × 60 μm was surveyed with a step size of 1 μm. The total 3600 spectrum were recorded and the relative standard deviations (RSD) was calculated to be 14% and 19%, respectively.
In order to quantitatively analyze Hg2+ ions in water, aqueous solutions with different mercury ion concentration were prepared for SERS measurement. Figure 5 depicts the typical SERS spectra of Fe3O4@SiO2@Au/4-MPy microspheres upon exposure to different concentrations of mercury ions. It can be seen that the peak intensity at 1093 cm−1 increases with the increase of the mercury ion concentration lineally. For quantitative evaluation, there is a good linear relationship between 10−5 and 10−9.
In addition, since EDTA has a chelating ability for mercury ions, the MNPs sensor can be treated with EDTA to achieve reusability. [56] Figure 6 clearly shows that after incubation with EDTA, the Raman intensity of 1093 cm−1 can be recovered as raw level. Additionally, then, with the addition of Hg2+, the 1093 cm−1 shift demonstrates similar intensity as before. It can be seen from the figure that the sensor can be recycled more than four times. We also checked the stability of the Raman chips. As shown in Figure S4, the Raman signals remain stable within 55 days of storage in water.

3.3. The Explanation of 416 cm−1 Raman Band by Hybrid Density Functional (h-DFT)

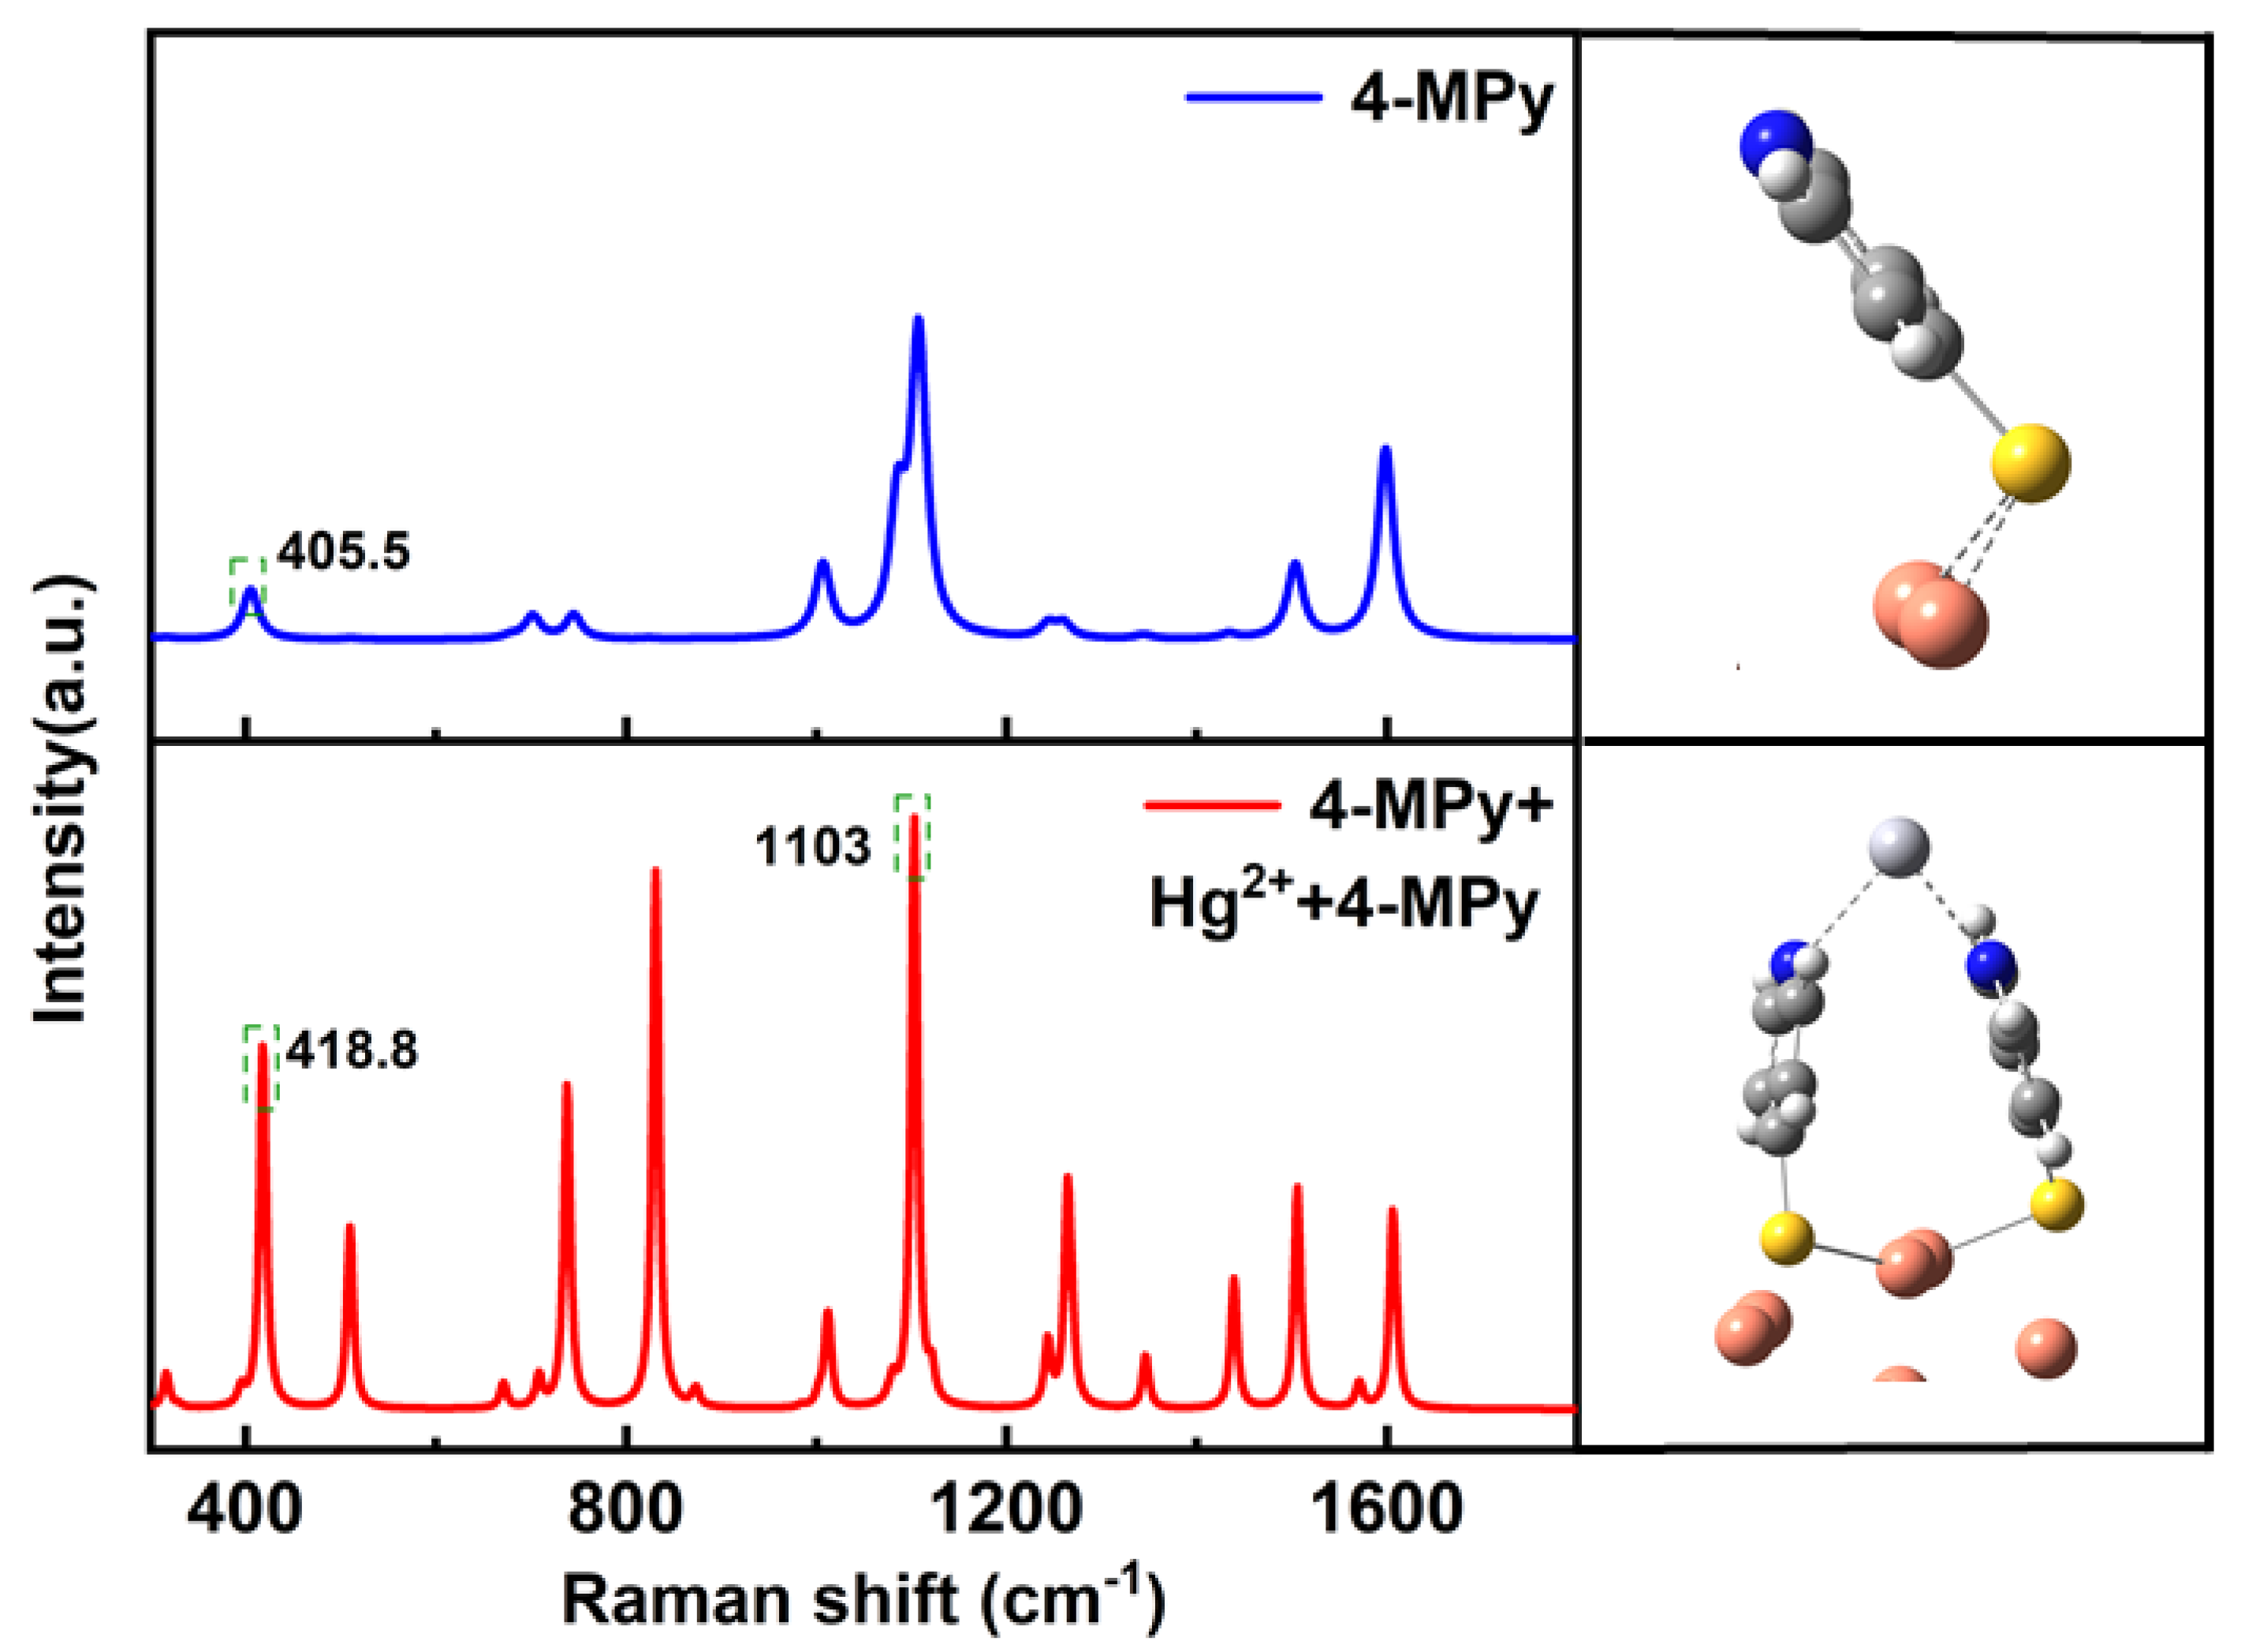
In order to study the effect of Hg ions on the Raman vibrational bands of 4-MPy, h-DFT was used. The geometries of different absorbing configurations were constructed and optimized at the M062X hybrid density function in combination with the lanl2dz basis set on metal atoms (Au and Hg) and 6–311G (d, p) on other atoms (C, N, S and H) using Gaussian 16 package. The simulated Raman spectra were shown in Figure 7.
With the interaction of Hg2+, the vertical adsorption of 4-MPy with the presence of Hg2+ can enhance the vibration intensity of the peak located at 1093 cm−1 attributed to pyridine breathing mode. Due to the attractive π − π interaction between 4-MPy molecules, it has a high surface coverage. The π − π interaction also leads to the multi-dentate chelation of Hg2+ bonding to the N atoms from several pyridine molecules. After multi-dentate chelation, the peak of C-S stretching mode has a blue shift, which is consistent with the experimental trend.
To find out the SERS performance of Fe3O4@SiO2@Au MNPs, the electric field distribution map of the single MNP and two MNPs nearby were simulated by FDTD Solutions (Lumerical Solution Inc., Vancouver, Canada) and the corresponding results were shown in Figure S2. Obviously, Fe3O4@SiO2/Au MNP dimer gap has obtained strong SERS intensity, which is beneficial to enhance the Raman signals of the analytes.

3.4. The Selectivity Analysis of as Prepared Sensors

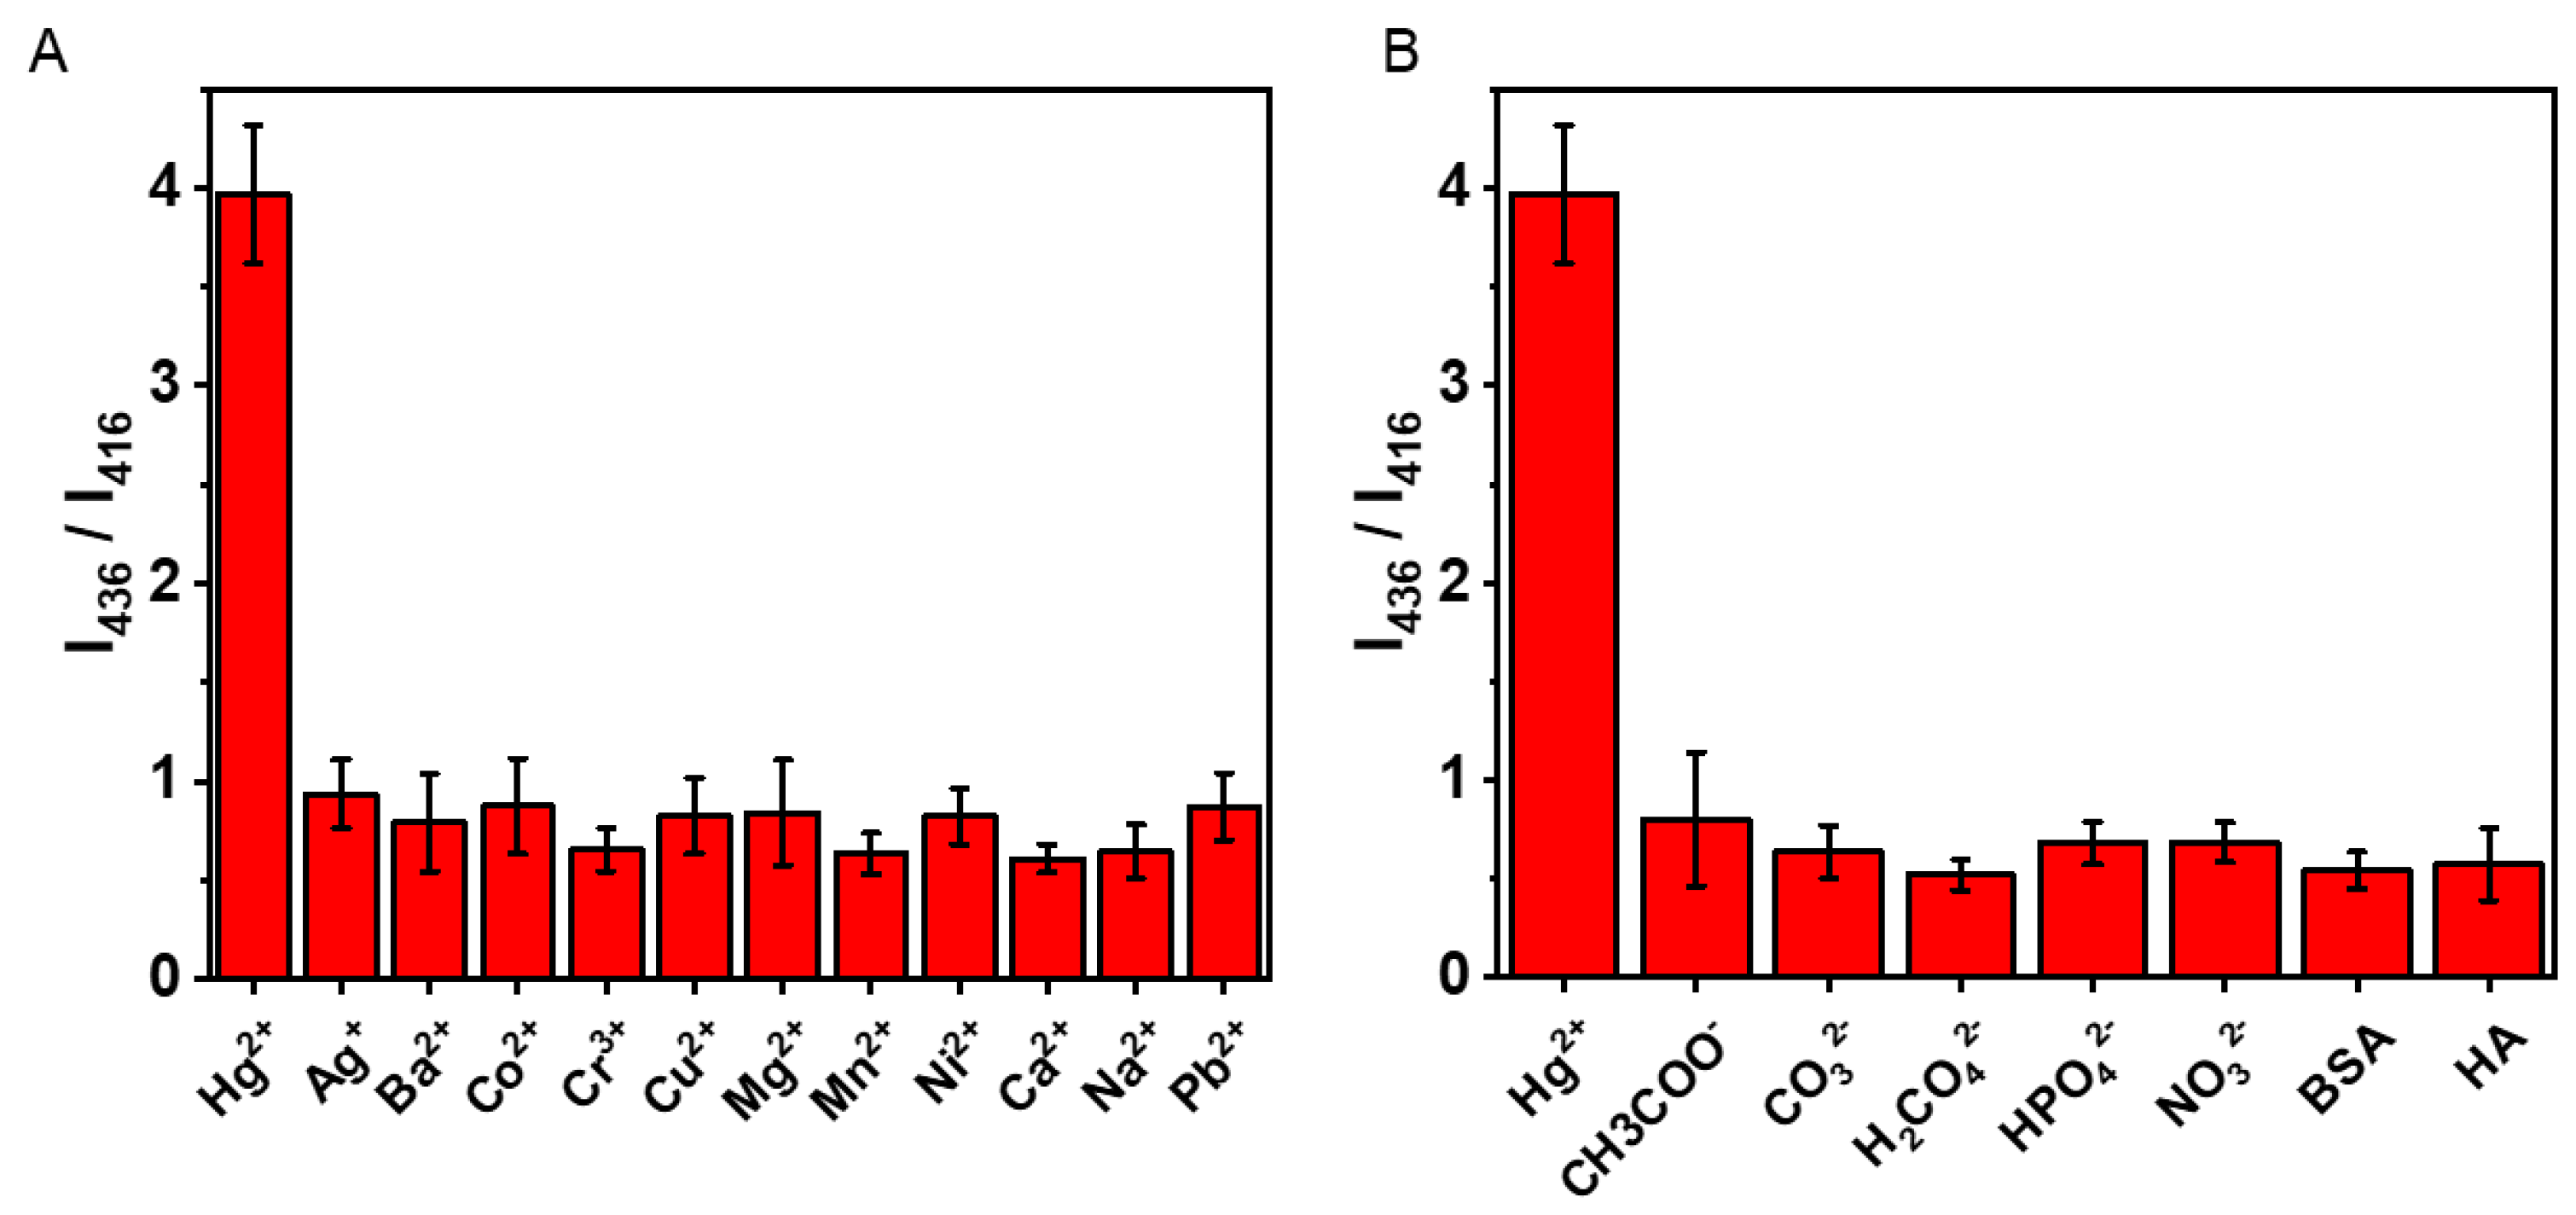
Taking into account the application of this magnetic sensor in actual detection, we also conducted a series of selective experiments of the SERS sensor to Hg2+. A stable MPy-Hg2+-MPy complex can be formed between 4-MPy and Hg2+ which provides excellent selectivity over other interfering metal ions for the detection of Hg2+. The sensor’s selectivity was tested including the following ions (Ag+, Ba2+, Co2+, Cr3+, Mg2+, Mn2+, Ni2+, Ca2+, Na+, and Pb2+ with a concentration of 100 ppm) and the possible coexistence of anions (CH3COO, CO32−, H2PO42−, HPO42−, NO32−), BSA and HA in the water. As shown in Figure 8, the Raman intensity ratio of I (416 cm−1)/I (436 cm−1) acted as a reference, the results show that the SERS intensity ratio used to detect mercury ions is significantly stronger than the interference factors in other environments.

3.5. The Application of Hg2+ Detection in Real Water Samples

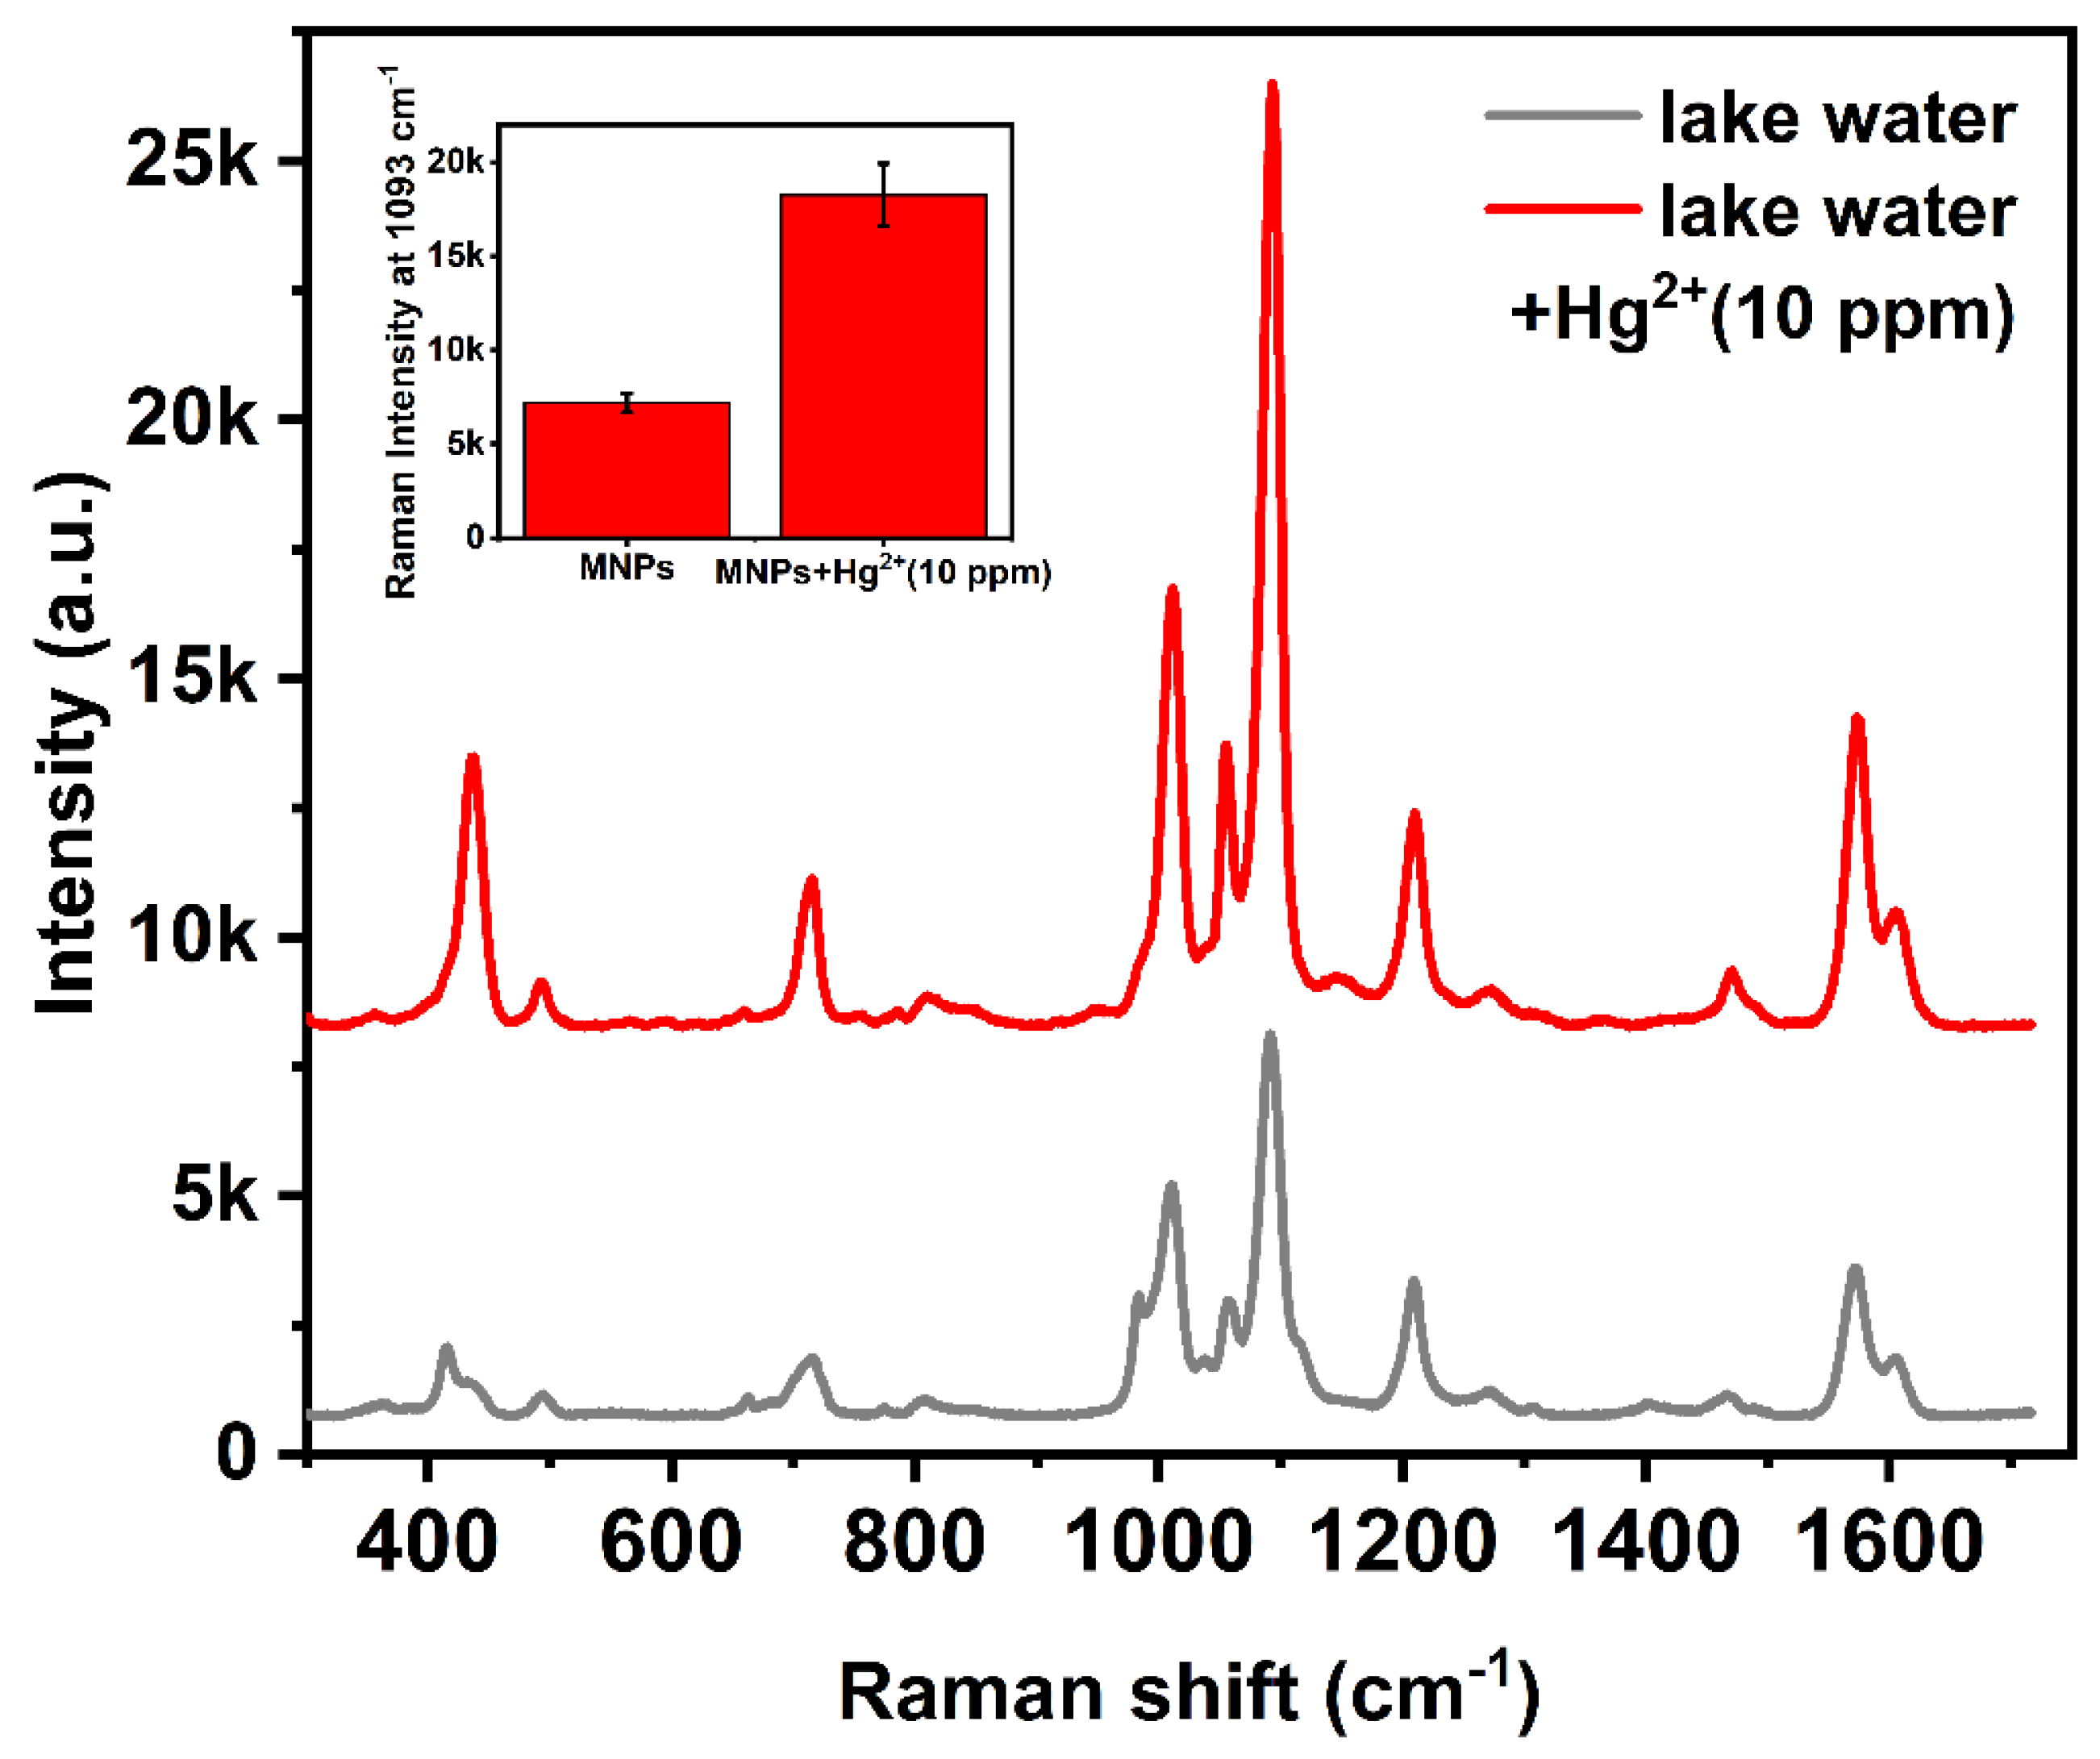
We also conducted actual sample detection tests by incorporating mercury ions into actual water solutions. Filter paper and then 0.22 μm filter membrane were introduced to remove the particle precipitation in the actual water samples. Then, the SERS sensor was immersed in the actual Hg ions contained water sample and incubated for 30 min, and the sensor was separated by magnetism. Figure 9 shows the results of one sample with addition of mercury ions at the concentration of 10−5 M. Obviously, the raman peak intensity located at 1093 cm−1 of the sample with addition of Hg2+ is higher, which is consistent with the foregoing experiments. This experiment clearly confirmed that the SERS sensor has ability to detect mercury ions in actual environmental water.

3.6. Test of Detection of Hg2+ for Cell Analysis

Furthermore, the magnetic SERS sensor was employed for cell analysis. The macrophages were incubated with a magnetic nanoprobe. After the probe was endocytosed by the macrophages, the macrophages were treated with mercury ions containing PBS for 1h, and then the Raman mapping was performed. The corresponding images were shown in Figure 10. The results show that the intensity ratio of 416 cm−1 to 436 cm−1 was significantly decreased and the intensity of the 1093 cm−1 was enhanced with the addition of Hg ions. Due to the complex composition of the cell, the signal of the SERS material in the cell will inevitably be affected. The dual criteria of the intensity change of 1093 cm−1 and the ratio change of 416 cm−1 and 436 cm−1 can better identify the existence of Hg ions.

4. Conclusions

In summary, in this work, a new field-detectable SERS sensor was developed to detect Hg ions in water. The new nano sensor has excellent anti-interference and environmental adaptability and shows high sensitivity and selectivity to Hg ions. The Fe3O4 core provides good magnetism, SiO2 is used to protect Fe3O4 from external interference, the dense gold shell provides a good SERS enhancement effect, and 4-MPy is used for surface modification. 4-MPy can combine with Hg2+ to cause spectral changes. In addition, after EDTA treatment, the sensor can be recycled and reused. Importantly, the Raman image of the Hg2+ ion-treated macrophages confirms the MNPs sensors work effectively at the cell level. Based on these advantages, the nano sensor provides a quick and easy method for on-site detection of Hg ions.

Supplementary Materials

The following supporting information can be downloaded at: https://www.mdpi.com/article/10.3390/chemosensors11060347/s1, Table S1: Comparison between this work and other reported results for detection of mercury ion; Figure S1 The Raman spectra of different concentrations of 4-MPy modified on magnetic microspheres. Figure S2 Electric field intensity map using FDTD simulation at the excitation laser wavelength of 785 nm for (A) single MNP and (B) two Fe3O4@SiO2@Au MNPs with a distance of 5 nm; Figure S3 Raman signal of MNPs sensor in cell under 785 cm−1 lase; (a) Signal of MNPs in cells after incubated with Hg2+. (b) Signal of MNPs in cells; Figure S4 (A) The Raman spectra of MNPs sensor with Hg2+ for different days, (B) the Raman intensity of the sensor at 1093 cm−1 recorded within different storage time. References [15,16,17,18,57,58] are cited in the supplementary materials.

Author Contributions

Conceptualization, C.L. and Y.L.; methodology, C.L. and Y.L.; software, H.L. and H.W.; validation, H.W., C.Z. and S.X.; formal analysis, C.L.; investigation, C.L.; resources, H.W.; data curation, H.L.; writing—original draft preparation, C.L.; writing—review and editing, Y.L. and C.Z.; visualization, H.L; supervision, Y.L., S.X. and C.Z.; project administration, Y.L.; funding acquisition, Y.L. and S.X. All authors have read and agreed to the published version of the manuscript.

Funding

This work is financially supported by the National Key Research and Development Program of China (2020YFC1808204, 2020YFC1908602, 2022YFE03210200), Anhui Provincial Key R&D Program (202004i07020016), Anhui Province education department Program KJ2021A076., The National Natural Science Foundation of China (No. 22175002) and Natural Science Foundation of Anhui Province (1808085J12 and 2108085MB40). The open fund of Information Materials and Intelligent Sensing Laboratory of Anhui Province (IMIS202208).

Institutional Review Board Statement

Not applicable.

Informed Consent Statement

Not applicable.

Data Availability Statement

Not applicable.

Conflicts of Interest

The authors declare no conflict of interest.

References

  1. Zheng, Q.; Teng, X.; Li, Q.; Ma, Z.; Ying, Y.; Wu, Y.; Wen, Y.; Guo, X.; Yang, H. A Raman chip for rapid and specific detection of trace mercury ions in seawater. Sens. Actuators B Chem. 2021, 346, 130468. [Google Scholar] [CrossRef]
  2. Fu, S.; Guo, X.; Wang, H.; Yang, T.; Wen, Y.; Yang, H. Detection of trace mercury ions in water by a novel Raman probe. Sens. Actuators B Chem. 2014, 199, 108–114. [Google Scholar] [CrossRef]
  3. Sarfo, D.K.; Sivanesan, A.; Izake, E.L.; Ayoko, G.A. Rapid detection of mercury contamination in water by surface enhanced Raman spectroscopy. RSC Adv. 2017, 7, 21567–21575. [Google Scholar] [CrossRef] [Green Version]
  4. Wu, H.; Wu, Q.; Zhang, J.; Gu, Q.; Wei, L.; Guo, W.; He, M. Chromium ion removal from raw water by magnetic iron composites and Shewanella oneidensis MR-1. Sci. Rep. 2019, 9, 3687–3703. [Google Scholar] [CrossRef] [PubMed] [Green Version]
  5. Chen, J.; Yang, Z.M. Mercury toxicity, molecular response and tolerance in higher plants. Biometals 2012, 25, 847–857. [Google Scholar] [CrossRef]
  6. Li, P.; Du, B.; Chan, H.L.; Feng, X.; Li, B. Mercury bioaccumulation and its toxic effects in rats fed with methylmercury polluted rice. Sci. Total Environ. 2018, 633, 93–99. [Google Scholar] [CrossRef]
  7. Lubick, N. IMMUNITY: Mercury Alters Immune System Response in Artisanal Gold Miners. Environ. Health Perspect. 2010, 118, A243–A245. [Google Scholar] [CrossRef] [PubMed]
  8. Pollard, K.M.; Hultman, P. Effects of mercury on the immune system. Met. Ions Biol. Syst. 1997, 34, 421–440. [Google Scholar] [PubMed]
  9. Fowler, B.A. Mechanisms of kidney cell injury from metals. Environ. Health Perspect. 1993, 100, 57–63. [Google Scholar] [CrossRef]
  10. Zalups, R.K. Molecular interactions with mercury in the kidney. Pharmacol. Rev. 2000, 52, 113–143. [Google Scholar]
  11. Clarkson, T.W.; Magos, L.; Myers, G.J. The Toxicology of Mercury—Current Exposures and Clinical Manifestations. N. Engl. J. Med. 2003, 349, 1731–1737. [Google Scholar] [CrossRef] [PubMed] [Green Version]
  12. Kim, K.-H.; Kabir, E.; Jahan, S.A. A review on the distribution of Hg in the environment and its human health impacts. J. Hazard. Mater. 2016, 306, 376–385. [Google Scholar] [CrossRef] [PubMed]
  13. Peplow, D.; Augustine, S. Neurological abnormalities in a mercury exposed population among indigenous Wayana in Southeast Suriname. Environ. Sci. Process. Impacts 2014, 16, 2415–2422. [Google Scholar] [CrossRef] [PubMed] [Green Version]
  14. Gump, B.B.; Dykas, M.J.; MacKenzie, J.A.; Dumas, A.K.; Hruska, B.; Ewart, C.K.; Parsons, P.J.; Palmer, C.D.; Bendinskas, K. Background lead and mercury exposures: Psychological and behavioral problems in children. Environ. Res. 2017, 158, 576–582. [Google Scholar] [CrossRef]
  15. Li, Y.; Chen, C.; Li, B.; Sun, J.; Wang, J.; Gao, Y.; Zhao, Y.; Chai, Z. Elimination efficiency of different reagents for the memory effect of mercury using ICP-MS. J. Anal. At. Spectrom. 2006, 21, 94–96. [Google Scholar] [CrossRef]
  16. Li, Y.; Zhu, Z.; Zheng, H.; Jin, L.; Hu, S. Significant signal enhancement of dielectric barrier discharge plasma induced vapor generation by using non-ionic surfactants for determination of mercury and cadmium by atomic fluorescence spectrometry. J. Anal. At. Spectrom. 2016, 31, 383–389. [Google Scholar] [CrossRef]
  17. Panichev, N.A.; Panicheva, S.E. Determination of total mercury in fish and sea products by direct thermal decomposition atomic absorption spectrometry. Food Chem. 2015, 166, 432–441. [Google Scholar] [CrossRef]
  18. Savoie, J.; St-Louis, R.; Clément, M. Facilitating local analysis in northern regions: Microwave plasma-atomic emission spectrometry for mercury determination in wild Atlantic salmon. Int. J. Environ. Anal. Chem. 2018, 98, 582–591. [Google Scholar] [CrossRef]
  19. Zhang, X.; Young, M.A.; Lyandres, O.; Van Duyne, R.P. Rapid Detection of an Anthrax Biomarker by Surface-Enhanced Raman Spectroscopy. J. Am. Chem. Soc. 2005, 127, 4484–4489. [Google Scholar] [CrossRef] [PubMed]
  20. Ma, W.; Sun, M.; Xu, L.; Wang, L.; Kuang, H.; Xu, C. A SERS active gold nanostar dimer for mercury ion detection. Chem. Commun. 2013, 49, 4989–4991. [Google Scholar] [CrossRef] [PubMed]
  21. Jarvis, R.M.; Brooker, A.; Goodacre, R. Surface-Enhanced Raman Spectroscopy for Bacterial Discrimination Utilizing a Scanning Electron Microscope with a Raman Spectroscopy Interface. Anal. Chem. 2004, 76, 5198–5202. [Google Scholar] [CrossRef] [PubMed]
  22. Han, X.; Koh, C.S.L.; Lee, H.K.; Chew, W.S.; Ling, X.Y. Microchemical Plant in a Liquid Droplet: Plasmonic Liquid Marble for Sequential Reactions and Attomole Detection of Toxin at Microliter Scale. ACS Appl. Mater. Interfaces 2017, 9, 39635–39640. [Google Scholar] [CrossRef] [PubMed]
  23. Zhang, Y.; de Aberasturi, D.J.; Henriksen-Lacey, M.; Langer, J.; Liz-Marzán, L.M. Live-Cell Surface-Enhanced Raman Spectroscopy Imaging of Intracellular pH: From Two Dimensions to Three Dimensions. ACS Sens. 2020, 5, 3194–3206. [Google Scholar] [CrossRef] [PubMed]
  24. Hurst, S.J.; Fry, H.C.; Gosztola, D.J.; Rajh, T. Utilizing Chemical Raman Enhancement: A Route for Metal Oxide Support-Based Biodetection. J. Phys. Chem. C 2011, 115, 620–630. [Google Scholar] [CrossRef]
  25. Lee, S.J.; Moskovits, M. Visualizing Chromatographic Separation of Metal Ions on a Surface-Enhanced Raman Active Medium. Nano Lett. 2011, 11, 145–150. [Google Scholar] [CrossRef] [PubMed]
  26. Li, L.; Wen, Y.; Xu, L.; Xu, Q.; Song, S.; Zuo, X.; Yan, J.; Zhang, W.; Liu, G. Development of mercury (II) ion biosensors based on mercury-specific oligonucleotide probes. Biosens. Bioelectron. 2016, 75, 433–445. [Google Scholar] [CrossRef]
  27. Wang, G.; Lim, C.; Chen, L.; Chon, H.; Choo, J.; Hong, J.; Demello, A.J. Surface-enhanced Raman scattering in nanoliter droplets: Towards high-sensitivity detection of mercury (II) ions. Anal. Bioanal. Chem. 2009, 394, 1827–1832. [Google Scholar] [CrossRef]
  28. Kang, Y.; Wu, T.; Liu, B.; Wang, X.; Du, Y. Selective determination of mercury(II) by self-referenced surface-enhanced Raman scattering using dialkyne-modified silver nanoparticles. Microchim. Acta 2014, 181, 1333–1339. [Google Scholar] [CrossRef]
  29. Duan, J.; Yang, M.; Lai, Y.; Yuan, J.; Zhan, J. A colorimetric and surface-enhanced Raman scattering dual-signal sensor for Hg2+ based on Bismuthiol II-capped gold nanoparticles. Anal. Chim. Acta 2012, 723, 88–93. [Google Scholar] [CrossRef]
  30. Chung, E.; Gao, R.; Ko, J.; Choi, N.; Lim, D.W.; Lee, E.K.; Chang, S.-I.; Choo, J. Trace analysis of mercury(ii) ions using aptamer-modified Au/Ag core–shell nanoparticles and SERS spectroscopy in a microdroplet channel. Lab A Chip 2013, 13, 260–266. [Google Scholar] [CrossRef]
  31. Xu, L.; Yin, H.; Ma, W.; Kuang, H.; Wang, L.; Xu, C. Ultrasensitive SERS detection of mercury based on the assembled gold nanochains. Biosens. Bioelectron. 2015, 67, 472–476. [Google Scholar] [CrossRef] [PubMed]
  32. Wang, Y.; Wang, K.; Zou, B.; Gao, T.; Zhang, X.; Du, Z.; Zhou, S. Magnetic-based silver composite microspheres with nanosheet-assembled shell for effective SERS substrate. J. Mater. Chem. C 2013, 1, 2441–2447. [Google Scholar] [CrossRef]
  33. Wang, C.; Rong, Z.; Wang, J.; Jiang, N.; Pang, Y.; Xiao, R.; Wang, S. Seed-mediated synthesis of high-performance silver-coated magnetic nanoparticles and their use as effective SERS substrates. Colloids Surf. A Physicochem. Eng. Asp. 2016, 506, 393–401. [Google Scholar] [CrossRef]
  34. Chi, Y.; Yuan, Q.; Li, Y.; Tu, J.; Zhao, L.; Li, N.; Li, X. Synthesis of Fe3O4@SiO2–Ag magnetic nanocomposite based on small-sized and highly dispersed silver nanoparticles for catalytic reduction of 4-nitrophenol. J. Colloid Interface Sci. 2012, 383, 96–102. [Google Scholar] [CrossRef] [PubMed]
  35. Ning, J.; Wang, M.; Luo, X.; Hu, Q.; Hou, R.; Chen, W.; Chen, D.; Wang, J.; Liu, J. SiO2 Stabilized Magnetic Nanoparticles as a Highly Effective Catalyst for the Degradation of Basic Fuchsin in Industrial Dye Wastewaters. Molecules 2018, 23, 2573. [Google Scholar] [CrossRef] [Green Version]
  36. Li, J.F.; Zhang, Y.J.; Ding, S.Y.; Panneerselvam, R.; Tian, Z.Q. Core-Shell Nanoparticle-Enhanced Raman Spectroscopy. Chem. Rev. 2017, 117, 5002–5069. [Google Scholar] [CrossRef]
  37. Yuan, H.; Ji, W.; Chu, S.; Liu, Q.; Qian, S.; Guang, J.; Wang, J.; Han, X.; Masson, J.-F.; Peng, W. Mercaptopyridine-Functionalized Gold Nanoparticles for Fiber-Optic Surface Plasmon Resonance Hg2+ Sensing. ACS Sens. 2019, 4, 704–710. [Google Scholar] [CrossRef]
  38. Gao, J.; Ran, X.; Shi, C.; Cheng, H.; Cheng, T.; Su, Y. One-step solvothermal synthesis of highly water-soluble, negatively charged superparamagnetic Fe3O4 colloidal nanocrystal clusters. Nanoscale 2013, 5, 7026–7033. [Google Scholar] [CrossRef]
  39. Liu, X.; Yang, X.; Li, K.; Liu, H.; Xiao, R.; Wang, W.; Wang, C.; Wang, S. Fe3O4@ Au SERS tags-based lateral flow assay for simultaneous detection of serum amyloid A and C-reactive protein in unprocessed blood sample. Sens. Actuators B Chem. 2020, 320, 128350. [Google Scholar] [CrossRef]
  40. Wang, C.; Xu, J.; Wang, J.; Rong, Z.; Li, P.; Xiao, R.; Wang, S. Polyethylenimine-interlayered silver-shell magnetic-core microspheres as multifunctional SERS substrates. J. Mater. Chem. C 2015, 3, 8684–8693. [Google Scholar] [CrossRef]
  41. Duff, D.G.; Baiker, A.; Edwards, P.P. A new hydrosol of gold clusters. 1. Formation and particle size variation. Langmuir 1993, 9, 2301–2309. [Google Scholar] [CrossRef]
  42. Wang, K.; Wang, Y.; Wang, C.; Jia, X.; Li, J.; Xiao, R.; Wang, S. Facile synthesis of high-performance SiO2@Au core–shell nanoparticles with high SERS activity. RSC Adv. 2018, 8, 30825–30831. [Google Scholar] [CrossRef] [PubMed] [Green Version]
  43. Lu, Y.; Yao, G.; Sun, K.; Huang, Q. beta-Cyclodextrin coated SiO(2)@Au@Ag core-shell nanoparticles for SERS detection of PCBs. Phys. Chem. Chem. Phys. 2015, 17, 21149–21157. [Google Scholar] [CrossRef]
  44. Lu, Y.; Zhong, J.; Yao, G.; Huang, Q. A label-free SERS approach to quantitative and selective detection of mercury (II) based on DNA aptamer-modified SiO2@Au core/shell nanoparticles. Sens. Actuators B Chem. 2018, 258, 365–372. [Google Scholar] [CrossRef]
  45. Hunyadi, S.E.; Murphy, C.J. Bimetallic silver–gold nanowires: Fabrication and use in surface-enhanced Raman scattering. J. Mater. Chem. 2006, 16, 3929–3935. [Google Scholar] [CrossRef]
  46. Wang, C.; Shang, M.; Wei, H.; Zhang, M.; Zou, W.; Meng, X.; Chen, W.; Shao, H.; Lai, Y. Specific and sensitive on-site detection of Cr(VI) by surface-enhanced Raman spectroscopy. Sens. Actuators B Chem. 2021, 346, 130594. [Google Scholar] [CrossRef]
  47. Wang, J.; Wu, J.; Zhang, Y.; Zhou, X.; Hu, Z.; Liao, X.; Sheng, B.; Yuan, K.; Wu, X.; Cai, H.; et al. Colorimetric and SERS dual-mode sensing of mercury (II) based on controllable etching of Au@Ag core/shell nanoparticles. Sens. Actuators B Chem. 2021, 330, 129364. [Google Scholar] [CrossRef]
  48. Liu, C.; Xu, T.; Cheng, G.; Zhang, X. Target-triggered regioselective assembly of nanoprobes for Raman imaging of dual cancer biomarkers in living cells. Sens. Actuators B Chem. 2021, 330, 129319. [Google Scholar] [CrossRef]
  49. Iturrioz-Rodríguez, N.; Martín-Rodríguez, R.; Renero-Lecuna, C.; Aguado, F.; González-Legarreta, L.; González, J.; Fanarraga, M.L.; Perdigón, A.C. Free-labeled nanoclay intracellular uptake tracking by confocal Raman imaging. Appl. Surf. Sci. 2021, 537, 147870. [Google Scholar] [CrossRef]
  50. Gjergjizi, B.; Çoğun, F.; Yıldırım, E.; Eryılmaz, M.; Selbes, Y.; Sağlam, N.; Tamer, U. SERS-based ultrafast and sensitive detection of luteinizing hormone in human serum using a passive microchip. Sens. Actuators B Chem. 2018, 269, 314–321. [Google Scholar] [CrossRef]
  51. Dong, Y.; Wen, B.; Chen, Y.; Cao, P.; Zhang, C. Autoclave-free facile approach to the synthesis of highly tunable nanocrystal clusters for magnetic responsive photonic crystals. RSC Adv. 2016, 6, 64434–64440. [Google Scholar] [CrossRef]
  52. Li, K.; Liang, A.; Jiang, C.; Li, F.; Liu, Q.; Jiang, Z. A stable and reproducible nanosilver-aggregation-4-mercaptopyridine surface-enhanced Raman scattering probe for rapid determination of trace Hg2+. Talanta 2012, 99, 890–896. [Google Scholar] [CrossRef] [PubMed]
  53. Do, W.H.; Lee, C.J.; Kim, D.Y.; Jung, M.J. Adsorption of 2-mercaptopyridine and 4-mercaptopyridine on a silver surfaces investigated by SERS spectroscopy. J. Ind. Eng. Chem. 2012, 18, 2141–2146. [Google Scholar] [CrossRef]
  54. Hu, J.; Zhao, B.; Xu, W.; Li, B.; Fan, Y. Surface-enhanced Raman spectroscopy study on the structure changes of 4-mercaptopyridine adsorbed on silver substrates and silver colloids. Spectrochim. Acta Part A Mol. Biomol. Spectrosc. 2002, 58, 2827–2834. [Google Scholar] [CrossRef]
  55. Guo, H.; Ding, L.; Zhang, T.; Mo, Y. 4-Mercaptopyridine adsorbed on pure palladium island films: A combined SERS and DFT investigation. J. Mol. Struct. 2013, 1035, 231–235. [Google Scholar] [CrossRef]
  56. Guo, X.; Chen, F.; Wang, F.; Wu, Y.; Ying, Y.; Wen, Y.; Yang, H.; Ke, Q. Recyclable Raman chip for detection of trace Mercury ions. Chem. Eng. J. 2020, 390, 124528–124536. [Google Scholar] [CrossRef]
  57. Huang, Z.; Meng, G.; Huang, Q.; Chen, B.; Zhu, C.; Zhang, Z. Large-area Ag nanorod array substrates for SERS: AAO template-assisted fabrication, functionalization, and application in detection PCBs. J. Raman Spectrosc. 2013, 44, 240–246. [Google Scholar] [CrossRef]
  58. Ordal, M.A.; Long, L.L.; Bell, R.J.; Bell, S.E.; Bell, R.R.; Alexander Jr., R. W.; Ward, C.A. Optical properties of the metals Al, Co, Cu, Au, Fe, Pb, Ni, Pd, Pt, Ag, Ti, and W in the infrared and far infrared. Appl. Opt. 1983, 22, 1099–1119. [Google Scholar] [CrossRef]
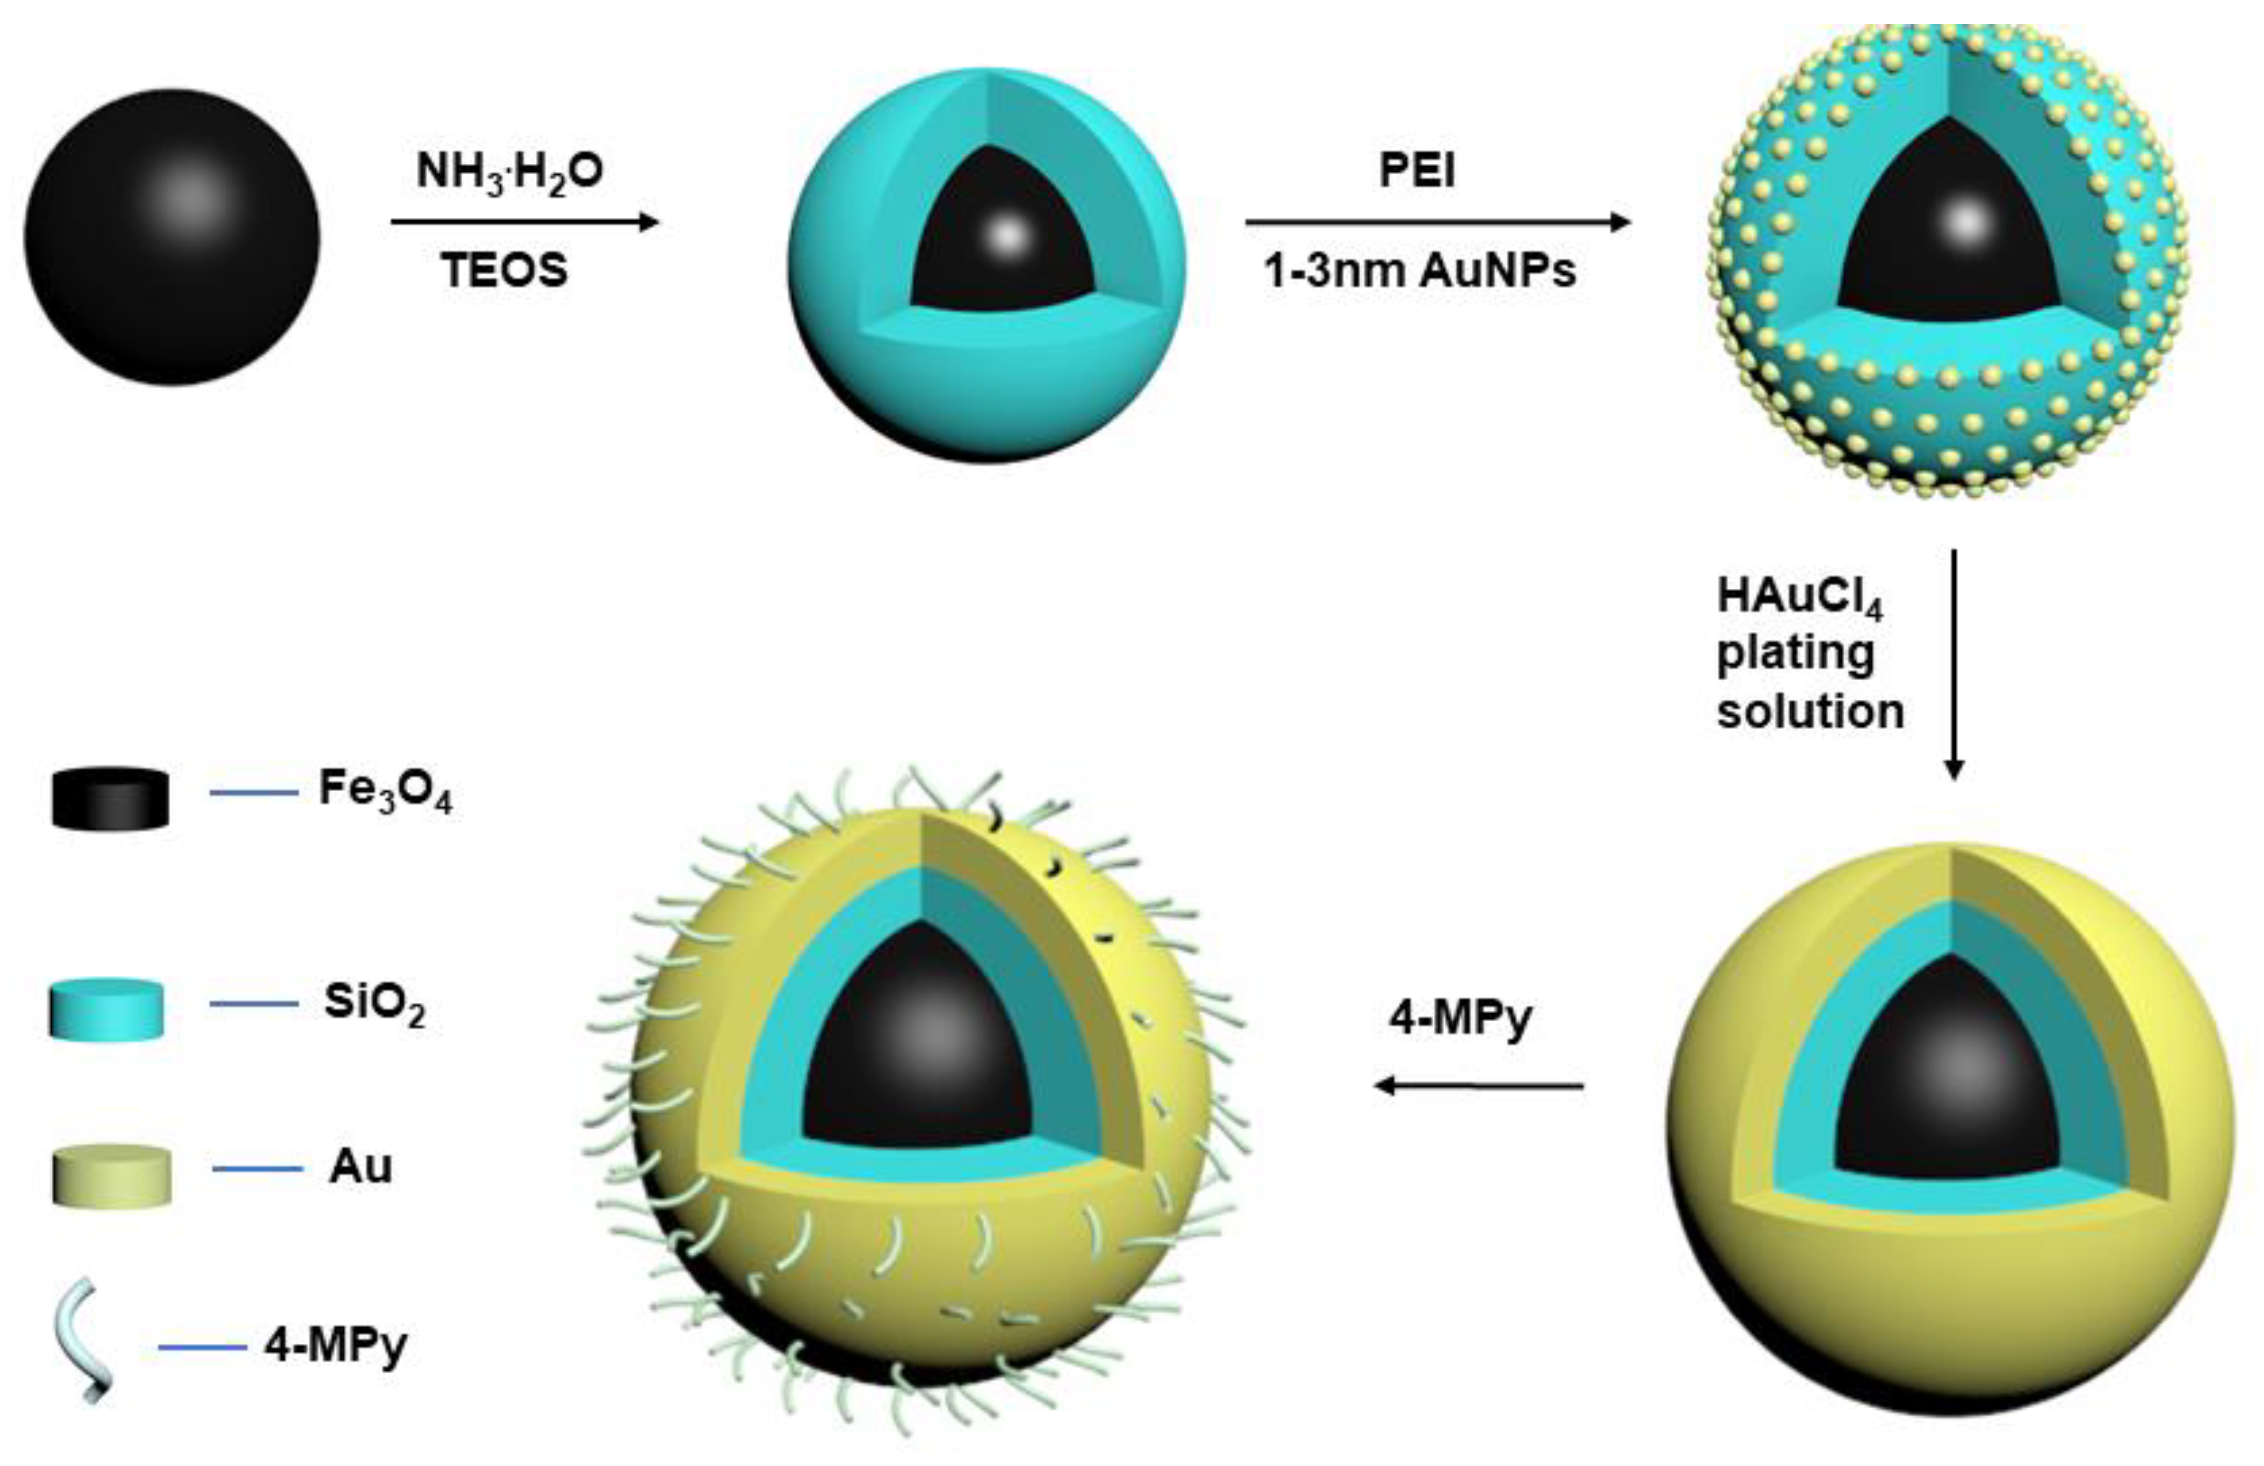
Figure 1. Synthesis route of Fe3O4@SiO2@Au/4-MPy composite microspheres.
Chemosensors 11 00347 g001
Figure 2. SEM images of (A) Fe3O4 NPs, (C) Fe3O4@SiO2 NPs, and (E) Fe3O4@SiO2@Au NPs. Size distribution histogram of Fe3O4 NPs, Fe3O4@SiO2 NPs, and Fe3O4@SiO2@Au NPs calculated from the SEM images (B,D,F,H) TEM images of Fe3O4@SiO2@Au NPs, and corresponding elemental mapping in (JN). (G) TEM image and (I) bright-field TEM image of a single Fe3O4@SiO2@Au NP.
Chemosensors 11 00347 g002
Scheme 1. The Schematic illustration of SERS detection of Hg (II) ions absorbed on Fe3O4@SiO2@Au/4-MPy magnetic microspheres.
Chemosensors 11 00347 sch001
Figure 3. The Raman spectra of Fe3O4@SiO2@Au/4-MPy microspheres before and after adding Hg (II) ions (10 ppm). Inserted image is the corresponding Raman intensities of 4-MPy at 1093 cm−1.
Chemosensors 11 00347 g003
Figure 4. The mapping results of the Fe3O4@SiO2@Au/4-MPy microspheres in the absence and presence of Hg2+ ions, respectively. The (A,D) pictures are the SERS spectra for comparison before and after addition of mercury ions. The (B,E) are corresponding to intensity of I (1093 cm−1) and the (C,F) are the ratio of the I (416 cm−1)/I (436 cm−1), respectively.
Chemosensors 11 00347 g004
Figure 5. (A) The SERS spectra of the MNPs sensor with different amounts of Hg2+ ions. (B) The plot of a nearly lineal relationship of different concentration of Hg2+ from 100 ppm to 1 ppb. In addition, the inset picture is the log concentration of Hg2+ from 10 ppm to 1 ppb.
Chemosensors 11 00347 g005
Figure 6. (A) The Raman spectra of the MNPs sensor alternatively immersed into Hg2+ (1 ppm) or EDTA (10−3 M) solution, (B) the change of the Raman intensity at 1093 cm−1 with the recycle numbers.
Chemosensors 11 00347 g006
Figure 7. The theoretical simulation of the interaction between Hg2+ and 4-MPy on the MNPs.
Chemosensors 11 00347 g007
Figure 8. (A) The selectivity of Hg2+ Raman sensor compared with other metal ions (100 ppm). (B) The anti-interference ability of proposed Hg2+ Raman sensor from other anions, BSA and HA (100 ppm).
Chemosensors 11 00347 g008
Figure 9. Examples showing the feasibility of detection of Hg2+ ions in lake water.
Chemosensors 11 00347 g009
Figure 10. SERS image of single cell endocytosed MNPs before and after treatment of Hg2+.(A): Cells that have endocytosed MNPs, Bright-field (BF), Raman mapping at 2800 cm−1 (red channel), 1093 cm−1 (green channel), and 436 cm−1 (blue channel). (B): Cells that have endocytosed MNPs and incubated with Hg2+ (10−5 M) for 1 h, Bright-field (BF), Raman mapping at 2800 cm−1 (red channel), 1093 cm−1 (green channel), and 436 cm−1 (blue channel).
Chemosensors 11 00347 g010
Table 1. Assignment of Raman peaks of 4-MPy modified on magnetic microspheres.
Wavenumber/cm−1AssignmentReference
416/436C-S stretching[52]
715β(CC)/(C-S)[53]
1012Ring breathing[54]
1075β(CH)[54]
1093Ring breathing/C-S[52]
1212β(CH)[55]
1471ν(C=C)/ν(C=N)[53]
1575ν(C=C) with deprotonated nitrogen[52]
1610ν(C=C) with protonated nitrogen[52]
ν, stretching; β, bending.
Disclaimer/Publisher’s Note: The statements, opinions and data contained in all publications are solely those of the individual author(s) and contributor(s) and not of MDPI and/or the editor(s). MDPI and/or the editor(s) disclaim responsibility for any injury to people or property resulting from any ideas, methods, instructions or products referred to in the content.