Article

Fast Monitoring of Quality and Adulteration of Blended Sunflower/Olive Oils Applying Near-Infrared Spectroscopy

by
Magdalena Klinar
1,
Maja Benković
1,
Tamara Jurina
1,*,
Ana Jurinjak Tušek
1,
Davor Valinger
1,
Sandra Maričić Tarandek
2,
Anamaria Prskalo
2,
Juraj Tonković
2 and
Jasenka Gajdoš Kljusurić
1
1
Faculty of Food Technology and Biotechnology, University of Zagreb, Pierottijeva 6, 10000 Zagreb, Croatia
2
Zvijezda Plus d.o.o., Marijana Čavića 1, 10000 Zagreb, Croatia
*
Author to whom correspondence should be addressed.
Chemosensors 2024, 12(8), 150; https://doi.org/10.3390/chemosensors12080150
Submission received: 21 June 2024 / Revised: 20 July 2024 / Accepted: 30 July 2024 / Published: 2 August 2024

Abstract

:
Food adulteration which is economically motivated (i.e., food fraud) is an incentive for the development and application of new and fast detection methods/instruments. An example of a fast method that is extremely environmentally friendly is near-infrared spectroscopy (NIRS). Therefore, the goal of this research was to examine the potential of its application in monitoring the adulteration of blended sunflower/olive oils and to compare two types of NIRS instruments, one of which is a portable micro-device, which could be used to assess the purity of olive oil anywhere and would be extremely useful to inspection services. Both NIR devices (benchtop and portable) enable absorbance monitoring in the wavelength range from 900 to 1700 nm. Extra virgin oils (EVOOs) and “ordinary” olive oils (OOs) from large and small producers were investigated, which were diluted with sunflower oil in proportions of 1–15%. However, with the appearance of different salad oils that have a defined share of EVOO stated on the label (usually 10%), the possibilities of the recognition and manipulation in these proportions were tested; therefore, EVOO was also added to sunflower oil in proportions of 1–15%. The composition of fatty acids, color parameters, and total dissolved substances and conductivity for pure and “adulterated” oils were monitored. Standard tools of multivariate analysis were applied, such as (i) analysis of main components for the qualitative classification of oil and (ii) partial regression using the least square method for quantitative prediction of the proportion of impurities and fatty acids. Qualitative models proved successful in classifying (100%) the investigated oils, regardless of whether the added thinner was olive or sunflower oil. Developed quantitative models relating measured parameters with the NIR scans, resulted in values of R2 ≥ 0.95 and was reliable (RPD > 8) for fatty acid composition prediction and for predicting the percentage of the added share of impurity oils, while color attributes were less successfully predicted with the portable NIR device (RPD in the range of 2–4.2). Although with the portable device, the prediction potentials remained at a qualitative level (e.g., color parameters), it is important to emphasize that both devices were tested not only with EVOO but also with OO and regardless of whether proportions of 1–15% sunflower oil were added to EVOO and OO or EVOO and OO in the same proportions to sunflower oil.

1. Introduction

Olive (Olea europaea L.) is one of the oldest cultivated plants of which fruit is used for processing into oil or canning [1,2]. Olive oil is a highly valued food product with a rich taste that complements many dishes, especially those typical of the Mediterranean diet, with numerous beneficial effects on human health. However, due to the high demand and high price of extra virgin olive oil, there is a very high risk of its adulteration. Olive oil adulteration has become one of the biggest sources of agricultural fraud in the European Union and refers to the illegal practice of mixing olive oil with cheaper vegetable oils in order to make more profit, but also, the mislabeling (quality, origin, or type) of olive oil is considered adulteration [3]. Its production is an important branch of the world economy, and as much as 81% of the world’s olive oil and 69% of the world’s table oil is produced in the Mediterranean zone [4]. There are oils available on the market that are high-quality blends of extra virgin oil with other types of oil (e.g., 75% sunflower oil and 25% virgin olive oil), which offer thermal stability and a more neutral flavor profile. It is precisely with such high-quality oil mixtures (and the quality of which is proportional to the increase in price) that there is a possibility of adulteration. Chemically, most oils and fats are glycerides of tri-hydroxy alcohols, mainly glycerol. Because they are so similar, once the oils are mixed, it is often difficult to detect and distinguish the components of the mixture [5,6]. Thus, various contaminants have been found in virgin olive oils: everything from refined olive oil, raw olive pomace oil, and a synthetic mixture of olive oil and glycerol to oils, such as corn, cottonseed, hazelnut, canola, soybean, and sunflower oils [7]. In this way, adulteration also affects the quality of food of which olive oil is one of the components, although it is only carried out for economic reasons. Furthermore, the health problems that can occur due to oil adulteration are of concern [6]. The case of adulteration of oil from Spain in 1981 led to the definition of the term “toxic oil syndrome” by the World Health Organization [8]. The aforementioned case indicates the importance of the fight against the adulteration of olive oil for the purpose of consumer protection. Standard methods for determining the authenticity of olive oil have been defined by various international organizations, one of which is the International Olive Council (IOC) [7]. The methods used to determine authenticity can be divided into groups according to some of their main characteristics. In addition to the fact that the adulteration of olive oil can pose a danger to individual consumers, it also misleads all consumers because the product they are buying does not have the quality that is declared. It is precisely for these reasons that it is very important to detect adulterated olive oil. There are many different methods of detecting adulteration and determining the authenticity of olive oil, and they include chemical, spectroscopic, or sensory analyses. Previously, in order to detect the adulteration of olive oil and its geographical traceability, chromatographic techniques and techniques based on the DNA of olive oils and detection methods based on optical observation were used, as well the conventional methods based on marker compounds for counterfeit detection [9]. Near-infrared (NIR) spectroscopy has proven to be a very effective method in the detection of adulterated oil and has become very popular due to its many advantages, such as high speed of analysis, non-invasiveness, simplicity, and the possibility of processing a large number of samples [10]. It is a sample-analysis technique based on the absorption of electromagnetic radiation with a wavelength in the range of 780–2500 nm. This radiation, like all others, behaves like a wave, and when its frequency equals the energy of the vibrating molecule, a net transfer of energy occurs. This transfer of energy is carried out from radiation to the molecule and can be measured as a ratio of energy to the wavelength, which is called a spectrum. The same functional groups appearing in different molecules have a similar characteristic frequency, and this concept of group characteristic frequency is the basis of infrared spectroscopy analysis, as well as NIR spectroscopy. In addition, the NIR spectrum consists of combination bands and overtones [11]. Due to the overlapping bands, the information obtained via NIR spectroscopy alone cannot capture the synergy of the components, nor can it identify the presence of these components and interferents; therefore, additional data processing by applying chemometric tools is needed [12,13]. Even portable, miniaturized NIR instruments confirmed their applicability in fraudulent practices [14].
Bearing in mind the exceptional advantages offered by NIR spectroscopy, the aim of this study was to investigate the possibility of applying it (i) in the monitoring of blended sunflower/olive oil quality and (ii) detection of its adulteration through the use of two NIR devices, the benchtop and portable, micro-size one. Spectra recorded by the two devices were processed using multivariate analysis methods and combined with the analysis of the color and fatty acid profile of pure and blended oils to determine calibration models and their potential in predicting adulteration and fatty acid compositions but also to compare the two devices used.

2. Materials and Methods

In order to simulate the adulteration of blended sunflower/olive oils that could be expected on the market, ten oil samples were tested, seven of which were olive oils (two from industrial production and five of local producers), one sunflower oil (industrial), and two mixtures of olive and sunflower oil (industrial production). Adulteration was simulated by adding from 1 to 15% of sunflower oil to olive oils, and in order to simultaneously analyze the mixture of olive oil and sunflower oil, combinations were made in which sunflower oil was added from 85% to 99%. The total number of diluted and undiluted oil samples analyzed was 413 (2 × (7 oils × 15) + sunflower and two mixes). Two samples presenting a mix of sunflower and olive oil (10% of olive oil) were bought in a store labeled as Mediterranean oil (produced by the company Zvijezda plus d.o.o., Zagreb, Croatia). Table 1 presents the detailed nutritional composition. The specified sample that we list under “Mix oil” (labeled in tables and figures as “OSm”) is marked on the packaging as sunflower oil with 10% olive oil.

2.1. Colorimetry

The determination of oil color was performed using a PCE Instruments colorimeter. Also, CIELAB (French: Commission Internationale de l’Éclairage LAB) was used. The differences ∆L*, ∆a* and ∆b* reflect how much the test sample differs from the standard, and then based on these values, ∆E* is calculated according to the following formula:
Δ E * = Δ L * 2 + Δ a * 2 + Δ b * 2
where ΔE* presents the total color difference, ΔL* is the difference in brightness between the tested sample and the standard (pure olive oil or pure sunflower oil), and Δa* and Δb* are the differences in chromaticity between the tested sample and the standard [15].
The deviation between two colors can be evaluated according to the following criteria for the ΔE value*: ΔE* < 0.2 → the difference between the colors cannot be observed; ΔE* = 0.2–1 (the difference is noticeable); ΔE* = 1–3 (the difference is visible); ΔE* = 3–6 (the difference is clearly visible); and ΔE* > 6, where the color deviation is obvious. The addition of more than 15% sunflower oil was not simulated because the color change is already visible (ΔE* = 1–3 → the difference is visible).

2.2. Conductivity and Total Solutes

The Mettler Toledo SevenCompact S230 conductometer was used to measure the electrical conductivity and total dissolved solids (TDSs). The measurements were carried out by immersing the probe of the device in the cuvette containing the oil sample and then reading the results, which were expressed in µS/cm for electrical conductivity and mg/L for TDS. Three parallel measurements were made for each sample.

2.3. Analysis of Fatty Acid Composition

The evaluation of fatty acid methyl ester (FAME) was prepared according to the ISO method ISO 12966-2:2017 [16]; 4 mL of 2,2,4-trimethylpentane and 0.2 mL of transesterification reagent (2 mol/L potassium hydroxide in methanol) were added to the oil samples. After vigorous mixing of the suspension (30 s), it was left to stand for 5 min, during which delamination and the formation of two phases occurs. The organic layer is separated and used for analysis on a GC-2010 Plus instrument (Shimadzu, Tokyo, Japan). An InertCap Pure Wax column (0.25 mm I.D. × 30 m, df = 0.25 μm, Shimadzu, Japan) and a flame ionization detector (FID) with an automatic software solution were used. Instrumental control was carried out by analyzing the blank test and standard FAME Mix 37 (Supelco, (Bellefonte, PA, USA). The method was carried out according to the following operating conditions: (i) carrier gas: helium; (ii) injector temperature: 250 °C; and (iii) column temperature: 50 °C/5 min programmed to raise 5 °C/1 min to the final of 260 °C/30 min.
The qualitative identification of fatty acids was performed by comparing the retention times (RTs) of the recorded chromatograms of the samples and the standard FAME Mix 37, and the results were expressed as a percentage of total fatty acids present in the oil.

2.4. NIR Spectroscopy

Two measuring devices (laboratory and portable NIR instruments) were used, and their performances were compared.

2.4.1. Laboratory NIR Device

On a Control Development, Inc. NIR spectrometer (South Bend, IN, USA), model NIR-128-1.7-USB/6.25/50 µm, with a halogen light, and installed Control Development Spec32 software, v. 1.6, NIR spectra of all oil samples were recorded at ambient temperature (path length 1 nm) in the wavelength range from 904 nm to 1699 nm. The samples were recorded in cuvettes, and the absorption spectrum for each sample was recorded in triplicate.

2.4.2. Portable NIR Device

Oil samples were recorded with a portable NIR spectrometer (micro-NIR, NIR-S-T2, InnoSpectra Corporation, Hsinchu, Taiwan) in the wavelength range from 900 to 1700 nm with the use of the installed software ISC-NIRScan Version 2.18 (InnoSpectra Corporation, Hsinchu, Taiwan). Samples were also recorded in cuvettes placed in a portable device, at ambient temperature (path length 3.5 nm), and the absorption spectrum for each sample was recorded in triplicate.

2.5. Spectral Data Processing

All data obtained experimentally using colorimetric, conductometric, NIR spectroscopic, or fatty acid composition analysis were processed using the XLSTAT program Version 2022.4.5 (AddinSoft, Paris, France), and the chemometric modeling was conducted by use of The Unscrambler X 10.5.1 (CAMO, Oslo, Norway).

2.5.1. Repeatability and Reproducibility

Before any pre-processing and modeling, the spectra were checked for repeatability and reproducibility, as an indicator of precision. As suggested by Posom and Sirisomboon [17], selected samples should be scanned 10 separate times. Standard deviation (SD) and the average of the absorbance at selected wavelengths were calculated for previously mentioned scans. The result was presented as the relative standard deviation (RSD = SD/average) per observed wavelength. When the calculation is based on 10 consecutive scans where the sample should not be moved, this will result in repeatability. The reproducibility should be calculated on 10 scans for samples re-loaded and re-scanned. For those calculations, we examined samples O2, O5, S, and OSm. Following the instructions [18], the RSD calculation, key wavelengths are selected for the absorbance spectra from the benchtop instrument (1210 nm, 1400 nm, and 1657 nm) and for the portable instrument (1212, 1402 nm and 1648 nm). Although the absorption of any wavelength could be selected for the determination of precision parameters, we have used the wavelengths that (i) are in the range of our NIR instruments (900–1700 nm) and (ii) are confirmed to be associated with lipids [19] as at 1210 nm 1355–1400 nm and 1610–1725 nm.

2.5.2. Chemometric Modeling

Chemometric multi-variate analysis methods were used to develop the model. Principal Components Analysis (PCA) enables analysis and the grouping of data according to similarities or separation according to differences [20].
Different spectra pre-processing methods were tested (Multiplicative Scatter Correction (MSC), de-trending, Standard Normal Variate (SNV), and normalization), and as spectral derivation techniques, the Savitzky-Golay (SG) derivatives (1st and 2nd) were tested [21]. The SNV was applied to raw data followed by SG 2nd derivative processing. The variable importance for projection (VIP) was computed and used in the model development (VIP score greater than 1) [22]. The reduced number of wavelengths with the corresponding absorption values was added to the other data measured for the oils and their various mixtures, and a partial least square regression (PLS) was performed. Using PLS regression, prediction models of color parameters, electrical conductivity, TDS and fatty acid composition and the adulteration grade of blended sunflower/olive oils were created. The coefficient of determination (R2), standard error of prediction (SEP), root mean square error of prediction (RMSEP) and the ratio of standard error of performance to standard deviation (RPD) assessed the representativeness of the obtained models [23].

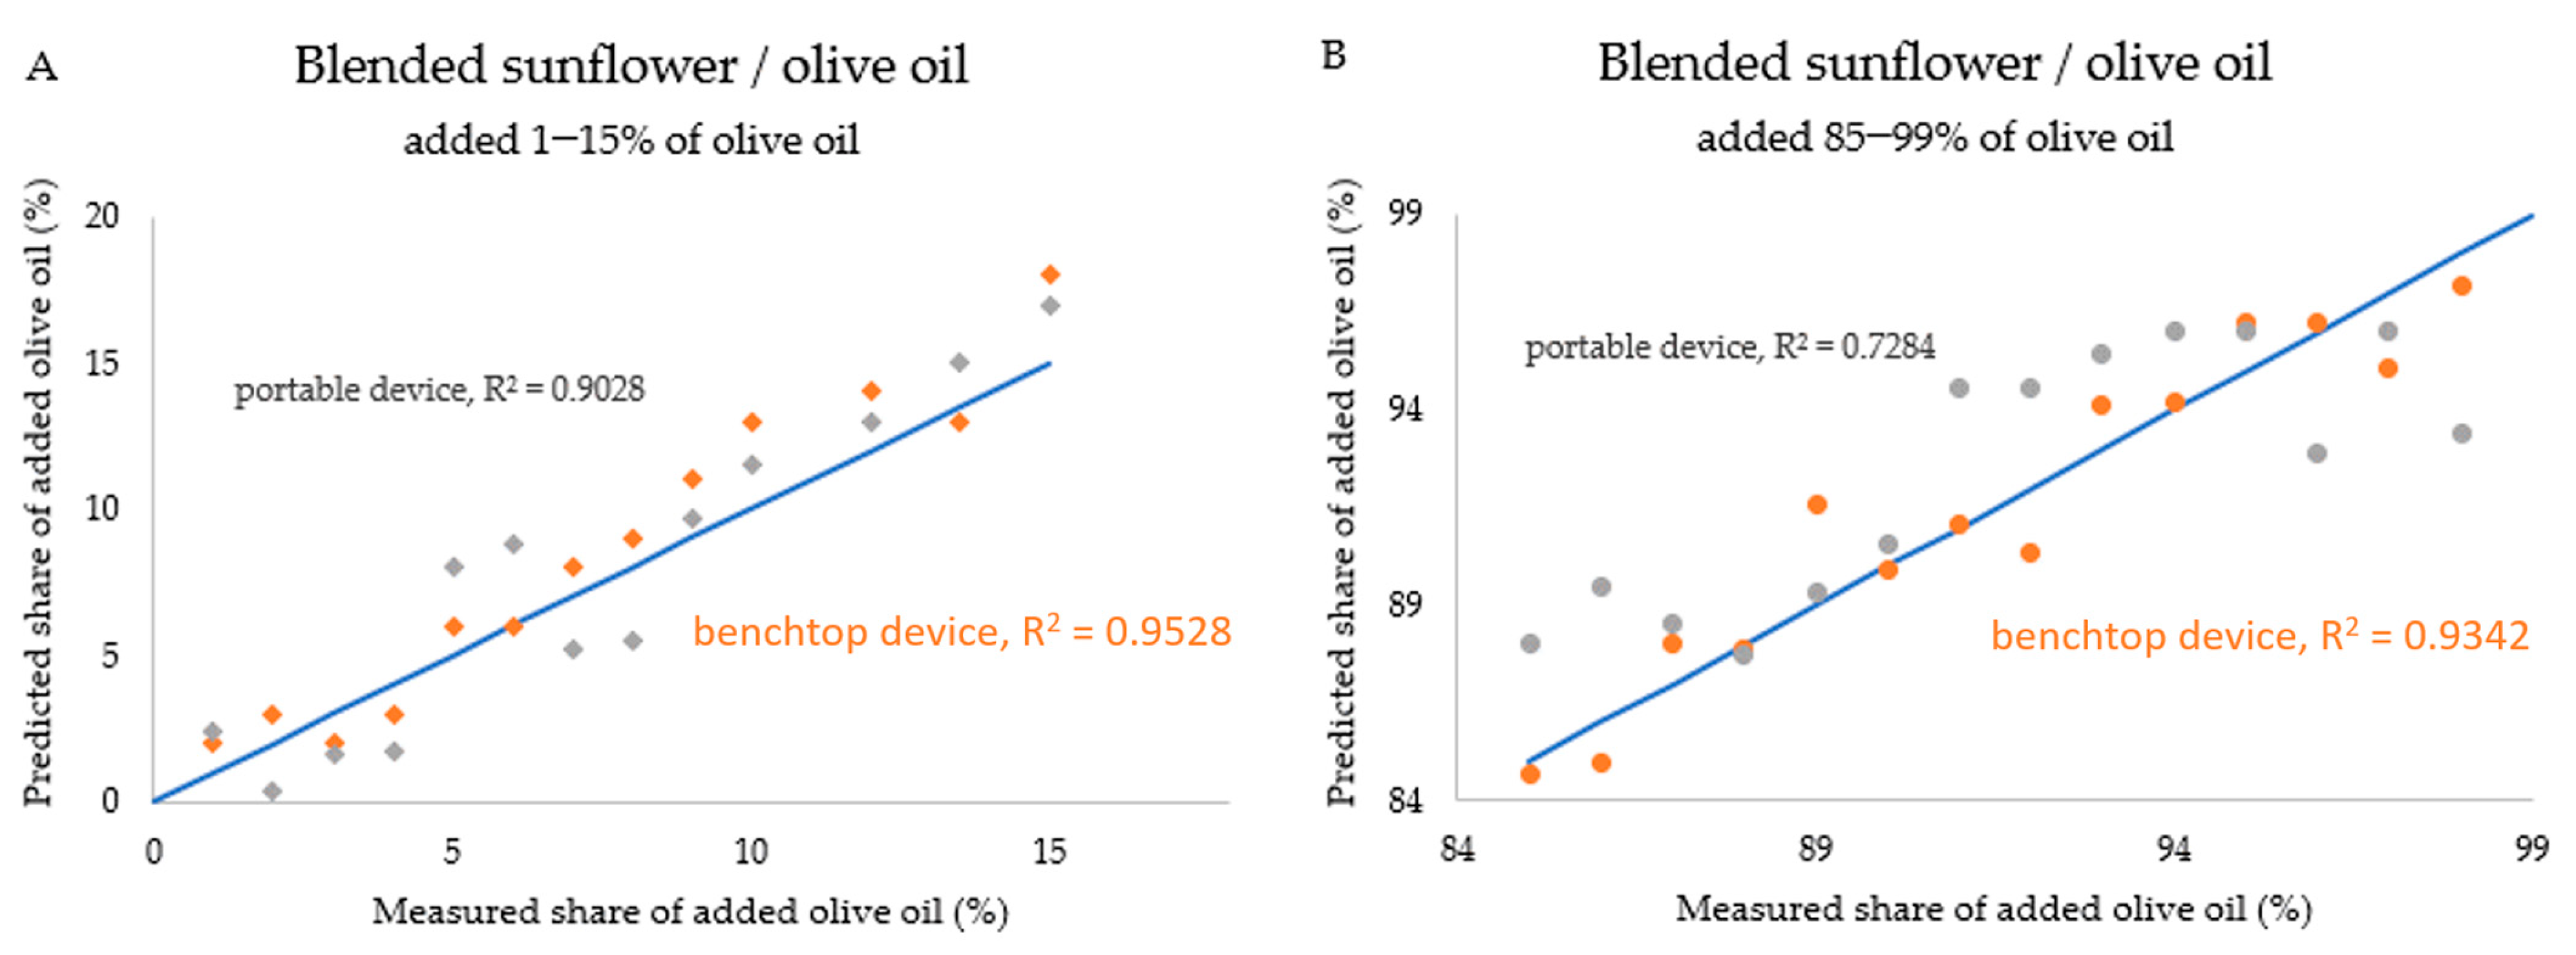
3. Results and Discussion

The main goal of this research was the application of near-infrared spectroscopy in detecting the quality and authenticity of high-quality sunflower/olive oil mixtures, through the creation of calibration models that could be used to predict the quality and composition of blended sunflower oils with the aim of detecting adulteration. A laboratory and a portable NIR spectrometer were used, and along with the recording of NIR spectra, the color parameters of the samples, the conductometric electrical conductivity, total dissolved substances, and the composition of fatty acids were determined.

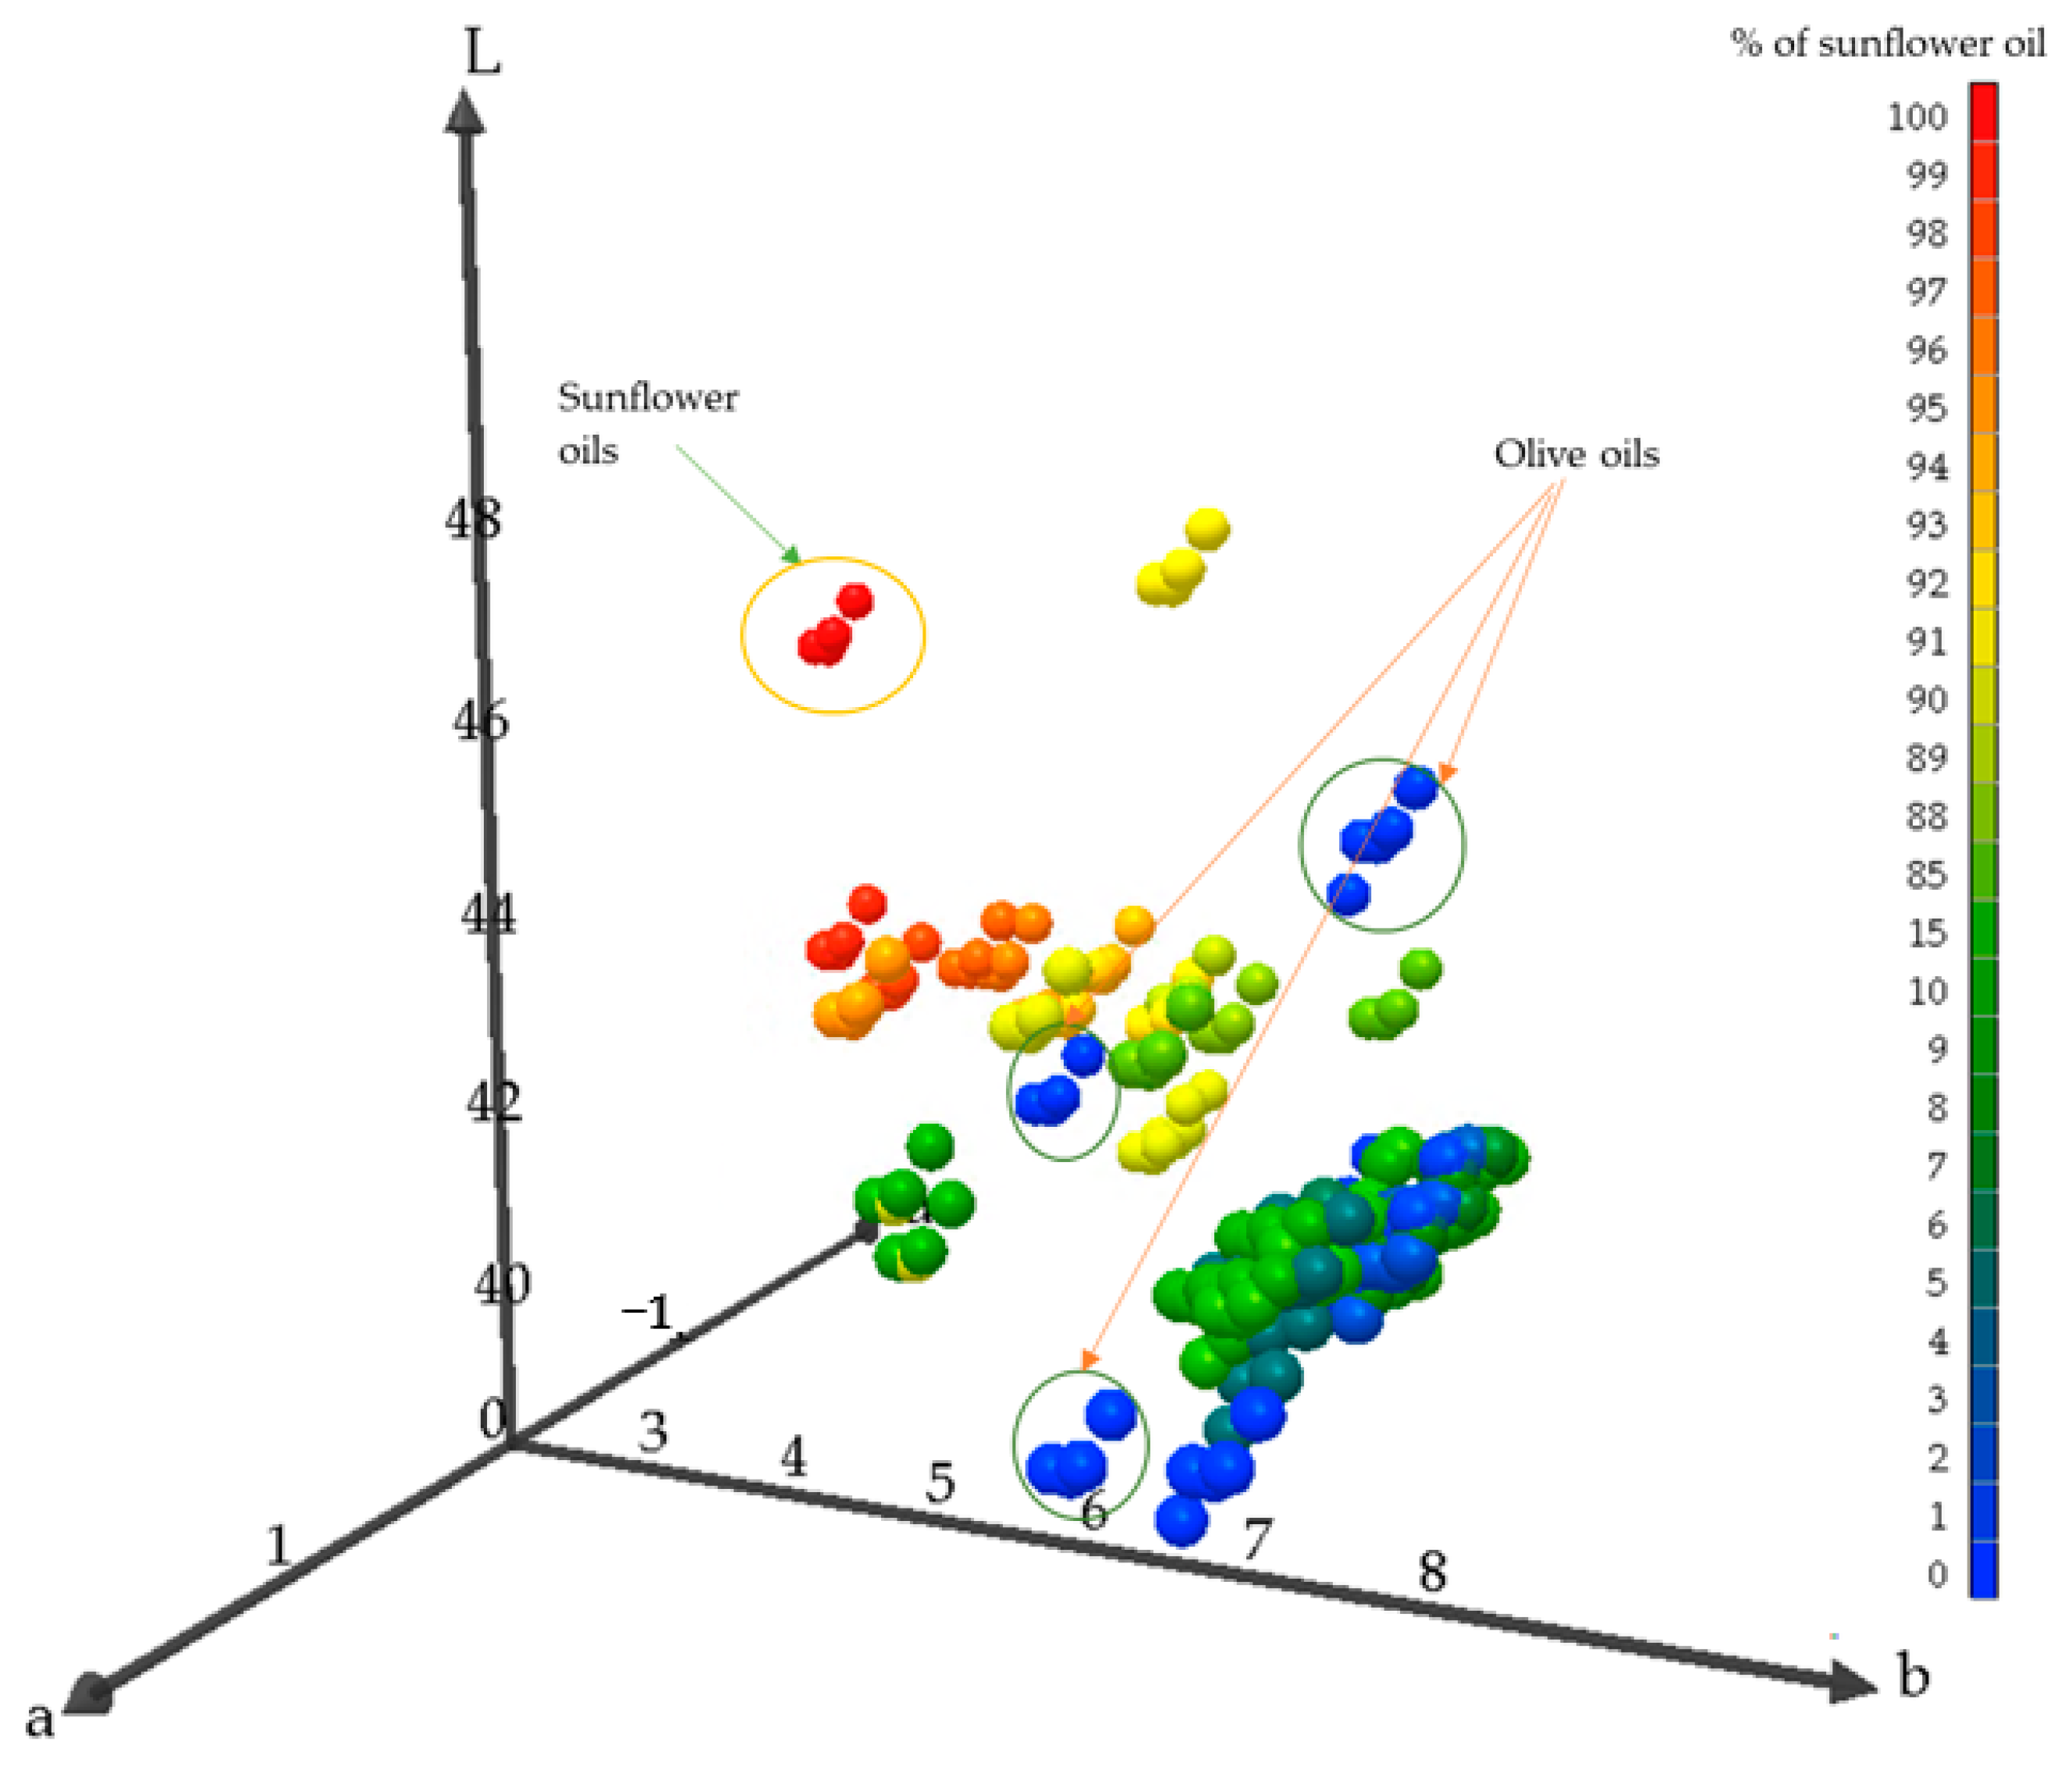
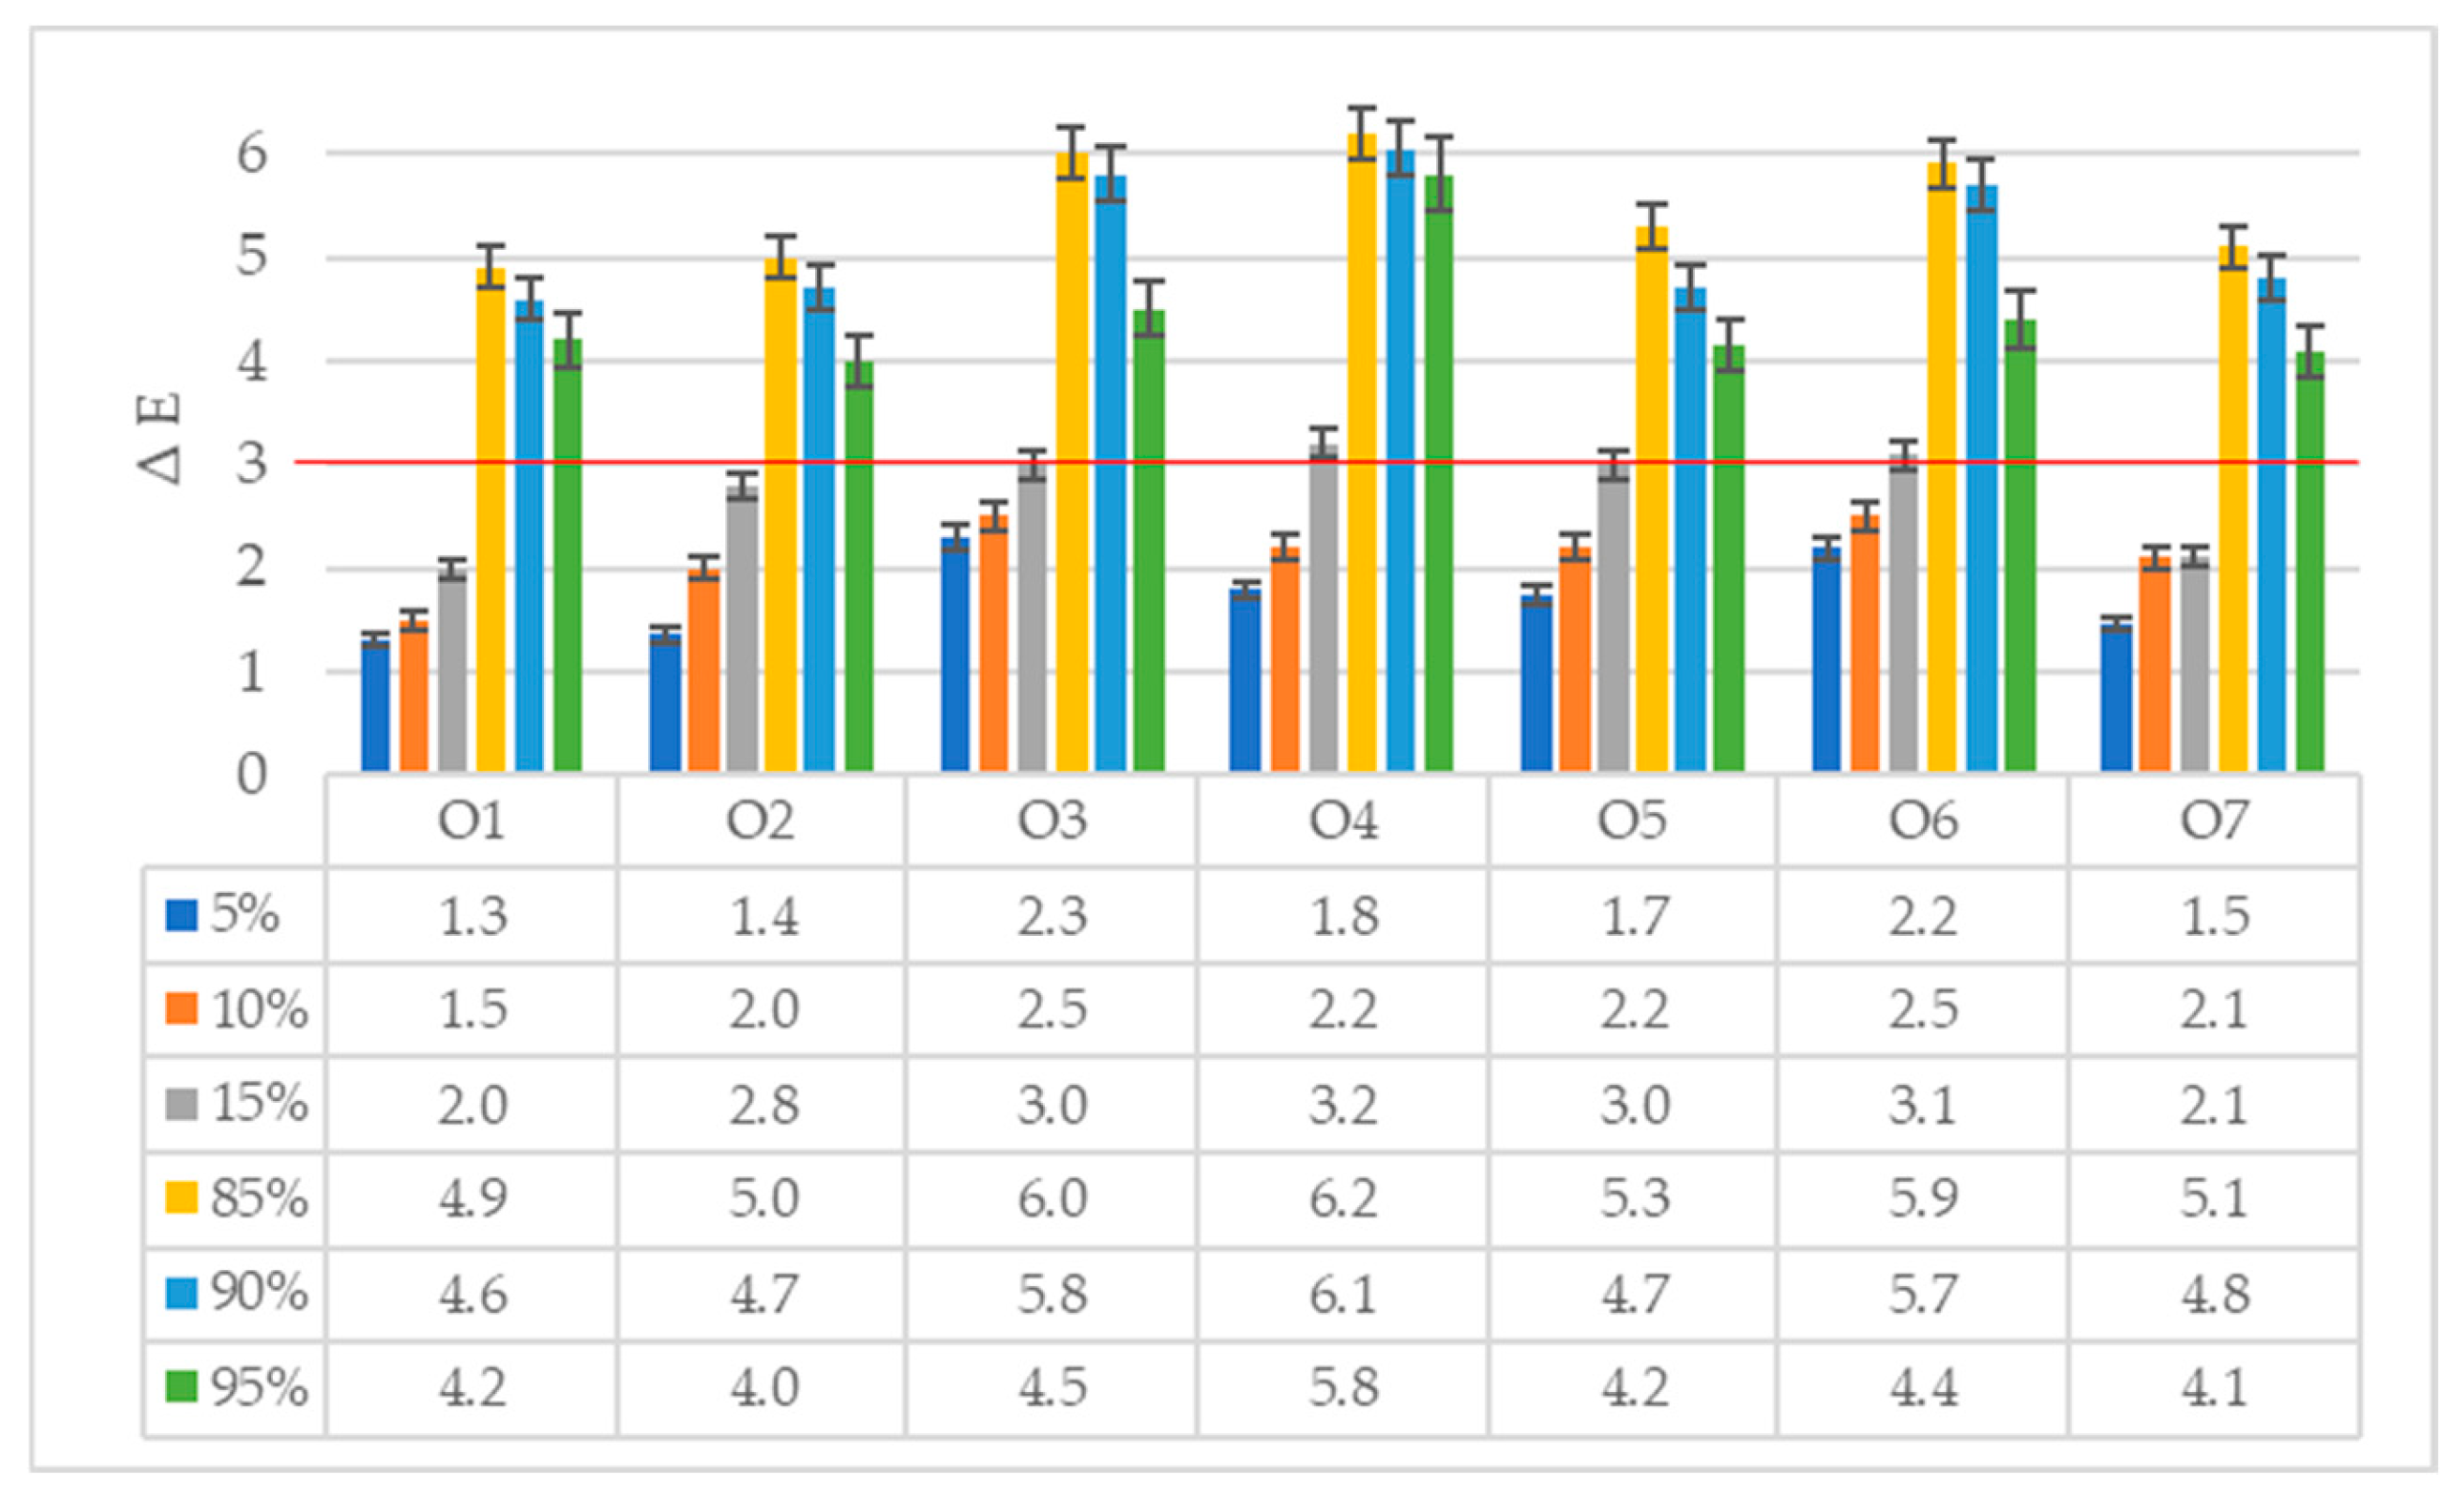
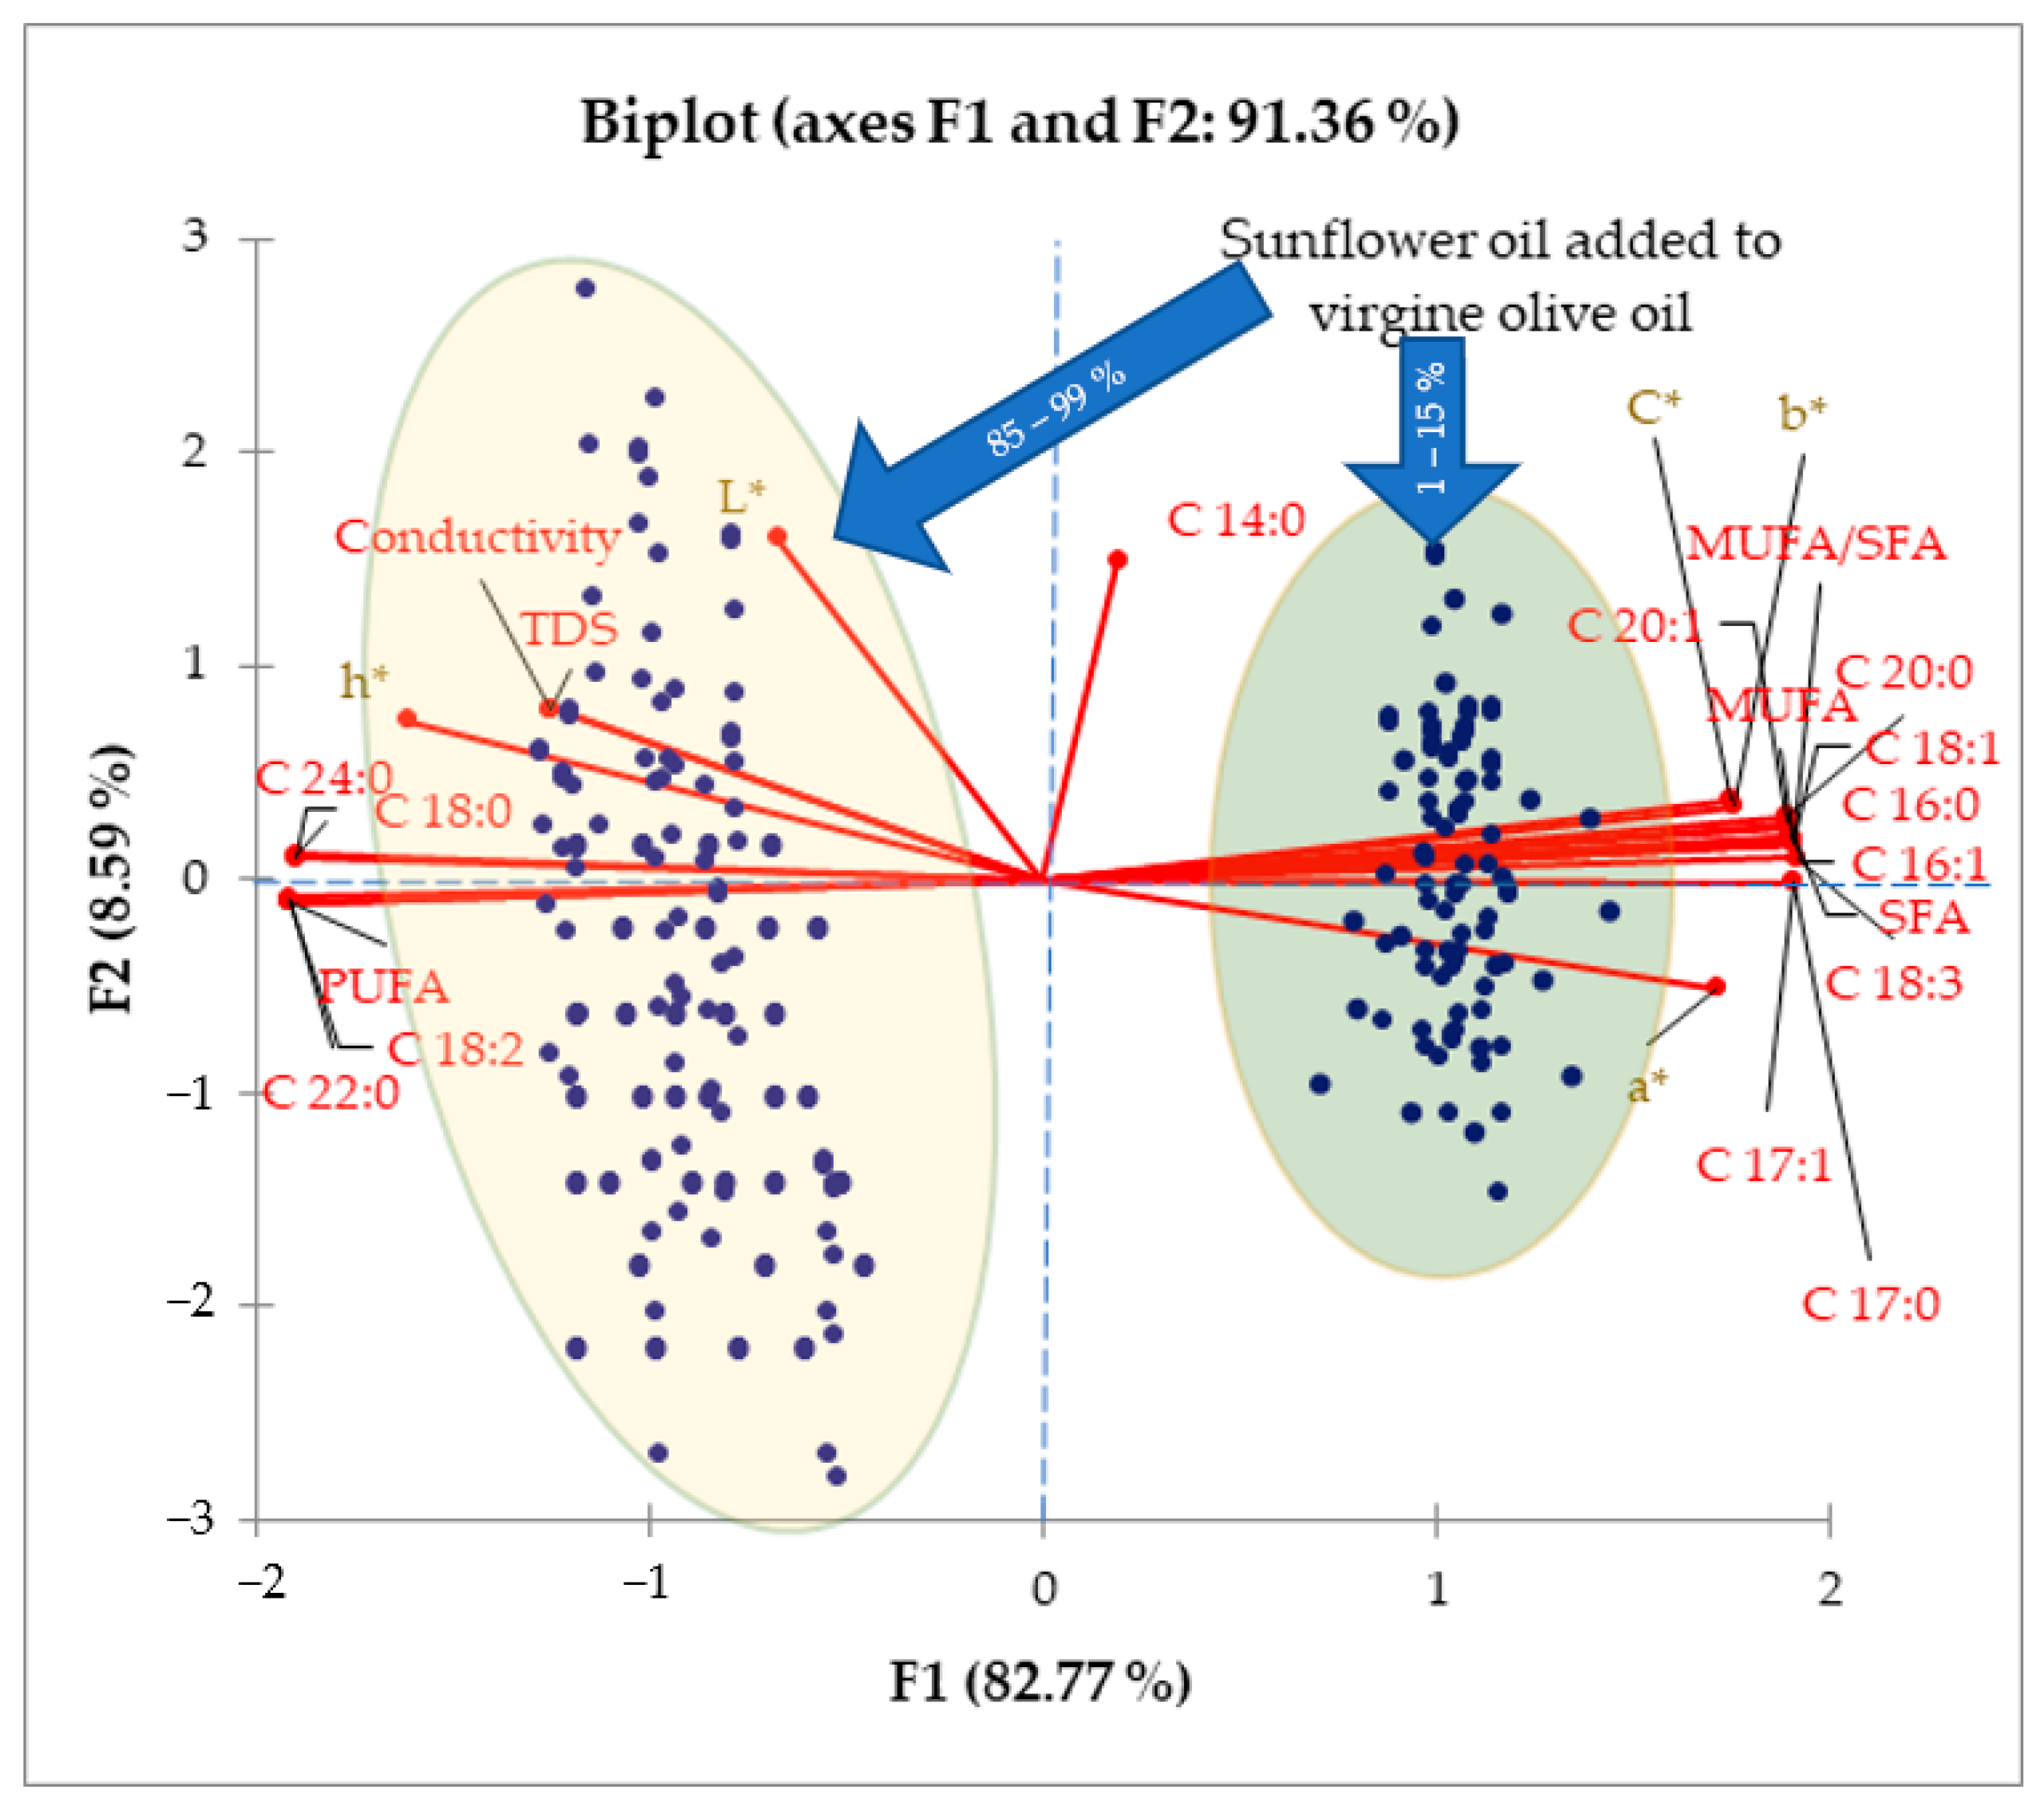
Color Measurement of Oil Samples

The characteristic green color of olive oil is due to the green pigment chlorophyll. It is present as gray-green chlorophyll a and yellow-green chlorophyll b, together with pheophytin a and pheophytin b, which are breakdown products of chlorophyll and have a brown color. In addition to chlorophyll, carotenoids also contribute to the color, the most important of which are β-carotene, lycopene, and xanthophyll [24]. Color, as one of the basic characteristics of the quality of olive oil, will vary depending on the color of the fruits used in production, the production process, and the storage method. The color and characteristics of the fruits are determined by the variety and maturity of the fruits but also by the climate and environmental conditions in which the plant grew [25]. All color parameters (including chroma (C*) and hue (h*)) and determined conductivity and total dissolved solids (TDS) with indicated similarity and/or dissimilarity for unadulterated oils are given in Table 2.
Even the same oil type (olive oils) shows different color parameters (Figure 1). Parameter a, with its negative values and those close to 0, indicates the dominance of green shades (−a = green; +a = red), while all b values are positive, which corresponds to the color yellow. The brightness values (L*) are in the range 39.8 to 42.5, indicating moderately bright samples (L* = 100 corresponds to white color). The chromatic effect of the oils is higher for olive oils compared to sunflower oil and the mixed sunflower/olive oil (90/10%) samples. The characteristic green color of edible oil is due to the green pigment chlorophyll, present as gray-green chlorophyll a and yellow-green chlorophyll b, together with pheophytin a and pheophytin b, which are breakdown products of chlorophyll and have a brown color [26]. In addition to chlorophyll, carotenoids also contribute to the olive oil color, the most important of which are β-carotene, lycopene, and xanthophyll [27]. Color, as one of the basic characteristics of olive oil quality, will vary depending on the color of the fruits used in production, the production process, and the storage method. The color and characteristics of the fruits are determined by the variety and maturity of the fruits but also by the climate and environmental conditions in which the plant grew [27]. Therefore, a statistically significant difference in color parameters observed between the seven olive oil samples produced from different olive oil varieties or from different geographical origin [28], as well as between the samples of olive oil with added sunflower oil, is expected. Even the method of filtering influences the color, which is confirmed by the research of Jabeur et al. [29] who stated that with the same oil, one of which is a filtrate, there is an increase in L* and b* values and a decrease in a* values. The increase in the L* value is probably due to the removal of suspended substances and plant water, while the decrease in the a* value and the increase in the b* value are manifested as a yellow and lighter green color of the filtered oil.
TDS is a parameter that determines the concentration of dissolved ions and is correlated with electrical conductivity, which is why they are often determined together [30]. However, according to the mentioned results, it can be concluded that neither the conductivity nor the TDS are parameters on the basis of which we can determine whether the oil is adulterated or not. Electrical conductivity is defined as the ability of a material or solution to conduct an electric current, and it depends mainly on the concentration of ions and the chemical composition of its constituents [31]. Ions are not found in edible oils, which means that they do not conduct electricity. However, the presence of several ions, free fatty acids, metal ions, and other similar substances is observed in lower quality oils, deep-fried oils, or adulterated oils [32]. Since color, conductivity, and TDS did not show significant potential in the detection of the adulteration of olive oil, the next step was to investigate the fatty acid composition as a potential indicator of the dilution of olive oil with sunflower oil. Conductivity in oils is important in terms of how well the electricity is passing through a substance [33] helping to understand the transport processes during food preparation or processing (e.g., frying), while TDS provides information of the dissolved solids, i.e., total inorganic and organic substances in the measured oil. Although the values for conductivity and TDS were fluctuating greatly, in the sample of industrial-produced oil samples, the OSm1 and OSm2, presenting the oil labeled as Mediterranean (90% sunflower oil with 10% of olive oil), the differences were statistically different based on two different batches, while for the same oils, the color parameters remained the same, which is certainly a feature that the consumer expects [34]. How the color parameters (Lab) change depending on the dilution of the olive oils can best be seen in the 3D view that follows in Figure 1. Pure sunflower oil had the highest L* value (42.5) and lowest a* and b* values (0.2 and 3.2), which is an indication of brighter and lighter yellow color.
The industrial produced olive oil samples and those produced by small producers differ in color (Figure 1); however, there is a visible change in the color parameters depending on the dilution of the olive oil. There is a visible change in the color parameters depending on the dilution of the olive oil, and the Δ E parameter is an indicator when these changes are visible to the naked eye. Therefore, the differences in color parameters from the standard oil are presented in Figure 2, according the Equation (1). In the case of the dilution of olive oil, in the range of 1–15% with sunflower oil, the standard color parameters were from the olive oils, while in the case of adding 85–99% sunflower oil in the olive oils, the standard color parameters of sunflower oil were used.
As presented in previously mentioned tables and figures, the color parameters can be related to adulteration but only if approximately 13% of sunflower oil is added to the olive oils (ΔE > 2). However, if adulteration of the Mediterranean blend, 90:10% sunflower:virgin olive oil, is observed, it will be noticeable at a glance [35] because already ≥5% of olive oil in the sunflower oil (which actually is ≥95% of sunflower oil added to the virgin olive oil) results in ΔE values over 4. Therefore, the colors do not give clear insight into potential adulteration, and the next step was to determine the differences depending on the proportion of fatty acids in the adulterated samples and originals. The fatty acid composition of analyzed oil samples is presented in Table 3.
Sunflower is dominated by three saturated fatty acids (C 18:0, C 22:0, C 24:0) and doubly unsaturated linoleic acid (C 18:2), which makes up the largest proportion of fatty acids in this oil. These four fatty acids in the graphs are located opposite the sample of undiluted olive oil, which means that they have the lowest values in that sample. Such results coincide with the results of Škevin et al. [36], who concluded in their work that sunflower oil has a significantly higher proportion of linoleic acid in its composition than olive oil and that the addition of 1% of sunflower oil to extra virgin olive oil will significantly change the proportion of linoleic fatty acid. Saturated fatty acids with chains of 6 to 14 carbon atoms are not found in the tested oils. According to Downey et al. [37], oleic fatty acid shows maximum absorption in the region of wavelengths around 1725 nm. Linolenic fatty acid (C 18:3), although it makes up a very small proportion of the total fatty acids in olive oil, dominates in it and not in sunflower oil. This was also proven in the research by Christopoulou et al. [38], who concluded that therefore the adulteration of olive oil with sunflower cannot be detected by determining the mentioned fatty acid. Bearing in mind the structure of fatty acids and chemical bonds, such as –CH3; –CH2; = CH2; C-H; and CH=CH, it is certainly more than justified to use NIR spectroscopy, which records the absorbance bands at the molecular level [39,40]. Medium-chain fatty acids were not detected (observed were C 6:0 (caproic acid); C 8:0 (enanthic acid); C 10:0 (capric acid); C 12:0 (lauric acid)). In the list of long-chain Fas, significant differences for the virgin olive oils and sunflower oil were determined. Observing the saturated FA, the palmitic acid (C 16:0) is five times higher in the olive oil vs sunflower oil, while the heptadecanoic acid (C 17:0) is not determined in sunflower oil, but it is in olive oil. Monounsaturated fatty acids show significant differences for the determined oleic acid, which is the dominant one in the olive oil (76.8%), and their sum is 2.5 times higher in olive oil (78.2%) compared to sunflower oil (31.7%). The opposite relationship was found for PUFAs; sunflower oil contains almost 10 times more fatty acids from this group (56.3% vs. 5.7% in olive oil). The main donor to that share is linoleic acid (C 18:2), which is dominant in sunflower oil (56.2%). The ratio of monounsaturated fatty acids to saturated (MUFA/SFA) favors olive oil and is almost twice as high (5.08 vs. 2.62 for sunflower oil). Now, it is clear that the fatty acids can be a valuable indicator of adulteration. This was also confirmed by the use of principal component analysis (PCA) used to investigate the potential grouping of samples based on the fatty acid composition and color parameters for adulterated oil samples (Figure 3).
The PCA showed that fatty acid composition and color parameters can explain 91.36% of all variations in the observed data matrix. In a qualitative way, results presented in Figure 3 confirm that oils with a higher share of sunflower oil contain more polyunsaturated fatty acids (Ʃ PUFA), stearic acid (C 18:0), linoleic acid (C 18:2), behenic acid (C 122:0), and lignoceric acid (C 24:0) and those oil samples are brighter (higher L*), with lower deviations in conductivity and TDS parameters. In the research, NIR spectra of oil samples were recorded in the range of wavelengths from 900 nm to 1700 nm, precisely in this wavelength range, because the vibrations of C-H bonds can be associated with lipids at these wavelengths [41]. According to Garcia Martin [42] the absorption band around 1720 nm is associated with the first overtone of the C-H bond within several chemical groups, such as –CH3, –CH2, and = CH2. Also, at wavelengths of approximately 1210 nm, there is a second overtone of C-H and CH=CH bonds. A stronger absorption signal is seen in the wavelength ranges from about 1150 nm to 1250 nm, 1390 nm to 1450 nm, and after 1650 nm. Inarejos-García et al. [43] also obtained a similar shape of absorption bands in their research and attributed the peak in the wavelength range between 1391 nm and 1413 nm to the C-H combination band. However, with a portable NIR device, the mutual separation of other samples is very weakly noticeable. Such results are consistent with the research of Arroyo-Cerezo et al. [14] who compared two portable NIR devices with laboratory ones and concluded that despite the fact that portable NIR devices can be a very useful tool for quality monitoring, they are still less precise compared to sophisticated laboratory NIR devices. The range of the NIR spectra (900–1699 nm) allows the vibrations of the C-C link and C-H bonds to be investigated, indicating the potential for linking with the fatty acid composition in the spectrum of observed samples [44,45]. The pre-processing of raw NIR spectra is used to minimize spectral noises [40], and we have used the most common spectra pre-processing methods (Multiplicative Scatter Correction (MSC), Standard Normal Variate (SNV), Smoothing, and 1st and 2nd Savitzky–Golay derivative). A combination of the Standard Normal Variate and S-G 1st derivative was confirmed as the most effective preprocessing methods. Such preprocessed NIR data were subjected to the color parameters and the fatty acid profile of the oil samples in order to construct calibration models. The PCA served as a multivariate tool in calculating the contribution factors of the wavelengths, of which the limit was set as greater than 0.7 [39,46]. Our study confirmed the findings of Kazazić et al. [39] where the correlative trend outlined only one fatty acid in the second factor (PC2), C14:0, and the brightness (L*) was a variable with the factor loading > 0.7 and C16:0, C16:1, C17:0, C17:1, C18:1, C18:3, C20:0, C20:1, Ʃ SFA, and Ʃ MUFA, with the color attributes a*, b*, and the Croma (C*), were in the first factor (PC1) of the PCA analysis. The next step was the investigation of the potential of use of NIR spectroscopy as an indicator of whether the oil sample is original or had some other oil added. Therefore, applying the partial least squares-discriminant analysis (PLS-DA), as a second multivariate tool, was needed. Olive oil purity is presented as a percentage (100% is pure olive oil; the other percentage is an equivalent of adulteration) and subjected to NIR spectra of those oils. The PLS-DA calculates the percentage of correctness of the purity prediction, based on the NIR spectra, and the recognition of adulteration was 100% correct, which indicates the NIR potential as an effective tool to indicate an adulterated olive oil sample. The next goal was to investigate the potential of predicting the measured parameters based on the NIR spectra, and for this step, it was crucial to use the pre-processed spectra and add them to the color attributes and fatty acid content of the tested oil samples. Depending on the device, the NIR-based NIR spectrum contained 796 (desktop) or 228 wavelengths (portable, micro-NIR). A separate data matrix was created for each device and then subjected to partial least squares regression (PLSR). Therefore, with the aim of developing a model for each observed color parameter, observed fatty acids, and percentage of adulteration of olive oil, the absorbance values of the spectra represented the input variables. The area of the NIR spectrum that represents the fingerprints for fatty acids, according to the literature, is in the area of 921–989 nm [6,39], which is in accordance with the first area that stood out as significant in our study and that is 930–940 nm. The next two regions separated are 1129–1251 nm and 1358–1494 nm, which is in accordance with the research of Garcia Martin [34]. These wave regions are characteristic of CH3 and CH2 stretching, CH stretching, or CH=CH stretching [6], and we expect exactly these bonds in fatty acids to be successful related to the NIR spectra. When the chemical composition is so indicative of sample differentiation, an option is to use non-destructive and cost-effective tools as near-infrared spectroscopy that can indicate if the sample is diluted without costly and time-consuming analytical measurements [39]. Therefore, all diluted samples were scanned with two types of NIR instruments: a (i) benchtop and (ii) micro device, both with a scan range from 900 nm to 1699 nm.
First, for the comparison of the two NIR devices, the precision was compared using two parameters, repeatability and reproducibility, which is presented in Table 4.
The repeatability results are based on results for ten spectra with the sample kept in place, while reproducibility is based on spectral data for the sample scanned ten times with repositioning between scans. The portable NIR instrument had peaks at 1212 nm, 1402 nm, and 1648 nm, while the benchtop NIR instrument had peaks at 1210, 1400 nm, and 1657 nm. The data presented in Table 4 show that the repeatability of the benchtop is the smallest, regardless of which wavelength was observed. The same trend was established for the reproducibility, in favor of the benchtop NIR device. Those results are in accordance of the study investigating the performances of two portable NIR devices and the Conventional Laboratory Spectrometer [18], where the precision parameters hold great promise. The next step is the comparison of the model outputs (coefficients of determinations, errors, and the ratio of prediction to deviation). To investigate the prediction potential based on NIR spectra, NIR preprocessed data were related to color attributes and fatty acid compositions. This allows the model for potential prediction use to be calibrated, where the NIR spectra is used to obtain information about the expected color parameters and/or fatty acid composition of oils, as well as to obtain information on whether the olive oil was adulterated. For this step, the partial least squares regression (PLSR) was applied with the aim of developing models, which are presented in Table 5.
Parameters used in the determination of model quality were as follows: (i) coefficient of determination for validation (R2v) and prediction (R2p); standard error of prediction (SEP), root mean square error of prediction (RMSEP) and the ratio of standard error of performance to standard deviation (RPD). The R-Squared values are expected to be as close as possible to 1, while the SEP and RMSEP values, as the measure of the precision of prediction and accuracy of prediction, should be as small as possible. The last parameter used in the model evaluation is the RPD, of which the definition (Ratio of Standard Error of Performance to Standard Deviation) implies that higher values suggest an increase in the model accuracy where the RPD in the range of 5–6.4 is an indicator of good calibration [40], but models with RPD values greater than 8 present models with excellent prediction odds [39].
Given that the calibration and validation data set must be representative of the current and future prediction samples, the set was split, through randomization, into 60:40% samples. The prediction was carried out on 30 samples of sunflower oil with added olive oil in proportions of 1–15% and 85–99%. The prediction ability of the added share of olive oil, based on the NIR scans of two NIR devices, is presented in Figure 4.
The modeling results showed the high efficiency of the desktop NIR device, but also of the micro-NIR device, the exceptional advantage of which is that it is small and portable, and it is not necessary to deliver the sample to the laboratory. As previously mentioned, PLSR models were developed for each observed fatty acid and adulteration fraction, as well as oil color parameters. The effectiveness of the model was evaluated on the basis of the RPD value and with the desktop NIR device; for fatty acids, almost all RPD values showed their excellence (all RPD > 8), while with the portable NIR, we had two exceptions with an RPD value equal to 7 (C17:0 and C17:1). Both devices were extremely effective in predicting adulteration, i.e., the proportion of added sunflower oil in olives, while quantitative prediction cannot be expected for color parameters with spectra recorded by a portable NIR. The less precise outcomes of the models for the portable device are in accordance with previous study conducted by Arroyo-Cerezo et al. [14]; however, the potential for the qualitative screening of oil samples for dilution still remains to be confirmed even with the portable NIR instrument. Although the validation values of the majority parameters seem to be promising (Table 5), the prediction of the “adulteration” chowed acceptable, but not so efficient, coefficients of determinations (Figure 4), especially when the concentration of olive oil was high and the proportion of sunflower oil was significantly lower (Figure 4B). The limit at which the prediction error of the proportion of added olive oil in mixtures is about 1.2% for a desktop instrument, while it is about 2% for a portable device.
Certainly, as a limitation of this study, the number of samples and the type of olive from which the oil was obtained should be considered; however, previous studies of olive oils with NIR spectroscopy support the results derived from this study [12,13,47] because the fatty acids of olive oil are specific, especially the proportion of C 18:1 (oleic acid) and thus the proportion of MUFA [34,38,42]. However, it should definitely be pointed out how the novelty of this study is related to the strengths of such approaches: the investigation of the qualitative and quantitative potential of the portable NIR device, as well as investigating (for the first time) the adulteration of a mixture of sunflower oil and olive oil, which increases the value of such oil in addition to its quality increase. For the added olive oil, regardless if it was in a form of EVOO or OO, the detection of adulteration was successful, regardless of the proportion of added olive oil, which is extremely important in quality control and compliance of the statements on the declaration with the actual content. However, the results indicate that the user must be aware that the precision of the device used has a significant impact, which can be especially critical if the prediction ability itself is evaluated on the basis of calibration–validation models. With the openness of science, spectrum sharing, methods will greatly improve all devices; therefore, this work is a small contribution to future progress.

4. Conclusions

The analysis of the color parameters L*, a*, and b* achieved qualitative separation between the samples according to the proportion of sunflower oil but based only on the calculated parameter ΔE value (but the lower concentrations of added sunflower oil were not detectable). Electrical conductivity and TDS were not indicative in the determination of oil adulteration. The composition of fatty acids showed potential for the separation of oil samples according to the addition of impurities (other oils) but only on a qualitative level, with the application of PCA analysis. NIR spectroscopy has shown exceptional potential for rapidly scanning the quality of olive oil samples (i.e., whether an undeclared amount of sunflower oil has been added). Based on the analytically determined proportions of fatty acids, it was possible to connect them with the spectra of two NIR devices and to predict the parameters of the color and contents of fatty acids with the help of the PLSR model. This is a confirmation that NIR spectroscopy has potential for the qualitative evaluation of oil but also for the quantitative prediction of fatty acids, which is extremely important because the high probability of detecting the adulteration of olive oil is related to the established profile of fatty acids, in a fast and reliable way, using NIR, and, at the same time, the consumption of solvents and the need for lengthy sample preparation and expensive analysis are minimized.

Author Contributions

Conceptualization, S.M.T., A.P., J.T. and J.G.K.; methodology, M.K., M.B., T.J., S.M.T., A.P., J.T. and J.G.K.; software, M.K., M.B., T.J., A.J.T., D.V. and J.G.K.; validation, M.K., M.B., T.J., A.J.T., D.V., S.M.T., A.P., J.T. and J.G.K.; formal analysis, M.K. and J.G.K.; investigation, M.K., M.B., T.J., A.J.T., D.V., S.M.T., A.P., J.T. and J.G.K.; resources, S.M.T., A.P., J.T. and J.G.K.; data curation, M.K., M.B., T.J., A.J.T., D.V. and J.G.K.; writing—original draft preparation, M.K. and J.G.K.; writing—review and editing, M.K., M.B., T.J., A.J.T., D.V., S.M.T., A.P., J.T. and J.G.K.; visualization, M.K., M.B., T.J., A.J.T., D.V., and J.G.K.; supervision, S.M.T., A.P., J.T. and J.G.K. All authors have read and agreed to the published version of the manuscript.

Funding

This research received no external funding.

Institutional Review Board Statement

Not applicable.

Informed Consent Statement

Not applicable.

Data Availability Statement

The dataset is available on request from the authors.

Acknowledgments

Hereby, we would like to thank the Zvijezda plus d.o.o. company for the oil samples provided for the research.

Conflicts of Interest

The authors, Sandra Maričić Tarandek, Anamaria Prskalo, and Juraj Tonković, are employed by the company Zvijezda plus d.o.o., Zagreb, Croatia. The remaining authors declare that the research was conducted in the absence of any commercial or financial relationships that could be construed as a potential conflict of interest.

References

  1. Klepo, T.; Benčić, Đ. Utjecaj genotipa na kemijski sastav maslinovog ulja. Glas. Zašt. Bilja 2014, 37, 44–53. [Google Scholar]
  2. Aparicio, R.; Hardwood, J. (Eds.) Preface. In Handbook of Olive Oil: Analysis and Properties, 2nd ed.; Springer: New York, NY, USA, 2013. [Google Scholar]
  3. Petir, M. Patvorine Maslinova Ulja na Tržištu EU-a—Parlamentarno Pitanje. 2019. Available online: https://www.europarl.europa.eu/doceo/document/E-8-2019-001332_HR.html (accessed on 10 June 2023).
  4. Coff, C.; Barling, D.; Korthals, M.; Nielsen, T. (Eds.) Ethical Traceability and Communicating Food, 15th ed.; The International Library of Environmental, Agricultural and Food Ethics; Springer: Dordrecht, The Netherlands, 2008; pp. 1–18. [Google Scholar]
  5. Barjol, J.L. Introduction. In Handbook of Olive Oil: Analysis and Properties, 2nd ed.; Aparicio, R., Hardwood, J., Eds.; Springer: New York, NY, USA, 2013; pp. 1–15. [Google Scholar]
  6. Christy, A.A.; Kasemsumran, S.; Du, Y.; Ozaki, Y. The Detection and Quantification of Adulteration in Olive Oil by Near-Infrared Spectroscopy and Chemometrics. Anal. Sci. 2004, 20, 935–940. [Google Scholar] [CrossRef]
  7. Aparicio, R.; Conte, L.S.; Fiebig, H.J. Olive Oil Authentication. In Handbook of Olive Oil: Analysis and Properties, 2nd ed.; Aparicio, R., Hardwood, J., Eds.; Springer: New York, NY, USA, 2013; pp. 590–641. [Google Scholar]
  8. Ferragut, V. The Toxic Oil Syndrome in Spain. In Case Studies in Food Safety and Environmental Health, 1st ed.; Ho, P., Cortez Vieira, M.M., Eds.; Springer: New York, NY, USA, 2007; pp. 43–51. [Google Scholar]
  9. Meenu, M.; Cai, Q.; Xu, B. A critical review on analytical techniques to detect adulteration of extra virgin olive oil. Trends Food Sci. Technol. 2019, 91, 391–408. [Google Scholar] [CrossRef]
  10. Mikulec, V.; Adamović, P.; Cvetković, Ž.; Ivešić, M.; Gajdoš Kljusurić, J. Green Techniques for Detecting Microplastics in Marine with Emphasis on FTIR and NIR Spectroscopy—Short Review. Processes 2023, 11, 2360. [Google Scholar] [CrossRef]
  11. Osborne, B.G. Near-Infrared Spectroscopy in Food Analysis. In Encyclopedia of Analytical Chemistry, 1st ed.; Meyers, R.A., McGorrin, R.J., Eds.; John Wiley & Sons, Ltd.: Hoboken, NJ, USA, 2006. [Google Scholar] [CrossRef]
  12. Folli, G.S.; Santos, L.P.; Santos, F.D.; Cunha, P.H.P.; Schaffel, I.F.; Borghi, F.T.; Barros, A.H.A.S.; Pires, A.A.; Ribeiro, A.V.F.N.; Romao, W.; et al. Food analysis by portable NIR spectrometer. Food Chem. Adv. 2022, 1, 100074. [Google Scholar] [CrossRef]
  13. Amirvaresi, A.; Parastar, H. Miniaturized NIR spectroscopy and chemometrics: A smart combination to solve food authentication challenges. Front. Anal. Sci. 2023, 3, 1118590. [Google Scholar] [CrossRef]
  14. Arroyo-Cerezo, A.; Yang, X.; Jiménez-Carvelo, A.M.; Pellegrino, M.; Felicita Savino, A.F.; Berzaghi, P. Assessment of extra virgin olive oil quality by miniaturized near infrared instruments in a rapid and non-destructive procedure. Food Chem. 2024, 430, 137043. [Google Scholar] [CrossRef]
  15. Strgar Kurečić, M. Osnove o Boji: Kontrola Boja-od Percepcije do Mjerenja. 2013. Available online: http://repro.grf.unizg.hr/media/download_gallery/OSNOVE%20O%20BOJI.pdf (accessed on 7 June 2023).
  16. ISO 12966-2:2017; Animal and Vegetable Fats and Oils—Gas Chromatography of Fatty Acid Methyl Esters. International Organization for Standardization: Geneva, Switzerland, 2017.
  17. Posom, J.; Sirisomboon, P. Evaluation of the higher heating value, volatile matter, fixed carbon and ash content of ground bamboo using near infrared spectroscopy. J. Near Infrared Spectrosc. 2017, 25, 301–310. [Google Scholar] [CrossRef]
  18. Wolfrum, E.J.; Payne, C.; Schwartz, A.; Jacobs, J.; Kressin, R.W. A Performance Comparison of Low-Cost Near-Infrared (NIR) Spectrometers to a Conventional Laboratory Spectrometer for Rapid Biomass Compositional Analysis. Bioenerg. Res. 2020, 13, 1121–1129. [Google Scholar] [CrossRef]
  19. Beć, K.B.; Grabska, J.; Huck, C.W. Miniaturized NIR Spectroscopy in Food Analysis and Quality Control: Promises, Challenges, and Perspectives. Foods 2022, 11, 1465. [Google Scholar] [CrossRef]
  20. Kljusurić, J.G.; Boban, A.; Mucalo, A.; Budić-Leto, I. Novel Application of NIR Spectroscopy for Non-Destructive Determina-tion of ‘Maraština’Wine Parameters. Foods 2022, 11, 1172. [Google Scholar] [CrossRef] [PubMed]
  21. Rinnan, Å.; Van Der Berg, F.W.J.; Engelsen, S.B. Review of the most common pre-processing techniques for near-infrared spectra. TrAC Trends Anal. Chem. 2009, 28, 1201–1222. [Google Scholar] [CrossRef]
  22. Mata, M.M.D.; Rocha, P.D.; Farias, I.K.T.; Silva, J.L.B.D.; Medeiros, E.P.; Silva, C.S.; Simões, S.D.S. Distinguishing cotton seed genotypes by means of vibrational spectroscopic methods (NIR and Raman) and chemometrics. Spectrochim. Acta Part A Mol. Biomol. Spectrosc. 2022, 266, 120399. [Google Scholar] [CrossRef] [PubMed]
  23. Fearn, T. Assessing Calibrations: SEP, RPD, RER and R2. NIR News 2002, 13, 12–13. [Google Scholar] [CrossRef]
  24. Žanetić, M.; Gugić, M. Zdravstvene vrijednosti maslinovog ulja. Pomol. Croat. 2006, 12, 159–173. [Google Scholar]
  25. Gandul-Rojas, B.; Gallardo-Guerrero, L.; Roca, M.; Aparicio-Ruiz, R. Chromatographic Methodologies: Compounds for Olive Oil Color Issues. In Handbook of Olive Oil: Analysis and Properties, 2nd ed.; Aparicio, R., Hardwood, J., Eds.; Springer: New York, NY, USA, 2013; pp. 220–254. [Google Scholar]
  26. Li, Q.; Wang, M.; Belén Fernández, M.; Sagymbek, A.; Dong, Y.; Gao, Y.; Yu, X. Indication of the color change on the oxidation properties of fragrant rapeseed oil during shelf storage. Food Chem. X 2023, 20, 100908. [Google Scholar] [CrossRef] [PubMed]
  27. Gandul-Rojas, B.; Cepero, M.R.L.; Mínguez-Mosquera, M.I. Use of chlorophyll and carotenoid pigment composition to determine authenticity of virgin olive oil. J. Am. Oil Chem. Soc. 2000, 77, 853–858. [Google Scholar] [CrossRef]
  28. Üçüncüoğlu, D.; Sivri-Özay, D. Geographical origin impact on volatile composition and some quality parameters of virgin olive oils extracted from the “Ayvalık” variety. Heliyon 2020, 6, e04919. [Google Scholar] [CrossRef] [PubMed]
  29. Jabeur, H.; Zribi, A.; Bouaziz, M. Changes in chemical and sensory characteristics of Chemlali extra-virgin olive oil as depending on filtration. Eur. J. Lipid Sci. Technol. 2016, 119, 1500602. [Google Scholar] [CrossRef]
  30. Sar, T.; Ozturk, M.; Taherzadeh, M.J.; Ferreira, J.A. New Insights on Protein Recovery from Olive Oil Mill Wastewater through Bioconversion with Edible Filamentous Fungi. Processes 2020, 8, 1210. [Google Scholar] [CrossRef]
  31. Yu, X.; Yang, C.; Du, S.; Gao, J. A New Method for Determining Free Fatty Acid Content in Edible Oils by Using Electrical Conductivity. Food Anal. Methods 2012, 5, 1453–1458. [Google Scholar] [CrossRef]
  32. Yang, Y.; Li, Q.; Yu, X.; Chen, X.; Wang, Y. A novel method for determining peroxide value of edible oils using electrical conductivity. Food Control 2014, 39, 198–203. [Google Scholar] [CrossRef]
  33. Turgut, A.; Tavman, I.; Tavman, S. Measurement of Thermal Conductivity of Edible Oils Using Transient Hot Wire Method. Int. J. Food Prop. 2009, 12, 741–747. [Google Scholar] [CrossRef]
  34. Ilak Peršurić, A.S. Segmenting Olive Oil Consumers Based on Consumption and Preferences toward Extrinsic, Intrinsic and Sensorial Attributes of Olive Oil. Sustainability 2020, 12, 6379. [Google Scholar] [CrossRef]
  35. Sands, S. Delta E: A Key to Understanding Lightfastness Readings. 2016. Available online: https://justpaint.org/delta-e/ (accessed on 7 June 2024).
  36. Škevin, D.; Kraljić, K.; Miletić, L.; Obranović, M.; Neđeral, S.; Petričević, S. Adulteration of Oblica Virgin Olive Oil with Edible Sunflower and Refined Olive Pomace Oil. CJFTBN 2011, 6, 117–122. [Google Scholar]
  37. Downey, G.; McIntyre, P.; Davies, A.N. Detecting and quantifying sunflower oil adulteration in extra virgin olive oils from the eastern mediterranean by visible and near-infrared spectroscopy. J. Agric. Food Chem. 2002, 50, 5520–5525. [Google Scholar] [CrossRef] [PubMed]
  38. Christopoulou, E.; Lazaraki, M.; Komaitis, M.; Kaselimis, K. Effectiveness of determinations of fatty acids and triglycerides for the detection of adulteration of olive oils with vegetable oils. Food Chem. 2004, 84, 463–474. [Google Scholar] [CrossRef]
  39. Kazazić, S.; Gajdoš Kljusurić, J.; Radeljević, B.; Plavljanić, D.; Špoljarić, J.; Ljubić, T.; Bilić, B.; Mikulec, N. Comparison of GC and NIR spectra as a rapid tool for food fraud detection—The case of butter adulteration with different fats. J. Food Process. Preserv. 2021, 45, e15732. [Google Scholar] [CrossRef]
  40. Nutrizio, M.; Gajdoš Kljusurić, J.; Marijanović, Z.; Dubrović, I.; Viskić, M.; Mikolaj, E.; Chemat, F.; Režek Jambrak, A. The Potential of High Voltage Discharges for Green Solvent Extraction of Bioactive Compounds and Aromas from Rosemary (Rosmarinus officinalis L.)—Computational Simulation and Experimental Methods. Molecules 2020, 25, 3711. [Google Scholar] [CrossRef]
  41. Barbin, D.F.; De Souza Madureira Felicio, A.L.; Sun, D.W.; Nixdorf, S.L.; Hirooka, E.Y. Application of infrared spectral techniques on quality and compositional attributes of coffee: An overview. Food Res. Int. 2014, 61, 23–32. [Google Scholar] [CrossRef]
  42. García Martín, J.F. Potential of Near-Infrared Spectroscopy for the Determination of Olive Oil Quality. Sensors 2022, 22, 2831. [Google Scholar] [CrossRef] [PubMed]
  43. Inarejos-García, A.M.; Gómez-Alonso, S.; Fregapane, G.; Salvador, M.D. Evaluation of minor components, sensory characteristics and quality of virgin olive oil by near infrared (NIR) spectroscopy. Food Res. Int. 2013, 50, 250–258. [Google Scholar] [CrossRef]
  44. Cascant, M.M.; Breil, C.; Fabiano-Tixier, A.S.; Chemat, F.; Garrigues, S.; De la Guardia, M. Determination of fatty acids and lipid classes in salmon oil by near infrared spectroscopy. Food Chem. 2018, 239, 865–871. [Google Scholar] [CrossRef] [PubMed]
  45. Özdemir, İ.S.; Dağ, Ç.; Özinanç, G.; Suçsoran, Ö.; Ertaş, E.; Bekiroğlu, S. Quantification of sterols and fatty acids of extra virgin olive oils by FT-NIR spectroscopy and multivariate statistical analyses. LWT Food Sci. Technol. 2018, 91, 125–132. [Google Scholar] [CrossRef]
  46. De Pascali, S.A.; Gambacorta, L.; Oswald, I.P.; Del Coco, L.; Solfrizzo, M.; Fanizzi, F.P. 1H NMR and MVA metabolomic profiles of urines from piglets fed with boluses contaminated with a mixture of five mycotoxins. Biochem. Biophys. Rep. 2017, 11, 9–18. [Google Scholar] [CrossRef]
  47. Abu-Khalaf, N.; Hmidat, M. Visible/Near Infrared (VIS/NIR) spectroscopy as an optical sensor for evaluating olive oil quality. Comput. Electron. Agric. 2020, 173, 105445. [Google Scholar] [CrossRef]
Figure 1. 3D presentation of the color space (L, a, and b) for sunflower and olive oils (in a pure form, as well as mixed (1–15%, 85–99% of added sunflower oil in olive oils)).
Chemosensors 12 00150 g001
Figure 2. Color changes in diluted olive oil samples (5–15% diluted samples were calculated according the standard olive oil and 85–95% according to sunflower oil).
Chemosensors 12 00150 g002
Figure 3. Grouping of samples based on the fatty acid composition and color parameters for adulterated oil samples.
Chemosensors 12 00150 g003
Figure 4. Measured vs. predicted shares of added olive oil in the sunflower oil, based on NIR scans of the benchtop NIR device and the portable one for blended sunflower oils with 1–15% olive oil (A) and 85–99% (B).
Chemosensors 12 00150 g004
Table 1. Basic nutritive information of analyzed oils.
Olive Oil
(Industrial Production)
Olive Oil
(Small Producers)
Sunflower OilMediterranean Oil (OSm)
(Industrial, 10% Olive Oil)
Energy (kcal/kJ)899/3696884/3695828/3404 828/3404
Fats (g)99.91009292
SFA (g)15.4141111
Vitamin E (mg)17174637
SFA: saturated fatty acids; Mediterranean oil is labeled as 90:10% sunflower:virgin olive oil.
Table 2. Average color parameters for investigated oil samples.
Oil SamplesColor Parameters Conductivity TDS
L*a*b*C*h*(µS/cm)(mg/L)
O140.8 ± 0.1 c,a−0.7 ± 0 a7.5 ± 0 a7.6 ± 0 a84.9 ± 0 a1094 ± 8.7 a547 ± 4.4 a
O240.9 ± 0.1 a−0.4 ± 0 b7.5 ± 0 a7.5 ± 0 a86.9 ± 0.1 b1083.3 ± 1.5 a541.3 ± 0.6 a
O341.2 ± 0.1 b−0.5 ± 0 b7.8 ± 0 b7.8 ± 0 b86.4 ± 0 b1478.7 ± 29 b739 ± 14.8 b
O439.8 ± 0.1 c−0.7 ± 0 a5.8 ± 0 c5.8 ± 0 c83.2 ± 0 c2766.7 ± 282.9 b,c1382.7 ± 140 b,c
O540.7 ± 0.1 c,a−0.6 ± 0 b7 ± 0 b7.1 ± 0 c85.2 ± 0.1 b3033.3 ± 49.3 c1517 ± 22.7 c
O640.3 ± 0.1 c−0.6 ± 0 b6.4 ± 0.1 c6.4 ± 0.1 c84.8 ± 0 a1091 ± 10.4 a545.7 ± 4.9 a
O739.8 ± 0.1 c−0.6 ± 0 b7 ± 0 b7.1 ± 0 c83.2 ± 0.1 c1504.9 ± 33 b747 ± 17.2 b
S42.5 ± 0 d−0.2 ± 0 c3.2 ± 0 d3.3 ± 0 d84.6 ± 0 c2266.7 ± 20.8 c1133.7 ± 8.3 b
OSm142.3 ± 0 d−0.3 ± 0 d5.4 ± 0 c5.4 ± 0 c87.9 ± 0 b1056.3 ± 4 d528 ± 1.7 b
OSm242.2 ± 0 d−0.3 ± 0 d5.4 ± 0 c5.4 ± 0 c88.2 ± 0.2 b1469 ± 0 b735 ± 0 b
O1–O7: olive oil samples; S: sunflower oil; OSm1 & OSm2: industrial mix of sunflower oil with 10% added olive oil. TDS: total dissolved solids. Different letters in the observed column indicate statistically significant differences (p < 0.01).
Table 3. Fatty acid composition of virgin olive oils produced in industrial and semi-industrial conditions and the adulterants.
Fatty AcidOlive Oil 100%Share of Added Sunflower OilSunflower
Oil 100%
5%10%15%85%90%95%
Long-chain fatty acids (LCFAs)
Saturated LCFA
C 14:00.1 ± 00.1 ± 00.1 ± 00.1 ± 00.1 ± 00.1 ± 00.1 ± 00.1 ± 0
C 16:011.5 ±0.35 $11.27 ± 0.3411.04 ± 0.3310.81 ± 0.32 #,$7.59 ± 0.23 #7.36 ± 0.22 #7.13 ± 0.21 #6.9 ± 0.23 #
C 17:00.1 ± 0 $0.1 ± 00.09 ± 00.09 ± 00.02 ± 00.01 ± 00.01 ± 00 ± 0 #
C 18:03.1 ± 0.093.13 ± 0.093.16 ± 0.093.19 ± 0.13.61 ± 0.113.64 ± 0.113.67 ± 0.113.7 ± 0.11
C 20:00.4 ± 0.010.4 ± 0.010.39 ± 0.010.39 ± 0.010.32 ± 0.010.31 ± 0.010.31 ± 0.010.3 ± 0.01
Monounsaturated LCFA
C 16:11 ± 0.03 $0.96 ± 0.030.92 ± 0.030.88 ± 0.03 $0.32 ± 0.01 #,$0.28 ±0.01 #,$0.24 ± 0.01 #0.2 ± 0.01 #
C 17:10.1 ± 0 $0.1 ± 00.09 ± 00.09 ± 00.02 ± 00.01 ± 00.01 ± 00. ± 0 #
C 18:176.8 ± 2.3 $74.53 ± 2.24 $72.25 ± 2.17 $69.98 ± 2.1 #,$38.13 ± 1.1435.85 ± 1.0833.58 ± 1.0131.3 ± 1.07 #
C 20:10.3 ± 0.010.3 ± 0.010.29 ± 0.010.29 ± 0.010.22 ± 0.010.21 ± 0.010.21 ± 0.010.2 ± 0.01
Polyunsaturated LCFA
C 18:25.1 ± 0.15 $7.66 ± 0.2310.21 ± 0.31 #,$12.77 ± 0.38 #,$48.54 ± 1.4651.09 ± 1.5353.65 ± 1.6156.2 ± 1.69 #
C 18:30.6 ± 0.02 $0.58 ± 0.02 $0.55 ± 0.02 $0.53 ± 0.02 $0.18 ± 0.01 #,$0.15 ± 0 #0.13 ± 0 #0.1 ± 0.01 #
Very-long-chain fatty acids
C 22:00.1 ± 0 $0.14 ± 00.17 ± 0.010.21 ± 0.01 #,$0.7 ± 0.02 #0.73 ± 0.02 #0.77 ± 0.02 #0.8 ± 0.02 #
C 24:00.1 ± 0 $0.11 ± 0 $0.12 ± 0 $0.13 ± 0 $0.27 ± 0.01 #0.28 ± 0.01 #0.29 ± 0.01 #0.3 ± 0.01 #
SFA15.4 ± 0.4615.24 ± 0.4615.07 ± 0.4514.91 ± 0.4512.6 ± 0.3812.43 ± 0.3712.27 ± 0.3712.1 ± 0.36
MUFA78.2 ±2.35 $75.88 ± 2.28 $73.55 ± 2.21 $71.23± 2.14 $38.68 ± 1.16 #36.35 ±1.09 #34.03 ± 1.02 #31.7 ± 0.98 #
PUFA5.7 ± 0.17 $8.23 ± 0.25 $10.76 ± 0.32 #,$13.29 ± 0.4 #,$48.71 ± 1.46 #,$51.24 ±1.54 #53.77 ±1.61 #56.3 ± 1.69 #
MUFA/SFA5.08 ±0.15 $4.98 ± 0.15 $4.88 ± 0.15 $4.78 ± 0.14 $3.07 ± 0.09 #2.92 ± 0.09 #2.77 ± 0.08 #2.62 ± 0.09 #
C 14:0 (myristic acid); C 16:0 (palmitic acid); C 16:1 (palmitoleic acid); C 17:0 (heptadecanoic acid); C 17:1 (heptadecenoic acid); C 18:0 (stearic acid); C 18:1 (oleic acid); C 18:2 (linoleic acid); C 18:3 (linolenic acid); C 20:0 (arachic acid); C 20:1 (eicosenoic acid); C 22:0 (behenic acid); C 24:0 (lignoceric acid); SFA—saturated fatty acids; MUFA—monounsaturated fatty acids; PUFA—polyunsaturated fatty acids; #—value significantly different from olive oil value; $—value significantly different from sunflower oil value; significance level (p < 0.05).
Table 4. Results of relative standard deviation (RSD) used in precision testing (including repeatability and reproducibility).
Precision Parameters for
Different Devices
NIR Spectra Wavelengths
≈1210 nm≈1400 nm≈1650 nm
Repeatability
Portable NIR1.7 × 10−22.1 × 10−21.8 × 10−2
Benchtop NIR1.1 × 10−21.8 × 10−34.7 × 10−3
Reproducibility
Portable NIR2.5 × 10−36.7 × 10−36.7 × 10−3
Benchtop NIR1.8 × 10−31.2 × 10−31.9 × 10−3
Table 5. Parameters indicating model efficiency in detecting color attributes and fatty acids proportions in investigated oil samples, for two different NIR devices.
Benchtop NIRMicro NIR
R2pR2vSEVRMSEVRPDR2pR2vSEVRMSEVRPD
Level of adulteration
as %0.99990.999215.662012.51518.60.99410.984316.443213.22118.2
Color attributes
L*0.99500.91510.02050.14316.90.72330.66010.15420.39272.0
a*0.99890.95140.02690.16397.60.89300.84580.19580.44253.1
b*0.99980.92420.20180.44937.00.83540.74870.66890.81784.2
Fatty acids
C 16:00.99990.99870.00510.07178.50.99240.98600.40720.63828.3
C 16:10.99990.99890.00010.01178.50.99400.98660.01400.11848.3
C 17:00.99990.99020.00010.00428.40.96630.92070.00020.01467.0
C 17:10.99990.99020.00010.00428.40.96630.92070.00020.01467.0
C 18:00.99990.99850.00010.01018.50.99170.98620.00690.08308.3
C 18:10.99990.99920.31850.5648.50.99420.98410.33420.62218.2
C 18:20.99990.99920.40850.63928.50.99410.97430.54100.71908.0
C 18:30.99990.99790.00010.00998.50.98970.97620.00480.06908.1
C 20:00.99990.99890.000010.00158.50.99400.98660.00020.01488.3
C 20:10.99990.99890.000010.00158.50.99400.98660.00020.01488.3
C 22:00.99990.99890.000010.01048.50.99280.98590.00950.09738.3
C 24:00.99990.9840.00010.01078.20.94760.93330.00100.03127.2
SFA0.99990.99890.0220.0478.50.99360.97560.21140.45988.0
MUFA0.99990.99920.33060.5758.50.99420.984143.00006.60008.2
PUFA0.99990.99920.39840.63128.50.99410.974250.00007.12008.0
MUFA/SFA0.99990.9990.00110.03358.50.99280.98100.12280.35008.2
L*—lightness; a*—the range from green to red; b*—the range from blue to yellow; SFA—saturated fatty acids; MUFA—monounsaturated fatty acids; PUFA—polyunsaturated fatty acids; R2v—coefficient of determination for validation; R2p—coefficient of determination for prediction; SEP—standard error of prediction; RMSEP—root mean square error of prediction; RPD—the ratio of standard error of performance to standard deviation.
Disclaimer/Publisher’s Note: The statements, opinions and data contained in all publications are solely those of the individual author(s) and contributor(s) and not of MDPI and/or the editor(s). MDPI and/or the editor(s) disclaim responsibility for any injury to people or property resulting from any ideas, methods, instructions or products referred to in the content.

