Article

Discrimination of Diabetes Mellitus Patients and Healthy Individuals Based on Volatile Organic Compounds (VOCs): Analysis of Exhaled Breath and Urine Samples by Using E-Nose and VE-Tongue

1
Biosensors and Nanotechnology Group, Faculty of Sciences, Moulay Ismaïl University of Meknes, B.P. 11201 Zitoune, Meknes 50000, Morocco
2
Biosensors and Nanotechnology Group, Department of Biology, Faculty of Sciences, Moulay Ismaïl University of Meknes, B.P. 11201 Zitoune, Meknes 50000, Morocco
3
Mass Spectrometry Unit, Scientific and Technical Resources Service, Universitat Rovira I Virgili, Campus Sescelades—Edifici N2—Avinguda dels Països Catalans, 26, 43007 Tarragona, Spain
4
Department of Electronic Engineering, Universitat Rovira i Virgili, MINOS, Avda Països Catalans, 26, 43007 Tarragona, Spain
*
Author to whom correspondence should be addressed.
Chemosensors 2023, 11(6), 350; https://doi.org/10.3390/chemosensors11060350
Submission received: 31 March 2023 / Revised: 13 June 2023 / Accepted: 14 June 2023 / Published: 19 June 2023
(This article belongs to the Special Issue The Application and Advance of Electronic Nose)

Abstract

:
Studies suggest that breath and urine analysis can be viable non-invasive methods for diabetes management, with the potential for disease diagnosis. In the present work, we employed two sensing strategies. The first strategy involved analyzing volatile organic compounds (VOCs) in biological matrices, such as exhaled breath and urine samples collected from patients with diabetes mellitus (DM) and healthy controls (HC). The second strategy focused on discriminating between two types of DM, related to type 1 diabetes mellitus (T1DM) and type 2 diabetes mellitus (T2DM), by using a data fusion method. For this purpose, an electronic nose (e-nose) based on five tin oxide (SnO2) gas sensors was employed to characterize the overall composition of the collected breath samples. Furthermore, a voltametric electronic tongue (VE-tongue), composed of five working electrodes, was dedicated to the analysis of urinary VOCs using cyclic voltammetry as a measurement technique. To evaluate the diagnostic performance of the electronic sensing systems, algorithm tools including principal component analysis (PCA), discriminant function analysis (DFA) and receiver operating characteristics (ROC) were utilized. The results showed that the e-nose and VE-tongue could discriminate between breath and urine samples from patients with DM and HC with a success rate of 99.44% and 99.16%, respectively. However, discrimination between T1DM and T2DM samples using these systems alone was not perfect. Therefore, a data fusion method was proposed as a goal to overcome this shortcoming. The fusing of data from the two instruments resulted in an enhanced success rate of classification (i.e., 93.75% for the recognition of T1DM and T2DM).

1. Introduction

Diabetes mellitus (DM) is a widespread disease that affects many people in the word. Unfortunately, most of them are undiagnosed, and only a small percentage of them are conscious of this metabolic illness. This disease is increasing fast in both emerging and developed countries, but its increase is most remarkable in the Middle East and North Africa (MENA) [1]. DM affects 40 million adults (18–99 years), or 10.5% of the adult population in the MENA area, according to the International Diabetes Federation (IDF), and this number is anticipated to climb to 84 million by 2045 [2].
DM is a metabolic dysfunction in which blood glucose levels are abnormally high. This disorder is due to either abnormalities in the production of insulin, the body’s inability to use the insulin produced, or both [3]. If left unmonitored, DM has long-term consequences and has the potential to lead to cardiovascular disease and organ failure, particularly of the eyes, kidneys, nerves and blood vessels [3,4].
The vast majority of diabetes cases fall into two broad categories. In the first category, type 1 diabetes mellitus (T1DM), which accounts for only 10% of diabetics, was previously encompassed by the term “insulin-dependent diabetes”. T1DM occurs when the pancreas no longer produces enough or any insulin. This type of DM is linked to an abnormal functioning of the immune system, which destroys the cells of the pancreas responsible for producing the hormone [5]. Diabetes-associated auto-antibodies, genetic markers and intravenous glucose tolerance tests can all be used to identify individuals who are at increased risk of developing this type of diabetes [6]. In the second category, type 2 diabetes mellitus (T2DM), which accounts for 90% of those with DM, is caused by a combination of resistance to the action of insulin and an inadequate compensatory response of insulin secretion [7].
Diabetes screening is usually done invasively by sampling blood from the index finger. Nevertheless, this method has some disadvantages, such as discomfort and pain [8]. Accordingly, the development of non-invasive novel diagnostic approaches and improved technologies are needed to monitor the progression of diabetes disease. For this reason, biological fluids (i.e., breath, urine) analysis has attracted a considerable amount of scientific and clinical interest during the recent years in biomedical applications [9,10]. Their analysis has been proposed as a new analytical method to discriminate, identify and determine the concentration of endogenous VOCs, which offers interesting possibilities for the screening of diseases of worldwide interest. In addition to this, the beginning of different diseases or metabolic disorders has a significant impact on the concentration of certain VOCs in exhaled breath and urine [11,12].
Several studies have even been performed to identify VOCs in exhaled breath and/or from urine samples of patients with T1DM and/or T2DM [13,14]. The aim is to detect the disease at an early stage so that treatment can be started quickly, which could reduce the severity of the disease and the mortality [15,16].
Various analytical methods have been used to determine VOC metabolites, including gas chromatography–mass spectrometry (GC–MS) [17], proton transfer reaction/mass spectrometry (PTR/MS) [18], ion mobility spectrometry (IMS) [19,20] and selected ion flow tube mass spectrometry (SIFT/MS) [21]. All these analytical techniques are capable of detecting and quantifying different compounds with low concentrations. However, they possess several drawbacks: they are complex, time consuming, very expensive and require skilled operators. Therefore, the importance of developing multi-sensor sensing devices, like electronic noses and tongues, for the identification of low VOC concentrations is high. These devices have some potential advantages in their recognition of complex VOC mixtures via sensor arrays in conjunction with pattern recognition methods [22,23]. Thus, electronic sensing devices use a completely different concept than analytical techniques. They are mostly based on an empirical approach, which allows the recognition of “fingerprints” corresponding to different VOCs by pattern recognition methods, subsequently facilitating the discrimination of VOC mixtures independently of their individual molecular components [24,25]. E-nose and VE-tongue systems were already applied for diagnosing diabetes through exhaled breath and urine analysis [26,27]. However, the discrimination between T1DM and T2DM was not examined enough by electronic sensing systems. Thus, the individual use of one system (i.e., e-nose or VE-tongue) reflects only one aspect of the sample (smell or taste). In order to obtain more in-depth information while minimizing the limitations of the two devices, a data fusion method could be used to generate a global profile associated with the sensitivity of both systems [28,29].
In the present study, artificial intelligence algorithms were adopted, in order to diagnose patients with diabetes and HC based on exhaled breath and urine samples. Indeed, the key clue was to merge the data from both systems to achieve a perfect discrimination of breath and urine samples of the two subgroups of diabetes, T1DM and T2DM.

2. Materials and Methods

2.1. Breath and Urine Samples Collection

Breath samples were collected from 28 HC and 32 patients with DM (including 14 volunteers with T1DM and 18 with T2DM). A questionnaire on diabetes and its stage of development was completed for each patient. Information about gender, age, other diseases, prescribed medications, smoking habits and information about previous meals were also gathered. Table 1 shows the general characteristics of all volunteers enrolled in this study. Subjects who had used medication, drugs, alcohol, tobacco, beverages or food before noon were automatically excluded from the study.
The participants were invited to wash out their mouths before breathing out samples of breath into Tedlar® bags with mouthpieces. For each patient, three breath samples were collected. The volunteers exhaled into commercial 2-L Tedlar® bags (Supelco Inc., Belfonte, PA, USA) from a one-way valve. The function of this valve is to prevent the mixing of outside air with the collected breath. Tedlar® bags are cleaned 3 times with synthetic air before and after each breath sample.
To avoid potential biases from the ambient air, breath sample collection was conducted the same day in a well-ventilated room.
Furthermore, morning urine samples were collected in a sterile urine-collecting bottle (25 mL vials).

2.2. Samples Analysis

2.2.1. E-Nose System for Breath Analysis

An overview of the system used in this work is presented in the Supplementary Materials (Figure S1) [30], which consists of three distinct parts: the sampling unit, the sensor chamber, and the data acquisition system. The collected breath samples were transferred to the sensor chamber by pumping the contents of each Tedlar bag at a flow rate of 200 mL/min. After each e-nose measurement, the sensor chamber was cleaned with synthetic air flow (50 mL/min) for 10 min in view of the recovering sensor baseline.
The e-nose device contains five gas sensors (MQ-2, MQ-3, MQ-135, MQ-137 and MQ-138) supplied by Henan Hanwei Electronics Co (Zhengzhou, China). These commercially available sensors and related target gases are as follows: MQ-2 (propane, hydrogen, and methane), MQ-3 (alcohol), MQ-135 (benzene, ammonia, carbon dioxide and nitric oxide), MQ-137 (ammonia), MQ-138 (toluene, acetone, methanol, ethanol and formaldehyde). Additionally, both a relative humidity sensor (Honeywell HIH 4000-002) and a temperature sensor (LM35DZ) from National Semiconductor were added inside the sensor chamber to control the experiment’s conditions.

2.2.2. VE-Tongue Unit for Urine Analysis

The VE-tongue experimental set up, which was used to investigate the electrochemical behavior of electrodes in the presence of human urine, is presented in the Supplementary Materials (Figure S2) [31]. It consists of an Ag/AgCl reference electrode (saturated in KCL solution [1M]), an auxiliary electrode made of platinum (Pt) and five working electrodes made of glassy carbon (GC), gold (Au), platinum (Pt), palladium (Pd) and copper (Cu) organized in a three-electrode configuration. The electrodes were linked to a potentiostat through a relay box (PalmSens BV, Utrcht, The Netherlands).
The analysis was performed by immersing the seven electrodes in a container containing urine samples. Cyclic voltammetry (CV) was used as an electrochemical measurement technique. In this approach, the potential of the working electrode increases with time, whilst the potential of the resting electrode maintains a constant. Then CV was parameterized at a potential range for −0.2 to 0.6 V and a scan rate of 50 mV/s.
The measurement of each sample was repeated 6 times in order to ensure repeatability of measurements. The shape and the amplitude of these voltammograms vary according to the type of each electrode. To prevent contamination of the electrode surface leading to measurement errors, all electrodes were rinsed with piranha before and after each measurement. This helped to reduce drift as well.

2.3. Data Processing

2.3.1. E-Nose Measurements

In the case of e-nose measurements: 180 breath samples (60 volunteers × 3 Tedlar bags) were measured, and 2 features of ∆G, which corresponds to conductance change, and AUC, which represents the area under the response curve, were extracted from the response of each gas sensor array. Since we had 5 gas sensors, for each breath sample measurement, 10 features were extracted. Therefore, for all samples, we had a total of 1800 features (i.e., 180 samples × 10 features/sample).
Drift of sensor response is a problem that was considered in this work. Many correction methods have been used on the pre-processed data to reduce it [32]. To minimize the effect of sensor drift, a normalization process for the response of each gas sensor ((G − G0)/G0) was employed, where G was the measured sensor conductance in the presence of the target gas, and G0 was the baseline sensor conductance in the presence of pure synthetic air [32].
To facilitate the treatment of multivariate data, only the features of interest were considered in the initial data. These features conserved the maximum information from these responses. In this work, the processing of the e-nose system responses was done by considering the two variables:
  • ΔG = (GS − G0): The difference of the stabilized conductance (GS) and the initial conductance (G0);
  • AUC: The area under the sensor response curve calculated by a trapezoidal method. The selected area was in the range of 1 to 9 min of the measurement time.

2.3.2. VE-Tongue Measurements

In the case of VE-tongue measurements: 360 urine samples (60 volunteers × 6 repetitions) were measured, and 2 features (Imax and area) were extracted from the response of each electrode. Since we had 5 electrodes, for each urine sample measurement, 10 features were extracted. Therefore, for all samples, we had a total of 3600 variables (i.e., 360 samples × 10 features/sample).
Moreover, two eigenvalues linked to output current values were extracted from the cyclic voltammograms’ response of each working electrode, comprising Imax and area, for analyzing the VE-tongue database.
  • Imax: Maximum electrical current;
  • AUC: Area between the oxidation and reduction phases in the voltammograms. The trapezoidal technique was used to calculate this area.

2.3.3. Chemometric Techniques

Chemometric techniques are crucial tools that provide a practical system capable of characterizing a wide variety of compounds. Following the extraction stage, the obtained data were examined using data processing methods such as principal component analysis (PCA), and discriminant function analysis (DFA) to improve visualization and comprehension of the studied samples [33,34].
Both unsupervised and supervised approaches such as PCA, DFA and receiver operating characteristics (ROC) were employed to test the efficiency and the performance of the e-nose and VE-tongue to distinguish, on the one hand, between diabetic and healthy samples, and on the other hand, to discriminate between T1DM, T2DM patients.
PCA is an unsupervised, linear and multivariate approach that uses the greatest variance to transform a set of correlated variables into a new set of uncorrelated variables known as principal components (PCs). It is a method of data reduction that has been proven a useful step in classification [35]. PCA has been successfully utilized in medical fields such as diabetes diagnosis, prognostics of recurrence of breast cancer, and thyroid disease diagnosis [36]. PCA was employed in this study to analyze multivariate data from the e-nose and VE-tongue in order to provide a clear representation in a low-space projection.
The DFA algorithm, which is a supervised approach, was then used to split individuals into diabetes and control groups. DFA is a multivariate analysis of variance that generates linear combinations of variables to identify group membership and whose usefulness has been proven in a range of electronic sensing system applications [37]. The DFA determines discriminating functions in such a manner that the ratio within a group is minimized (intra-class variance). At the same time, it maximizes the ratio between the group’s ratios (inter-class variance).
ROC is a tool used to display, organize and choose classifiers based on their performance [38]. The ROC curve is plotted by representing the true positive rate (TPR) versus the false positive rate (FPR) for different thresholds. The TPR is referred to as sensitivity, recall or probability of detection in machine learning. The FPR is called the probability of false alarm and can be calculated as (1- specificity) [28]. This is commonly shown as a square box, with both axes ranging from 0 to 1 [39].
SVM is a non-linear supervised chemometric method, founded on the notion of maximum margin. The latter is the distance between the boundary of separation and the nearest samples. SVM offers the possibility to draw a hyperplane for this separation. There are many valid hyperplanes. Nevertheless, SVM methods aim at finding, among the valid hyperplanes, the one that not only passes “in the middle” of the points of the two classes, but also maximizes the margin by using the second order of the radial basis function (polynomial) kernel. The validation was performed using the leave-one-out cross-validation technique.

2.3.4. Multisensory Data Fusion Approach

Data fusion, also known as information fusion or sensor fusion, is the process of integrating data or information from multiple sources to create a unified and enhanced representation of the underlying phenomenon or system. It involves combining data from diverse sensors, databases or information streams to derive more accurate, comprehensive and useful insights.
The goal of data fusion is to overcome the limitations of individual data sources and exploit the synergies that arise when combining multiple sources. By integrating data from different systems, it is possible to obtain a more complete and accurate understanding of the situation, improve the quality of information, reduce uncertainties and make better-informed decisions.
Data fusion can be categorized into different levels based on the nature and complexity of the fusion process:
Low-level fusion: also known as sensor-level fusion, low-level fusion focuses on the integration of raw sensor measurements or data at a relatively early stage in the fusion process. It involves combining data from multiple sensors of the same type or different types to create a more comprehensive and accurate representation of the underlying phenomenon.
Medium-level fusion: medium-level fusion, also referred to as feature-level fusion, operates at a higher level than raw sensor measurements. In this level, extracted features or representations derived from individual sensors or data sources are combined. Instead of fusing raw data, the focus is on combining relevant features or descriptors that capture salient information.
High-level fusion: High-level fusion operates at the most abstract level of data fusion, where the fusion process integrates knowledge, reasoning or decision-making based on the information from multiple sources. It involves combining conclusions, inferences or decisions obtained from individual sources to arrive at a final fused output.
A data fusion methodology was used in this study. The main purpose of adopting this method was to enhance the classification results of T1DM and T2DM patients obtained by combining the results of the two sensing devices used separately. In this case, a medium level data fusion was used to overcome the limitations in terms of classification/discrimination of the T1DM and T2DM patient samples. In this approach, fusion was performed using variables extracted from the e-nose and VE-tongue dataset [40,41]. Certainly, the number of variables for both systems must be equal when merging the data through the medium level abstraction method. In our case, the dimensionality of the e-nose and VE-tongue datasets were equal. Consequently, using the medium level abstraction method, the resulting datasets from the e-nose and VE-tongue were fused to a single matrix of 180 samples with 4 variables (∆G and area for the e-nose; Imax and area for the VE-tongue).

3. Results and Discussion

3.1. E-Nose Breath Analysis

3.1.1. E-Nose Responses

Sensor responses were recorded during 10 min of breath exposure, followed by 10 min of return to baseline under dry air. Figure 1 shows MQ-138 gas sensor responses to the exhaled breath samples of T1DM, T2DM patients, and HC. As we can see, the temporal response of the sensors for T1DM patients was relatively higher than that recorded for T2DM and healthy control patients.
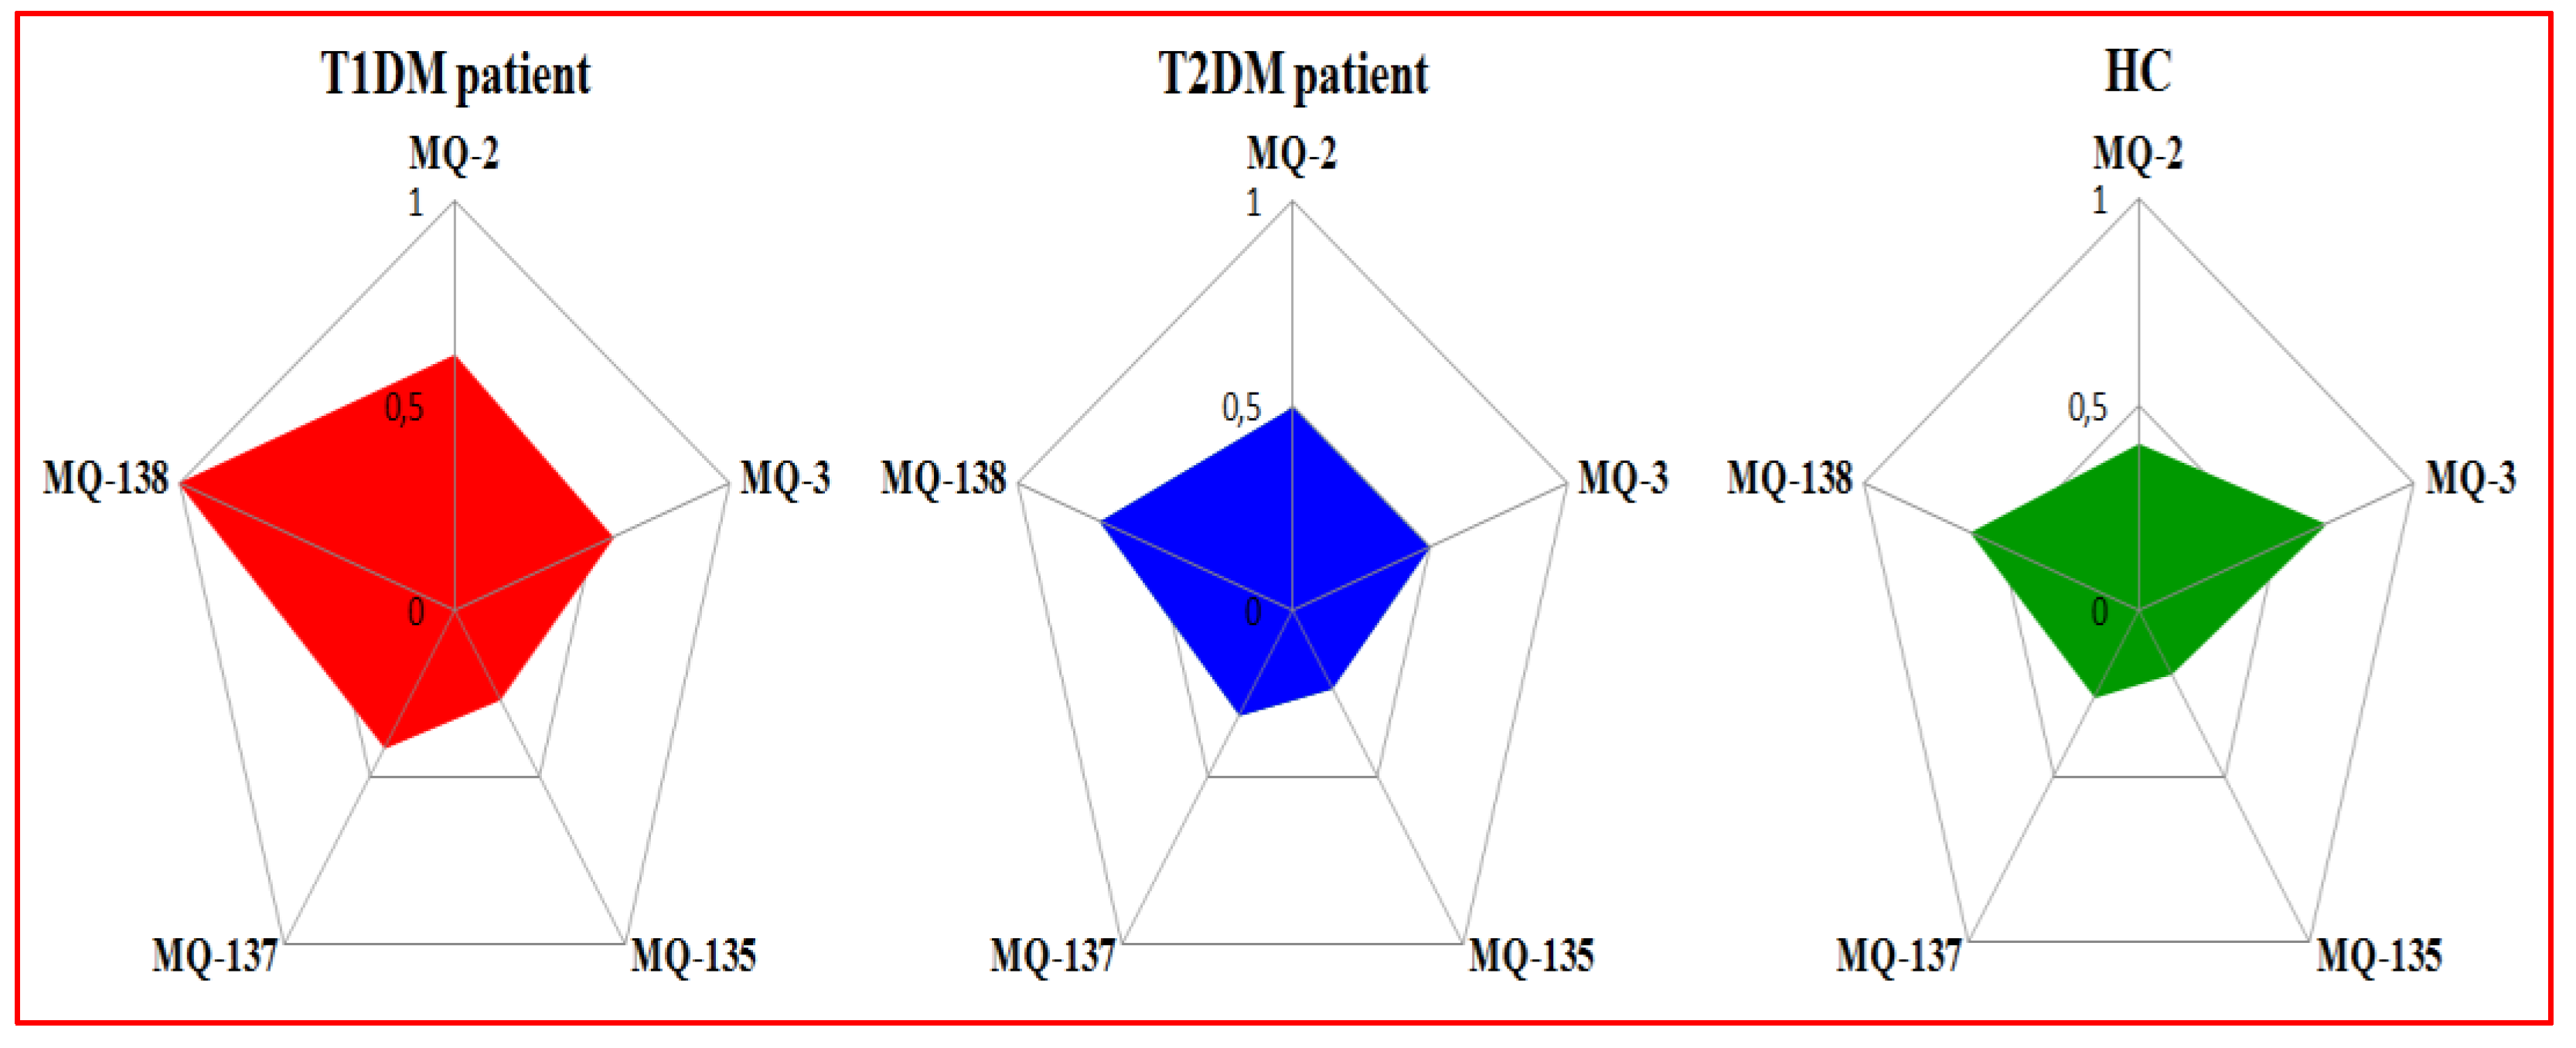
The radar plots with unitary radius are described in Figure 2, which shows a representative case in order to see if there were any pattern differences and/or similarities (i.e., breath prints) between the breath samples of patients having T1DM, T2DM and HC. Indeed, a clear variation between the breath prints corresponding to T1DM, T2DM patients and HC appear in these plots. The size of the radar plot for HC was found to be smaller compared to the radar plots for T1DM and T2DM patients. This behavior may be due to the difference of breath VOCs for each studied health state.
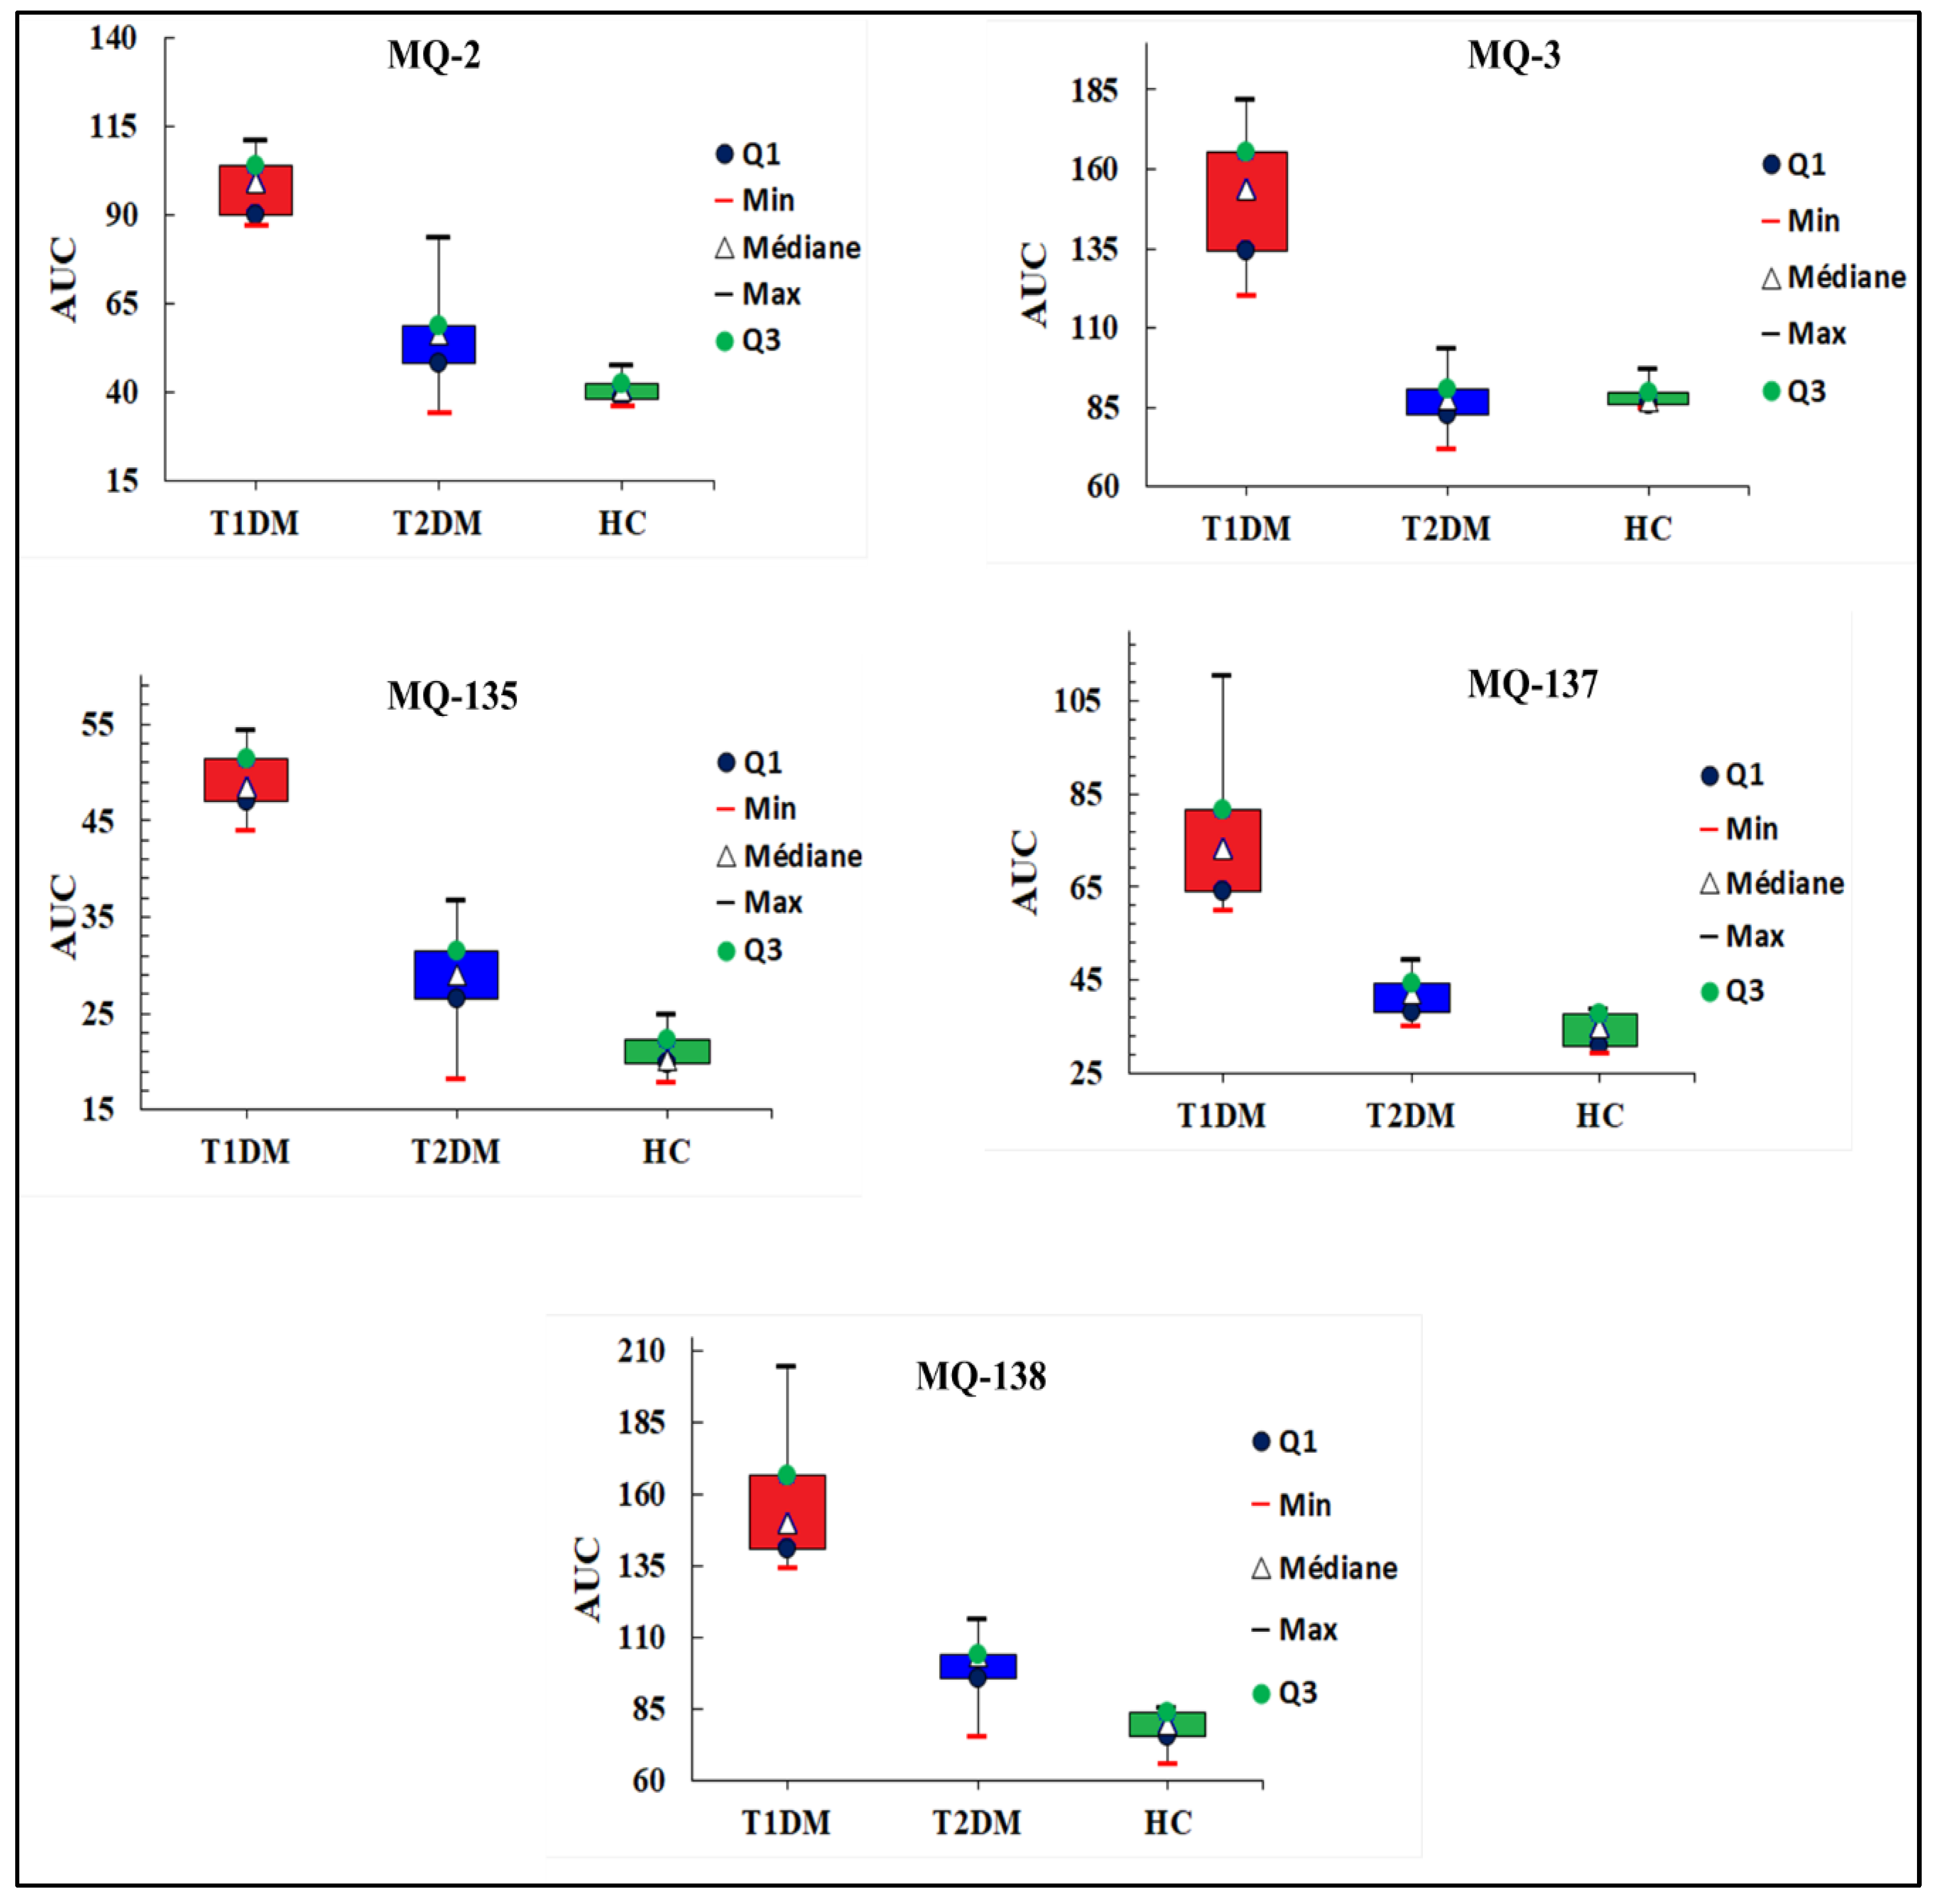
Figure 3 shows the box plots obtained using the AUC extracted from the responses of five sensors. The boxes (red for T1DM, blue for T2DM, and green for HC) indicate the interquartile range (IQ) that contains 50% of the studied data, while the triangle represents the median. The median values corresponding to patients with T1DM are significantly higher than those of patients with T2DM and HC. Similarly, the IQs of the five sensors for T1DM patients are higher than those of T2DM and healthy control patients. This means that there are specific VOCs in exhaled breath for each health condition studied.

3.1.2. PCA Discrimination Results of Breath Samples from DM and HC

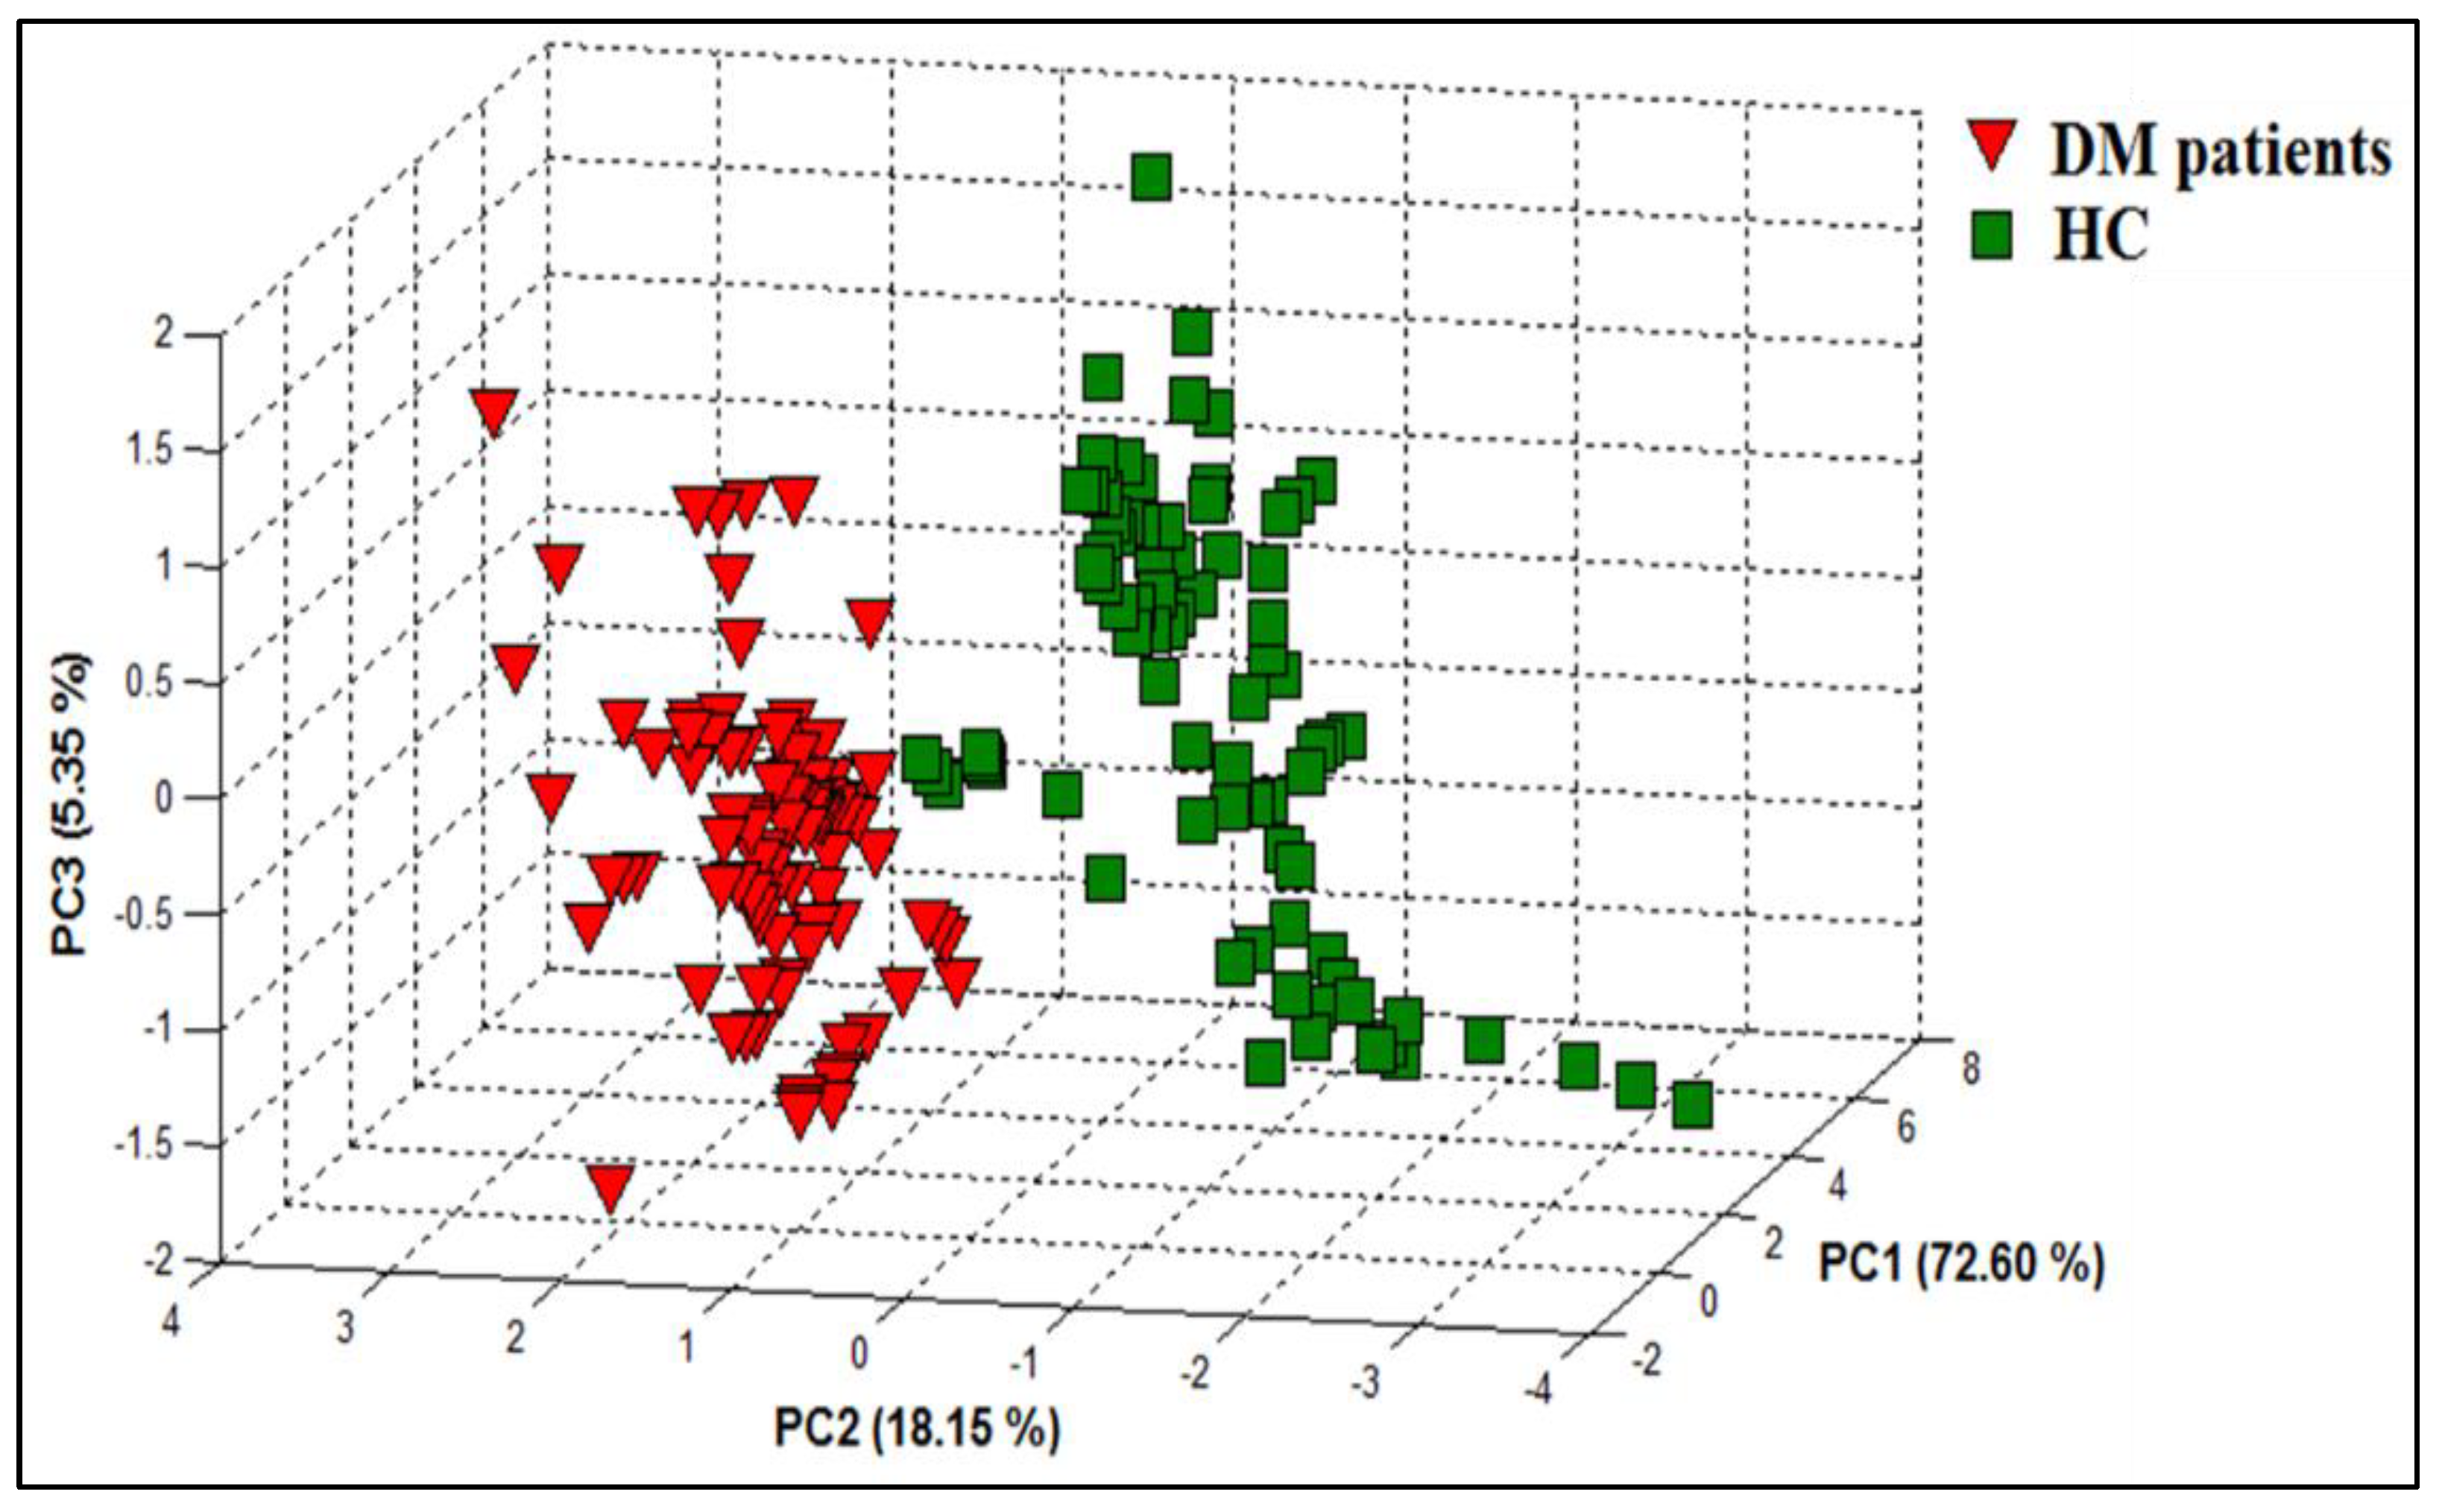
PCA was applied to evaluate the performance of the e-nose system in differentiating the breath samples of DM patients from those of HC (Figure 4). By using two features (ΔG and area), the PCA results reveal that a good discrimination between the breath samples of DM patients and HC was achieved. Consequently, the data processing by PCA method showed the ability of the proposed e-nose device to distinguish between the two study groups based on their health status.

3.1.3. DFA Discrimination Results of Breath Samples from DM and HC

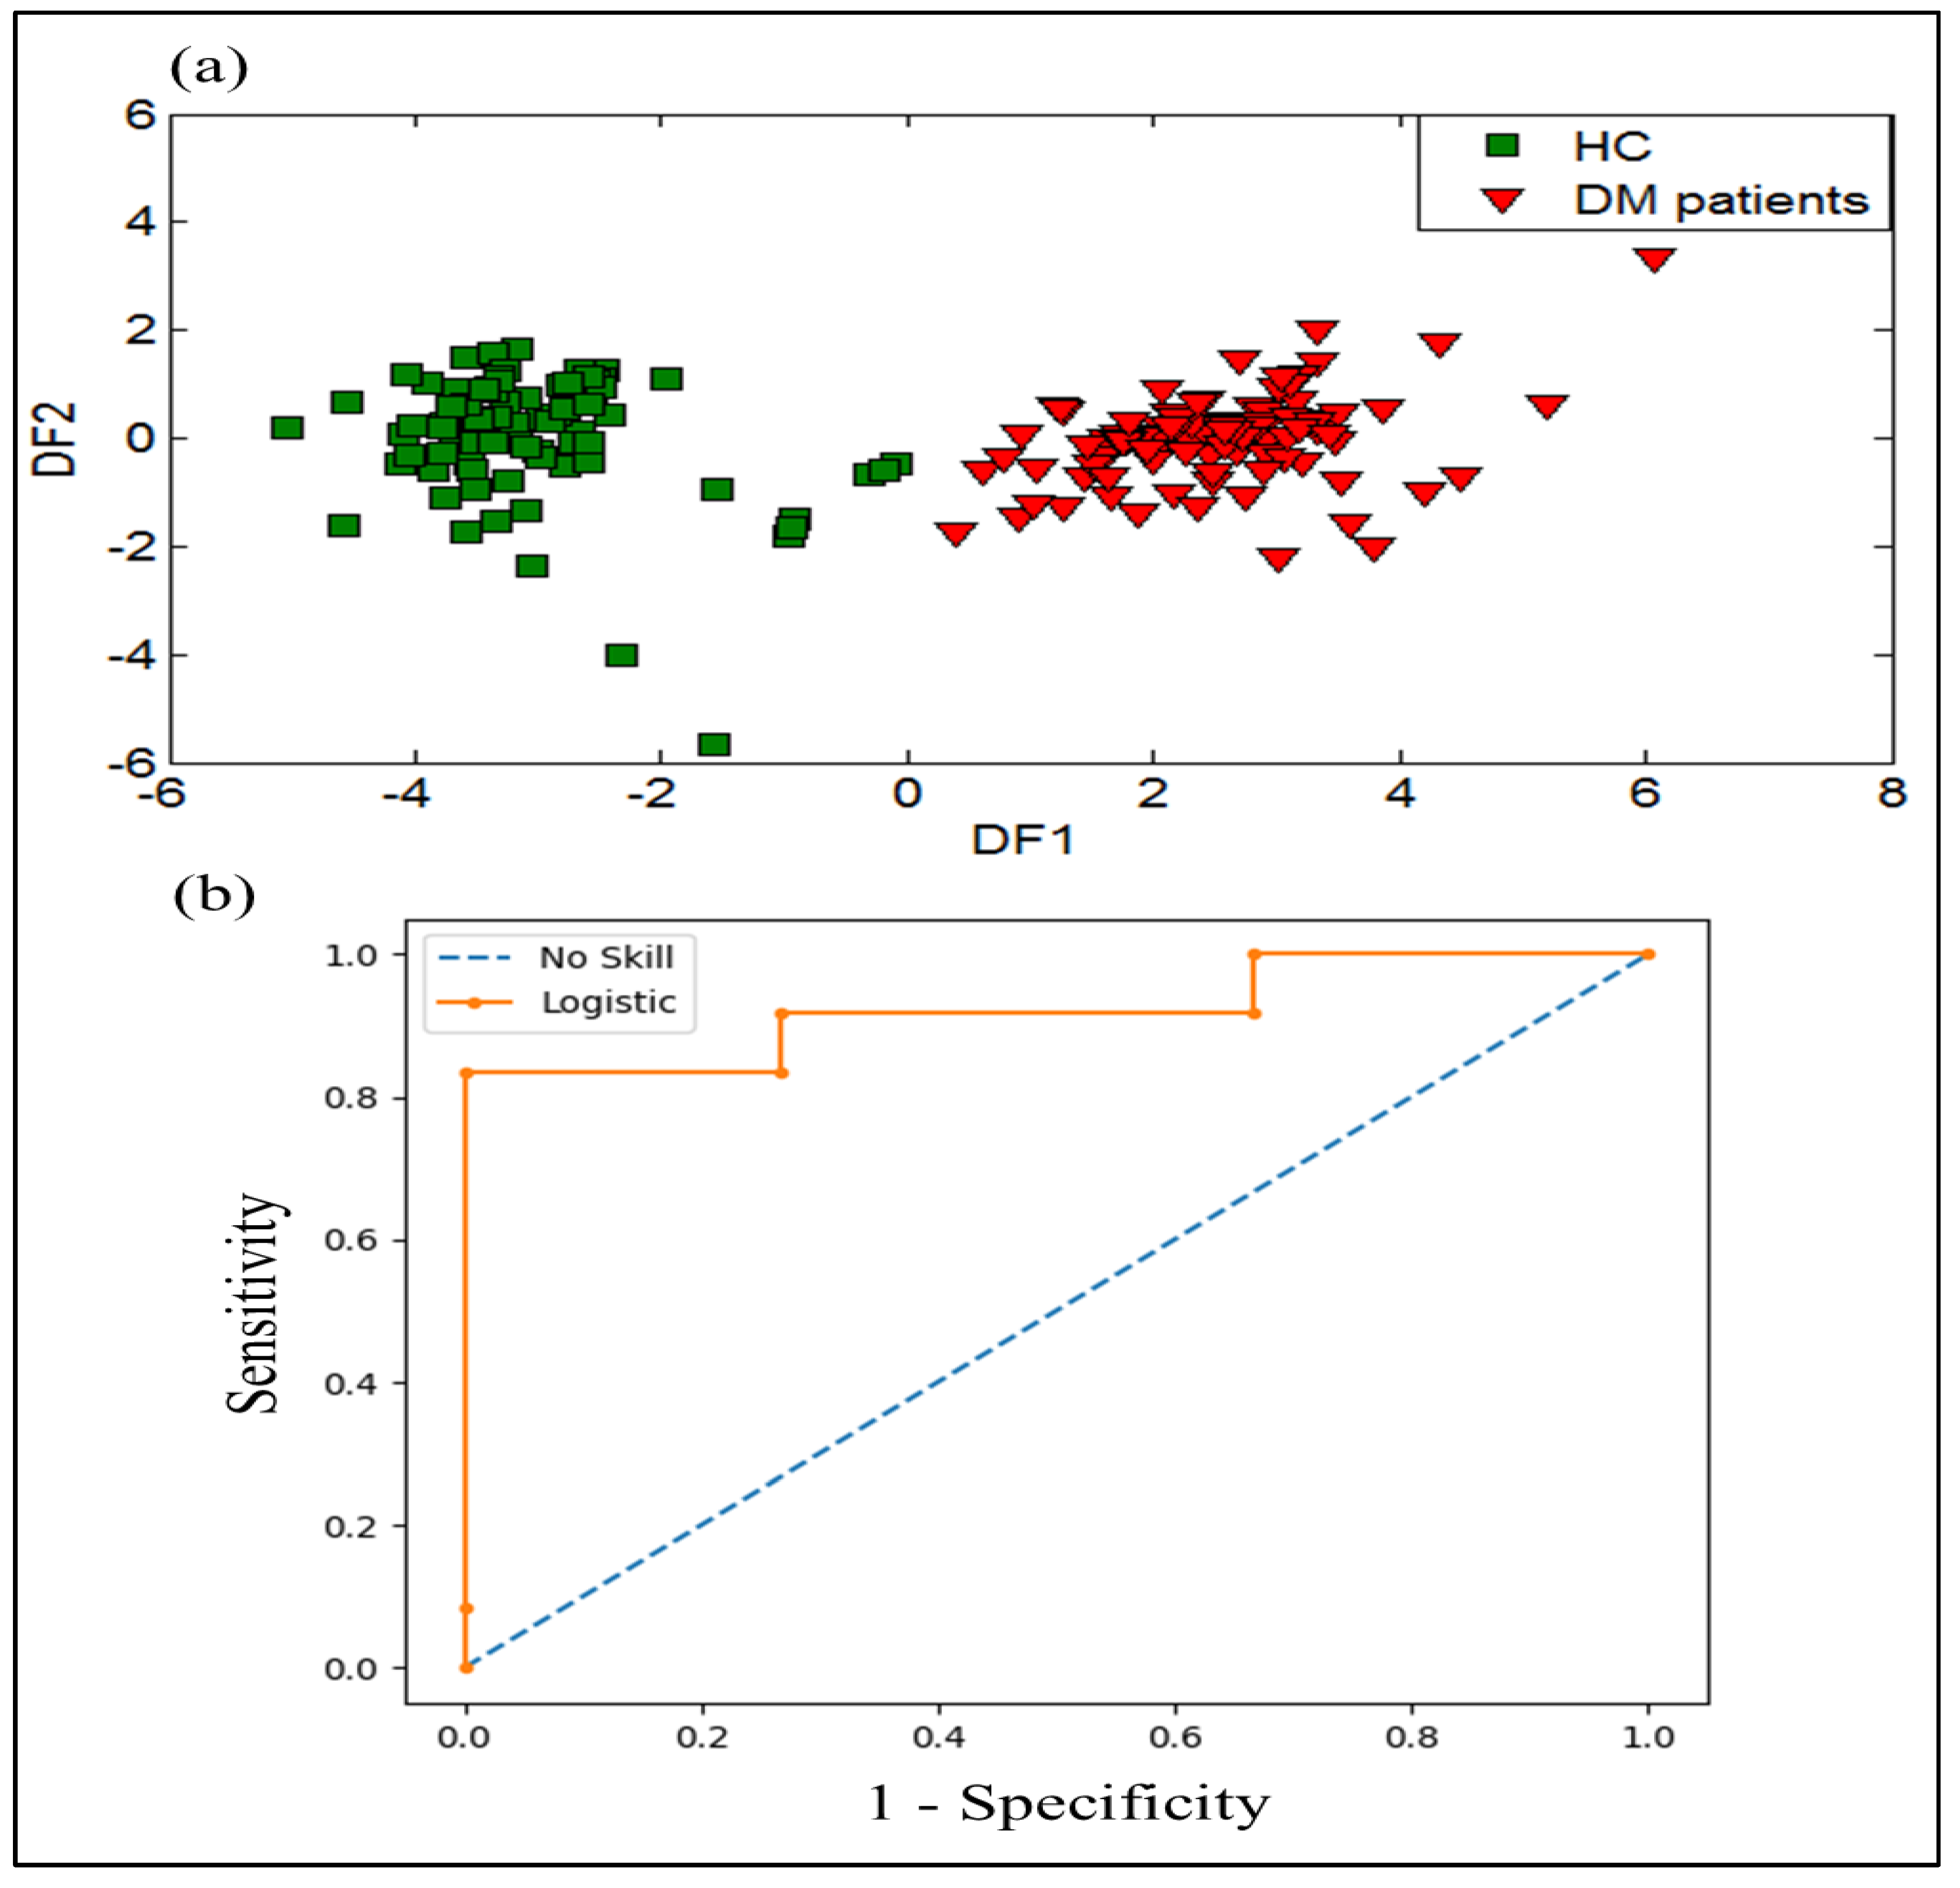
DFA was also used as a supervised method to classify different breath samples according to their health status. Figure 5a shows the first two functions of the DFA method for the classification of DM patients and HC using the dataset obtained from the e-nose system. The result displays a good discrimination between DM patients and HC. Therefore, the processing of the data by the DFA technique confirms the results obtained by the PCA method.
To evaluate the performance evaluation results of the e-nose system regarding the discrimination of DM and HC, the ROC method was tested. The ROC curve is created by plotting sensitivity against (1- specificity) of the data obtained by analyzing the breath samples of DM patients and HC. The area under the curve (AUC) value was determined to estimate the diagnostic value of the model. The ROC curve and ROC AUC were performed to investigate the diagnostic performance of the e-nose system. Figure 5b shows the ROC curve of the e-nose data with an ROC AUC value of 0.92, corresponding to the analysis of DM and HC breath samples. These results display a good classification performance of DM patients and HC using the e-nose system.

3.1.4. SVM Results of Breath Samples from DM and HC

The SVM method was used to perform the capability of the e-nose in matter of discrimination among DM patients and HC. Table 2 represents the SVM results of 180 exhaled breath measurements of DM patients and HC. The rows represent the actual categories and the columns represent the predicted categories. As it can be noticed in Table 2, the SVM method successfully recognized the two groups studied, and 1 sample-measurement belonging to HC was misclassified as belonging to HC. In light of this result, it can be concluded that e-nose system is capable to distinguish between breath VOCs of DM patients and HC.

3.1.5. DFA Discrimination Results of Breath Samples from T1DM and T2DM

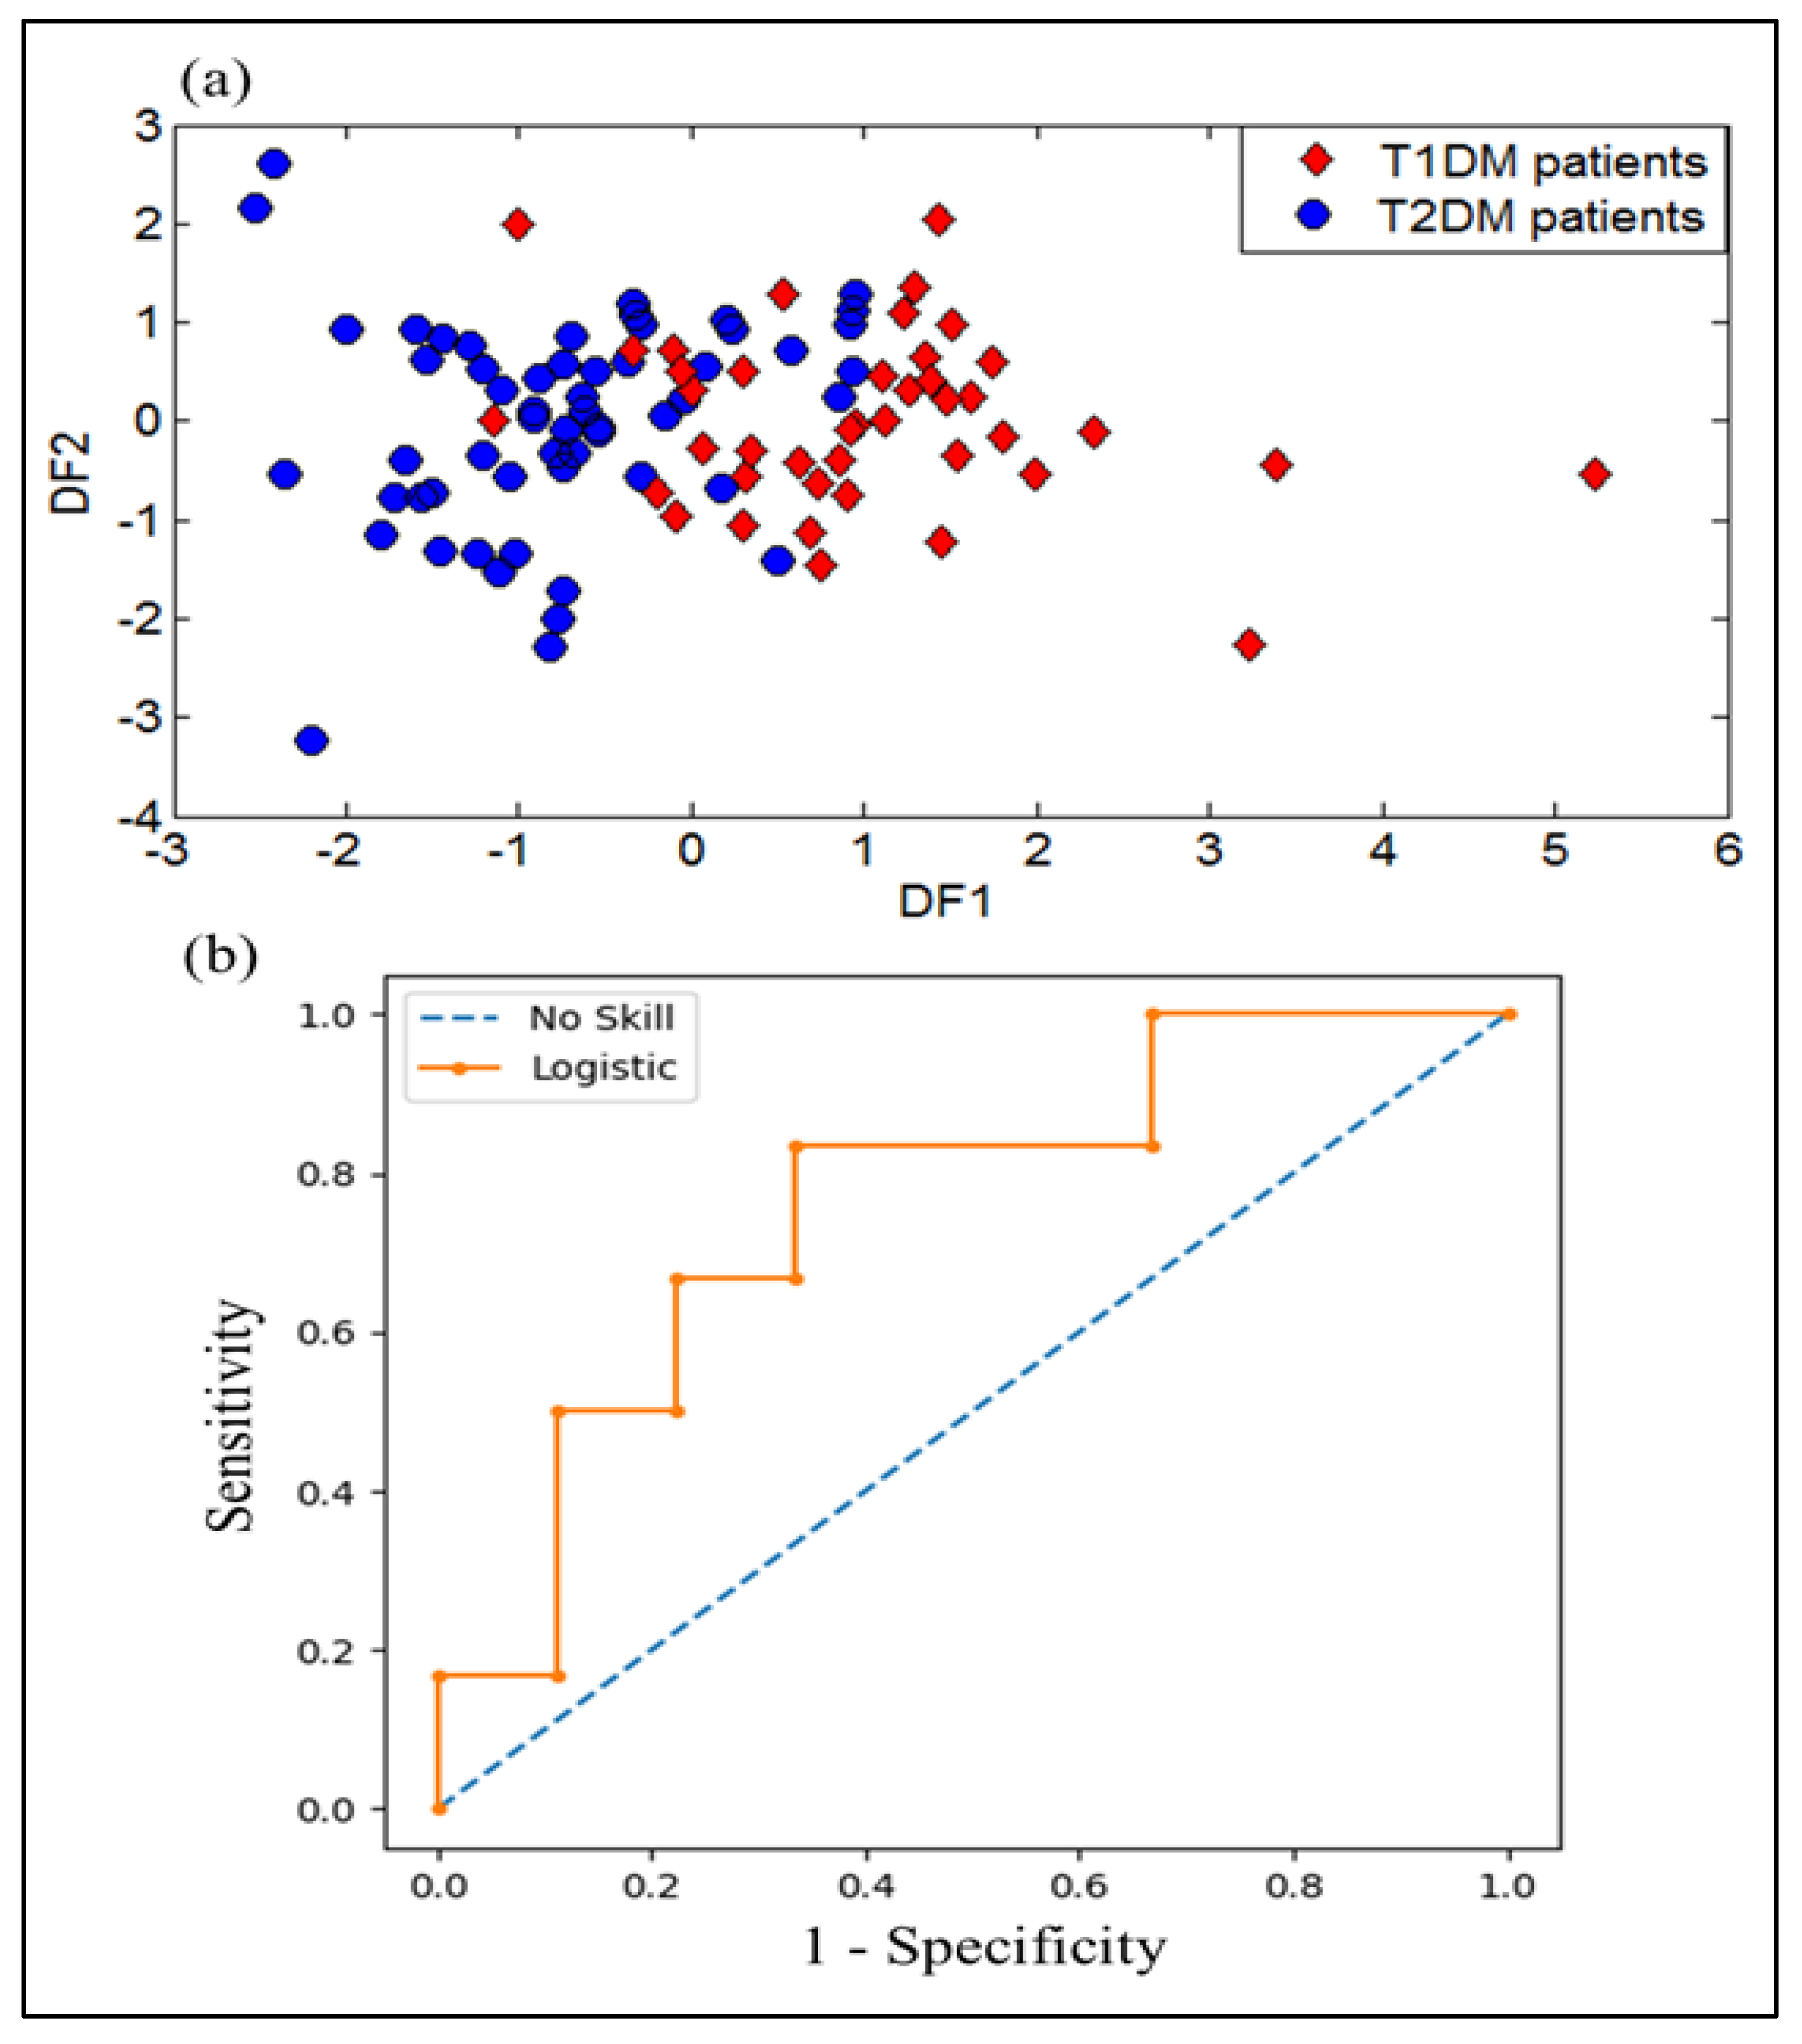
DFA was applied to the e-nose dataset in other to investigate its ability to discriminate between the two types of diabetes (T1DM and T2DM). Figure 6a represents the projection of the breath samples into the first two discriminant functions (DF1 and DF2). This projection clearly shows an overlapping area of the breath samples corresponding to T1DM patients with those of the T2DM patients. These results lead to the use of different strategies for attempting to better discriminate the two types of diabetes.
Here also, the performance evaluation results of e-nose system by the ROC method for discrimination of T1DM and T2DM was performed. The ROC curve is represented from data obtained by breath samples analysis of patients having T1DM and T2DM. The ROC AUC value was calculated to assess the diagnostic value of the model. The ROC curve and ROC AUC were performed to examine the diagnostic performance of the e-nose system. Figure 6b shows the ROC curve of the data obtained from the e-nose device with an ROC AUC value of 0.759 corresponding to the analysis of T1DM and T2DM breath samples.

3.1.6. SVM Results of Breath Samples from T1DM and T2DM

The trained dataset for 32 volunteers (14 T1DM and 18 T2DM) was used to run the SVM method. It was employed to differentiate between different breath samples according to their health status.
Table 3 shows the SVM results of 96 breath samples (32 volunteers providing 3 samples each). The rows of the table indicate the actual health states and the columns the predicted states. The SVM method achieved a success rate of 82.26% in the recognition of the two groups studied (T1DM and T2DM). As can be seen from the table, 17 errors were detected.

3.1.7. Temperature Effect on the Sensor’s Responses

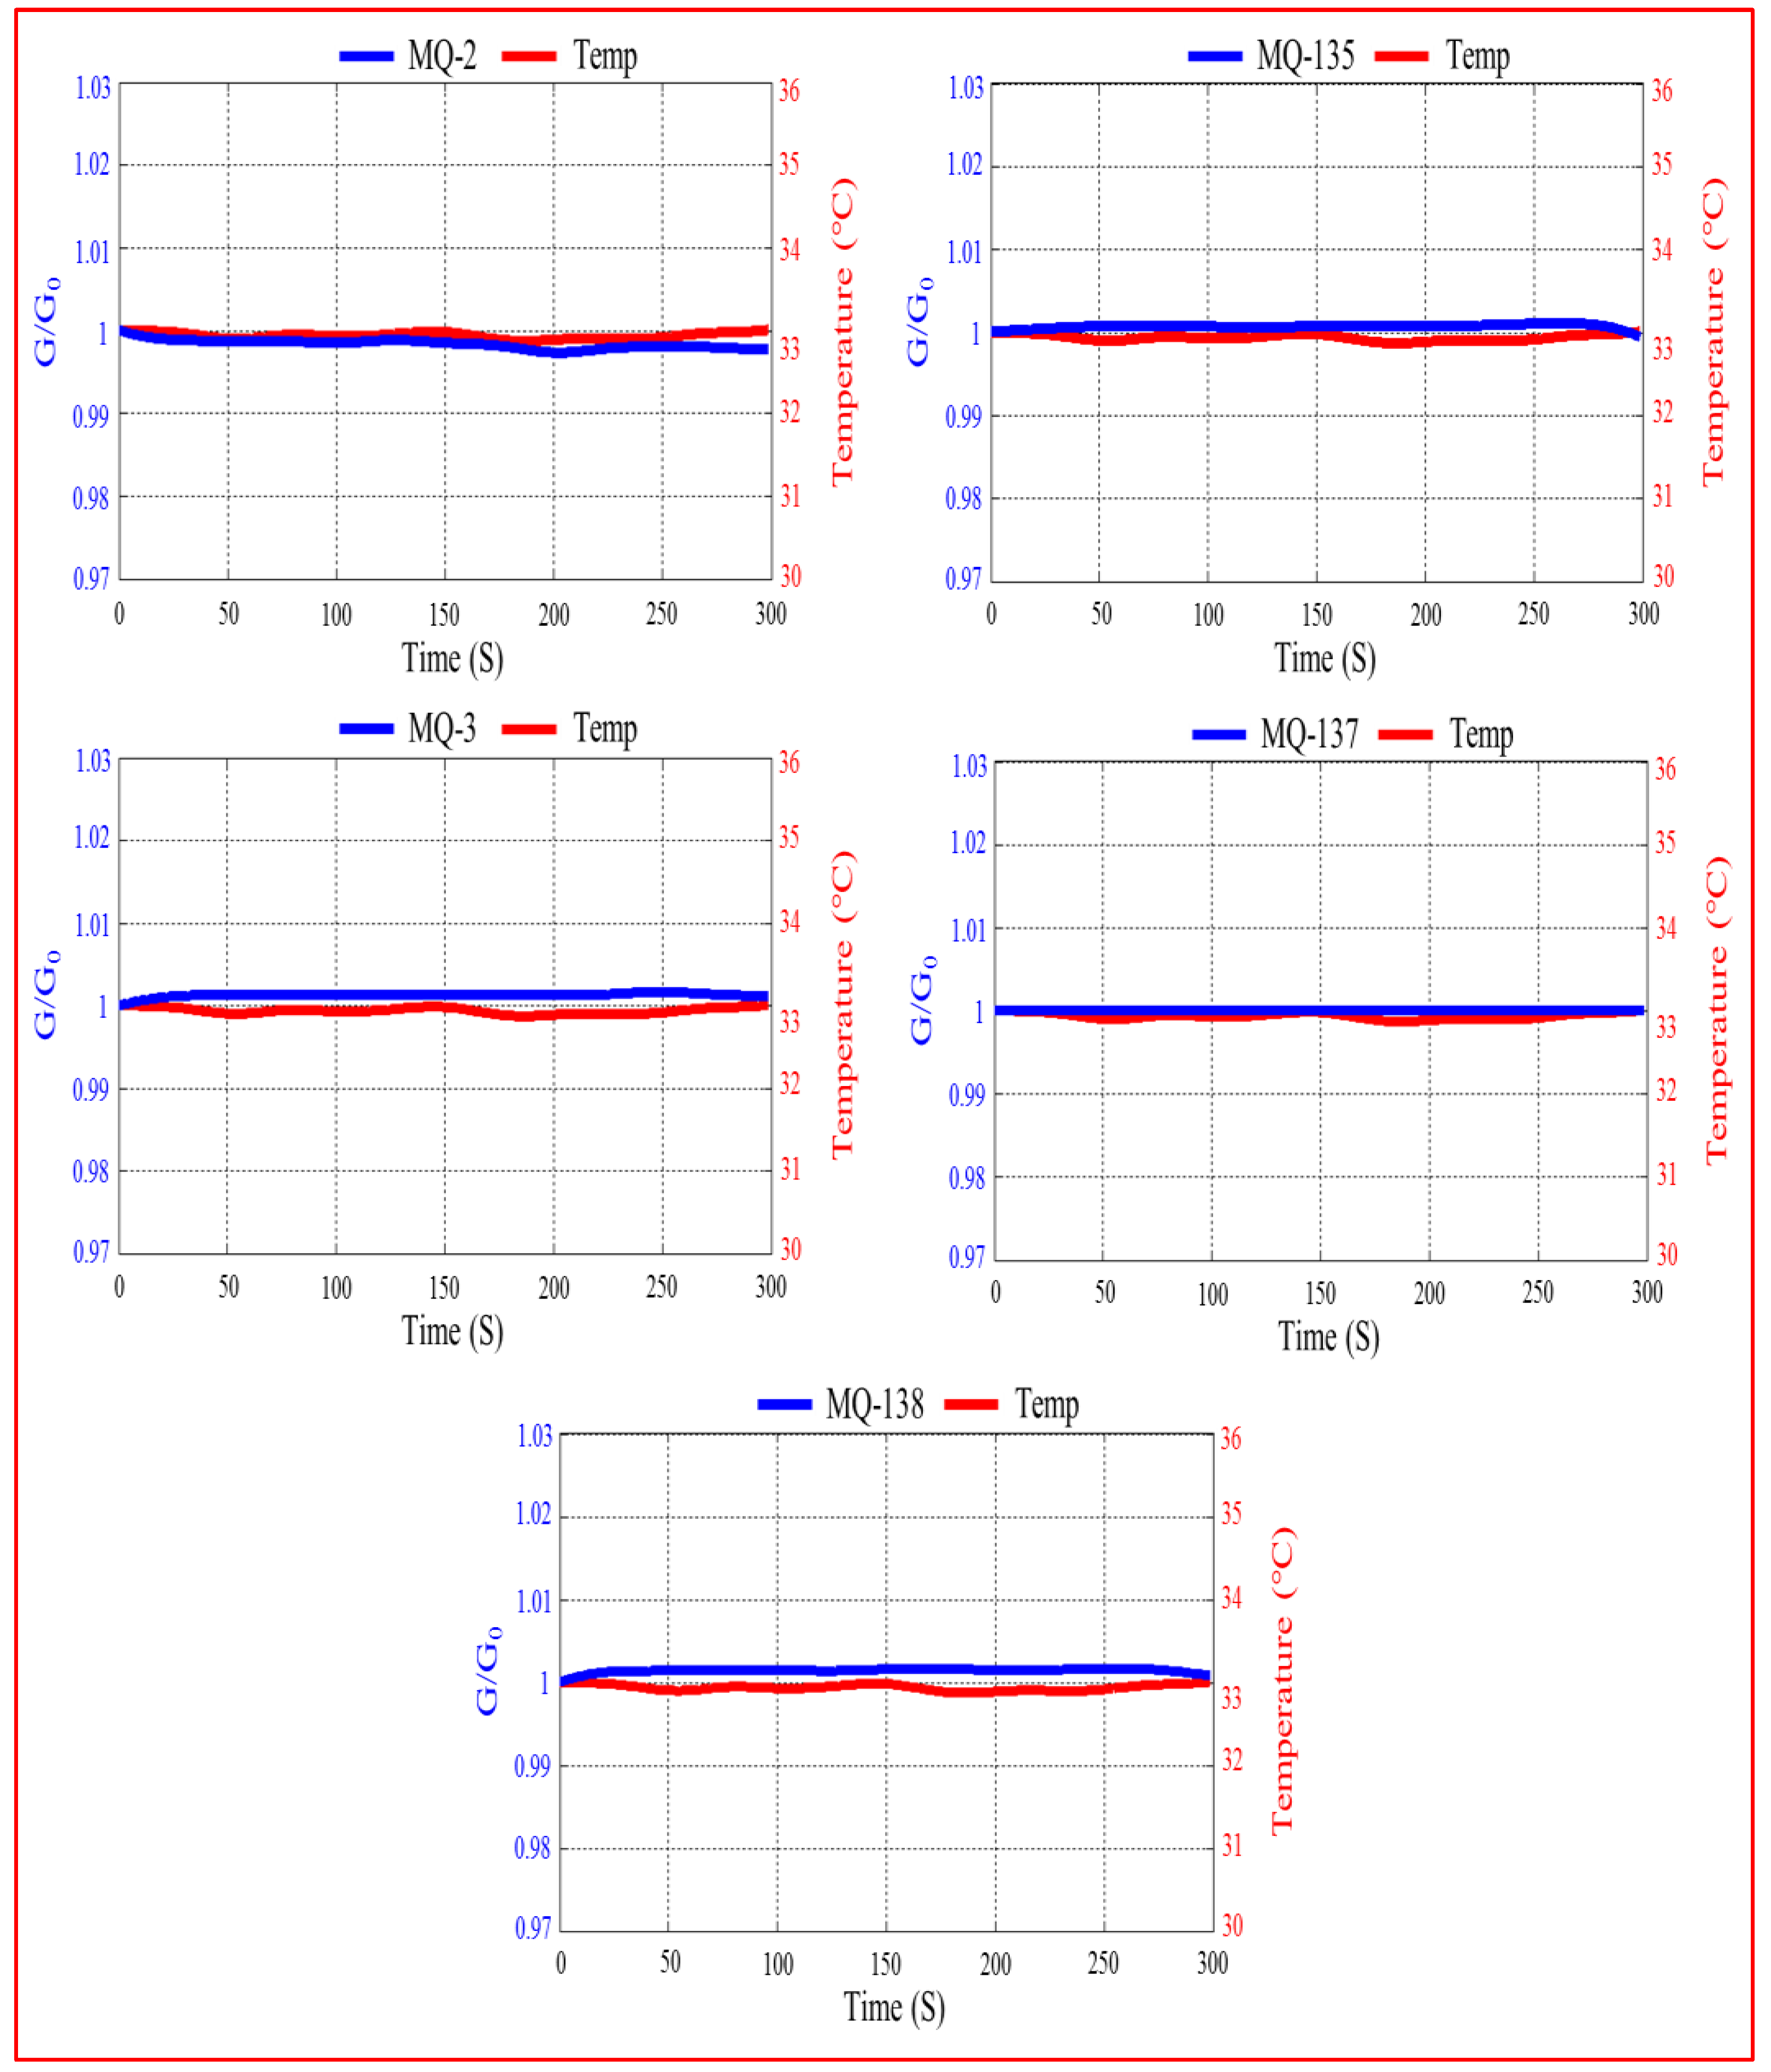
In this section, we investigated the effect of temperature on sensor responses. Figure 7 shows the evolution of the response of sensor arrays and the measured temperature inside the sensor chamber as a function of time before introduction of exhaled breath samples. As shown in this figure, all sensor responses remain stable during the measurement, which means that there is no temperature influence on the sensors. In addition, it should be noted that the reported results for the breath measurements were obtained under similar conditions (the temperature inside the sensor chamber during measurement was around 33 °C). This provides evidence that breath VOCs are primarily responsible for the observed sensor responses when the sensors were exposed to breath.

3.2. Urine Sample Analysis by VE-Tongue

3.2.1. VE-Tongue Responses

A cyclic voltammetric (CV) analysis was performed using the VE-tongue device in other to understand the electrochemical behavior of urine samples on the surface of different metal electrodes, and to establish if the system could discriminate among them.
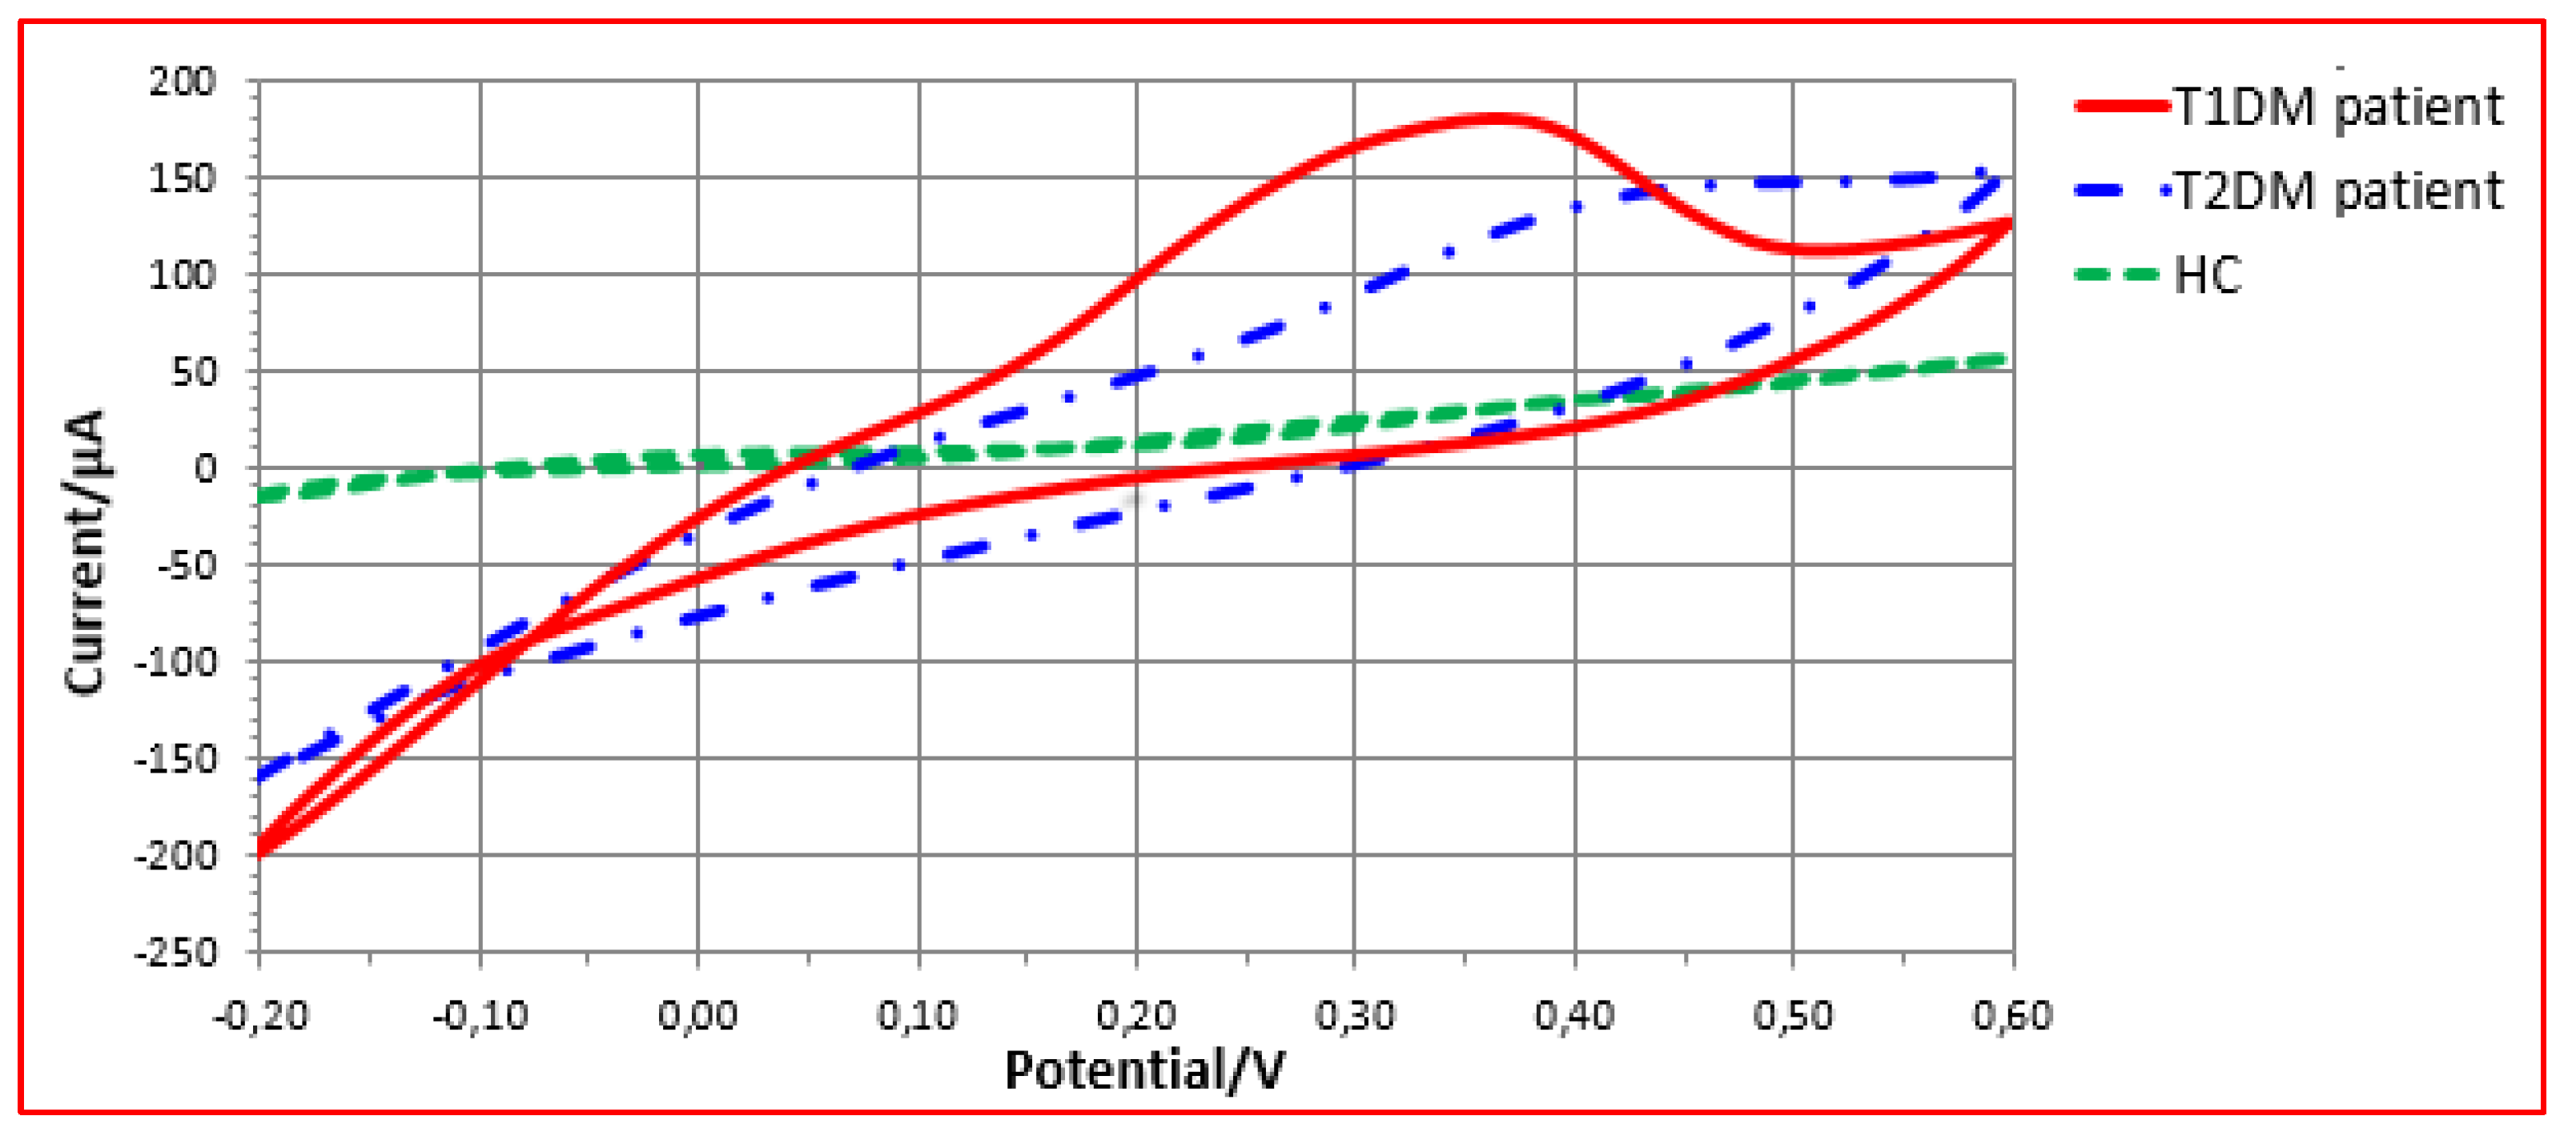
Figure 8 shows different electrochemical responses of Cu electrode towards urine samples with T1DM, T2DM and healthy control patients. As can be observed, depending on the origin of the urine sample, different response profiles were produced not just in the shapes of the voltammograms, but also in the obtained currents. This variation in peak amplitudes and forms reveals the existence of various redox species in the urine matrices. Minerals such as calcium and magnesium, as well as serum glucose levels, are examples of chemical families that might help with urine discrimination [42,43]. Thus, the VE-tongue results show that health status influences the chemical composition of urine [42]. In order to assess the ability of the proposed VE-tongue to discriminate between the different samples, a radar plot was carried out.
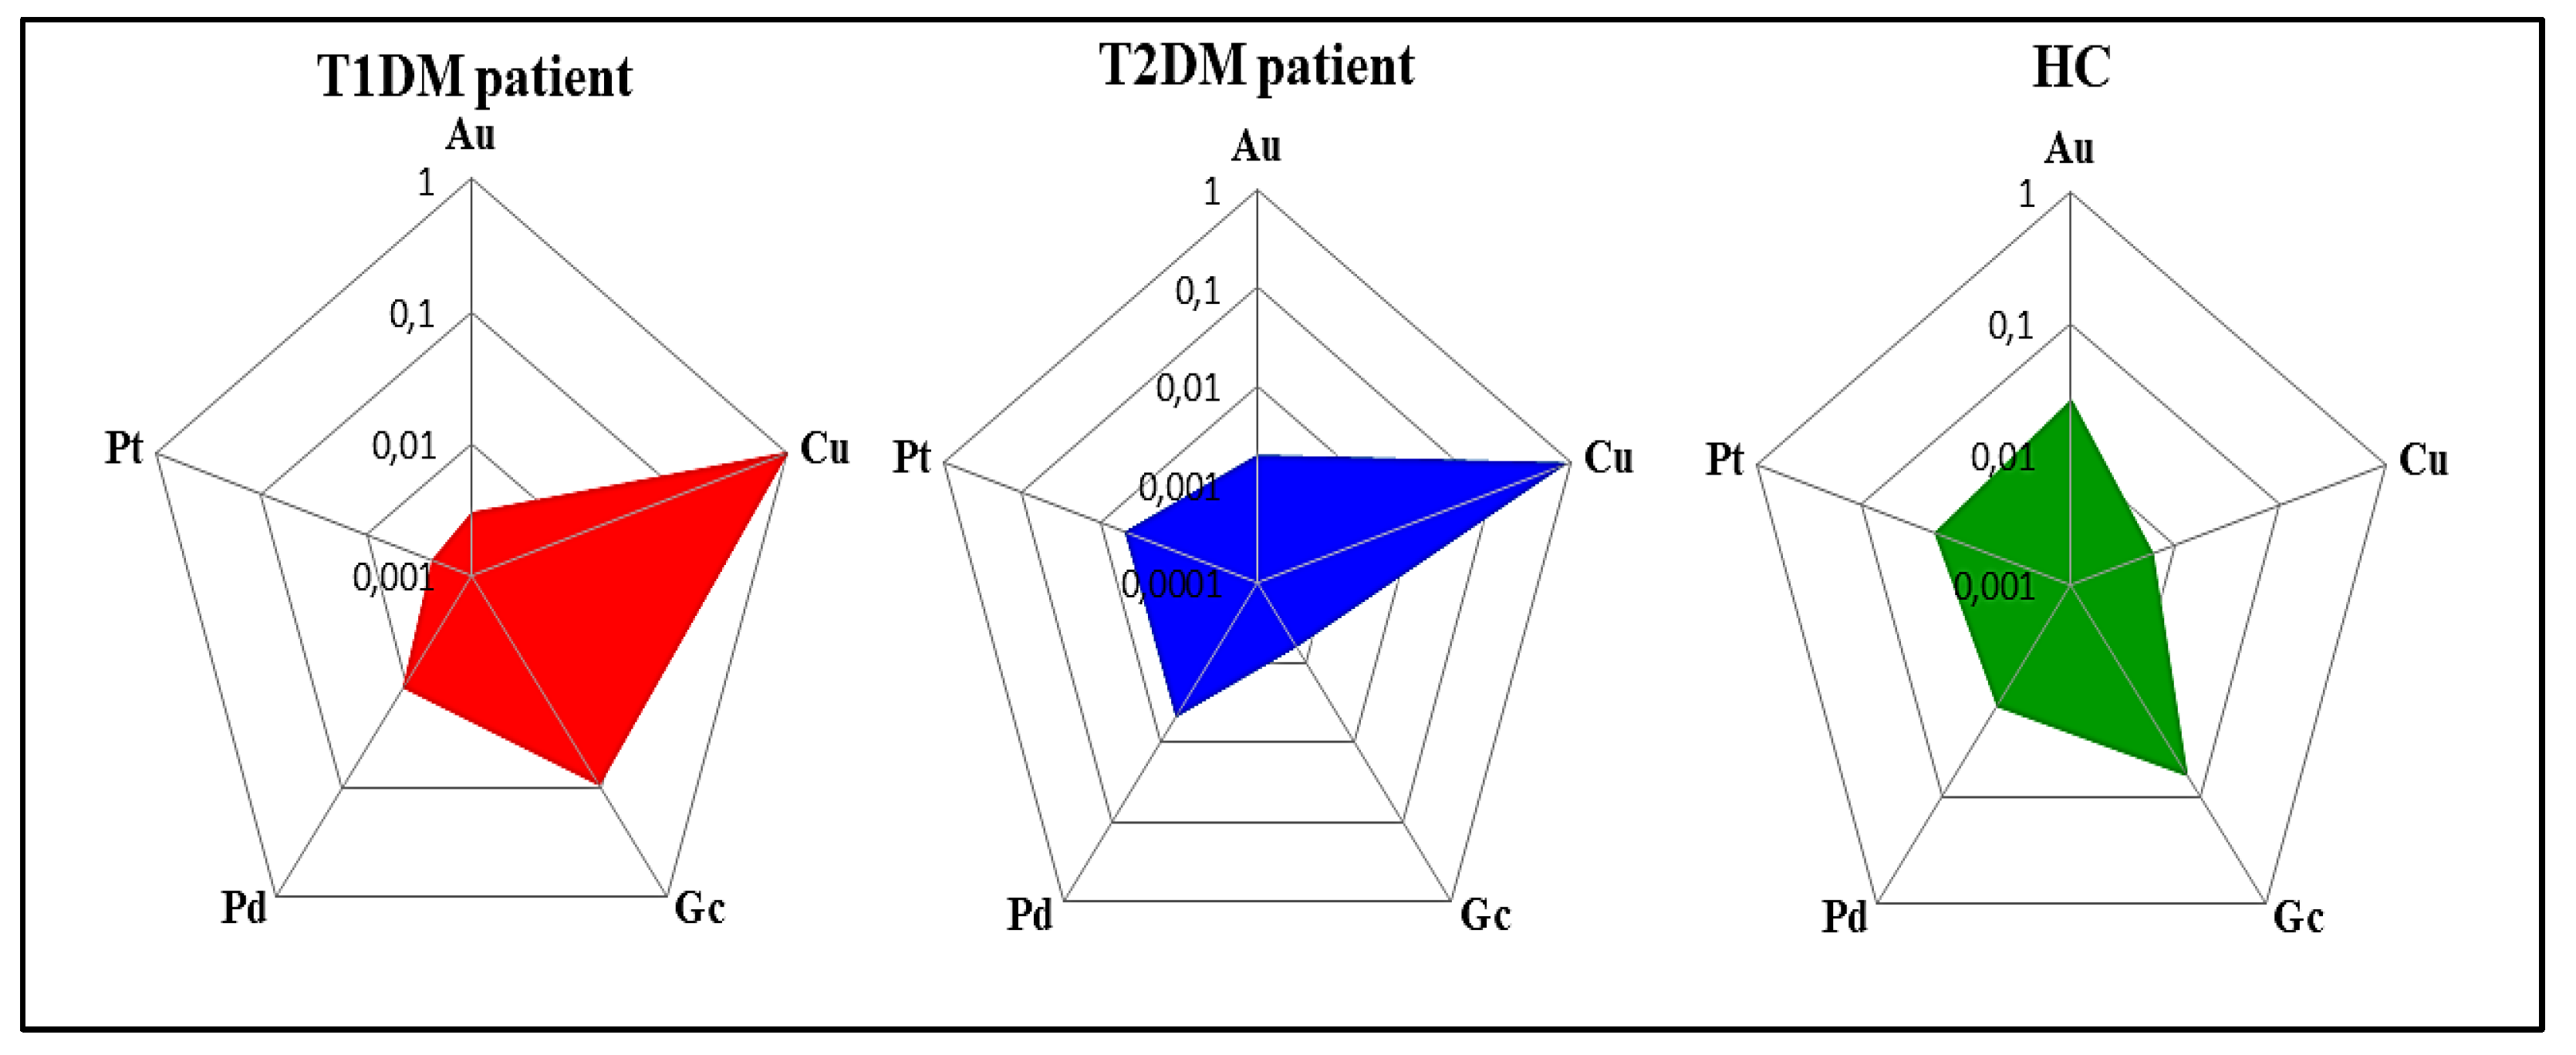
Figure 9 depicts the radar plots for the five electrodes exposed to urine samples of T1DM, T2DM patients and HC, expressed by area as feature. As can be seen, although there are some similarities, each representation has its own chemical signature. Indeed, the radar plots demonstrate that a significant difference exists between the urine samples of the three studied health states.
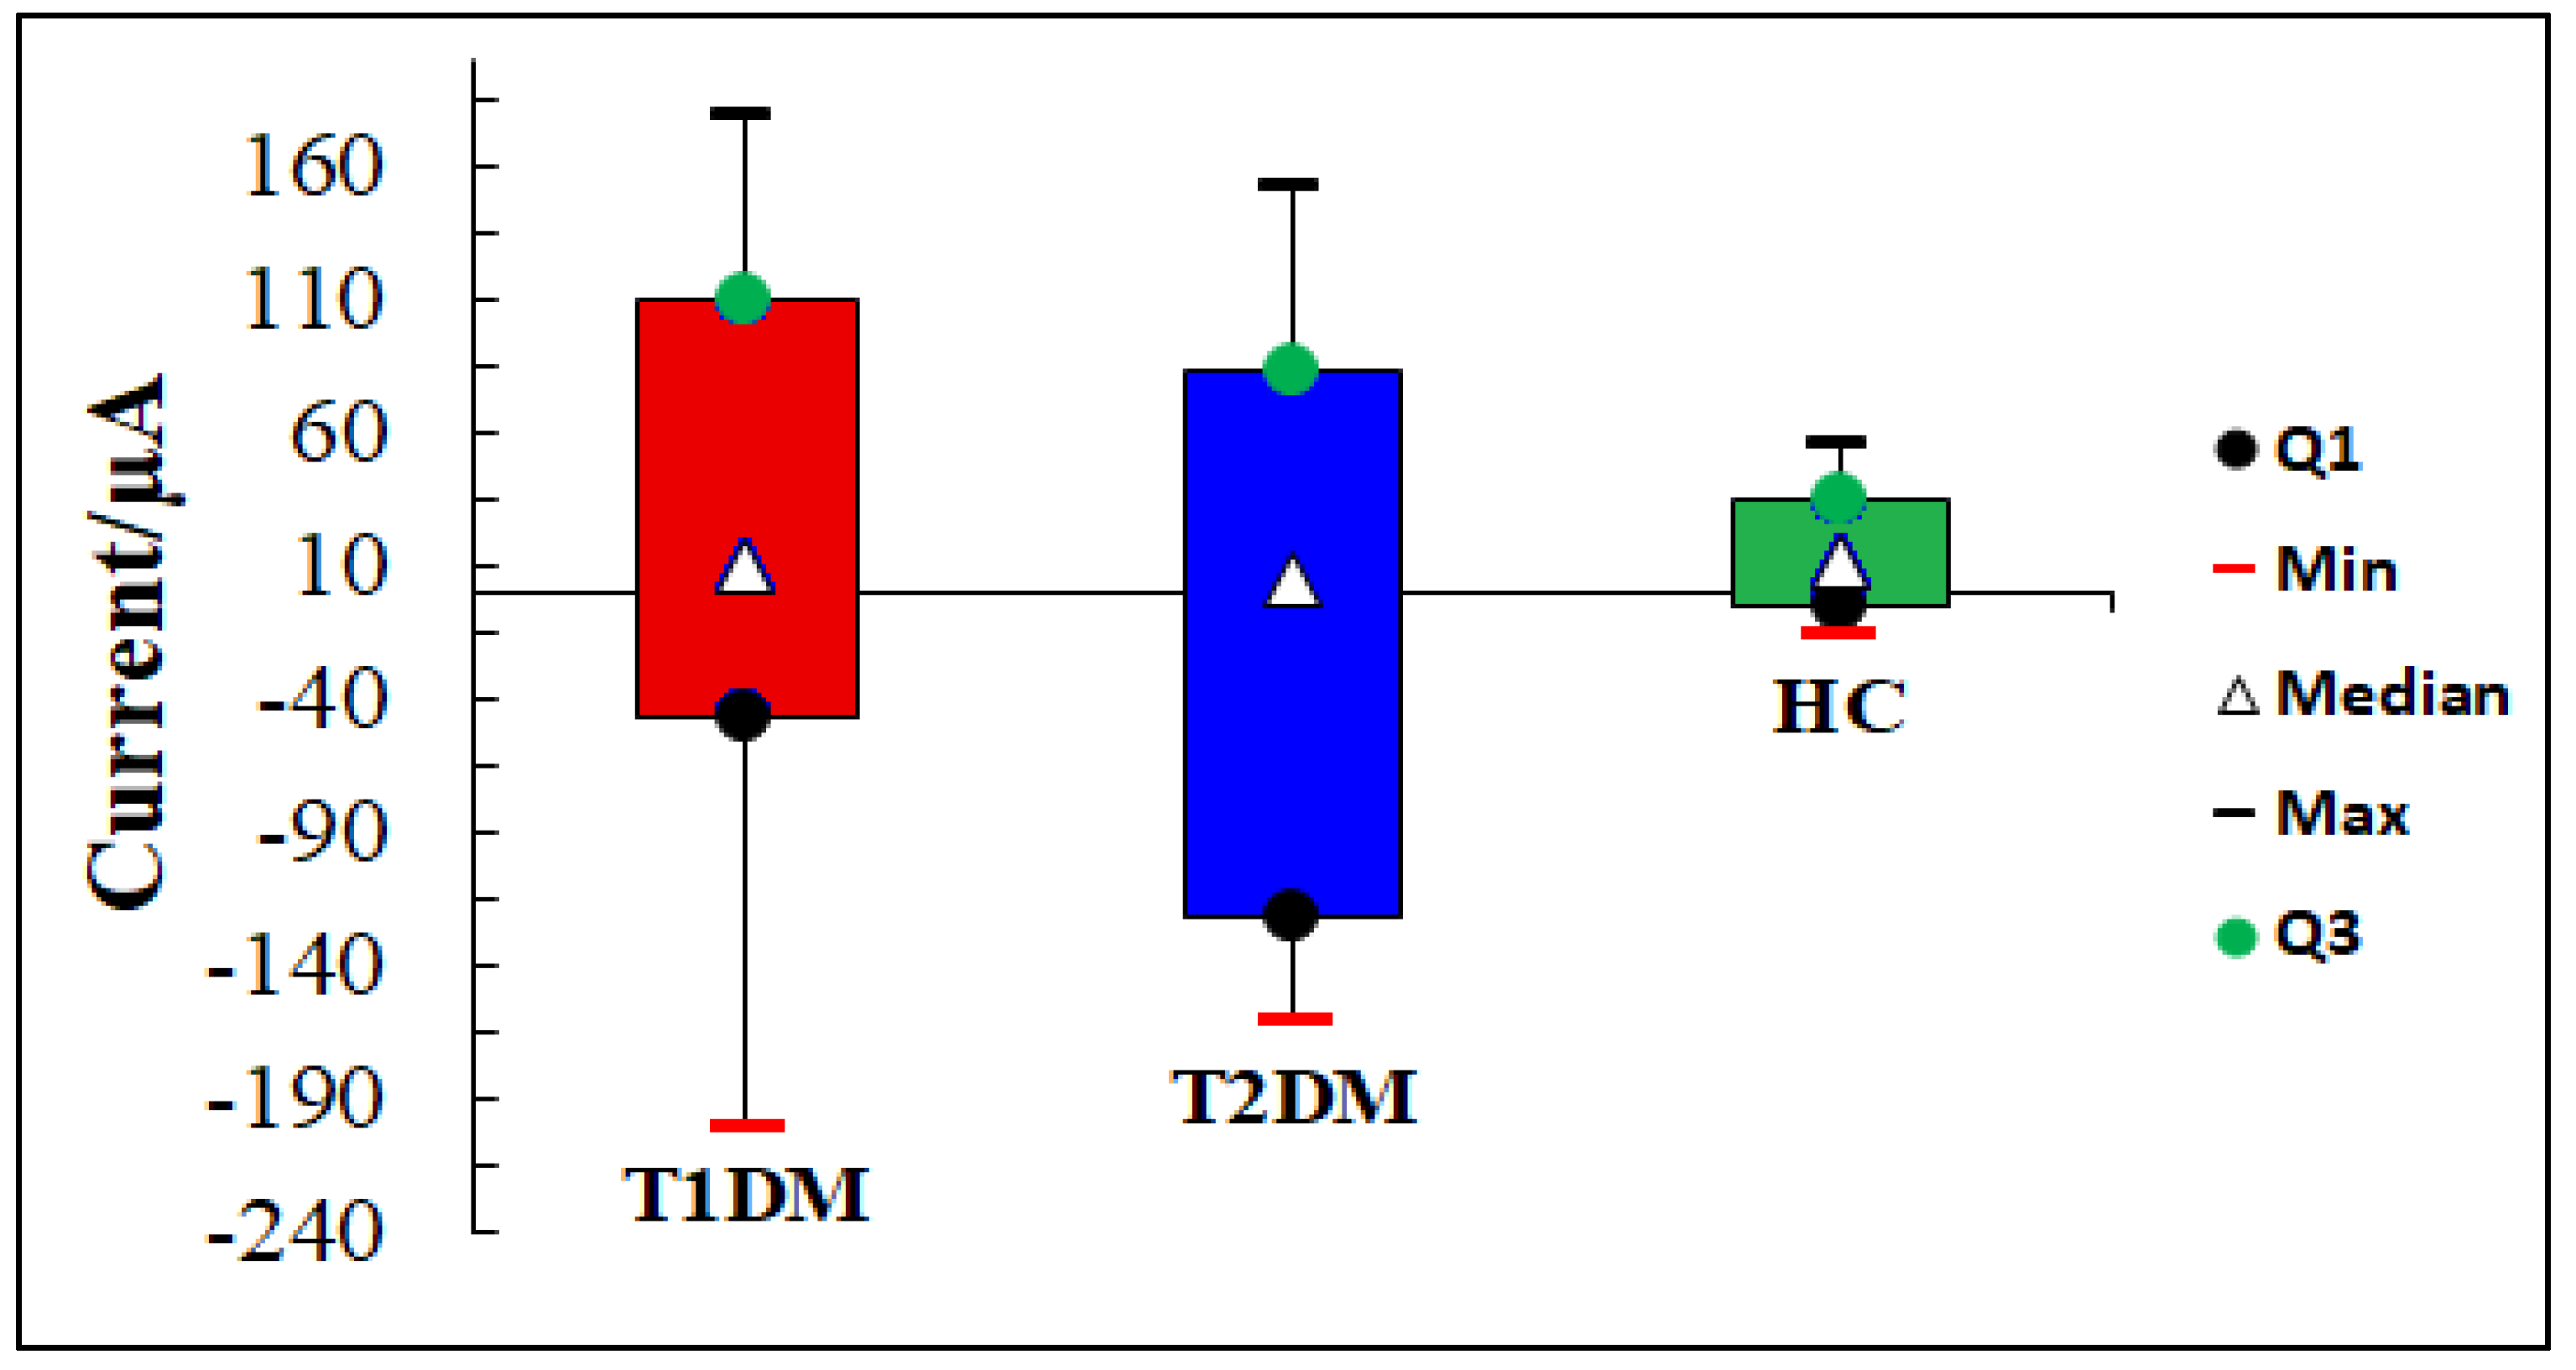
The box-plots generated derived from the responses of all sensors to the samples of all subjects are shown in Figure 10. The boxes (red for T1DM, blue for T2DM and green for HC) show the interquartile (IQR) range containing 50% of the analyzed data, and the white triangle across the box indicates the median. It can be noted that IQRs were significantly higher in T1DM, T2DM and healthy control patients, respectively. This suggests that there are specific VOCs in the urine of each health state.

3.2.2. PCA Discrimination Results of Urine Samples from DM and HC

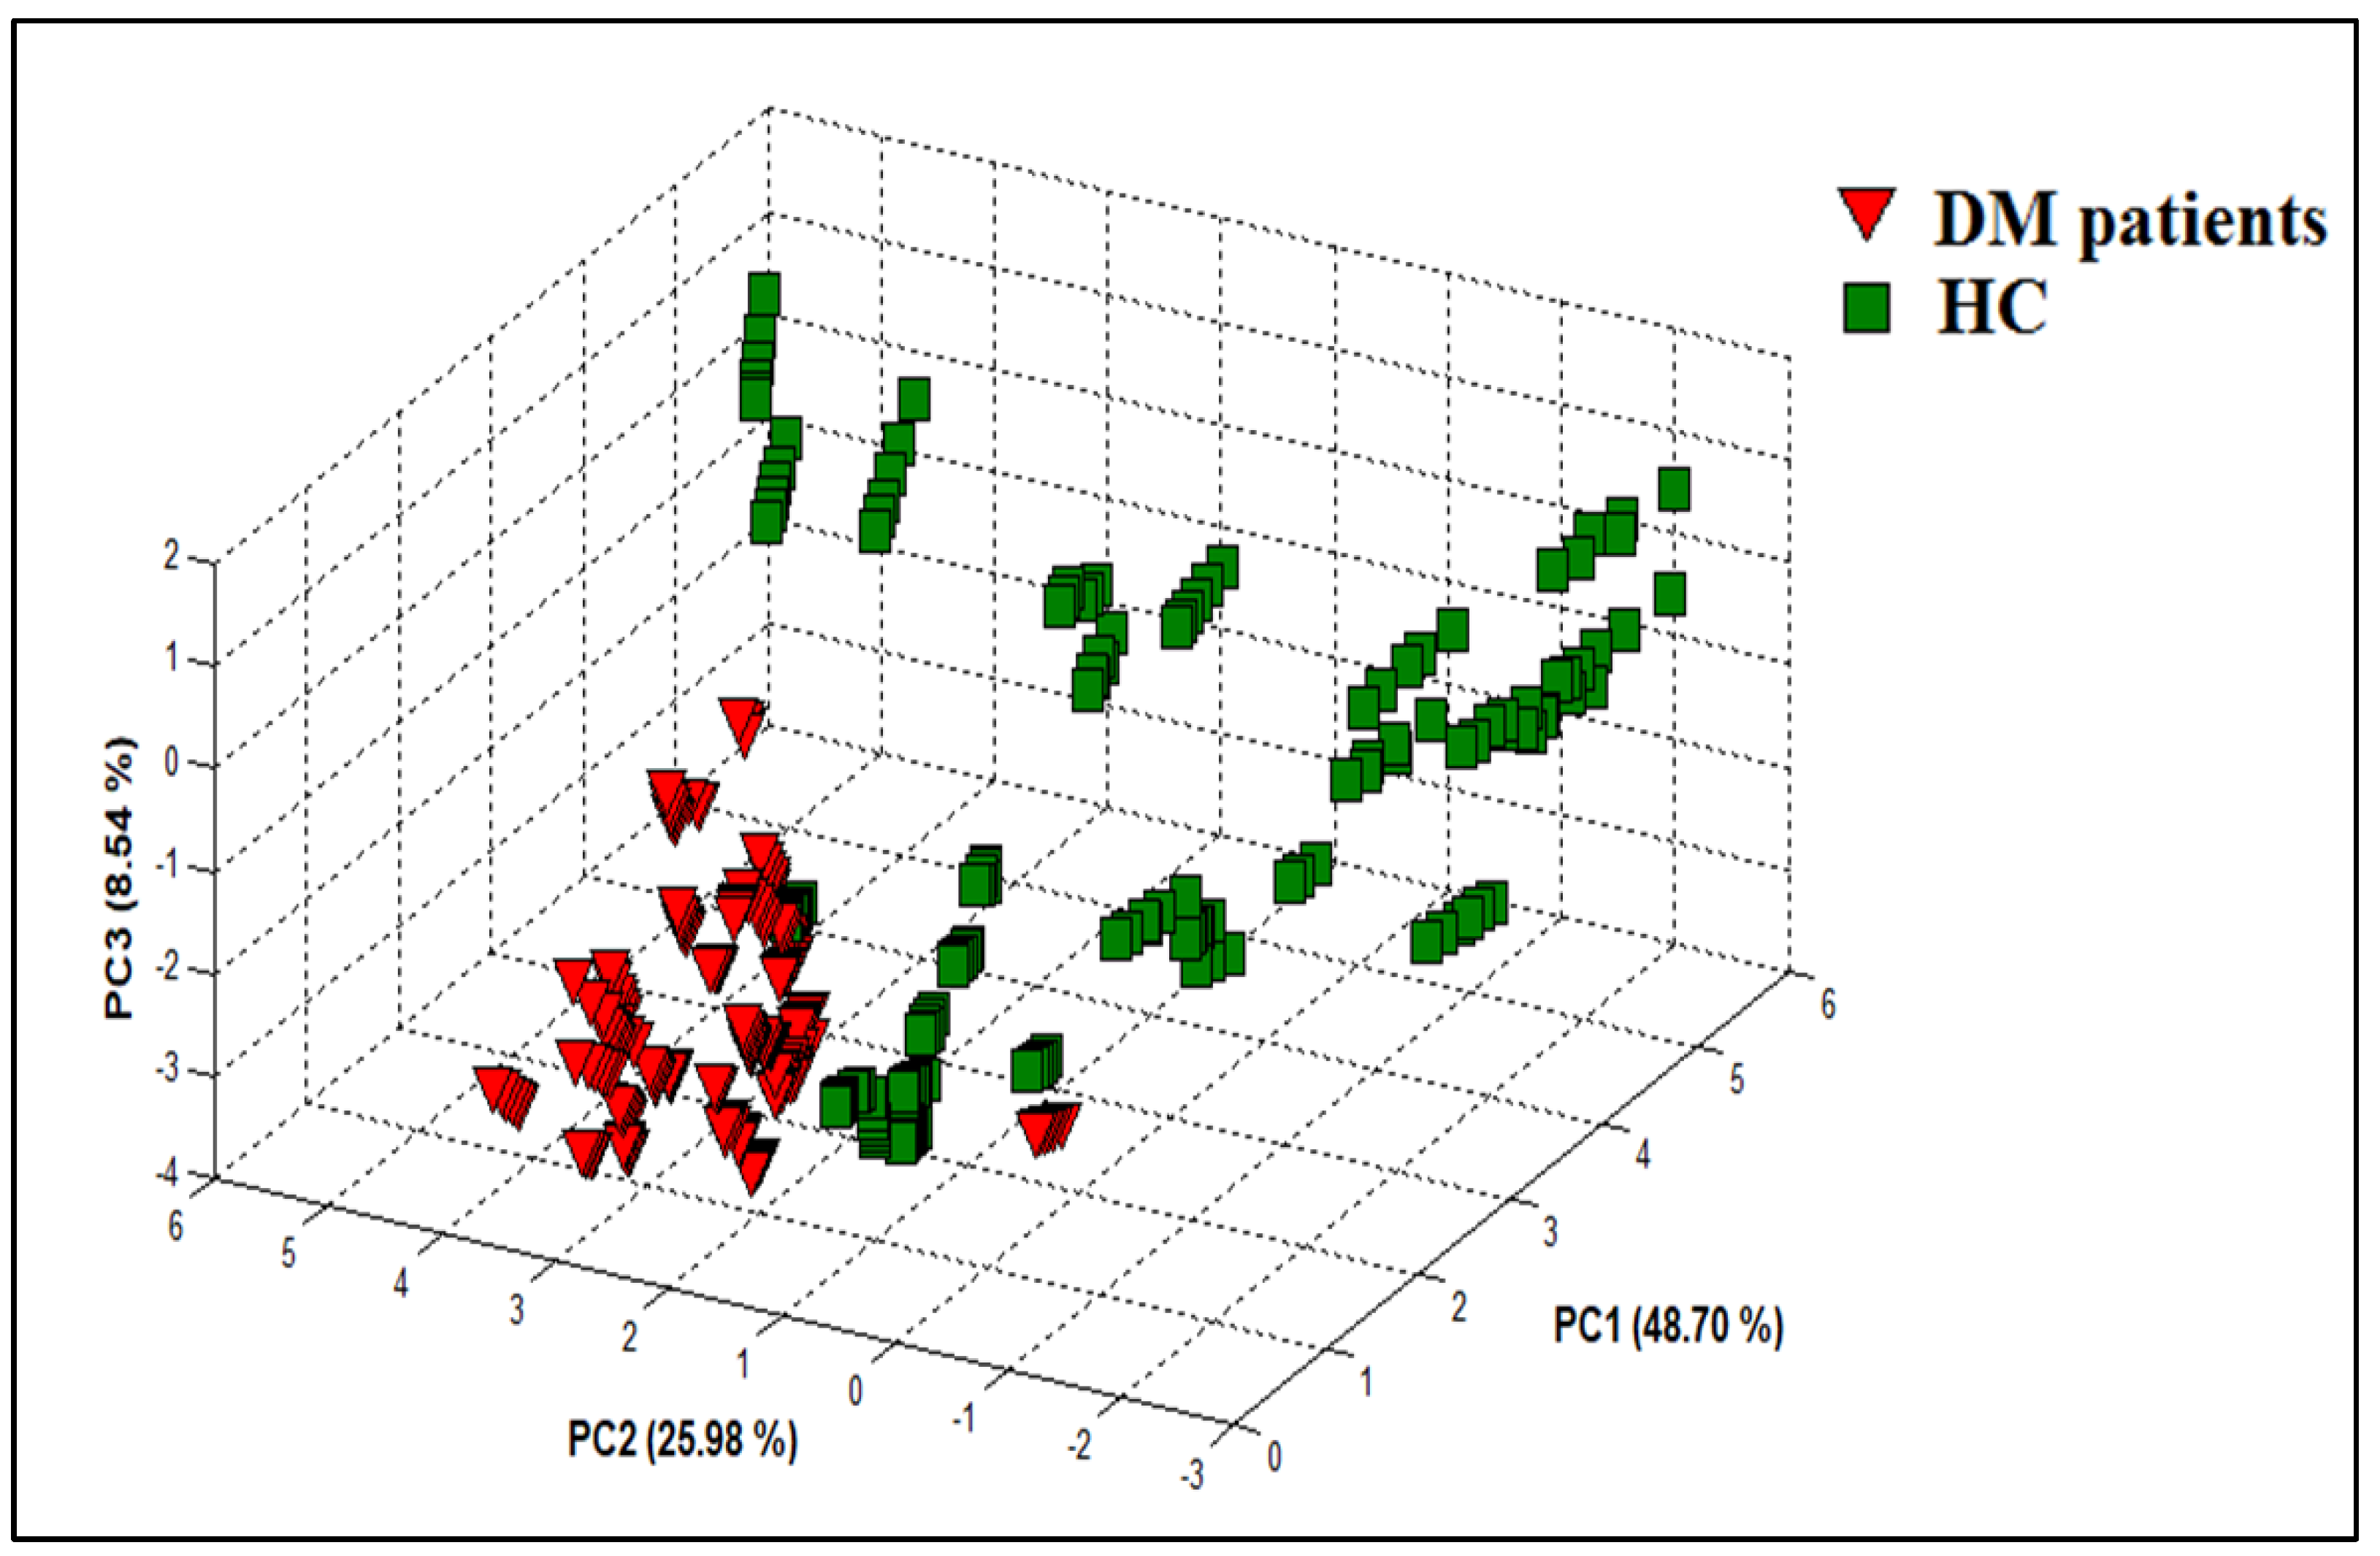
PCA was used to investigate the ability of the VE-tongue system to discriminate between urine samples from DM patients and HC. Figure 11 represents the result of the PCA, which allows us to see the distribution of the data in a three-dimensional space consisting of the first three principal components PC1, PC2, and PC3. These three components collectively account for 83.22% (PC1 = 48.70%; PC2 = 25.98%; and PC3 = 8.54%) of the dataset variability corresponding to the urine samples of DM patients and HC. The VE-tongue coupled with PCA shows a very satisfactory discrimination of the different urine samples of DM patients and HC. Therefore, the data processing by PCA method demonstrated the feasibility of the proposed VE-tongue device to differentiate the two studied groups according to their health status.

3.2.3. DFA Discrimination Results of Urine Samples from DM and HC

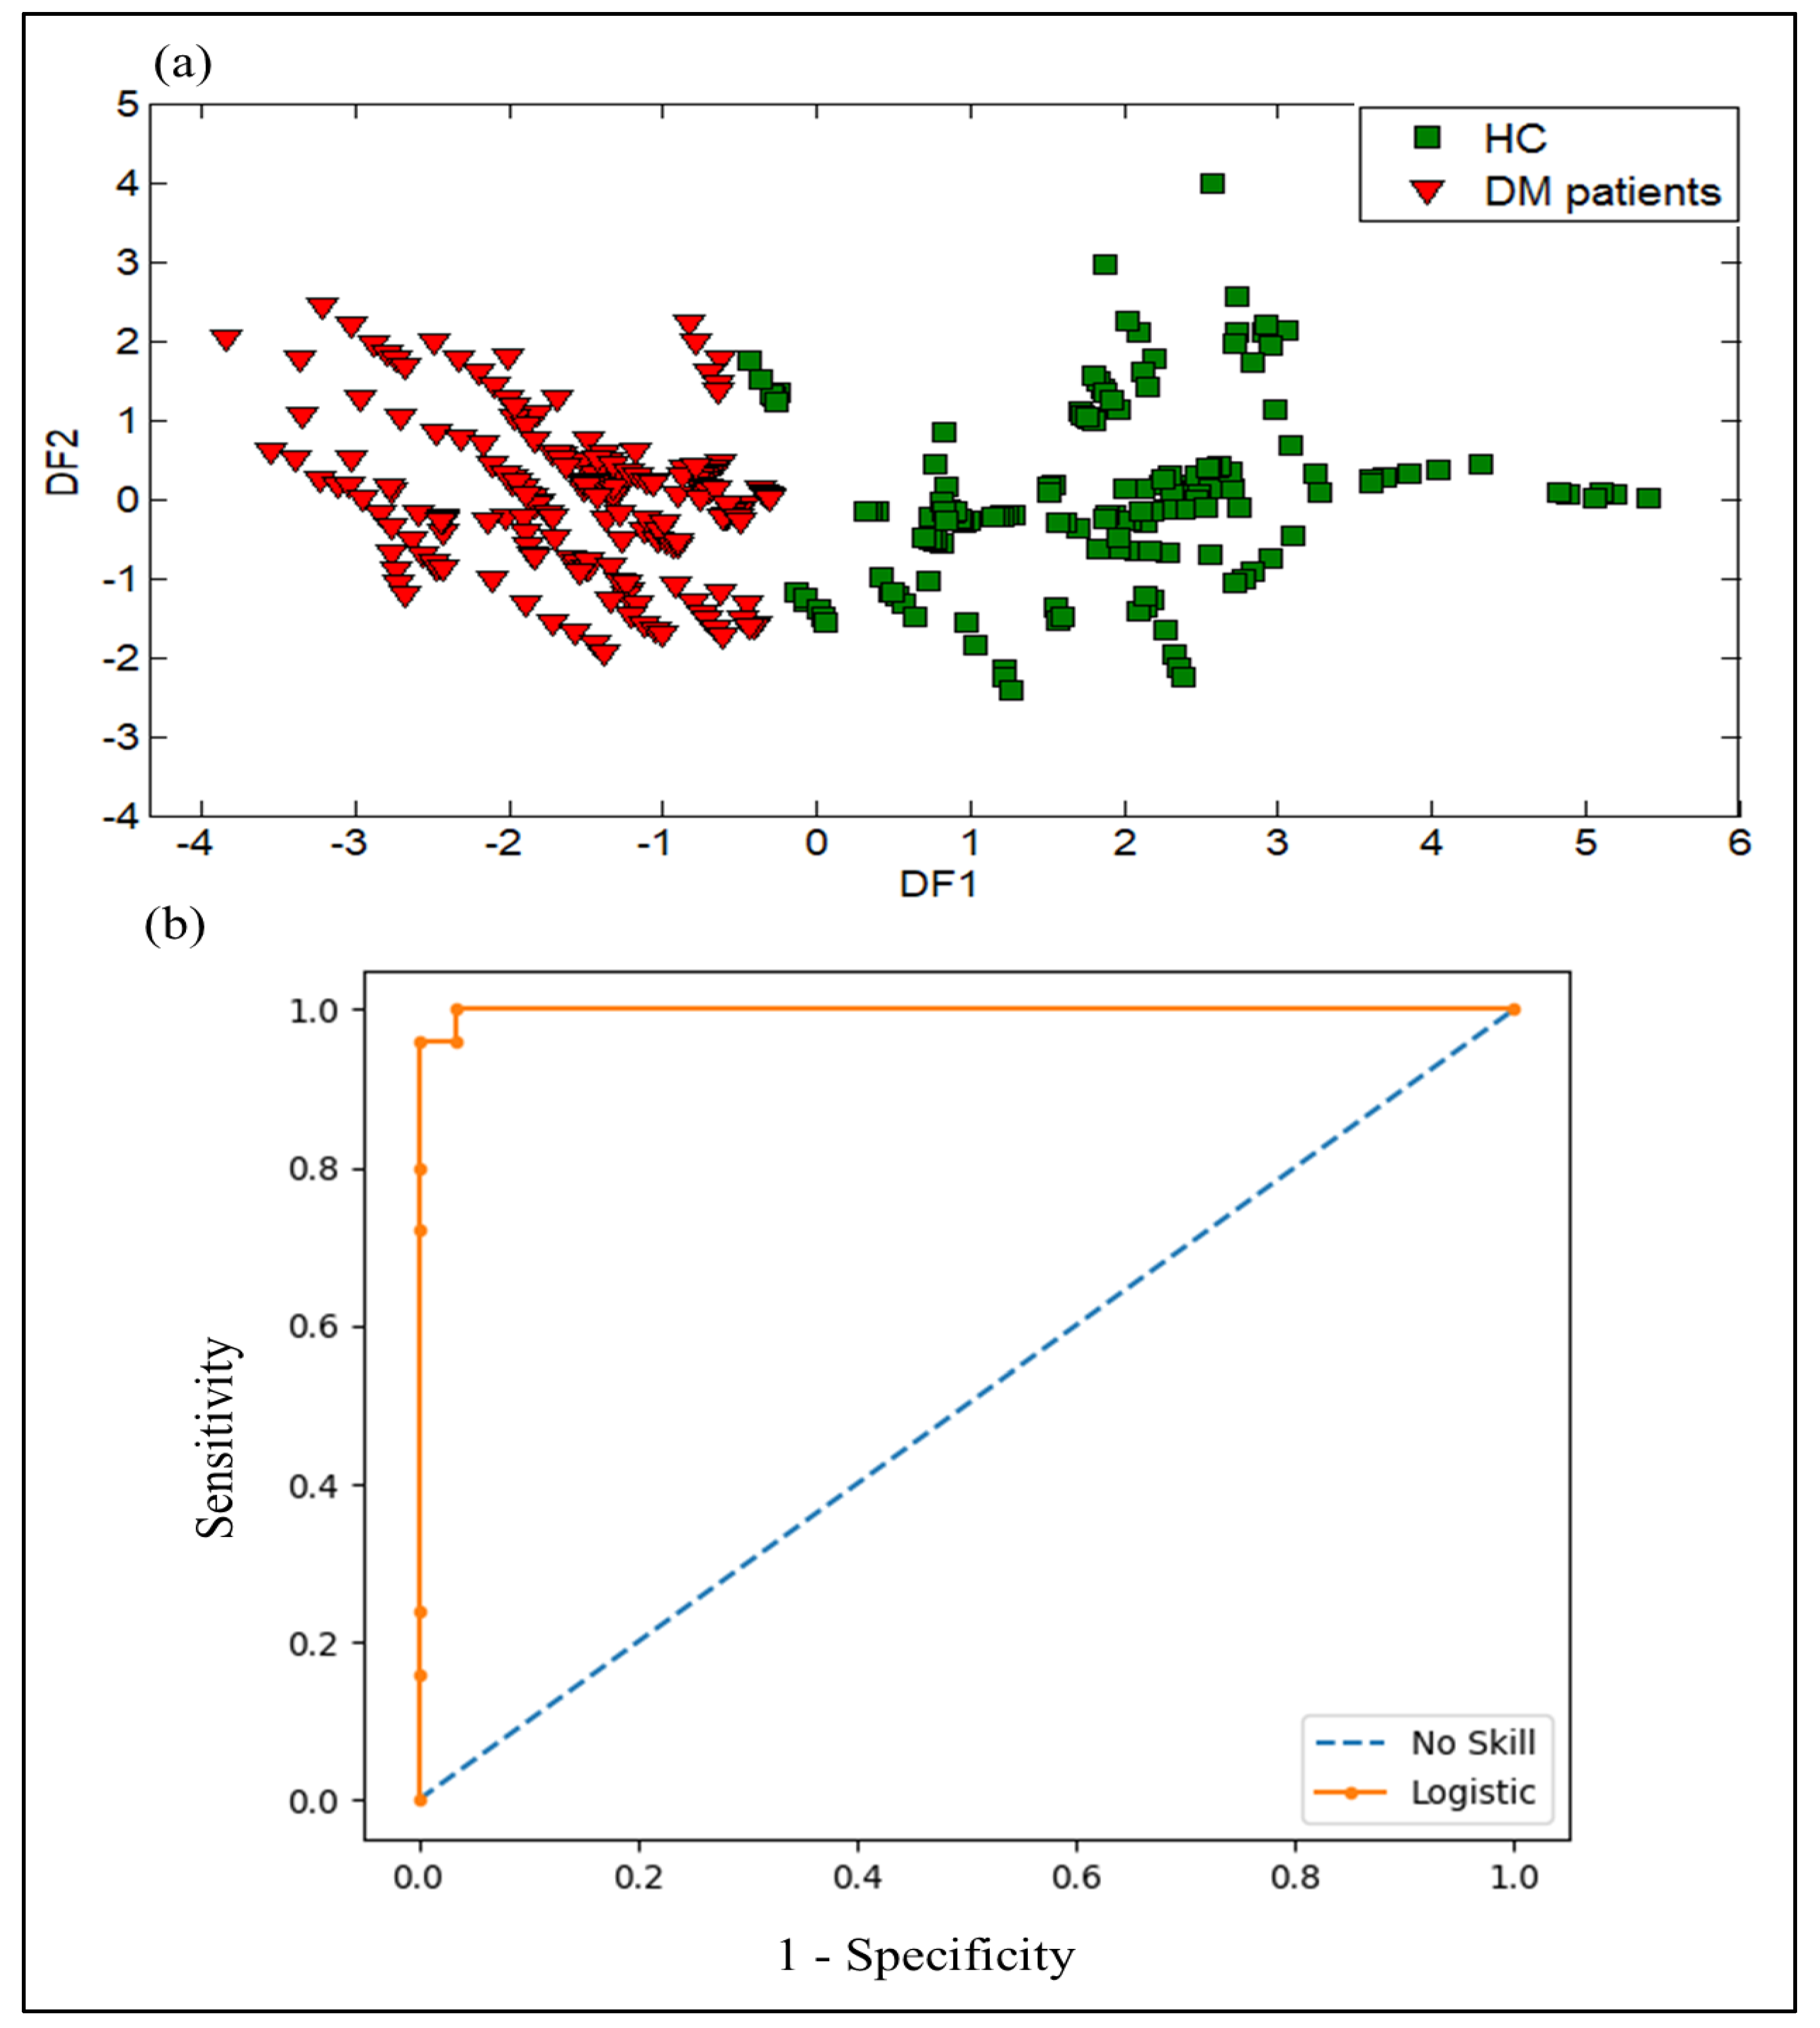
Using the same dataset and same features as in the PCA method, DFA, which is a supervised method, was used to differentiate between various urine samples based on the status patients’ health. Figure 12a shows how the urine samples were separated into two groups using the first two functions of DFA. The result shows good discrimination between DM patients and HC. Therefore, the data processing by DFA technique reveals the effectiveness of the proposed VE-tongue system in distinguishing DM patients and HC.
The ROC curve and ROC AUC analysis of the logistic regression were used to evaluate the diagnostic performance of the VE-tongue system. The ROC curve was generated using data from urine samples obtained from DM patients and HC, and the ROC AUC value was calculated to assess the model’s diagnostic effectiveness. Figure 12b shows the ROC curve of data acquired from the VE-tongue device with an ROC AUC value of 0.98 for the analysis of DM and healthy control urine samples. These findings indicate that the VE-tongue model outperforms the e-nose model in terms of diagnostic performance.

3.2.4. SVM Results of Urine Samples from DM and HC

Table 4 presents the SVM results when analyzing the data from the VE-tongue for 360 urine samples. The same trend as for the e-nose is observed, with the occurrence of three errors and a success rate of 99.16%.

3.2.5. DFA Discrimination Results and Performance Evaluation Results of VE-Tongue System by the ROC of Urine Samples from T1DM and T2DM

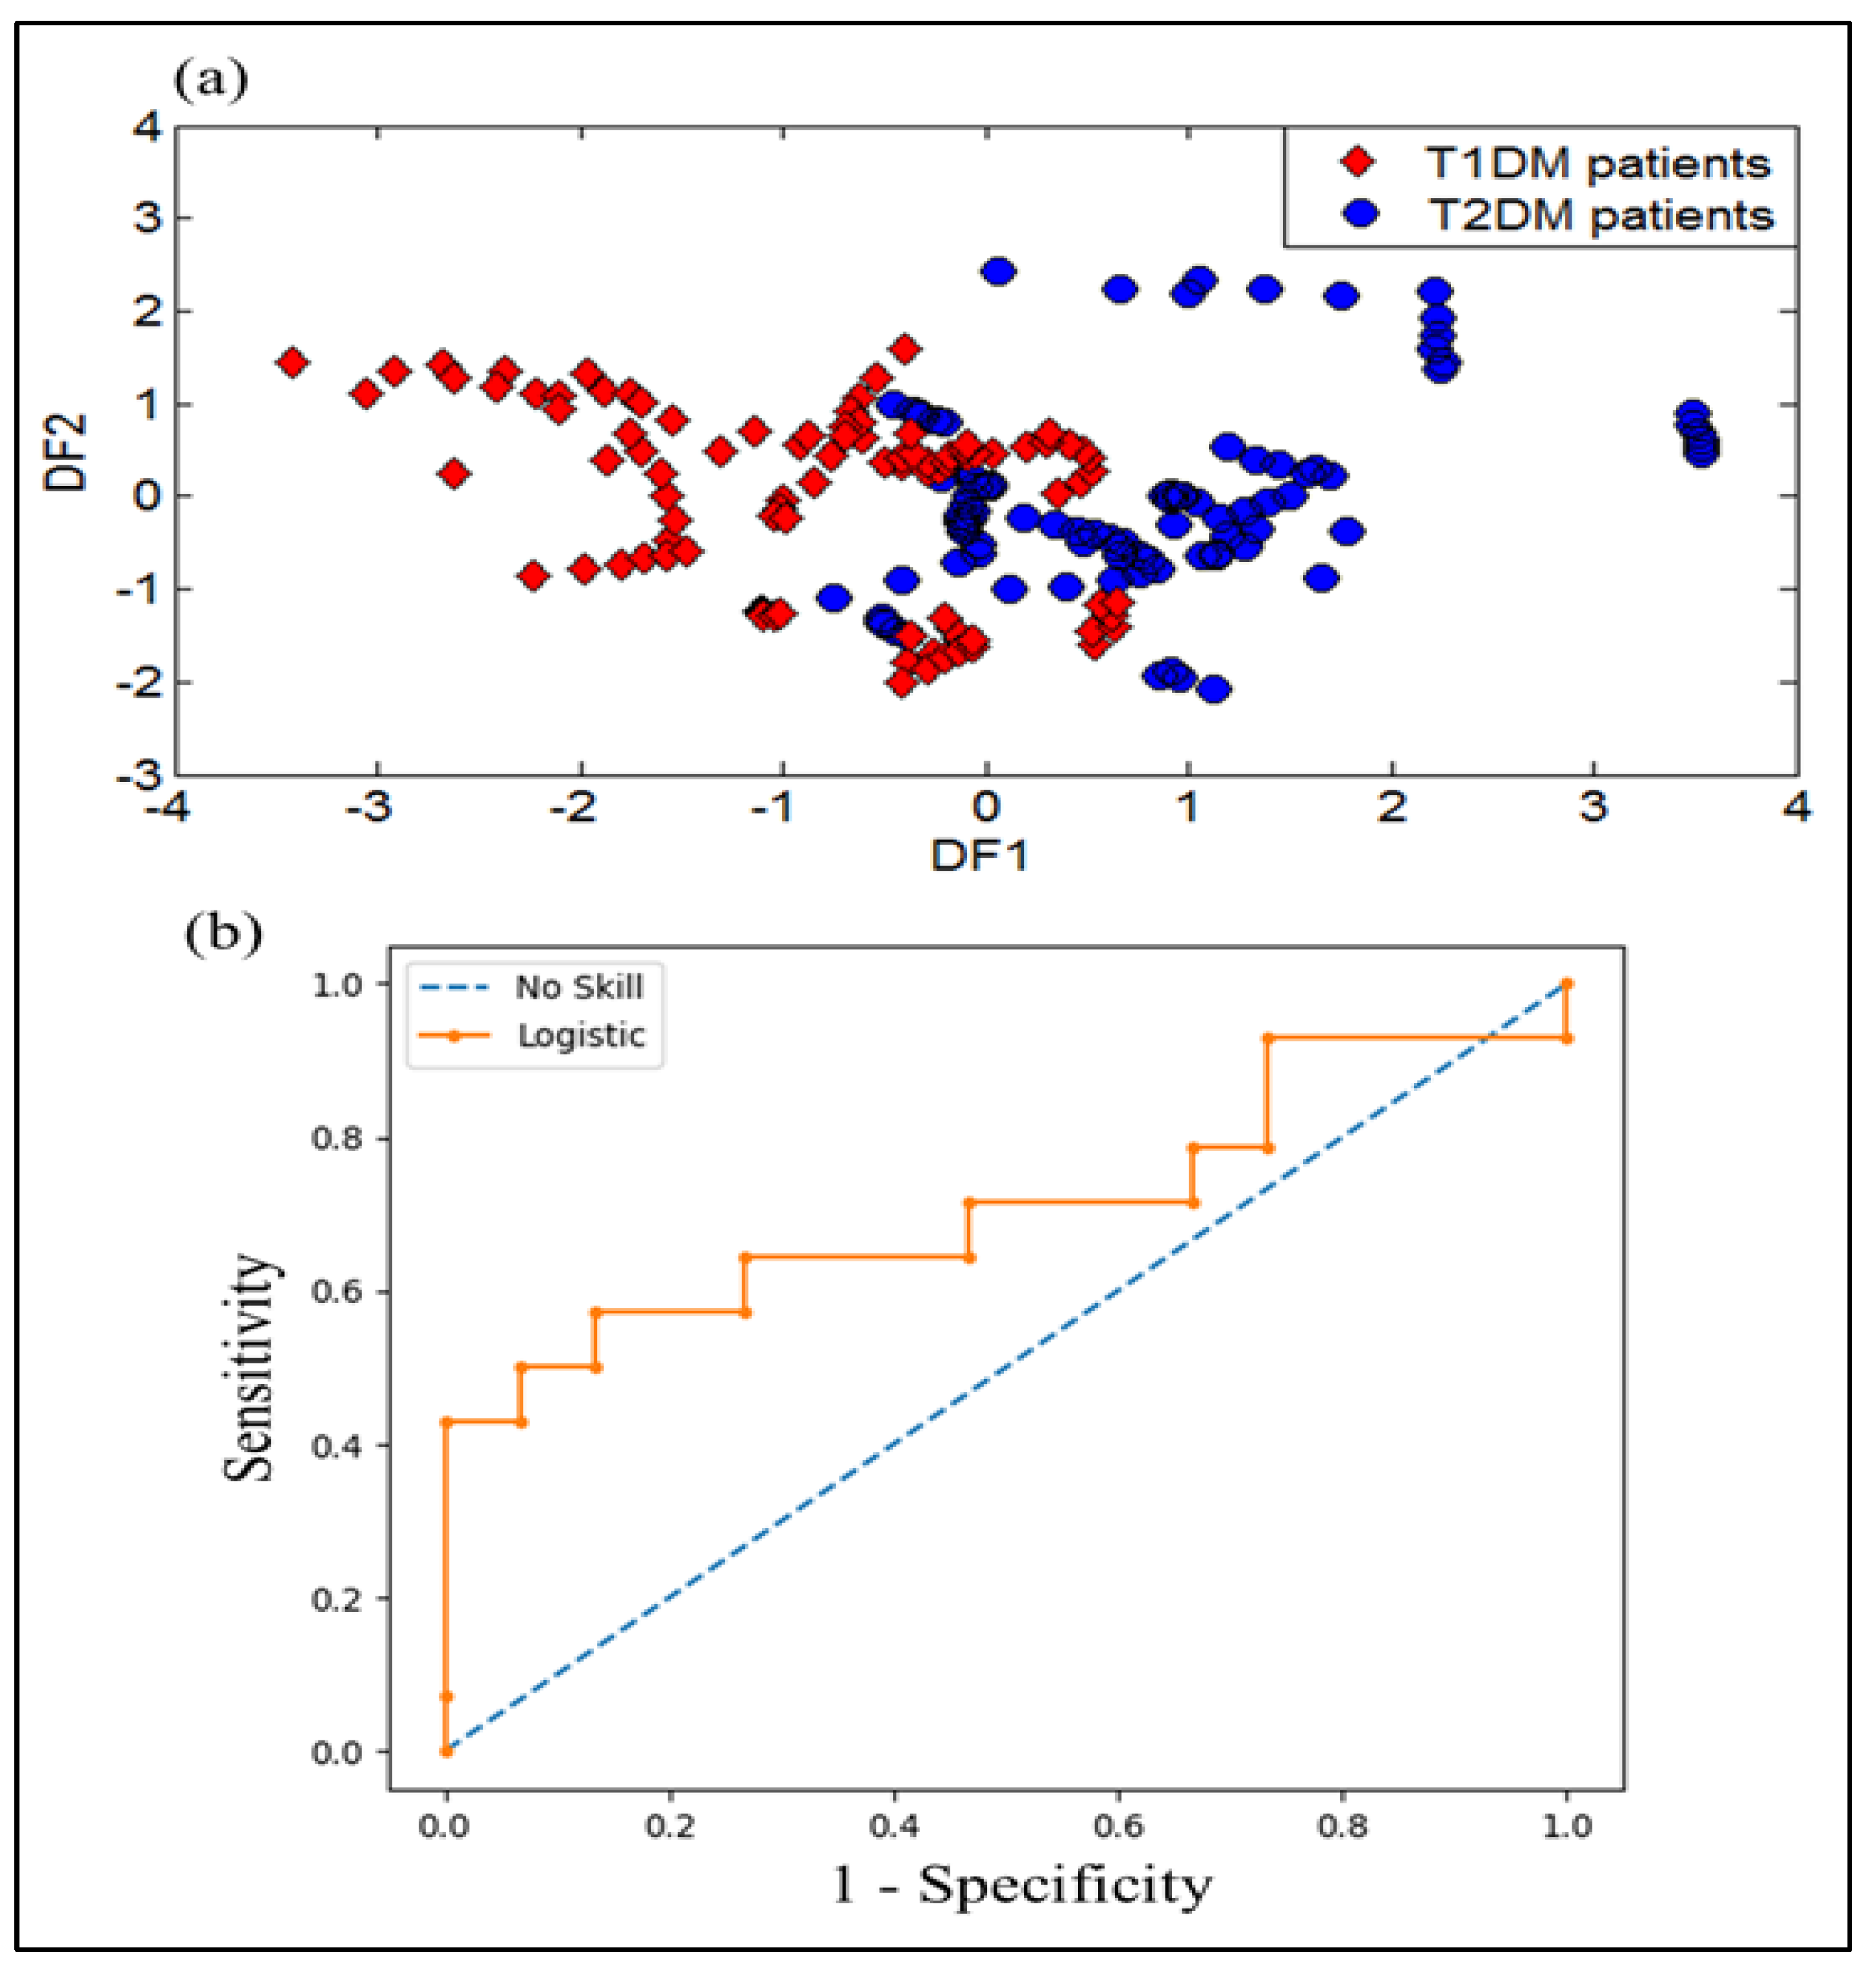
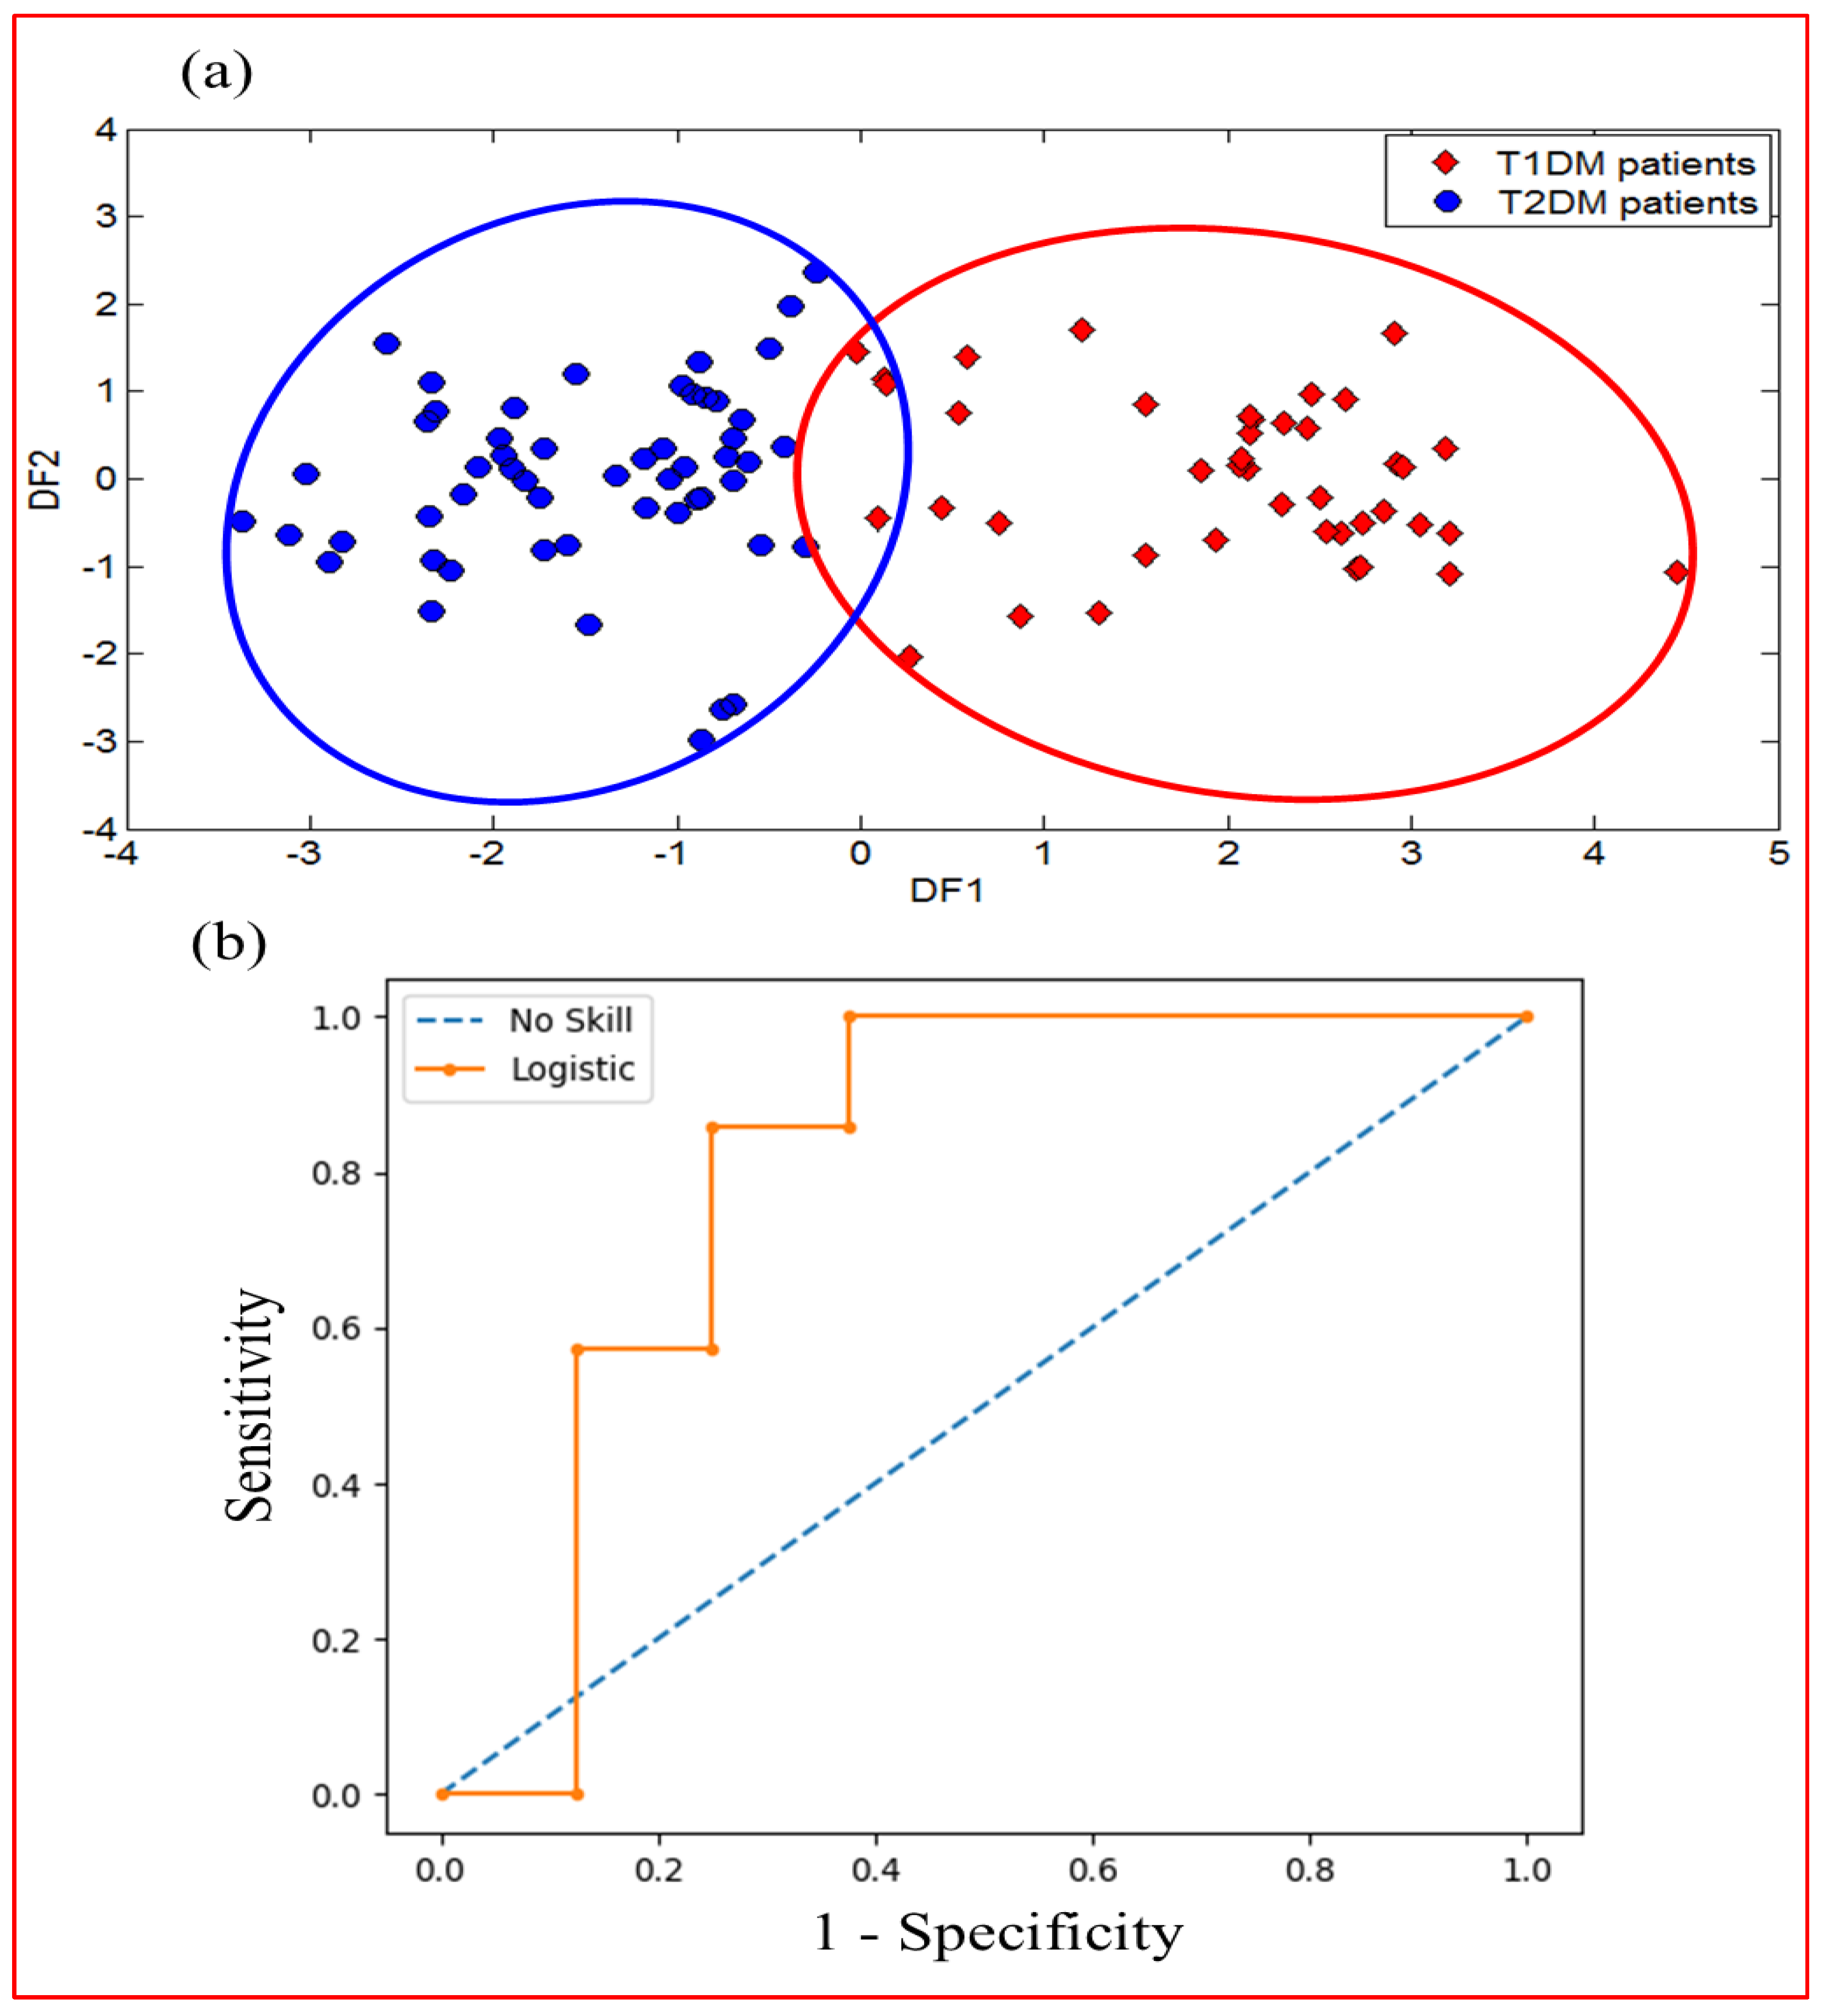
DFA was applied to the dataset extracted from the VE-tongue system in other to examine its performance in discriminating different urine samples. Figure 13a shows the DFA discrimination results obtained for the urine samples of patients with T1DM and T2DM. As we can see, the samples of the T1DM patients overlapped with those of the T2DM patients. As a result, the VE-tongue system coupled with the DFA method does not lead to a perfect separation between T1DM and T2DM patients. These results suggest the use of data fusion to recognize the two types of diabetes.
The ROC curve and ROC AUC analysis of the logistic regression were also applied to explore the diagnostic performance of the VE-tongue model. Figure 13b shows the ROC curve of the VE-tongue data with an ROC AUC of 0.710, corresponding to the analysis of urine samples corresponding to T1DM and T2DM patients. These results show that the diagnostic performance of the e-nose model is higher than that of the VE-tongue model.

3.2.6. SVM Results of Urine Samples from T1DM and T2DM

The dataset formed from the two groups of DM was used to distinguish between different urine samples based on their health states.
Table 5 illustrates the SVM results for 192 urine samples (32 volunteers providing 6 samples each). The SVM method attained a success rate of 76.04% in recognizing T1DM and T2DM. As shown in Table 5, 46 errors were detected.

3.3. Data Fusion Results of the E-Nose and VE-Tongue Systems

DFA was used to test the capability of the data fusion method to enhance the classification of different samples according to their health status. Figure 14a illustrates the first two functions of DFA for the discrimination of T1DM and T2DM patients using data fusion of e-nose and VE-tongue systems. The result displays an excellent distinction between T1DM and T2DM patients. Therefore, the DFA data processing reveals the effectiveness of the proposed data fusion method in distinguishing the two types of diabetes (T1DM and T2DM).
ROC analysis was also carried out to evaluate the diagnostic performance after data fusion in order to improve the classification of the different samples according to their diabetes type. Figure 14b displays the ROC curve corresponding to the merged data of both devices with a very good ROC AUC value (0.804). This result shows that the diagnostic performance of the model obtained after data fusion is superior to that obtained using the data from the e-nose and VE-tongue systems individually. This result confirms the effectiveness of merging data from two systems to successfully discriminate T1DM and T2DM patients.
In order to improve the SVM results obtained by taking the two measurement systems individually, the SVM method was applied to the fused data.
Table 6 displays the SVM results for the data fusion of the e-nose and VE-tongue systems. The SVM method performed well, with a success rate of 93.75% for the recognition of T1DM and T2DM. In the light of this result, it can be concluded that the data fusion technique is a good way to improve the classification of different samples.

4. Conclusions

This study confirmed that the use of e-nose and VE-tongue analyses performed separately, then combined with pattern recognition methods, have the capability to discriminate DM patients and HC based on exhaled breath and urine analyses, respectively. Furthermore, the data fusion of the two devices provided very satisfactory results in terms of discrimination and classification of T1DM and T2DM patients. The e-nose and VE-tongue responses displayed a clear variation and important differences between the studied health states. In addition, the supervised method (DFA) was able to clearly differentiate between T1DM and T2DM patients. Furthermore, the diagnostic performance of the model obtained after data fusion by the ROC method is superior to those found using the e-nose and VE-tongue data individually. In light of these results, the electronic sensing systems have proven to be valuable tools for classifying human breath and urine samples based on their health status. Therefore, the two proposed devices have the capability of non-invasively and painlessly detecting DM disease. They could be extended in clinical practice for T1DM and T2DM diagnosis.

Supplementary Materials

The following supporting information can be downloaded at: https://www.mdpi.com/article/10.3390/chemosensors11060350/s1, Figure S1: Experimental set-up of the e-nose dedicated to the analysis of breath samples; Figure S2: Experimental set-up of the VE-tongue dedicated to the analysis of urine samples.

Author Contributions

O.Z.: Formal analysis, writing—original draft preparation, software; B.B.: Supervision, review and editing; S.M.: Breath and urine samples collection; S.A.: Investigation; E.L.: Review and editing; N.E.B.: Conceptualization, methodology, investigation. All authors have read and agreed to the published version of the manuscript.

Funding

This work has been funded in part by CANLEISH under the H2020-MSCA-RISE-2020 project, grant agreement number: 101007653: “Non-invasive volatiles test for canine leishmaniasis diagnosis”.

Institutional Review Board Statement

The study was conducted in accordance with the Declaration of Helsinki, and approved Ethics done by committee of biomedical research of University Mohammed V Rabat, Morocco, 29 January 2019).

Informed Consent Statement

Informed consent was obtained from all subjects involved in the study.

Data Availability Statement

Not applicable.

Acknowledgments

The authors gratefully acknowledge Moulay Ismaïl University of Meknes for financial support of the project “Research support”. E.L. is supported by the Catalan Institution for Research and Advanced Studies via the 2018 Edition of the ICREA Academia Award.

Conflicts of Interest

The authors declare no conflict of interest.

References

  1. Chetoui, A.; Kaoutar, K.; El Kardoudi, A.; Boutahar, K.; Chigr, F.; Najimi, M. Epidemiology of diabetes in Morocco: Review of data, analysis and perspectives. Int. J. Sci. Eng. Res. 2018, 9, 1310–1316. [Google Scholar]
  2. Metwally, A.M.; Soliman, M.; Abdelmohsen, A.M.; Kandeel, W.A.; Saber, M.; Elmosalami, D.M.; Asem, N.; Fathy, A.M. Effect of counteracting lifestyle barriers through health education in Egyptian type 2 diabetic patients. J. Med. Sci. 2019, 7, 2886. [Google Scholar] [CrossRef] [Green Version]
  3. American Diabetes Association. Diagnosis and classification of diabetes mellitus. Diabetes Care 2014, 37, S81–S90. [Google Scholar] [CrossRef] [Green Version]
  4. Lekha, S.; Suchetha, M. Recent advancements and future prospects on E-Nose sensors technology and machine learning approaches for non-invasive diabetes diagnosis: A Review. IEEE Rev. Biomed. Eng. 2020, 14, 127–138. [Google Scholar] [CrossRef]
  5. Mollah, Z.U.A.; Pai, S.; Moore, C.; O’sullivan, B.J.; Harrison, M.J.; Peng, J.; Phillips, K.; Prins, J.B.; Cardinal, J.; Thomas, R. Abnormal NF-κB function characterizes human type 1 diabetes dendritic cells and monocytes. J. Immunol. 2008, 180, 3166–3175. [Google Scholar] [CrossRef] [PubMed] [Green Version]
  6. Atkinson, M.A.; Eisenbarth, G.S. Type 1 diabetes: New perspectives on disease pathogenesis and treatment. Lancet 2001, 358, 221–229. [Google Scholar] [CrossRef] [PubMed]
  7. Blaha, M.; Spear, C.; Nicholson, W.; Radhika, A.; Shiota, M.; Charron, M.J.; Wright, C.V.E.; Powers, A.C. Reduced PDX-1 expression impairs islet response to insulin resistance and worsens glucose homeostasis. Am. J. Physiol. Endocrinol. Metab. 2005, 288, E707–E714. [Google Scholar]
  8. Turner, C. Potential of breath and skin analysis for monitoring blood glucose concentration in diabetes. Expert. Rev. Mol. Diagn. 2011, 11, 497–503. [Google Scholar] [CrossRef] [PubMed]
  9. Vaks, V.L.; Domracheva, E.G.; Sobakinskaya, E.A.; Chernyaeva, M.B. Exhaled breath analysis: Physical methods, instruments, and medical diagnostics. Phys. Usp. 2014, 57, 684. [Google Scholar] [CrossRef]
  10. Solovieva, S.; Karnaukh, M.; Panchuk, V.; Andreev, E.; Kartsova, L.; Bessonova, E.; Kartsova, L.; Bessonova, E.; Legin, A.; Wang, P.; et al. Potentiometric multisensor system as a possible simple tool for non-invasive prostate cancer diagnostics through urine analysis. Sens. Actuators B Chem. 2019, 289, 42–47. [Google Scholar] [CrossRef]
  11. Lubes, G.; Goodarzi, M. GC–MS based metabolomics used for the identification of cancer volatile organic compounds as biomarkers. J. Pharm. Biomed. Anal. 2018, 147, 313–322. [Google Scholar] [CrossRef]
  12. Garg, V.; Kumar, M.; Mahapatra, H.S.; Chitkara, A.; Gadpayle, A.K.; Sekhar, V. Novel urinary biomarkers in pre-diabetic nephropathy. Clin. Exp. Nephrol. 2015, 19, 895–900. [Google Scholar] [CrossRef]
  13. Trefz, P.; Schmidt, S.C.; Sukul, P.; Schubert, J.K.; Miekisch, W.; Fischer, D.C. Non-invasive assessment of metabolic adaptation in paediatric patients suffering from type 1 diabetes mellitus. J. Clin. Med. 2019, 8, 1797. [Google Scholar] [CrossRef] [PubMed] [Green Version]
  14. Greiter, M.B.; Keck, L.; Siegmund, T.; Hoeschen, C.; Oeh, U.; Paretzke, H.G. Differences in exhaled gas profiles between patients with type 2 diabetes and healthy controls. Diabetes Technol. Ther. 2010, 12, 455–463. [Google Scholar] [CrossRef]
  15. Krilaviciute, A.; Stock, C.; Leja, M.; Brenner, H. Potential of non-invasive breath tests for preselecting individuals for invasive gastric cancer screening endoscopy. J. Breath. Res. 2018, 12, 036009. [Google Scholar] [CrossRef]
  16. Markar, S.R.; Lagergren, J.; Hanna, G.B. Research protocol for a diagnostic study of non-invasive exhaled breath analysis for the prediction of oesophago-gastric cancer. BMJ Open 2016, 6, e009139. [Google Scholar] [CrossRef] [Green Version]
  17. Yan, Y.; Wang, Q.; Li, W.; Zhao, Z.; Yuan, X.; Huang, Y.; Duan, Y. Discovery of potential biomarkers in exhaled breath for diagnosis of type 2 diabetes mellitus based on GC-MS with metabolomics. RSC Adv. 2014, 4, 25430–25439. [Google Scholar] [CrossRef]
  18. Blake, R.S.; Monks, P.S.; Ellis, A.M. Proton-transfer reaction mass spectrometry. Chem. Rev. 2009, 109, 861–896. [Google Scholar] [CrossRef] [PubMed]
  19. Westhoff, M.; Litterst, P.; Freitag, L.; Urfer, W.; Bader, S.; Baumbach, J.I. Ion mobility spectrometry for the detection of volatile organic compounds in exhaled breath of patients with lung cancer: Results of a pilot study. Thorax 2009, 64, 744–748. [Google Scholar] [CrossRef] [PubMed] [Green Version]
  20. Armenta, S.; Alcala, M.; Blanco, M. A review of recent, unconventional applications of ion mobility spectrometry (IMS). Anal. Chim. Acta 2011, 703, 114–123. [Google Scholar] [CrossRef]
  21. Scotter, J.M.; Langford, V.S.; Wilson, P.F.; McEwan, M.J.; Chambers, S.T. Real-time detection of common microbial volatile organic compounds from medically important fungi by Selected Ion Flow Tube-Mass Spectrometry (SIFT-MS). J. Microbiol. Methods. 2005, 63, 127–134. [Google Scholar] [CrossRef] [PubMed]
  22. Saidi, T.; Moufid, M.; de Jesus Beleño-Saenz, K.; Welearegay, T.G.; El Bari, N.; Lisset, A.; Mogollon, J.; Ionescu, R.; Bourkadi, J.E.; Benamor, J.; et al. Non-invasive prediction of lung cancer histological types through exhaled breath analysis by UV-irradiated electronic nose and GC/QTOF/MS. Sens. Actuators B Chem. 2020, 311, 127932. [Google Scholar] [CrossRef]
  23. Fitzgerald, J.; Fenniri, H. Cutting edge methods for non-invasive disease diagnosis using e-tongue and e-nose devices. Biosensors 2017, 7, 59. [Google Scholar] [CrossRef] [PubMed] [Green Version]
  24. Dragonieri, S.; Schot, R.; Mertens, B.J.; Le Cessie, S.; Gauw, S.A.; Spanevello, A.; Resta, O.; Willard, N.P.; Vink, T.J.; Rabe, K.F.; et al. An electronic nose in the discrimination of patients with asthma and controls. J. Allergy Clin. Immunol. 2007, 120, 856–862. [Google Scholar] [CrossRef] [PubMed] [Green Version]
  25. Saidi, T.; Moufid, M.; Zaim, O.; El Bari, N.; Bouchikhi, B. Voltammetric electronic tongue combined with chemometric techniques for direct identification of creatinine level in human urine. Measurement 2018, 115, 178–184. [Google Scholar] [CrossRef]
  26. Sarno, R.; Sabilla, S.I.; Wijaya, D.R. Electronic Nose for Detecting Multilevel Diabetes using Optimized Deep Neural Network. Eng. Lett. 2020, 28, 31–42. [Google Scholar]
  27. Maheswari, V.; Kumar, A.; Joshi, M.D. Evaluating the Potential Use of Electronic Tongue for Diabetic Patient. Int. J. Contemp. Res. Eng. Technol. 2020, 10, 46–49. [Google Scholar]
  28. Zaim, O.; Diouf, A.; El Bari, N.; Lagdali, N.; Benelbarhdadi, I.; Ajana, F.Z.; Llobet, E.; Bouchikhi, B. Comparative analysis of volatile organic compounds of breath and urine for distinguishing patients with liver cirrhosis from healthy controls by using electronic nose and voltammetric electronic tongue. Anal. Chim. Acta 2021, 1184, 339028. [Google Scholar] [CrossRef]
  29. He, Y.; Bai, X.; Xiao, Q.; Liu, F.; Zhou, L.; Zhang, C. Detection of adulteration in food based on nondestructive analysis techniques: A review. Crit. Rev. Food Sci. Nutr. 2021, 61, 2351–2371. [Google Scholar] [CrossRef]
  30. Saidi, T.; Zaim, O.; Moufid, M.; El Bari, N.; Ionescu, R.; Bouchikhi, B. Exhaled breath analysis using electronic nose and gas chromatography–mass spectrometry for non-invasive diagnosis of chronic kidney disease, diabetes mellitus and healthy subjects. Sens. Actuators B Chem. 2018, 257, 178–188. [Google Scholar] [CrossRef]
  31. Bougrini, M.; Tahri, K.; Haddi, Z.; El Bari, N.; Llobet, E.; Jaffrezic-Renault, N.; Bouchikhi, B. Aging time and brand determination of pasteurized milk using a multisensor e-nose combined with a voltammetric e-tongue. Mater. Sci. Eng. 2014, C 45, 348–358. [Google Scholar] [CrossRef]
  32. Ahmadou, D.; Laref, R.; Losson, E.; Siadat, M. Reduction of drift impact in gas sensor response to improve quantitative odor analysis. In Proceedings of the IEEE International Conference on Industrial Technology (ICIT), Toronto, ON, Canada, 22–25 March 2017; pp. 928–933. [Google Scholar]
  33. Zaim, O.; Saidi, T.; El Bari, N.; Bouchikhi, B. Assessment of “breath print” in patients with chronic kidney disease during dialysis by non-invasive breath screening of exhaled volatile compounds using an electronic nose. In Proceedings of the IEEE International Symposium on Olfaction and Electronic Nose (ISOEN), Fukuoka, Japan, 26–29 May 2019; pp. 1–4. [Google Scholar]
  34. Dragonieri, S.; Annema, J.T.; Schot, R.; van der Schee, M.P.; Spanevello, A.; Carratú, P.; Resta, O.; Rabe, K.F.; Sterk, P.J. An electronic nose in the discrimination of patients with non-small cell lung cancer and COPD. Lung Cancer 2009, 64, 166–170. [Google Scholar] [CrossRef] [PubMed]
  35. Divya, J.; Vijendra, S. Feature selection and classification system for chronic diseases prediction review. Egypt. Inform. J. 2018, 19, 179–189. [Google Scholar]
  36. Pechenizkiy, M.; Tsymbal, A.; Puuronen, S. PCA-based feature transformation for classification: Issues in medical diagnostics. In Proceedings of the 17th IEEE Symposium on Computer-Based Medical Systems, Bethesda, MD, USA, 25 June 2004; pp. 535–540. [Google Scholar]
  37. Bougrini, M.; Tahri, K.; Haddi, Z.; Saidi, T.; El Bari, N.; Bouchikhi, B. Detection of adulteration in argan oil by using an electronic nose and a voltammetric electronic tongue. J. Sens. 2014, 2014, 245831. [Google Scholar] [CrossRef] [Green Version]
  38. Fawcett, T. An introduction to ROC analysis. Pattern Recognit. Lett. 2006, 27, 861–874. [Google Scholar] [CrossRef]
  39. Kumar, R.; Indrayan, A. Receiver operating characteristic (ROC) curve for medical researchers. Indian Pediatr. 2011, 48, 277–287. [Google Scholar] [CrossRef]
  40. Gutiérrez, J.M.; Haddi, Z.; Amari, A.; Bouchikhi, B.; Mimendia, A.; Cetó, X.; del Valle, M. Hybrid electronic tongue based on multisensor data fusion for discrimination of beers. Sens. Actuators B Chem. 2013, 177, 989–996. [Google Scholar] [CrossRef] [Green Version]
  41. Haddi, Z.; Mabrouk, S.; Bougrini, M.; Tahri, K.; Sghaier, K.; Barhoumi, H.; El Bari, N.; Maaref, A.; Jaffrezic-Renault, N.; Bouchikhi, B. E-Nose and e-Tongue combination for improved recognition of fruit juice samples. Food Chem. 2014, 150, 246–253. [Google Scholar] [CrossRef]
  42. Zhu, W.; Mai, Z.; Qin, J.; Duan, X.; Liu, Y. Difference in 24-Hour Urine Composition between Diabetic and Non-Diabetic Adults without Nephrolithiasis. PLoS ONE 2016, 11, e0150006. [Google Scholar] [CrossRef]
  43. Cameron, M.A.; Maalouf, N.M.; Beverley, A.H.; Moe, O.W.; Sakhaee, K. Urine composition in type 2 diabetes: Predisposition to uric acid nephrolithiasis. J. Am. Soc. Nephrol. 2006, 17, 1422–1428. [Google Scholar] [CrossRef] [Green Version]
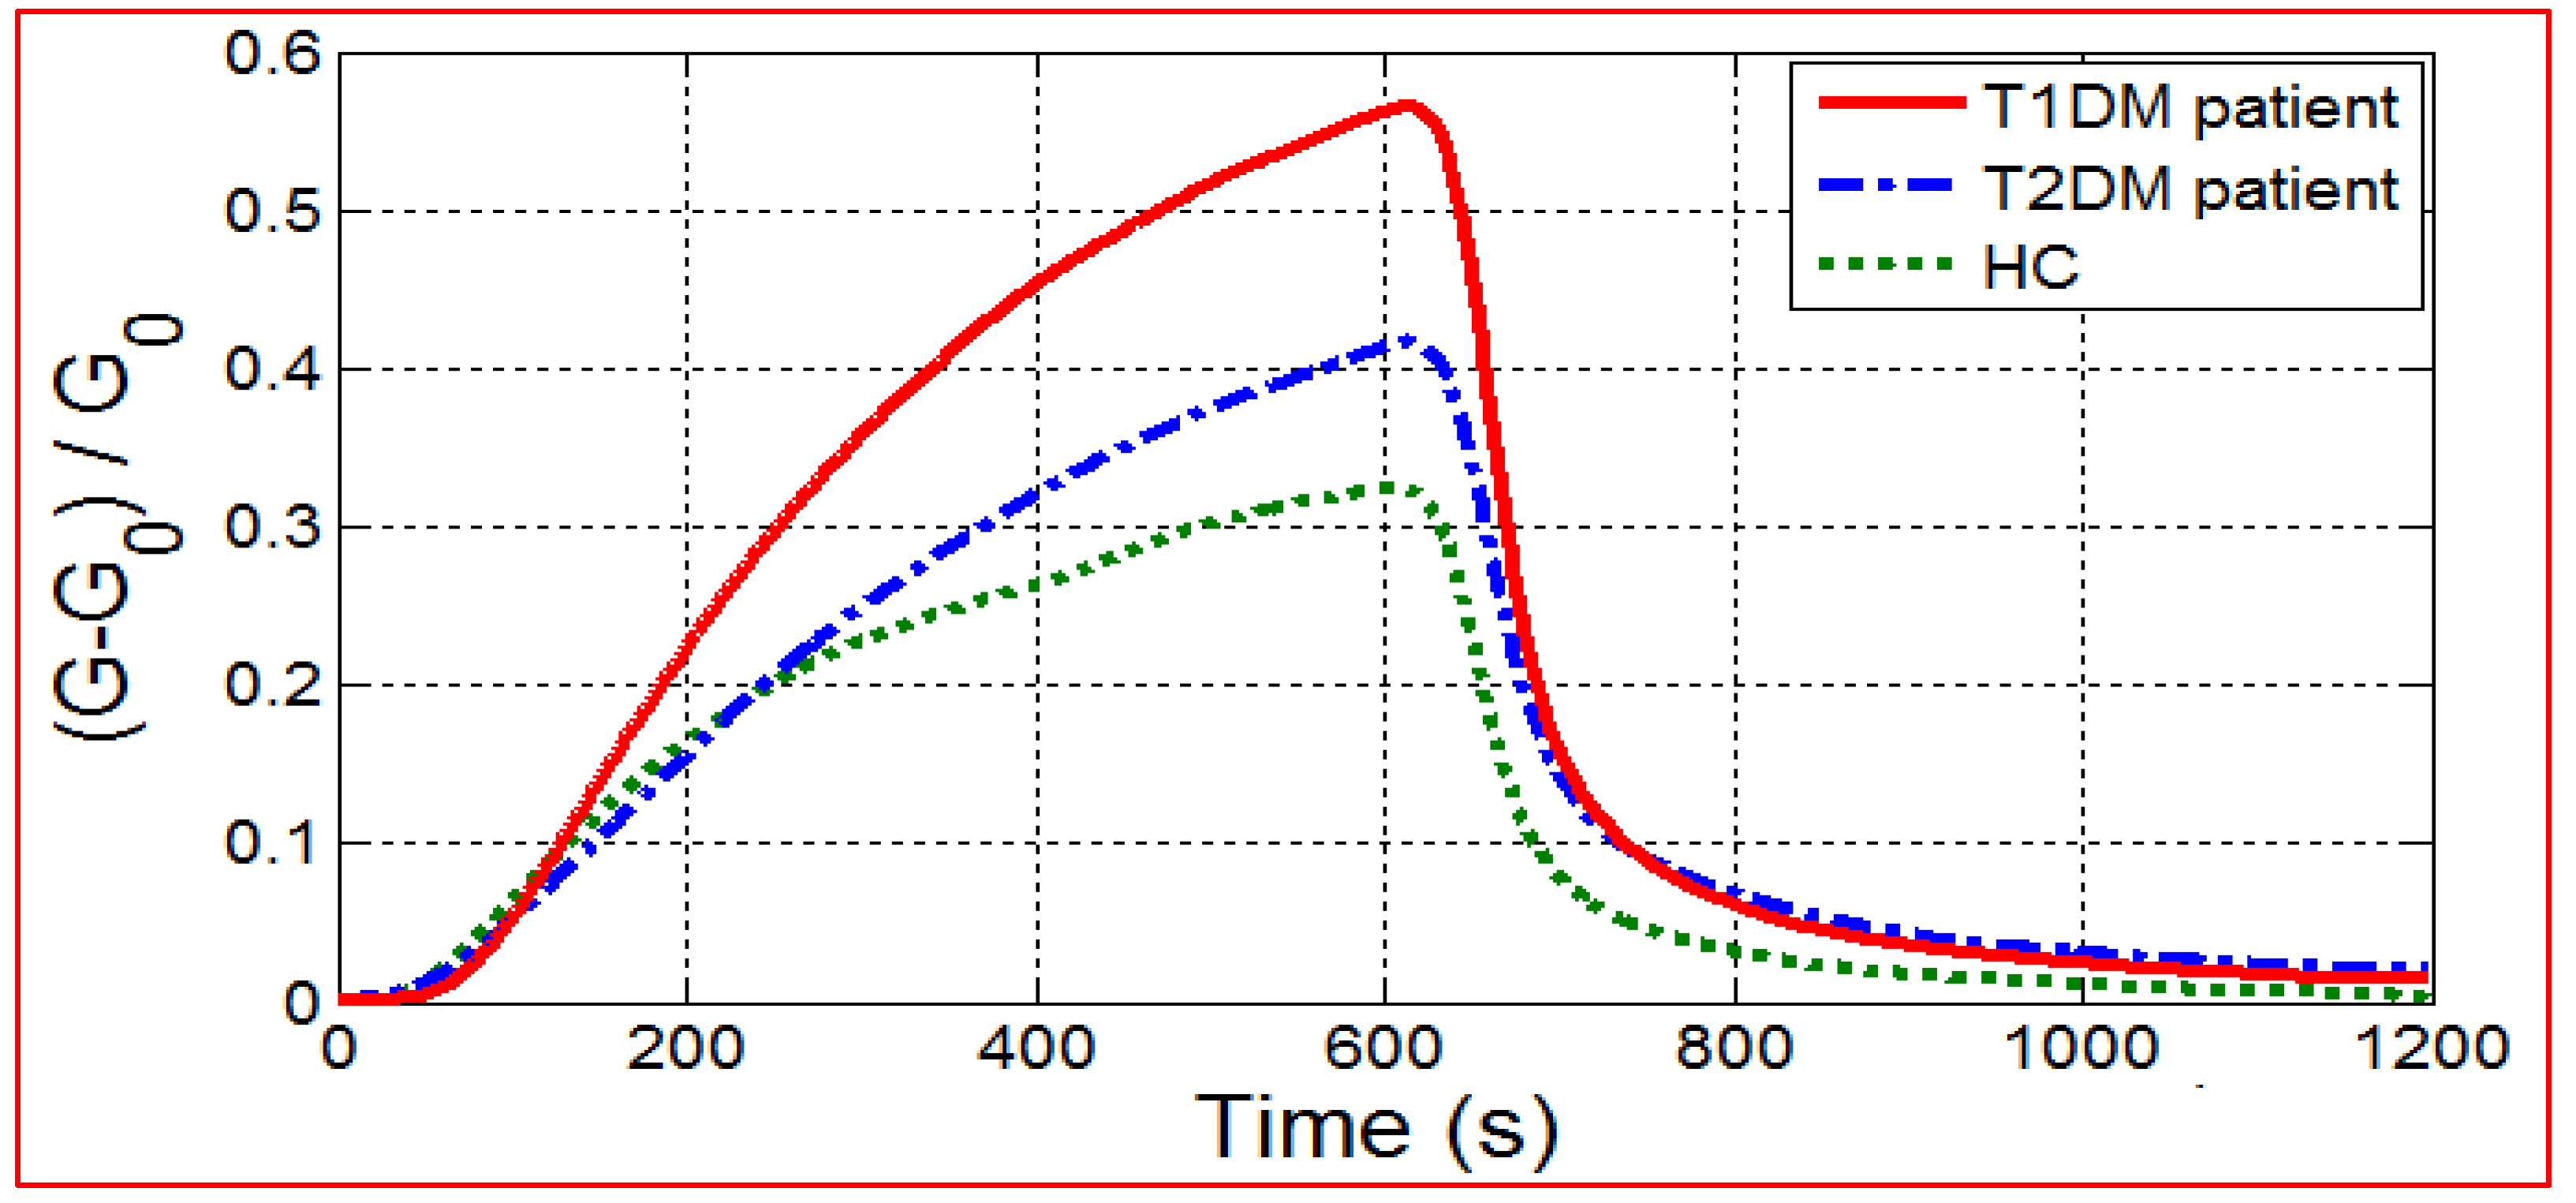
Figure 1. E-nose responses of MQ-138 gas sensor towards breath samples from T1DM, T2DM patients and HC.
Chemosensors 11 00350 g001
Figure 2. Radar plots of e-nose gas sensor responses towards exhaled breath from T1DM, T2DM patients and HC expressed by using Gs as a feature.
Chemosensors 11 00350 g002
Figure 3. Box plot distribution comparison of sensor signals among controls and patients with T1DM and T2DM expressed by AUC as variable.
Chemosensors 11 00350 g003
Figure 4. PCA plot showing data points for breath samples relating to DM patients and HCs with data collected from the e-nose system.
Chemosensors 11 00350 g004
Figure 5. Results of discrimination of breath samples gathered from healthy controls and DM patients by using: (a) DFA plot, and (b) receiver operator characteristics (ROC) curves expressed by (ROC AUC = 0.920) as variable.
Chemosensors 11 00350 g005
Figure 6. Results of discrimination of for breath samples gathered from T1DM and T2DM patients by using: (a) DFA plot, and (b) Receiver operator characteristics (ROC) curves expressed by (ROC AUC = 0.759) as variable.
Chemosensors 11 00350 g006
Figure 7. Evolution of the sensor responses and the measured temperature inside the sensor chamber as a function of time before introduction of exhaled breath samples.
Chemosensors 11 00350 g007
Figure 8. VE-tongue responses of Cu electrode towards urine samples of patients with T1DM, T2DM patients, and HC.
Chemosensors 11 00350 g008
Figure 9. Radar plots of the responses of the VE-tongue electrode array exposed to urine samples of patients with T1DM, T2DM, and HC expressed by area as a feature.
Chemosensors 11 00350 g009
Figure 10. Box plots of urine samples distribution corresponding to T1DM, T2DM patients, and HC by using Cu electrode.
Chemosensors 11 00350 g010
Figure 11. PCA plot showing data points for urine samples relating to DM patients and HC with data collected from the VE-tongue system.
Chemosensors 11 00350 g011
Figure 12. Results of discrimination of urine samples collected from DM patients and HC with data collected from the VE-tongue system by using: (a) DFA plot, and (b) Receiver operator characteristics (ROC) curves expressed by (ROC AUC = 0.980) as variable.
Chemosensors 11 00350 g012
Figure 13. Results of discrimination of urine samples collected from T1DM and T2DM patients by using: (a) DFA plot, and (b) receiver operator characteristics (ROC) curves expressed by (ROC AUC = 0.710) as variable.
Chemosensors 11 00350 g013
Figure 14. Results of discrimination of exhaled breath and urine samples relating to T1DM and T2DM patients displaying data fusion of e-nose and VE-tongue systems by using: (a) DFA plot, and (b) ROC curves (ROC AUC = 0.804).
Chemosensors 11 00350 g014
Table 1. Table of general characteristics of all subjects studied.
Volunteers
GroupsNumberAge Range (Years)
Age ± SD *
Male, Number (%)Smoking Habit +
Type 1 diabetes
(T1DM)
1432–67
48 ± 8
6 (42%)14 NS
Type 2 diabetes
(T2DM)
1834–75
59 ± 9
2 (11%)18 NS
Healthy controls (HC)2825–64
40 ± 13
18 (64%)
4 S, 24 NS
* SD: standard deviation; Smoking Habit +: S: smoker, NS: non-smoker.
Table 2. SVM results of 180 breath samples regarding their health states by using the e-nose system.
ActualPredicted
DM PatientsHC
DM patients960
HC183
Table 3. SVM results of 96 breath samples corresponding to T1DM and T2DM by using the e-nose system with a success rate of 82.26%.
ActualPredicted
T1DM T2DM
T1DM339
T2DM846
Table 4. SVM results of 360 urine samples regarding their health states by using the VE-tongue system with a success rate of 99.16%.
ActualPredicted
DM PatientsHC
DM patients1893
HC0168
Table 5. SVM results of 192 urine samples corresponding to T1DM and T2DM by using the VE-tongue system with a success rate of 76.04%.
ActualPredicted
T1DM T2DM
T1DM6420
T2DM2682
Table 6. SVM results of data fusion of the e-nose and VE-tongue systems with a success rate of 93.75%.
ActualPredicted
T1DM T2DM
T1DM411
T2DM549
Disclaimer/Publisher’s Note: The statements, opinions and data contained in all publications are solely those of the individual author(s) and contributor(s) and not of MDPI and/or the editor(s). MDPI and/or the editor(s) disclaim responsibility for any injury to people or property resulting from any ideas, methods, instructions or products referred to in the content.