Article

Multitask Deep Learning-Based Pipeline for Gas Leakage Detection via E-Nose and Thermal Imaging Multimodal Fusion

Department of Electronics and Communications Engineering, College of Engineering and Technology, Arab Academy for Science, Technology and Maritime Transport, 1029 Alexandria, Egypt
Chemosensors 2023, 11(7), 364; https://doi.org/10.3390/chemosensors11070364
Submission received: 25 May 2023 / Revised: 25 June 2023 / Accepted: 27 June 2023 / Published: 28 June 2023
(This article belongs to the Collection Women Special Issue in Chemosensors and Analytical Chemistry)

Abstract

:
Innovative engineering solutions that are efficient, quick, and simple to use are crucial given the rapid industrialization and technology breakthroughs in Industry 5.0. One of the areas receiving attention is the rise in gas leakage accidents at coal mines, chemical companies, and home appliances. To prevent harm to both the environment and human lives, rapid and automated detection and identification of the gas type is necessary. Most of the previous studies used a single mode of data to perform the detection process. However, instead of using a single source/mode, multimodal sensor fusion offers more accurate results. Furthermore, the majority used individual feature extraction approaches that extract either spatial or temporal information. This paper proposes a deep learning-based (DL) pipeline to combine multimodal data acquired via infrared (IR) thermal imaging and an array of seven metal oxide semiconductor (MOX) sensors forming an electronic nose (E-nose). The proposed pipeline is based on three convolutional neural networks (CNNs) models for feature extraction and bidirectional long-short memory (Bi-LSTM) for gas detection. Two multimodal data fusion approaches are used, including intermediate and multitask fusion. Discrete wavelet transform (DWT) is utilized in the intermediate fusion to combine the spatial features extracted from each CNN, providing spectral–temporal representation. In contrast, in multitask fusion, the discrete cosine transform (DCT) is used to merge all of the features obtained from the three CNNs trained with the multimodal data. The results show that the proposed fusion approach has boosted the gas detection performance reaching an accuracy of 98.47% and 99.25% for intermediate and multitask fusion, respectively. These results indicate that multitask fusion is superior to intermediate fusion. Therefore, the proposed system is capable of detecting gas leakage accurately and could be used in industrial applications.

1. Introduction

Technological breakthroughs are assisting humanity in resolving economic and social issues. Several issues in the manufacturing sector are being solved by technological advances, but there are still risks that could harm the surrounding environment. A frequent concern in several industries is the leakage of gases. The impacts of industrial disasters brought on by gas leakage, include explosions, burns, accidents, leakage, and waste discharges [1]. An unintended break, crack, or porous area in a joint or piece of equipment that rejects other fluids and gases while allowing a closed medium to escape is called a gas leak. Other sources of such leakages that occur in our daily lives involve careless waste disposal and residential cooking, which produce unneeded emissions. Certain dangerous gases, such as flammable and toxic gases, if utilized carelessly, may cause incidents. Industrial accidents have the potential to seriously harm the local population, the environment, and the connected, intelligent ecosystem [2]. Fire and smoke leaks necessitate the rapid evacuation of people with mobility disabilities since smoke emissions during leakages cause vision difficulties that are difficult to see clearly. If these harmful vapours are not carefully controlled, breathing them in can cause fainting, unconsciousness, and perhaps a major catastrophe. Since gas leaks are dangerous, human intervention is not an option. Instead, machines must act quickly, accurately, and robustly to assist humans. Therefore, identifying gas leakages within a short period is of the highest importance.
While an instrument is installed in any plant or industrial setting, a quality control procedure called a gas leak test should be completed. The manual examination of gas pipelines and vessels is a typical step in the gas leakage detection process. These strategies cost a lot of money, time, and effort but are ineffective. As pipeline length and plant structure complexity rise, these manual procedures lose effectiveness [3]. Additionally, some of the earlier methods for detecting gases, such as colorimetric tape and gas chromatography, had limitations in that they needed costly supplies and skilled workers to employ [4].
On the other hand, metal oxide semiconductor (MOX) sensors have been recently utilized for detecting gases thanks to the development of electronic sensors, producing an array of various sensors called the “Electronic Nose” (E-Nose). The three components of an E-nose are typically a gas sensor array, a signal processing block, and a pattern recognition system. The gas sensor array detects gas and converts it to an electrical signal. E-nose improved detection precision and overcame human intervention’s constraints. Due to the rapid advancement of artificial intelligence (AI) approaches, they have been employed in a number of industries, including healthcare, medicine [5,6,7,8], education [9,10,11] finance [12], navigation [13], renewable energy [14], agriculture [15] Refs. [16,17,18]. Motivated by the promising results achieved in these fields, various AI methods have been adopted to detect gases using the E-nose. The right choice of suitable feature extraction and AI methodology, including machine/deep learning (DL) methods, results in an effective E-nose. Furthermore, thermal imaging has also been recently used as a means of gas detection. In contrast to normal conditions, the temperature of the immediate area rises when a gas leak occurs. Thermal imaging cameras can identify and evaluate the temperature increase. Utilizing this principle, gas leaks can be detected [19].
Numerous studies have investigated the use of machine/DL methods along with E-noses for gas detection solely [3,20,21,22,23,24]. However, detection systems based on only gas sensors have some limitations. They are unable to distinguish between gases when there is less gas in the air, which can lead to false positives or false negatives. Due to their reduced sensitivity, some common sensors are unable to detect some gases, which affects the measurement’s overall accuracy and resilience. Furthermore, in a mixed gas environment, the sensors are unable to detect gas accurately. Additionally, they are vulnerable to and constrained by their functioning parameters [25]. Less work has employed machine/DL methods and thermal infrared cameras alone for detecting and identifying gases [26,27,28]. Nevertheless, using thermal imaging for gas detection has drawbacks, such as decreased precision and accuracy. Thermal imaging may have more false positives because it relies on temperature detection. Noise and distorted images can potentially weaken the robustness of vision-based systems [29]. Higher resolution thermal cameras are expensive, and such systems are often not practical from an economic standpoint. Single modality sensing techniques may fall short of the system’s needed accuracy and resilience since they are only capable of detecting certain sensor features. The temporal and spatial properties of a single sensor are one of its limitations [20]. While a system based on thermal imaging can detect gas existence, it cannot distinguish the type of gas. Consequently, the idea of multimodal/multisensor data fusion was developed. To achieve better results than any single modality utilized alone, data fusion integrates information from numerous sources. However, very few studies [30], ref. [25] have considered combining both E-nose and thermal cameras for detecting and identifying gases.
The detection process in the earlier methods that utilized thermal infrared cameras or gas detectors was handled by a single DL model. However, using multiple DL structures and integrating the attributes that these models generate may boost detection accuracy [31]. These models also only used the spatial features that could be extracted from the input thermal images or temporal information of gas measurements. However, combining spatial, spectral, and temporal features can enhance detecting performance [32]. Additionally, lowering these attribute sizes can enhance the accuracy of recognition even more. Furthermore, studies that employed multimodal data from both E-nose and thermal cameras used a single convolutional neural network (CNN) structure for thermal images. Nevertheless, employing CNNs of different constructions merge the benefits of all these architectures, leading to an enhancement in the detection accuracy. Moreover, such studies employed the gas measurements directly as inputs to the long-short-term memory (LSTM) DL model making use of only temporal information. Nonetheless, converting these numerical measurements to heatmap images and feeding them to a CNN may benefit from spatial and temporal information, thus improving the performance of detection. In addition, previous multi-modal-based methods relied only on obtaining features from a single domain, however, attaining features from multiple domains could probably improve recognition performance.
In this paper, an affordable option based on the fusion of multiple DL models is proposed for gas leakage detection and identification. The proposed model combines the data from the gas sensors of an E-nose after converting it to heatmap images along with the images taken by low-cost thermal cameras using AI-based multimodal fusion. The DL-based pipeline for gas leakage detection and identification consists of multiple DL models of different architectures, which is not the common scenario in previous studies that rely on a single DL model. The proposed model integrates features from several domains, not only one domain, like existing models for gas leakage detection. Several CNN models are utilized to extract spatial features from multimodal data. Furthermore, the LSTM DL model is used to obtain temporal information from multimodal data and perform the detection and identification tasks. The presented model investigates the impact of numerous fusion methodologies based on transformation approaches that represent data in multiple domains, which is not the case in current models for gas leakage detection. First, for gas leakage detection and identification, two fusion methodologies for CNN and LSTM are introduced and studied. The first is intermediate fusion, while the other is multitask fusion. In the intermediate fusion procedure, discrete wavelet transform (DWT) is used to merge features recovered from each CNN trained with each data modality in order to decrease the dimension of the features and obtain spectral–temporal information instead of relying only on spatial, spectral, or temporal representation like previous studies. Additionally, throughout the multitask fusion, the discrete cosine transform (DCT) approach is used to combine features extracted from all CNNs trained on multimodal input and reduce the dimension of the features and attain spectral information.

2. Previous Works

The classical methods for gas detection using e-nose relied on traditional data analysis techniques such as principal component analysis (PCA) [33], multiple discriminant analysis [34], cluster analysis [35], computational fluid dynamics (CFD) [36], cyclic voltammetry (CV) curve [37], and least squares development algorithm [38]. Furthermore, machine learning techniques (and early AI methods) were used on electronic noses for over 30 years along with pattern recognition methods. There has been a lot of research published on using such techniques to identify gases and detect gas leaks [39,40,41,42,43,44]. For example, using a variety of multivariate analysis approaches and principal component analysis (PCA), the study’s authors [45] developed an E-nose relying on several sensors that could detect and identify three explosives. Furthermore, using both simulated and actual data, an artificial neural network (ANN) was utilized along with an E-nose to detect gas leaks at a testing location [46]. However, as is sometimes the case with machine learning, this model was heavily reliant on sensor data, and interference from unforeseen winds caused the model to significantly exaggerate the leak rates. In a different study that examined the use of ANN and E-nose in pipe gas leak detection, leakages and their locations were detected [47]. However, the detection accuracy of the system was dependent on the pressured flow and was largely reliant on the network setup. In another study [20], a hybrid approach was proposed based on the fusion of feature selection approaches and multiple classifiers to identify gases and their concentration levels, achieving gas type recognition and concentration levels of 99.73% and 97.54%, respectively. An E-Nose based on six MOX sensors was created by Zhang et al. [48] to detect flammable and hazardous gases. The authors extracted time information as well as frequency features. These features are fed into a classifier using a support vector machine (SVM). An E-Nose based on three MOX sensors was suggested by Manjula et al. [23] to recognize gases that are present in the air. The authors used time signals as features to feed five machine learning classifiers, where the Random Forest (RF) classifier achieved the highest accuracy of 97.7%. Similarly, in order to identify gases in the atmosphere, Ragila et al. [49] used 6 MOX sensors. The accuracy achieved by the ANN, which used time signals as input, was 93.33%. Despite the high accuracy achieved using the previous studies, the authors did not consider the interference of a mixture of gases. They are also dependent on conventional machine learning approaches. However, DL approaches are superior as they do not require preprocessing techniques.
In [50], the concentration of gases is determined using an array of eight different gas sensors. Convolutional neural networks (CNNs) are used in this work to perform gas classification. While in [51], a framework was proposed for gas leakage detection from pipelines. In this study, the authors used several DL models, including CNN, LSTM, and autoencoders, to perform the detection process, attaining an accuracy of 92%. Similarly, to detect gas leakage, Pan et al. [52] adopted a DL method with a hybrid framework made of CNN and LSTM. Likewise, [3] employed CNN and LSTM to obtain spatial–temporal information to detect gas leakage using limited simulated data. It has been demonstrated that DL systems can more accurately classify data by learning features from gas sensor values. A hybrid Deep Belief Network and stacked autoencoders-based fast gas identification technique was presented in [53]. Following that, these attributes are used to build the Softmax classifiers. All of the previous directly relied on data from gas sensors using sequential procedures. However, as mentioned earlier, there are some problems with relying solely on a detection and identification technique based on gas sensors.
Thermal imaging has also been used as a means of gas leakage detection [26,54]. However, few studies have employed it to achieve this purpose. Among them, in [27], machine learning models have been applied to infrared (IR) thermal images for gas detection. The identification of gas leaks in rural areas using thermal surveillance cameras is proposed in [28] as tensor-based leakage detection (TBLD). Various classification methods are investigated in the stage of leakage classification. A residual network containing 50 layers was applied to accurately identify gas leakage (ResNet50). Likewise, an IR thermal imaging system is created in the study [55] for the monitoring and detection of flammable gas leakages. Several machine learning algorithms for imaging processing and gas leakage detection were utilized.
Despite the promising results achieved using the earlier methods, using solely gas sensors or thermal imaging has limits that make it less accurate and precise, as explained in the previous section. Gas sensors and thermal images, however, provide more details about the gas being studied [56] and increase accuracy using fusion [57]. Nevertheless, a limited number of studies have considered the multimodal fusion of thermal images and the multiple gas sensors of the E-nose. According to Narkhede et al. [25], the accuracy attained using the multimodal fusion of thermal pictures and gas sensor data was 96% as opposed to the accuracy of the separate modalities of gas sensor data and thermal images, which were each 93% and 82%, respectively. Likewise, the study [30] employed multimodal fusion of thermal imaging and sensor data for detecting gas leakages. The authors of such a study compared multitask and intermediate fusion methods. The results indicated that, as opposed to intermediate fusion, multitask fusion is more reliable and accurate. Due to the fusion model’s incorporation of data from both modalities, its accuracy is superior to that of separate models. Additionally, compared to the individual models, false positives and false negatives are far reduced. Thus, in this study, a DL-based multimodal fusion pipeline is introduced. The proposed pipeline employs two fusion methods, including intermediate fusion and multitask fusion, to detect gas leakage and identify different gases. In contrast to previous multimodal data fusion methods for gas detection, the proposed pipeline uses three CNNs with different architectures to benefit from the advantage of each model. Furthermore, instead of depending only on spatial or temporal information to construct the classification model, it combines multimodal features extracted from each CNN trained with each data modality using DWT to obtain spectral–temporal representation as well as a spatial demonstration. DWT is also used to diminish the dimension of features after intermediate fusion. Finally, it utilizes the bidirectional LSTM (Bi-LSTM) DL model to perform the classification process, which usually performs better than the classical LSTM model [58]. Finally, it employs DCT to further reduce the dimension of the features used to build the classification model after multitask fusion which consequently lowers the training complexity and time.

3. Materials and Methods

3.1. Fusion Methods of Multimodal Data

According to the multimodal machine learning paradigm, multimodal fusion techniques can be model-based or model-agnostic [59]. For multimodal applications, model-agnostic fusion approaches are more prevalent; two or more modalities are used in this fusion to fulfill the following tasks. Thus, model-independent fusion for gas detection using data from thermal imaging and sensors is considered here. The three types of model-agnostic fusion are early, late, and intermediate fusion [60]. These techniques have been widely used with machine learning and DL models [61,62,63]. In the earlier approach of fusion, actual data or information from the early stages of data processing are concatenated, as seen in Figure 1a. Early fusion aids in capturing and processing interactions between modalities at the data level [31]. However, it is frequently not viable to combine diverse data, such as 2-D photos, with 1-D tabulated or time-series data.
On the other hand, in late fusion, as depicted in Figure 1b, predictions from individual modalities are made using statistical techniques like mode, mean, median, majority voting, etc. Due to the fact that it combines decisions, it is sometimes referred to as decision-level fusion. When there is a temporal link between the modalities, this method is favored. The late fusion can combine any form of data, but it just combines the model outputs; it does not mix data or features. As seen in Figure 1c, intermediate fusion fuses features obtained from different modalities and distinct feature extraction methods. The intermediate fusion type combines data representation at more abstract levels, enabling data from diverse sources [64]. Combining features from several models usually improves performance [65].
Multitask-like fusion is a model-based fusion that adheres to the multitask learning concept, where models are simultaneously trained on a variety of tasks, as seen in Figure 1d. Because it utilizes shared representation across several tasks, multitask learning offers improved efficiency and accuracy. In multimodal multitask models, representations are shared not only among tasks but also between modalities, improving generalization. In multitask fusion, several classifiers are used, including several that can categorize fused data from gas sensors as well as data from thermal cameras. Two classifiers can be thought of as two different tasks, even though they are both performing the same task—identifying gas—which explains why this approach is referred to as multitask fusion [66].

3.2. Deep Learning Models

The convolutional neural network (CNN) is a subset of DL techniques that are frequently utilized to solve classification issues with images and have recently been used in gas detection applications [50]. The structure of the CNN is based on perceptron models. In contrast to the traditional ANN, these networks automatically extract information from the image, and as a result, they have lately gained attention as a hot research area. The primary benefit of CNNs is that they may perform classification directly from images without the need for extra processes used in conventional machine learning techniques (such as preprocessing, segmentation, and feature extraction) [67]. Convolutional, pooling, and fully connected (FC) layers are the three primary layers of a CNN. Parts of the image are convolved with a small-size filter in the earlier layers. The spatial information of the original input image is then used to create a feature map. These feature maps have a high dimension; consequently, the main goal of the pooling layers is to compress this enormous dimension. The FC layers then compile the input from the preceding layers and generate class scores [68]. This study employs three CNNs of distinct architectures involving ResNet-50 [69], Inception [70], and MobileNet [71].
Another DL approach is the recurrent neural network (RNN) which is commonly used for sequential or time series data. To understand the stream of errors in RNN, Hochreiter and Schmidhuber [72] developed the Long Short-Term Memory (LSTM) DL architecture [73]. An input gate, forget gate and output gate makes up the LSTM architecture. The long-range temporal dependency is recognized by these gates. The basic idea behind the bidirectional LSTM (Bi-LSTM) is to introduce two different LSTMs, both of which are connected to the same output layer, throughout every training cycle.

3.3. Multimodal Dataset for Gas Leakage Detection

This study makes use of the multimodal gas detection dataset in [74], which represents multimodal data produced by modern smart applications. To identify the different types of gases and determine their concentrations, A system with a thermal camera and gas sensors is used to collect the gas measurements. The unit used to acquire the dataset employed in this article can be found in [74]. A thermal camera is a tool that uses IR light to measure temperature fluctuations. The image sensor of a camera acts as an IR temperature sensor, and each pixel monitors the temperature of every spot simultaneously. The photos are produced using a temperature-based format and are displayed as RGB. Thermal cameras are not restricted to dark areas and can work in any environment, independent of their shape or texture, unlike traditional picture cameras [75]. With 206 × 156 thermal Sensors, a 36-degree field of view, a measuring range of 40 °C to 330 °C, a sampling frequency of less than 9 Hz, and 32,136 thermal Pixels, the Seek compact thermographic camera model UW-AAA that can be attached to several Android mobiles was utilized in this study makes it simple to examine a thermal image.
Seven MOX sensors including MQ2, MQ135, MQ3, MQ8 MQ5, MQ7, and MQ6 are utilized to gather gas measurements. Such sensors are responsive to a number of gases, including carbon monoxide, methane, butane, LPG, alcohol, smoke, air quality, and others. Gas sensors work by turning chemical data into electrical data to detect the presence of gas. MOX gas sensors are suitable because of their small size, quick response time, and prolonged lifetime [76,77]. Each sensor’s heating element produces an analogue output voltage that reflects the concentration of gas. Various sensor properties, such as sensitivity, selectivity, detection limit, reaction time, etc., affect the gas sensor’s performance. The paper [74] contains information about the gas sensors utilized and their sensitivity to different gases. The gas sensing devices were separated from one another by 1 mm throughout the data collection procedure. A pair of apparent gas sources were anticipated during the dataset collection process and taken into consideration, including smoke and fragrance. Among these sources, the first gas was produced when a fragrance spray was sprayed, whereas the other gas was produced when incense flames were lit. Carbon Monoxide, Nitrogen Dioxide, Carbon Dioxide, and Sulfur Dioxide, along with other gases in trace amounts, make up the majority of smoke. Besides, a gas combination was generated by mixing the two gases previously mentioned simultaneously. Moreover, to guarantee that we obtain a consistent output for fresh air, the gas sensors were calibrated by warming up for an hour before releasing the gas to be detected (No Gas). These form four classes of gases that will be detected and identified in this study.
The gas sensors and the thermal camera are used in conjunction to collect data on the existence of a gas that must be detected for the creation of a multimodal dataset. The readings were continually taken at regular intervals of two seconds for a period of ninety minutes. To ensure variation in concentration and discharge timings, the gas to be detected was released at intervals of 15 s for the first 30 min, 30 s for the following 30, and 45 s for the final 30 min. The sensor was brought to a steady state (no gas) after each discharge, and its output was used to confirm that it was calibrated. Each gas experiment lasts for a total of 1.5 h. The output of gas sensors is numerical numbers, and thermal images have a resolution of 32 × 32. The heat patterns of the gases may differ depending on how they are released during the data collection. Therefore, gases were distributed consistently in the same way to prevent disagreements while preserving homogeneity. Additionally, the right precautions have been considered to distribute the gas evenly at all times. Samples of the thermal images and matching gas sensor data for each class are displayed in Table 1. The numbers given in Table 1 indicate the measurements in volts that were obtained employing the gas detectors that were used. These digits were determined via a 10-bit analogue to digital converter and represented digital corresponding of the analogue outputs from sensors that detect gases. A total of 6400 samples were gathered, with 1600 samples from each of the four classes of perfume, smoke, perfume, and smoke mixed together, and a neutral environment (No gas) included in the dataset.

3.4. Proposed Pipeline for Gas Leakage Detection

This study proposed a DL-based pipeline for gas detection from a multimodal dataset based on thermal images and E-nose. The proposed pipeline consists of four stages involving preprocessing of the multimodal data, CNN models retraining and feature extraction, multimodal data fusion, detection, and identification. Initially, gas sensor measurements are converted to heatmaps images, and then these images, along with thermal images, are preprocessed to fit the size of the input layers of each CNN. These images are then augmented to boost the total sum of images used to feed the CNNs. Next, three pre-trained CNNs involving ResNet-50, Inception, and MobileNet are implemented and trained using each data modality separately after being preprocessed in the CNN models retraining and feature extraction stage. Spatial features are also extracted from each of the three CNNs trained either with thermal images or heatmap images of the gas measurements in this stage. Afterward, two multimodal data fusion methods are presented and applied to these features, including intermediate and multitask fusion. In the intermediate fusion, the discrete wavelet transform (DWT) is employed to fuse features obtained from each modality solely (either thermal images or heatmap images of gas measurements) and reduce their size as well as obtaining spatial–spectral–temporal information instead of relying on spatial data alone. While in multitask fusion, the discrete cosine transform (DCT) method is used to merge features of the CNNs trained with both infrared thermal images and heatmap images of gas measurements. DCT is also employed to diminish the huge feature space size resulting from the multitask fusion. Finally, in the last stage, a Bi-LSTM is constructed to perform the detection and identification processes through different scenarios. Figure 2 shows the steps of the proposed pipeline.

3.4.1. Preprocessing of Multimodal Data

Initially, gas sensor measurements of the seven MOX sensors are converted to heatmaps images. This means that each of the numerical gas measurements acquired during regular intervals of 2 s is converted to heatmaps RGB images, where each numerical value is mapped to a color intensity value of the RGB scale. After mapping the measurements, a colormap pattern (heatmap) is generated, forming an RGB image that is then saved in a jpg extension. Afterward, these images, as well as IR thermal images, are resized to correspond to the size of the input layers of the three CNNs. For ResNet-50 and MobileNet, the dimension of the images after resizing is 224 × 224 × 3, while for the Inception CNN, it is equal to 229 × 229 × 3. Next, the data is split into 70–30% for training and testing. In order to improve the training performance of the CNNs, the augmentation process is essential. Augmentation is a procedure made to enlarge the number of images available in the training data, which consequently enhances training performance and avoids overfitting. Thus, several augmentation approaches are utilized for the training data, including shearing (0, 45) in x and y directions, translation (−30, 30), flipping in x and y directions, and scaling (0.9, 1.1).

3.4.2. CNN Models Re-Training and Feature Extraction

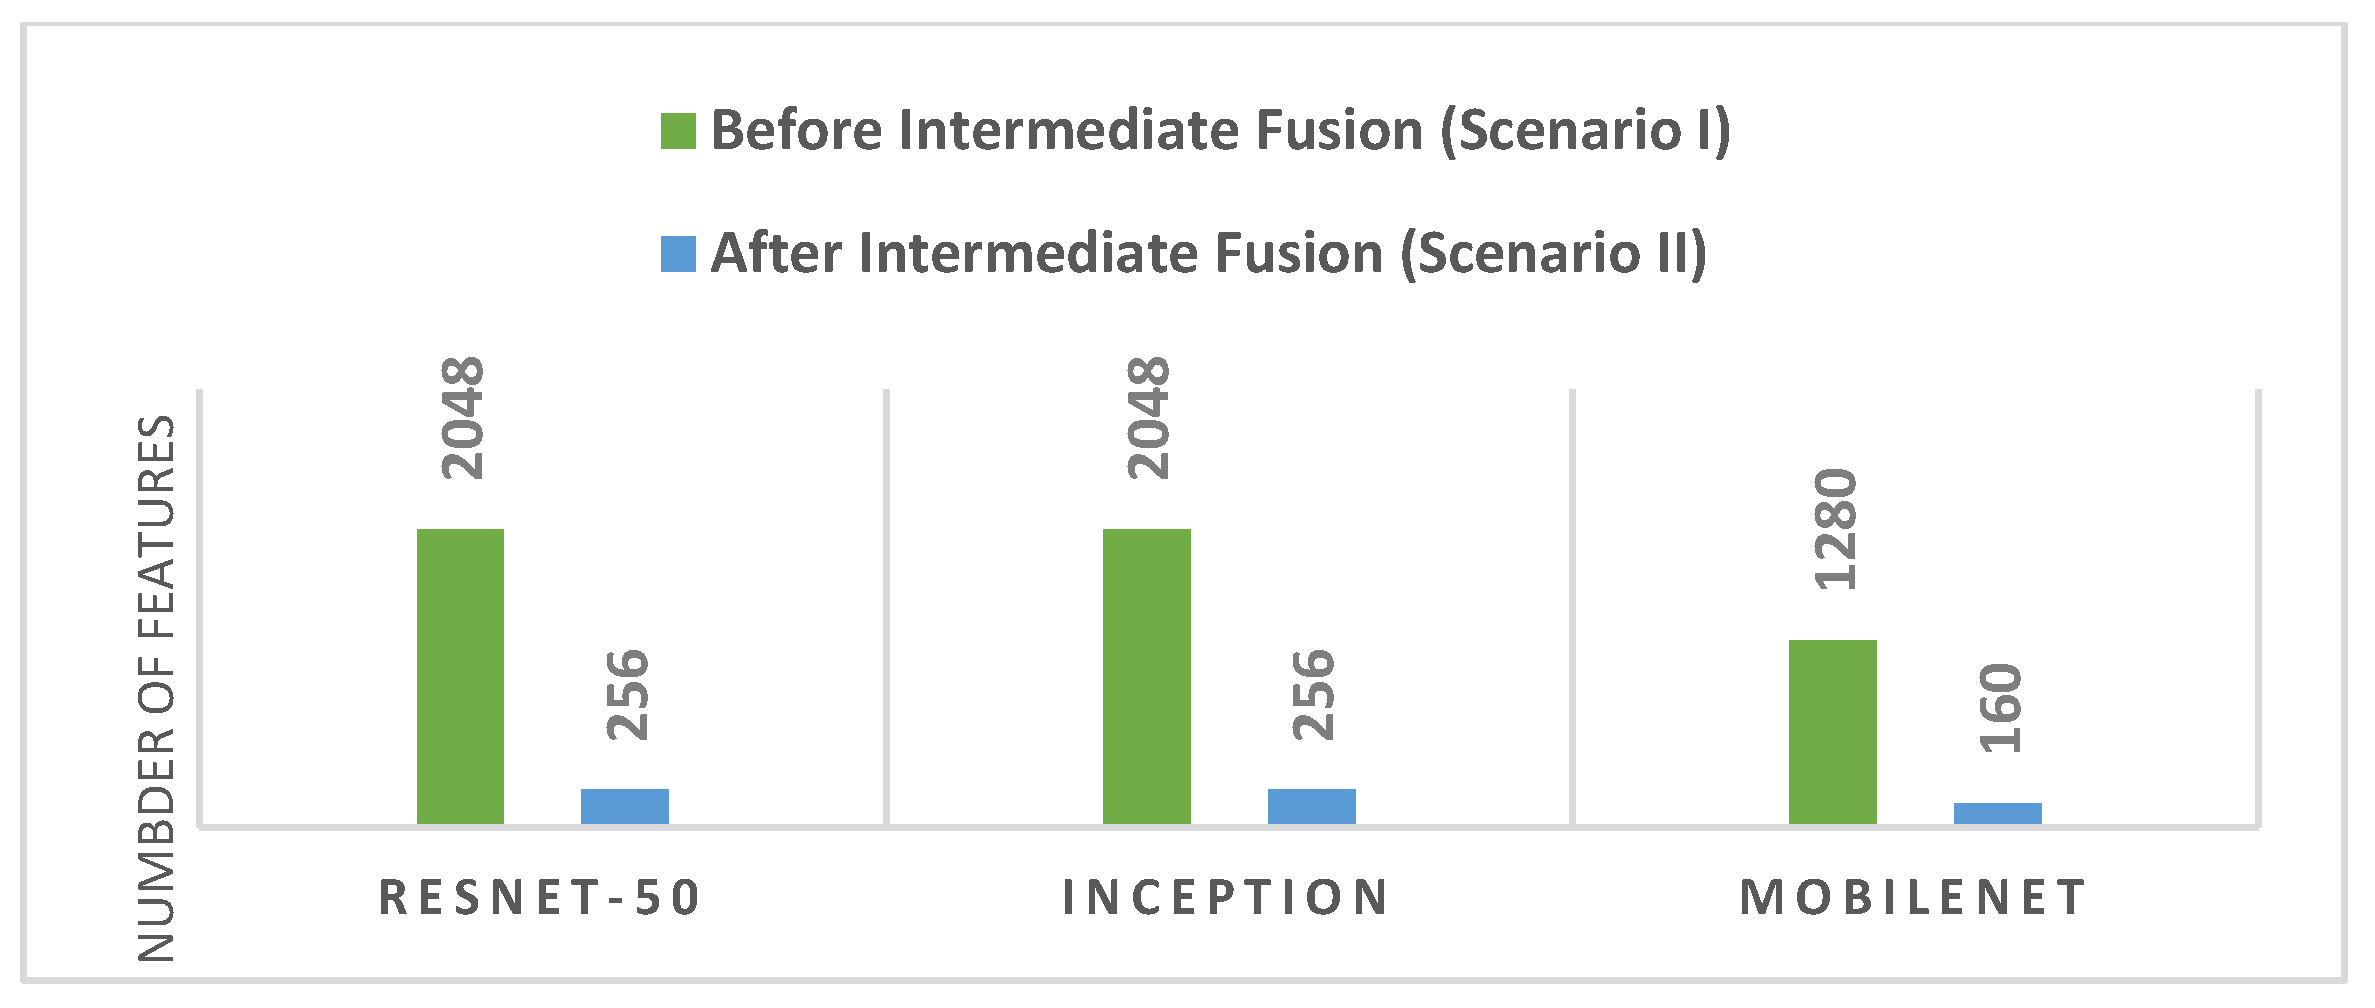
Transfer learning [78] (TL) is used in conjunction with three deep pre-trained CNNs. A pre-trained CNN is the one that was trained using TL. TL is the ability to find similarities among disparate data or information to speed up the learning process of a different classification problem with related features. This indicates that the pre-trained CNN can comprehend representations from big datasets like ImageNet and subsequently use these examples in different domains with the same classification challenge. It is frequently utilized because it might be difficult to locate large-scale datasets that are typically identified as ImageNet datasets. First, TL is used to change the CNN’s output layer to 4. (Equal to how many classes there are in the multimodal dataset). Following that, several CNNs’ settings are modified; these will be discussed later. Then, preprocessed data of each modality are used to retrain these CNNs. After the CNNs have completed their retraining process, TL is once more employed to extract spatial deep features from the final average pooling layer of each CNN. ResNet-50, Inception, and MobileNet deep features have lengths of 2048, 2048, and 1280, respectively.

3.4.3. Multimodal Data Fusion

In this stage, two fusion algorithms are applied, including intermediate and multitask fusion. In the former methodology, spatial deep features extracted from each CNN trained with each data modality are fused using DWT. By breaking down the data using a variety of perpendicular basis functions, DWT provides a spectral–temporal representation of the data. Each of the transforms that make up DWT belongs to a unique class of wavelet basis functions. A 1-D DWT is used to analyze 1-D data, convoluting the input data with low-pass and high-pass filters. The next step in DWT analysis is the dyadic decimation process, a down-sampling technique typically used to lessen aliasing distortion. After applying the 1-D DWT to the 1-D input data, two clusters of coefficients—the approximation coefficients CA1 and the detail coefficients CD1—are generated. To reach the second level of decomposition, this process can be repeated for the approximation coefficients CA1, and once more, two sets of coefficients will be produced: the second-level approximation coefficients CA2 and detail coefficients CD2. This procedure can be continued to create DWT with multiple decomposition levels. Spatial deep features extracted from each CNN trained with each data modality are concatenated, and then four levels of DWT are applied to these concatenated features in this step. The wavelet basis function used is the “Haar” wavelet. DWT can also be used as a feature reduction as at each decomposition level, the size of input data is reduced by a factor of 2, thus in this study, the details coefficients of the fourth DWT level (CD4) are used as input features to train the Bi-LSTM to detect and identify gases in the next stage of the proposed pipeline. The dimension of these reduced features is 256 for both ResNet-50 and Inception and 160 for MobileNet.
On the other hand, in the multitask fusion, all CD4 features extracted from the three CNNs trained with each multimodal data are fused using DCT. DCT is frequently used to break down data into basic frequency components. It displays information as a sum of cosine functions that fluctuate at various frequencies. Typically, the DCT is used to transform the data into DCT coefficients, which are divided into two categories; low frequencies are known as (DC coefficients), and high frequencies are known as (AC coefficients). High-frequency signals depict noise and minor fluctuations (details). While bright conditions are associated with low frequencies. The DCT coefficient matrix’s dimensions match those of the input data [79]. A reduction step is not carried out by the DCT by itself. However, by performing a second reduction phase where a small number of coefficients are chosen to construct feature vectors, it can compress the majority of the input’s significant information into a reduced set of coefficients. A reduced set of DCT coefficients is then selected using zigzag scanning; after all, the CD4 features of the three CNNs trained with both modalities are fused using DCT. These reduced features are then fed to Bi-LSTM to accomplish gas detection and identification.

3.4.4. Gas Leakage Detection and Identification

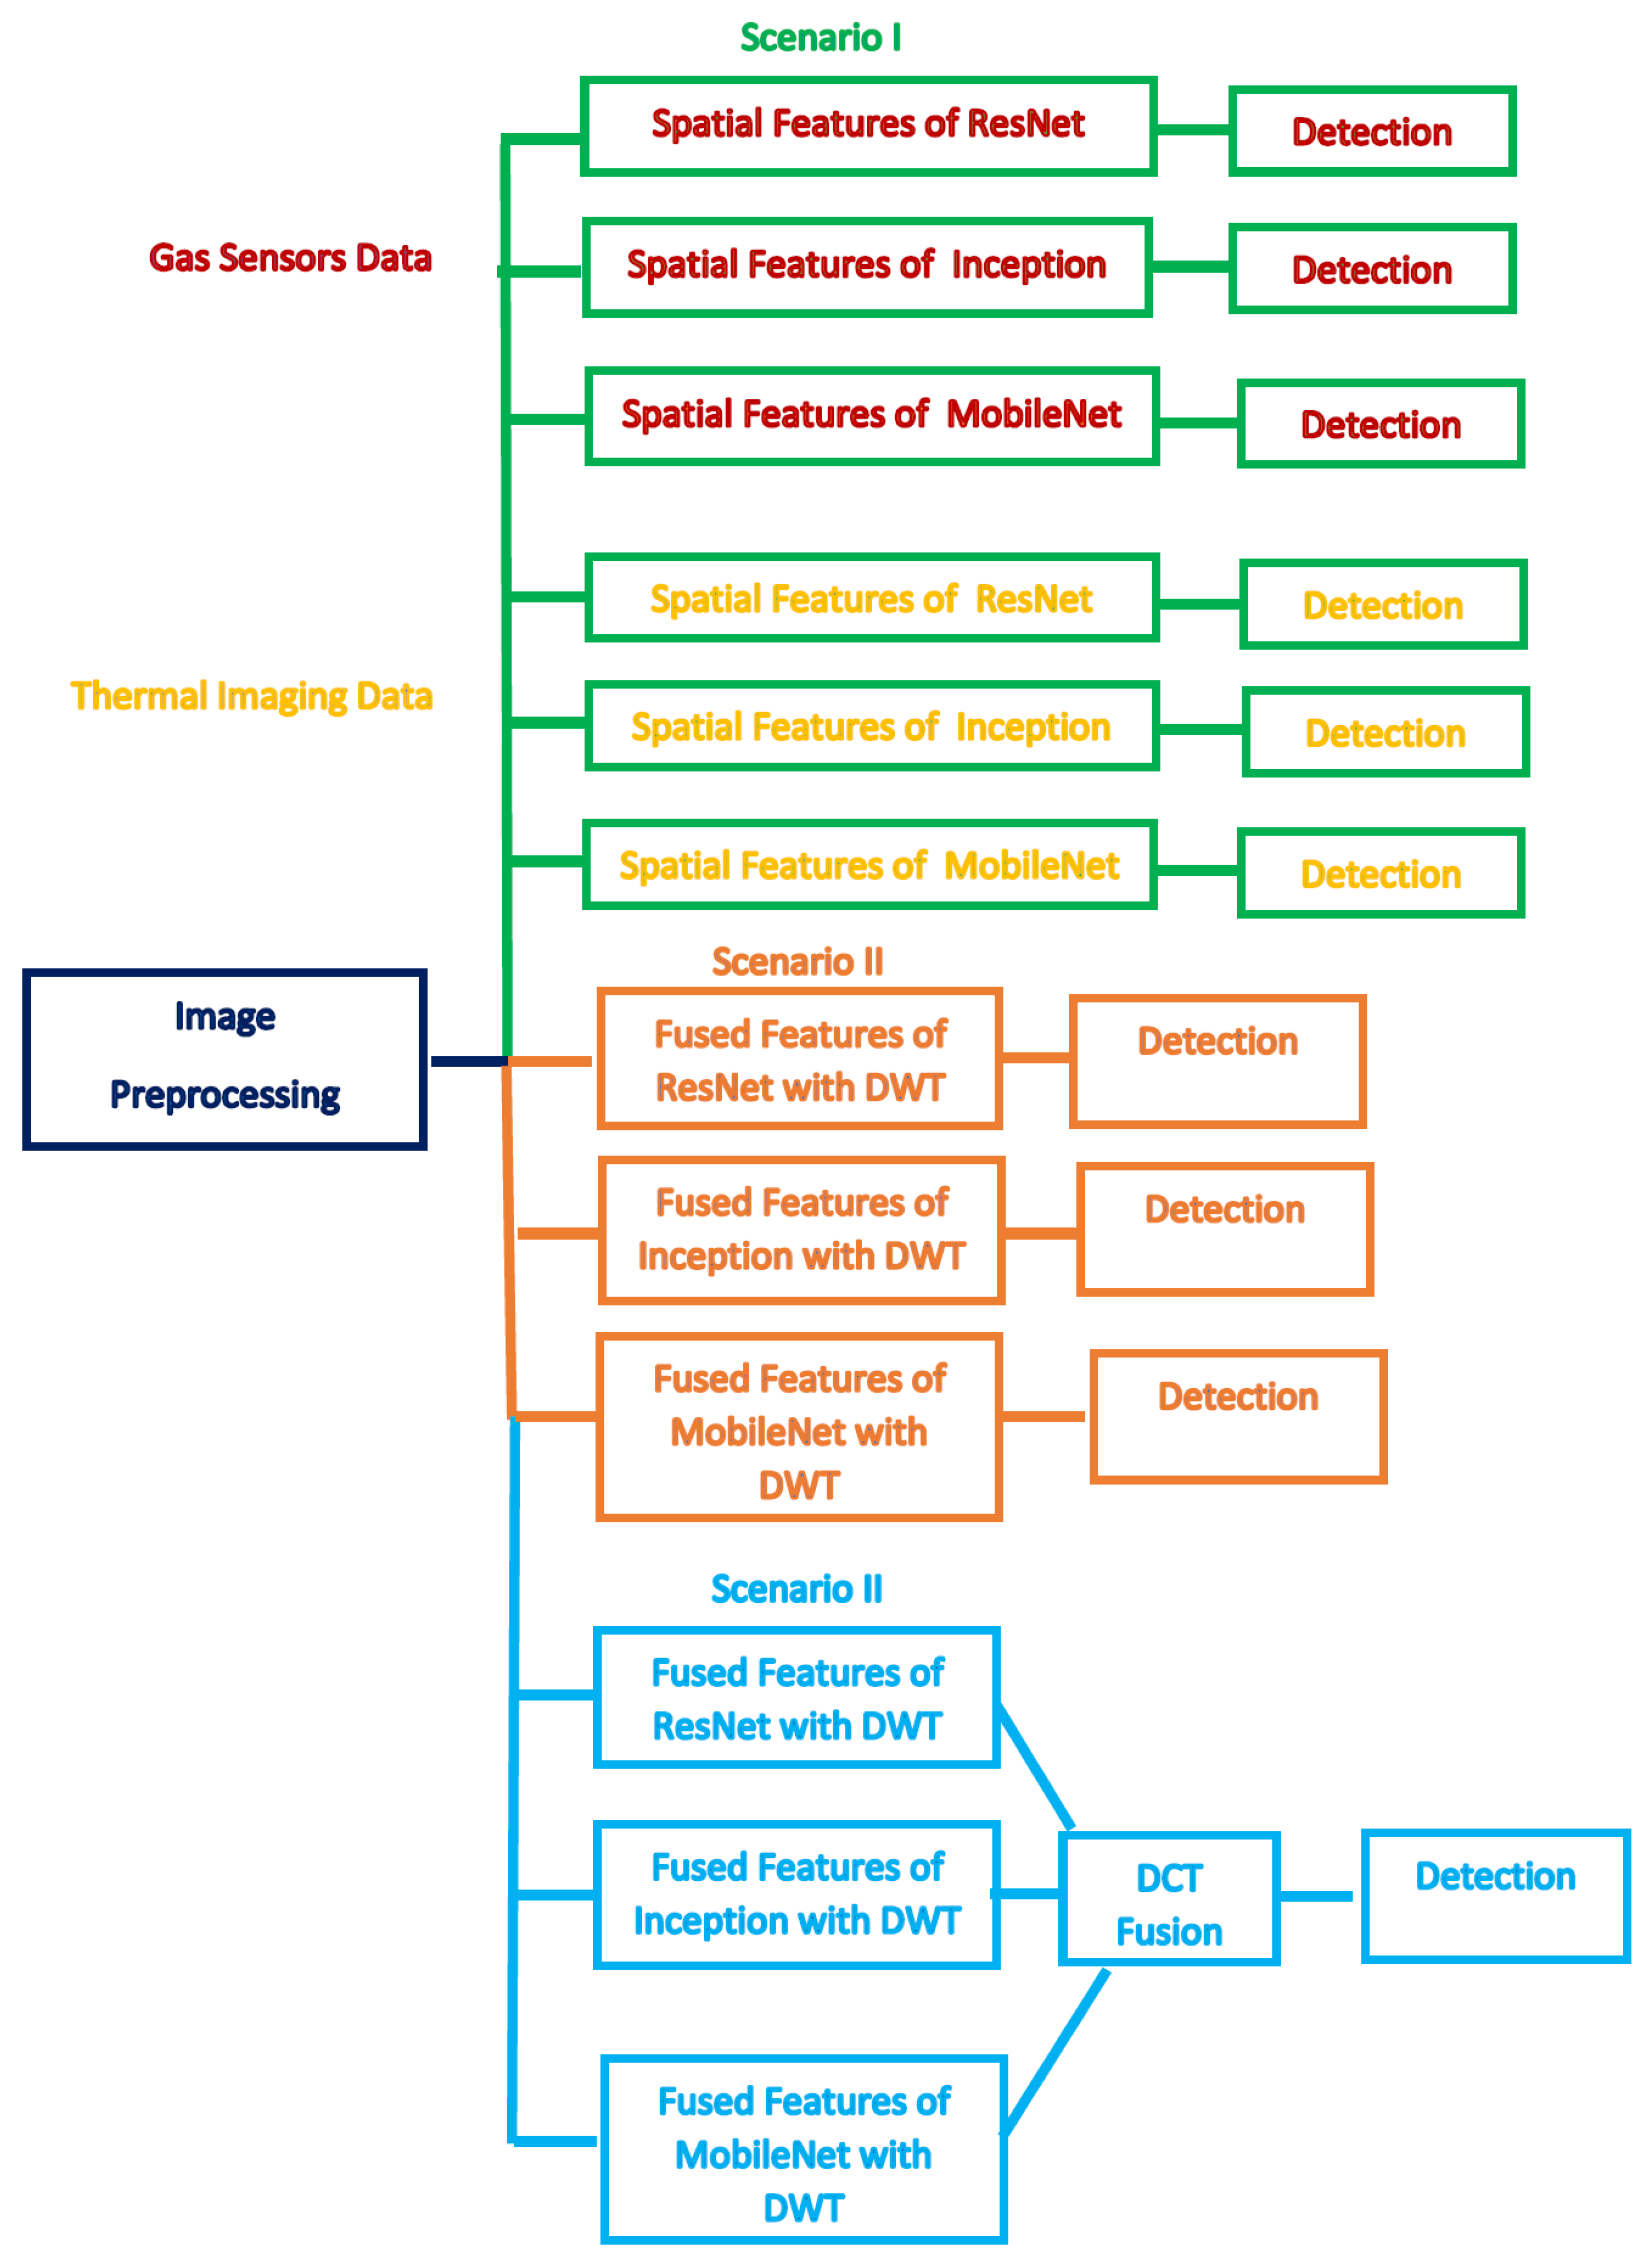
In this stage, the Bi-LSTM classifier is used to detect and identify gases through three different scenarios. In the first scenario, spatial deep features extracted from each CNN trained with either IR thermal images or heatmaps images of gas sensor data are used individually to train the Bi-LSTM. Whereas in the second scenario, fused spatial–spectral–temporal features obtained in the intermediate fusion (fusion using DWT) are used to feed the Bi-LSTM. In other words, for each CNN, spatial deep features extracted using each data modality are fused using DWT, resulting in spatial–spectral–temporal representation. These features are used as inputs to Bi-LSTM. Finally, in the third scenario, fused features attained utilizing multitask fusion (fusion with DCT) are employed to train the Bi-LSTM. This means that deep features extracted from the three CNN trained with both modalities are fused using DCT, and the output of this process is used to train the Bi-LSTM. Figure 3 demonstrates the three scenarios for gas leakage detection and identification.

4. Experimental Setting

4.1. Setting of the Parameters

The initial learning rate, mini-batch size, validation frequency, and the number of epochs are only a few of the parameters that are changed for the three CNNs. Thirty total epochs and an initial learning rate of 1 × 10⁻³ are used in this study. Mini-batch size and validation frequency are 10 and 448, respectively. The other CNN parameters, however, remain the same. The stochastic gradient descent with momentum is the optimization algorithm employed (SGDM). Five-fold cross-validation is used to assess the classification models’ performance. The Bi-LSTM network has a batch size of 100, a validation frequency of 10, and 20 epochs. The softmax activation function is used. For the gate activation function, the sigmoid function is utilized.

4.2. Performance Evaluation Measures

Several assessment measures are used to evaluate the efficiency of the proposed pipeline being provided. These metrics include precision, sensitivity, accuracy, F1-score, Matthews correlation coefficient (MCC), and sensitivity. These rules are used to calculate Equations (1)–(6):
A c c u r a c y = T P + T N T N + F P + F N + T P
S e n s i t i v i t y = T P T P + F N
S p e c i f i c i t y = T N T N + F P
P r e c i s i o n = T P T P + F P
F 1 - S c o r e = 2 × T P 2 × T P + F P + F N
M C C = T P × T N F P × F N ( T P + F P ) ( T P + F N ) ( T N + F P ) ( T N + F N )
The true positive (TP) represents the proportion of instances that are correctly classified as positive, the false negative (FN) represents the proportion of samples that are mistakenly classified as negative, the true negative (TN) represents the proportion of instances that are correctly classified as negative, and the false positive (FP) represents the proportion of samples that are mistakenly classified as positive.

5. Results

This section will illustrate the results of the three scenarios of detecting and identifying gases using Bi-LSTM. Scenario I represents the use of each modality separately to train each CNN and extract features to train individually the Bi-LSTM classifier. Whereas Scenario II represents the intermediate fusion process, where features extracted from each CNN trained independently with the IR thermal images and heatmaps images of gas sensors measurements are fused and reduced using DWT. These fused and reduced features are then used to feed the Bi-LSTM classifier. Lastly, in Scenario III, features obtained from all CNNs trained with both modalities are fused and further diminished using DCT. These features are then used as inputs to the Bi-LSTM classifier.

5.1. Bi-LSTM Results of Scenario I

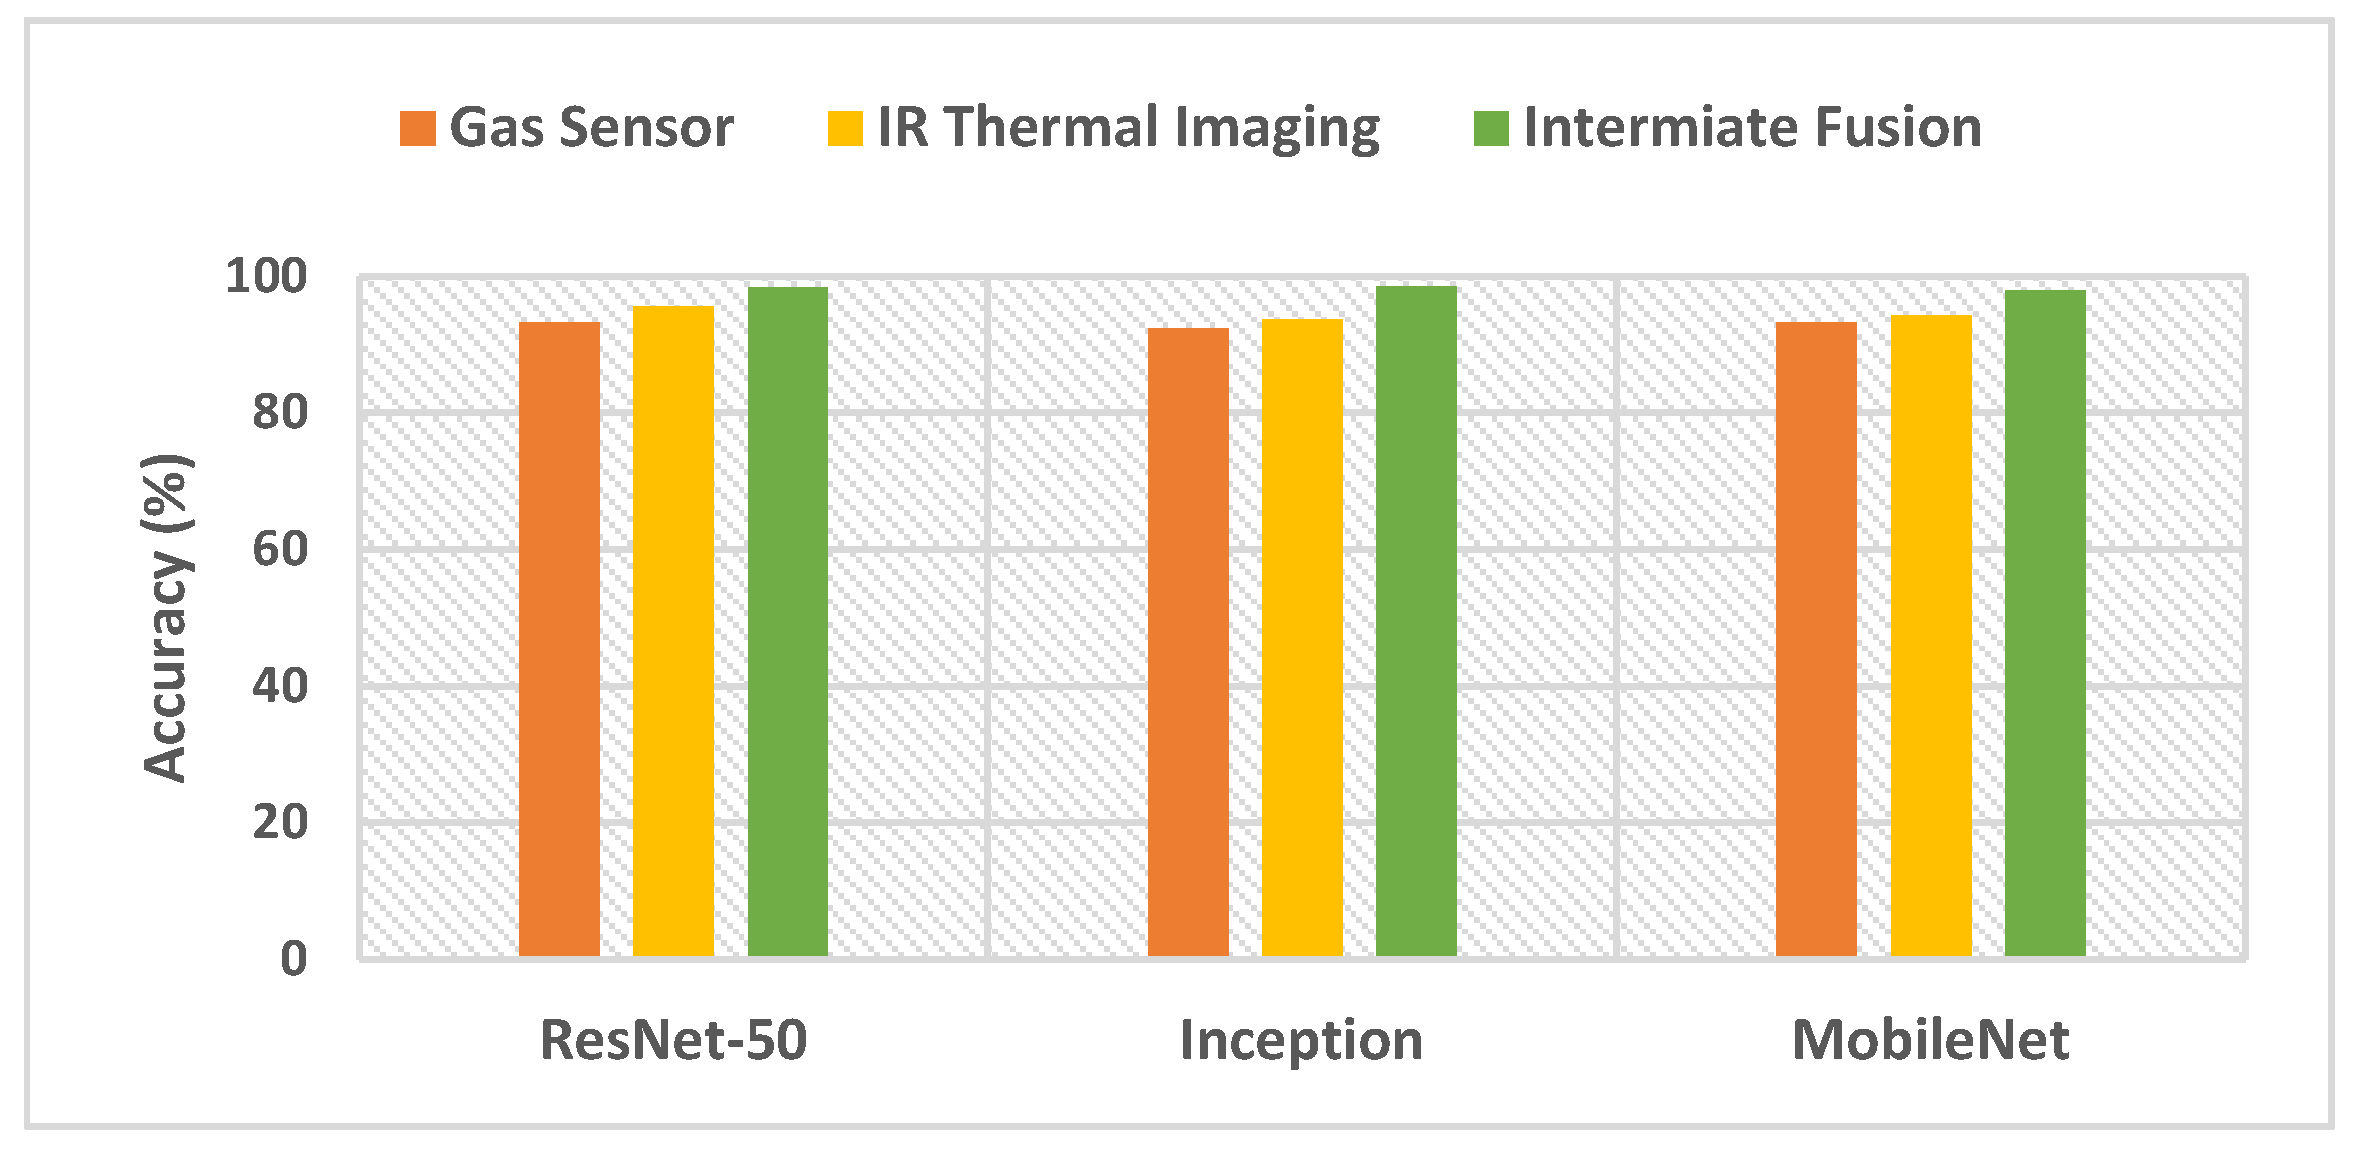
The Bi-LSTM results of Scenario I are shown in Table 2. This table shows that the features extracted from the IR thermal images are superior to the features obtained from gas sensor measurements. This is because the Bi-LSTM accuracy attained using spatial features of ResNet-50, Inception, and MobileNet trained with IR thermal images is 95.55%, 93.60%, and 94.22%, respectively. These accuracies are greater than that achieved by the Bi-LSTM fed with spatial features extracted from the three CNNs trained with gas sensor measurements (93.27%, 92.28%, and 93.27% for ResNet-50, Inception, and MobileNet, respectively.

5.2. Bi-LSTM Results of Scenario II

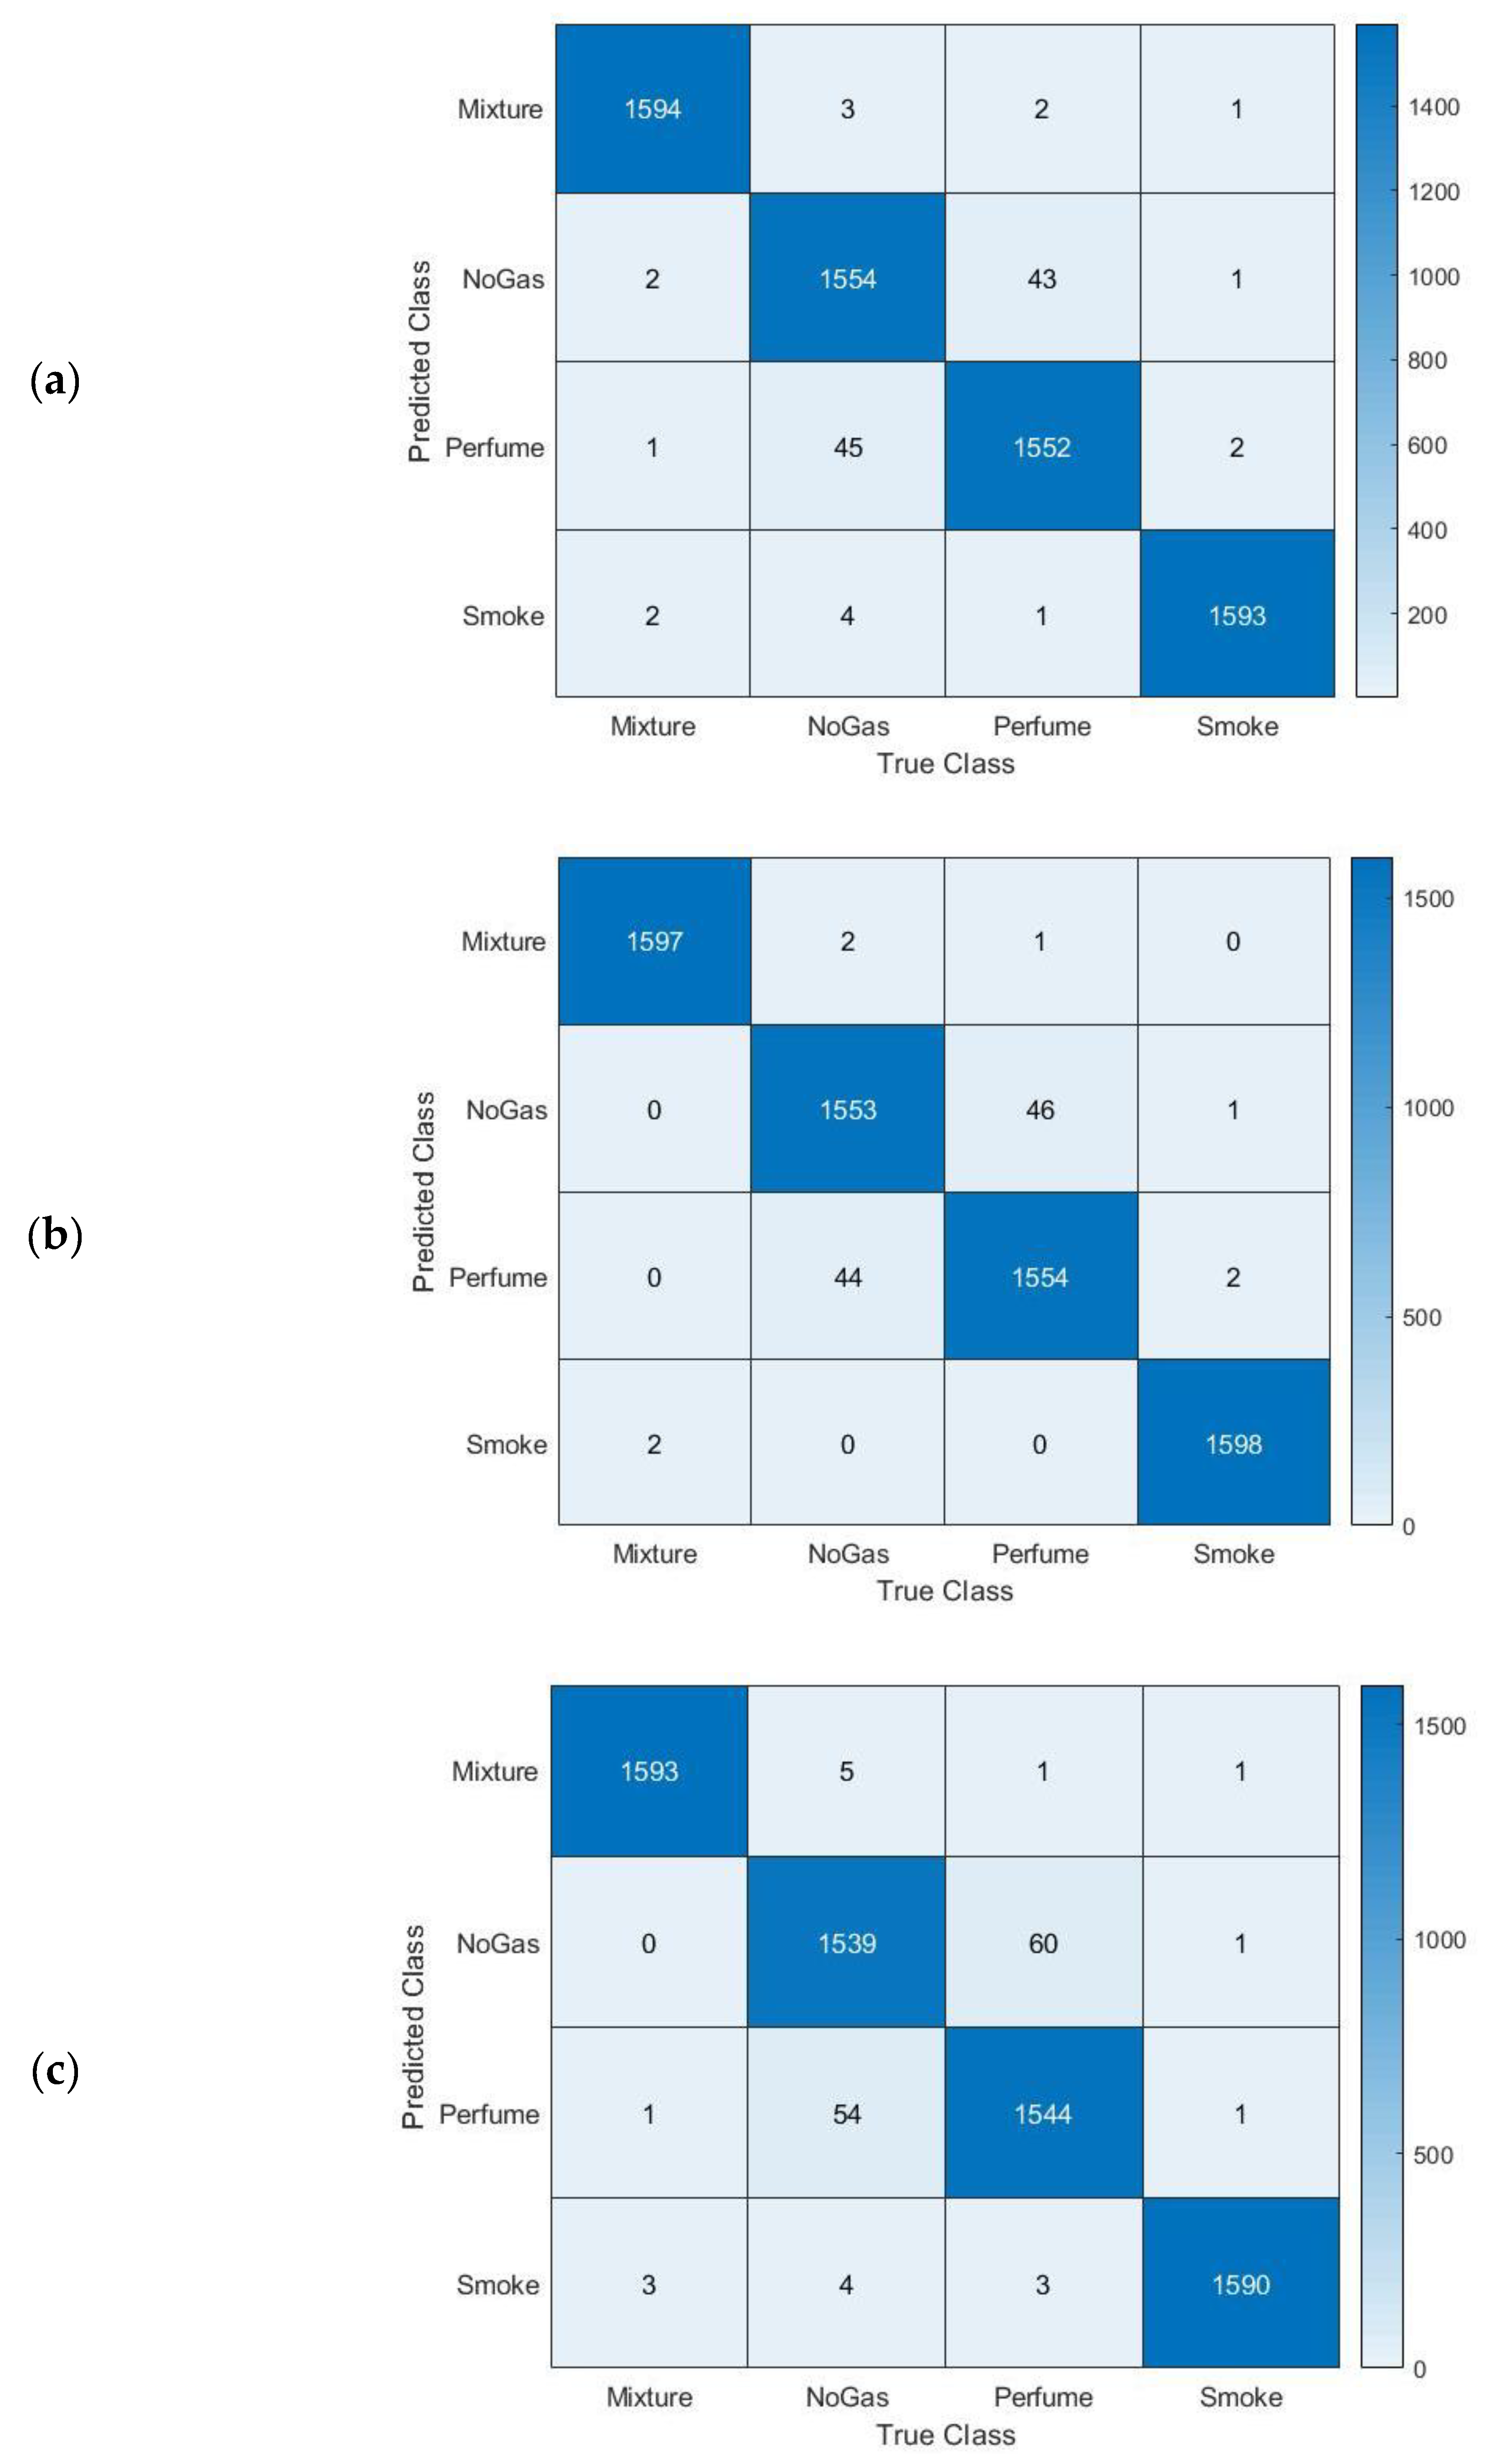
The results of the intermediate fusion approach of the proposed pipeline are illustrated in this section. Figure 4 displays the Bi-LSTM accuracy attained using the intermediate fusion procedure for each CNN of the proposed pipeline. Figure 4 indicates that intermediate fusion has improved the performance of the Bi-LSTM classifier attained for the fused features of the three CNNs individually trained with IR thermal images and gas sensor measurements. The Bi-LSTM accuracy attained with the intermediate fusion of features of ResNet-50, Inception, and MobileNet is 98.33%, 98.47%, and 97.90%, respectively. The results in Figure 4 also verify that utilizing spatial–spectral–temporal representation of features obtained after the intermediate fusion with DWT is superior to using spatial features only in Scenario I. Figure 5 shows the number of features used to train the Bi-LSTM before (Scenario I) and after the intermediate fusion (Scenario II) for the three CNNs. Although the results of Figure 4 prove that intermediate fusion using DWT has improved the performance of the Bi-LSTM, the results of Figure 5 prove that DWT has also successfully reduced the number of features used to build the Bi-LSTM after the intermediate fusion. This is clear as the number of features after the intermediate fusion using DWT is 256,160, and 256 for the spatial–spectral–temporal features obtained from ResNet-50, Inception, and MobileNet. The length of these features is much lower than the spatial features used in Scenario I, as shown in Figure 5. The confusion matrices for the Bi-LSTM after the intermediate fusion for the three CNNs are shown in Figure 6.

5.3. Bi-LSTM Results of Scenario III

The results of the multitask fusion procedure of the proposed pipeline are discussed in this section. In multitask fusion (Scenario III), DCT is utilized to fuse all the spatial–spectral–temporal features obtained in Scenario II (from the three CNNs). An ablation study is conducted to select the number of features after DCT (multitask fusion). The results of this ablation study are shown in Figure 7. The results included in Figure 7 prove that multitask fusion with DCT has further enhancement in the performance of the proposed pipeline. This is obvious as Figure 7 indicates that starting from 100 features, the accuracy attained 98.56%, reaching accuracies of 99.18% and 99.25% at 350 and 500 features, respectively. These accuracies are greater than that obtained in Scenario II (intermediate fusion), which confirms that the multitask fusion is capable of boosting the model performance and is superior to intermediate fusion.
Some performance metrics, such as sensitivity, precision, specificity, F1-score, and MCC, are also calculated for multitask fusion and displayed in Table 3. Table 3 shows the sensitivity ranges (0.980–0.992), specificity ranges (0.993–0.997), precision ranges (0.980–0.992), F1-score ranges (0.980–0.992), and MCC ranges (0.973–0.990). These results indicate that the proposed pipeline is reliable since the sensitivity, specificity, and precision are greater than 0.95.

6. Discussion

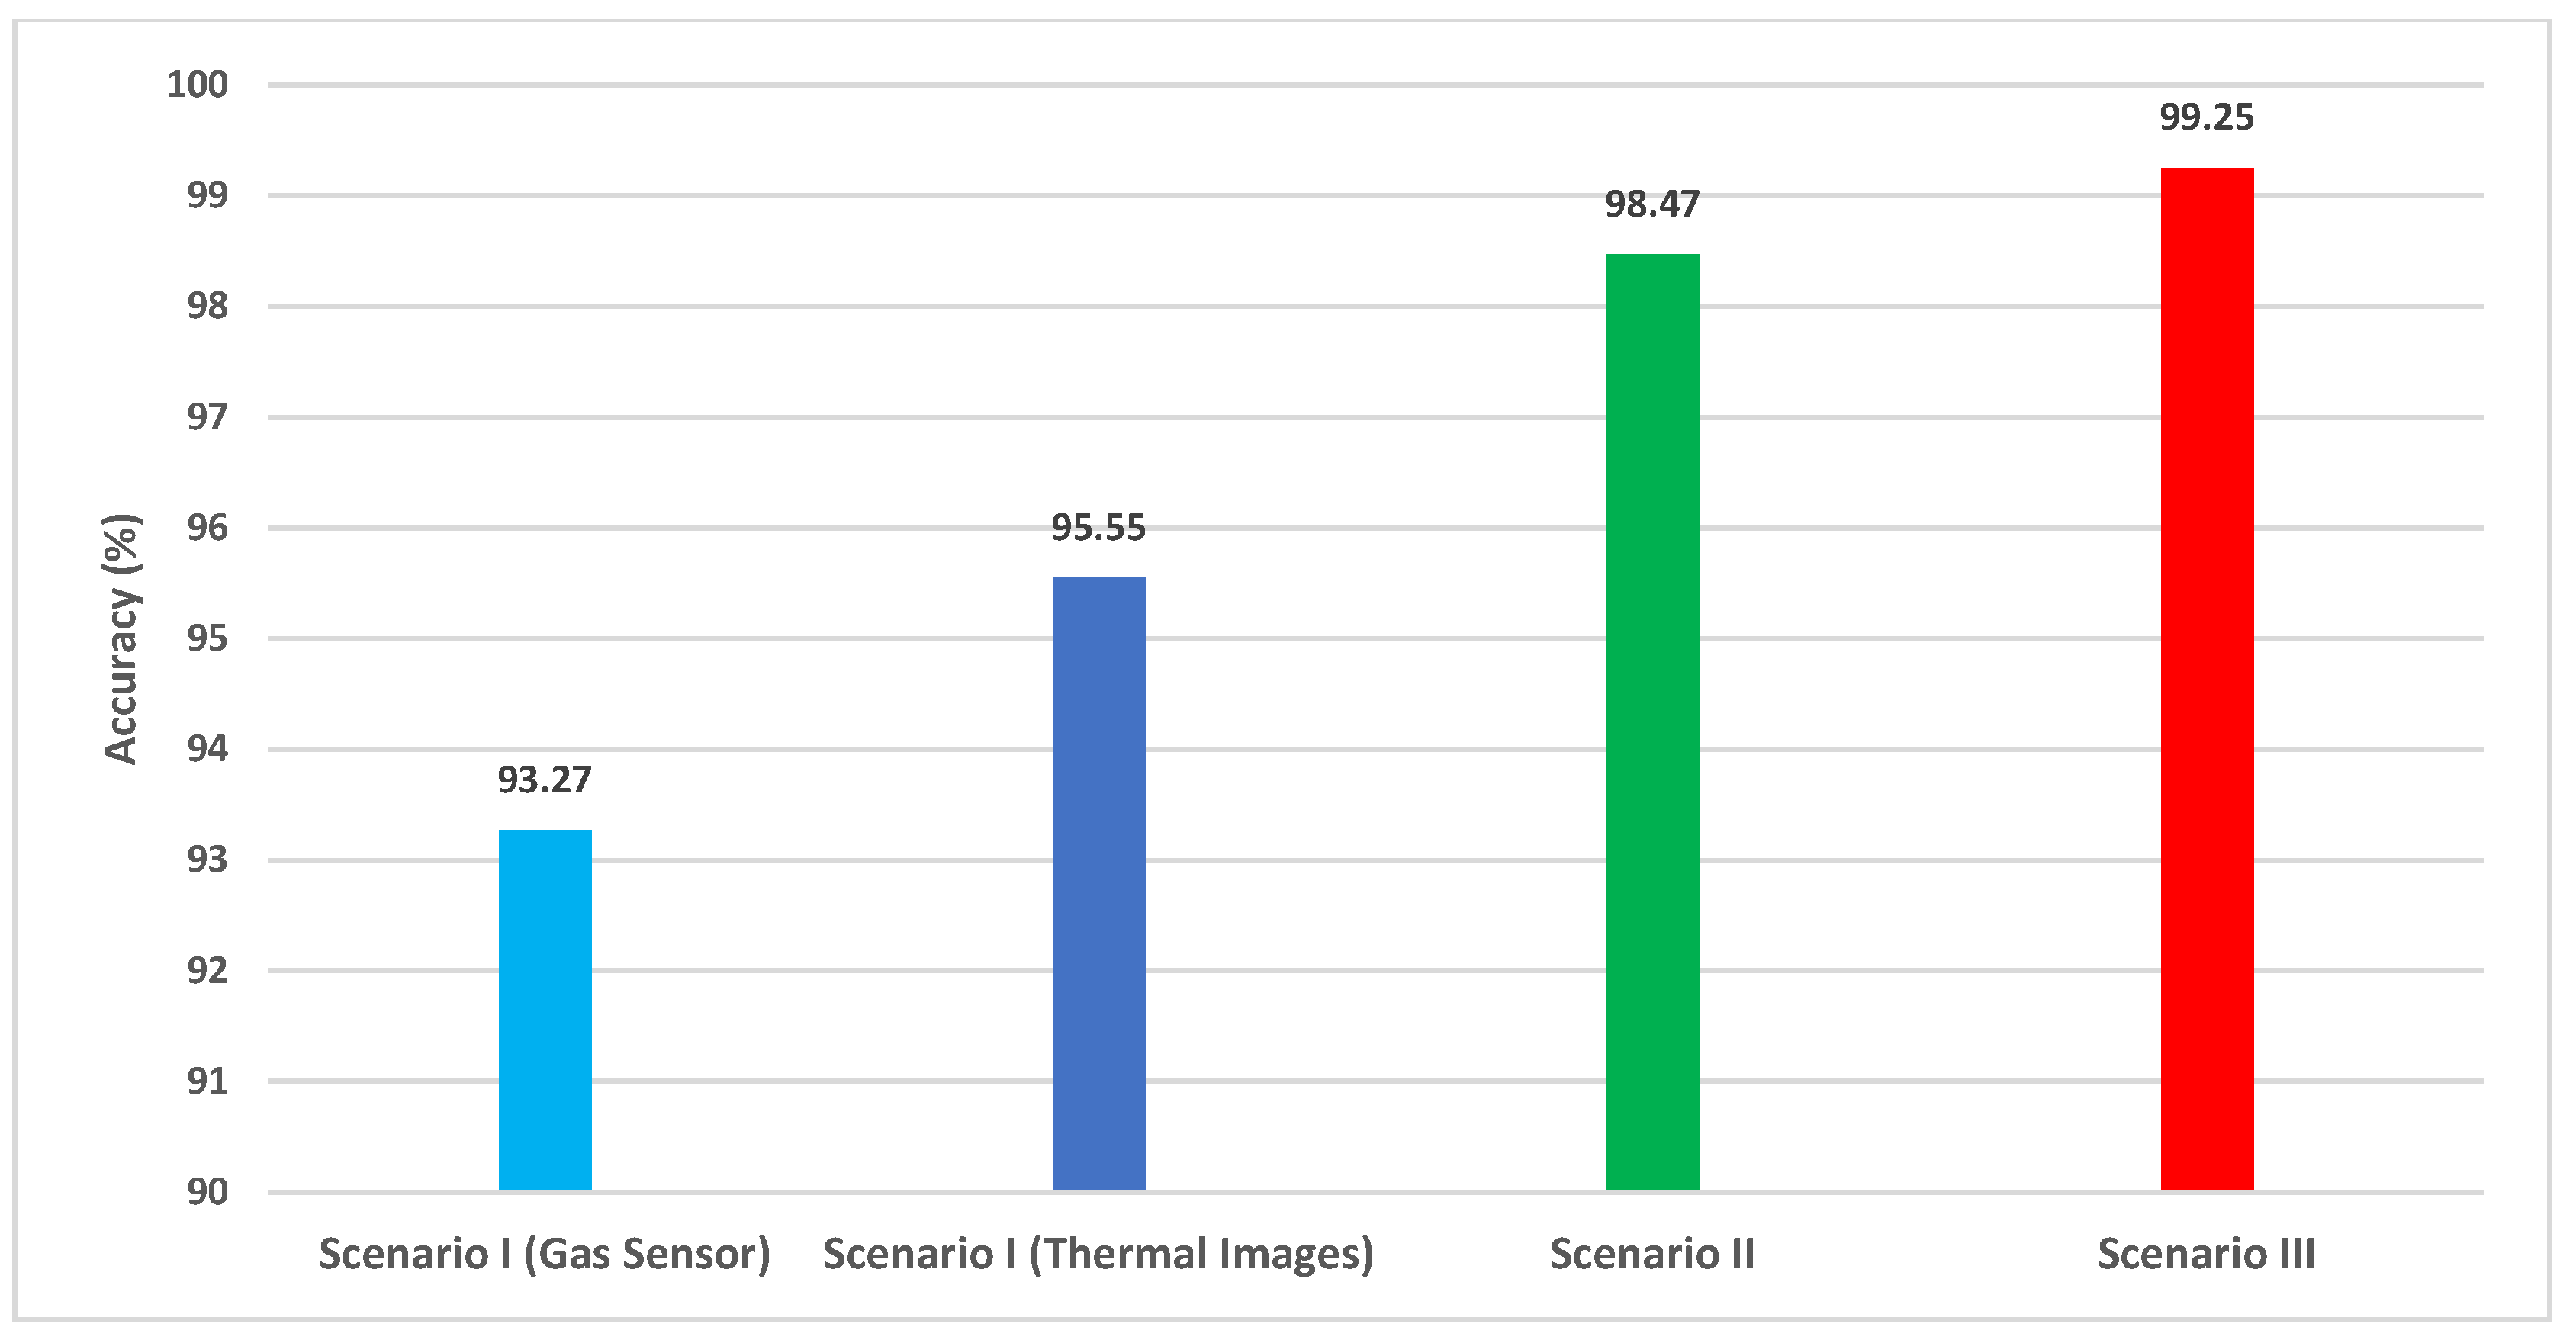
A multimodal DL-based fusion pipeline is developed in this work for accurate gas identification and detection. Four different categories of gases were considered for data gathering using sensors, including an IR thermal camera to record the thermal signature of the gases and an array of seven gas sensors forming an E-nose to identify certain gases. There were four classes: two independent gases, alcohol vapor from perfume and smoke from incense sticks, one as a blend of these gases, and one without any gas. A total of 6400 samples of thermal images and gas sensors were included in the data collection, which is unique. Intermediate and multitask fusion techniques were used to combine these two data modalities and compared to the utilization of a single modality for gas leakage detection and identification. The detection and identification phase of the proposed pipeline is conducted using Bi-LSTM through three scenarios equivalent to using individual modality (Scenario I), intermediate fusion (Scenario II), and multitask fusion (Scenario III). Figure 8 shows a comparison between the highest accuracy attained using each scenario.
Figure 8 proves that the intermediate fusion (Scenario II) of the multimodal data (gas sensor + IR thermal imaging) is better than using a single modality (Scenario II) for gas detection. This is because the accuracy has increased to reach 98.47% after intermediate fusion, which is greater than the 93.27% and 95.55% obtained by utilizing the gas sensor measurements and IR thermal imaging, respectively. Furthermore, the multitask fusion has an additional improvement in accuracy, reaching 99.25%. This verifies that multitask is better than intermediate fusion.

6.1. Comparisons

In order to demonstrate the competing ability of the proposed pipeline, its performance is evaluated against other recent studies for gas leakage detection based on the same dataset. The results of this comparison are shown in Table 4. The table proves the competitiveness of the proposed pipeline over related studies as it achieved accuracies of 0.985 and 0.992 using intermediate and multitask fusion, respectively. These accuracies are greater than that of 0.96 obtained in [25] based on early fusion and 0.945 and 0.969 attained in [30] using intermediate and multitask fusion. The reason for that is first; the proposed pipeline is based on multiple CNNs models instead of one. Furthermore, the intermediate fusion of the proposed model is accomplished using DWT, which extracts the spectral–temporal representation resulting in spatial-spectral–temporal information obtained from the multimodal dataset. This is not the case in the other studies, which use the spatial information of the data. Finally, the detection step of the proposed pipeline uses Bi-LSTM, which is superior to the traditional LSTM used in other studies and usually improves performance.

6.2. Complexity and Computational Analysis

A complexity analysis is conducted to determine the computational cost and the training time for models used for the detection and identification of gases. The proposed pipeline has two modes: offline and online. The deep learning model is trained in the offline mode to detect and identify gases using an already-collected dataset. The operation is offline because it requires a while (long time) to complete the training process for deep learning models to be able to detect and identify gases. On the other hand, in the online mode, the properly trained deep learning models which were originally built in the offline mode are used to instantly detect and identify new gas measurements (unobserved new samples of gas measurements acquired with e-nose and IR thermal camera) that weren’t utilized during the offline stage. Since the process takes a short duration, constant observation and detection of gas leakage are done online. In the offline modes, three CNN models are trained independently using gas images and IR thermal images. Whereas, in the online mode, deep features extracted from the three CNNs are used to feed a Bi-LSTM, which performs gas detection and classification in real-time in different scenarios (Scenario II and III). Table 5 reveals the computational cost and the training time for deep learning models used for the detection and identification of gases. Table 5 compares the complexity of different scenarios of the proposed pipeline.
As indicated in Table 5, the complexity of deep learning models in the offline mode is large; this is due to a large number of layers each CNN have as well as the huge number of parameters. The deep learning models require the whole image to feed them to be trained. Also, the detection time is extremely long during the offline stage. However, in the online mode, deep features are used to train a Bi-LSTM model to immediately detect and identify gases in two scenarios (scenarios II and III). In Scenario II, 256 or 160 features (depending upon which CNN is used for feature extraction) are used to train the Bi-LSTM model. The complexity in this scenario is much lower since the Bi-LSTM consists of fewer parameters and only one layer. Therefore, the detection and identification time is much lower than that of the offline mode. Furthermore, in Scenario III, 500 features feed the Bi-LSTM model to directly detect and identify gases. Similarly, the detection and identification duration is much lower than that of the offline mode as the Bi-LSTM has lower complexity than the deep learning models used in the offline mode.
The proposed pipeline could be used in several practical applications, including environmental management, such as monitoring volatile Organic compounds (VOCs), observing environmental pollution due to gases, evaluating the quality of the air inside the home, and detecting combustible/hazardous gases in indoor/outdoor environments. However, the time taken for gas detection in the online mode of the proposed pipeline should be further degraded to produce an efficient model and speed up the gas detection procedure.

6.3. Limitations and Upcoming Prospects

Despite the interesting results achieved using the proposed pipeline, it experiences some limitations. Although the detection duration of the online mode of the proposed pipeline is much lower than that of the offline mode, it still needs a further reduction to be used in practical applications more effectively. Future work will consider using compact deep-learning models and maybe combining these models with traditional machine-learning classifiers, which have lower complexity to diminish the time executed for gas leakage detection to be employed in practical applications with better efficiency. Furthermore, the present research neglected to take into account determining the concentrations of blended gases. Prospective studies will concentrate on the semi-quantitative, immediate, and interference-free identification of blended gas concentrations. Future research will also explore the viability of simultaneously determining various gases and their concentration extents. The current study ignores accomplishing a typical task of identifying gases in shifting environmental circumstances. To identify altering points out of gas measurements, subsequent research will take into account altering recognition in metal oxide gas sensor outputs for open sampling structures. Upcoming experiments will also look at modifying the temperature conditions and examining how that affects the efficiency of the suggested pipeline.

7. Conclusions

This article described a method for evaluating the reliability of intelligent multimodal data for gas leakage detection and identification in the industry 5.0 environment. For gas detection and identification, we evaluated intermediate and multitask fusion and compared them using individual data modalities of gas sensor measurements and IR thermal imaging. The proposed pipeline is based on three CNNs for feature extraction and a Bi-LSTM for gas detection. In the intermediate fusion, spatial features extracted from each CNN were fused using DWT, which also reduced the dimension of features after fusion. The results of this fusion verified that intermediate fusion is capable of boosting gas detection performance. Furthermore, the spatial–spectral–temporal representation of the features obtained using DWT is superior to the spatial information. On the hand, in the multitask fusion, all the spatial–spectral–temporal features attained from the three CNNs that were trained with the multimodal data were combined using DCT. DCT was used as well to lower the length of the feature obtained after the multitask fusion. The results of the multitask fusion proved that this combination method has further enhancement on the detection performance of the proposed pipeline. Moreover, these results indicated that multitask fusion is superior to intermediate fusion. The performance of the proposed pipeline, when compared to other related studies, proved that the proposed pipeline outperformed other recent methods and could be used reliably in industrial applications.

Funding

This research received no external funding.

Institutional Review Board Statement

Not applicable.

Informed Consent Statement

Not applicable.

Data Availability Statement

The multimodal dataset utilized in this study is available at https://data.mendeley.com/datasets/zkwgkjkjn9/2 (accessed on 15 August 2022).

Conflicts of Interest

The author declares no conflict of interest.

References

  1. Zhou, Y.; Zhao, X.; Zhao, J.; Chen, D. Research on Fire and Explosion Accidents of Oil Depots. In Proceedings of the 3rd International Conference on Applied Engineering, Wuhan, China, 22–25 April 2016; AIDIC-Associazione Italiana Di Ingegneria Chimica: Milano, Italy, 2016; Volume 51, pp. 163–168. [Google Scholar]
  2. Bonvicini, S.; Antonioni, G.; Morra, P.; Cozzani, V. Quantitative Assessment of Environmental Risk Due to Accidental Spills from Onshore Pipelines. Process Saf. Environ. Prot. 2015, 93, 31–49. [Google Scholar] [CrossRef]
  3. Kopbayev, A.; Khan, F.; Yang, M.; Halim, S.Z. Gas Leakage Detection Using Spatial and Temporal Neural Network Model. Process Saf. Environ. Prot. 2022, 160, 968–975. [Google Scholar] [CrossRef]
  4. Fox, A.; Kozar, M.P.; Steinberg, P.A. Gas Chromatography and Gas Chromatography—Mass Spectrometry. 2000. Available online: https://www.thevespiary.org/library/Files_Uploaded_by_Users/Sedit/Chemical%20Analysis/Crystalization,%20Purification,%20Separation/Encyclopedia%20of%20Separation%20Science/Level%20III%20-%20Practical%20Applications/CARBOHYDRATES%20-%20Gas%20Chromatography%20and%20Gas%20Chromatography-Ma.pdf (accessed on 10 November 2022).
  5. Attallah, O. MB-AI-His: Histopathological Diagnosis of Pediatric Medulloblastoma and Its Subtypes via AI. Diagnostics 2021, 11, 359. [Google Scholar] [CrossRef] [PubMed]
  6. Attallah, O. GabROP: Gabor Wavelets-Based CAD for Retinopathy of Prematurity Diagnosis via Convolutional Neural Networks. Diagnostics 2023, 13, 171. [Google Scholar] [CrossRef] [PubMed]
  7. Attallah, O. Cervical Cancer Diagnosis Based on Multi-Domain Features Using Deep Learning Enhanced by Handcrafted Descriptors. Appl. Sci. 2023, 13, 1916. [Google Scholar] [CrossRef]
  8. Attallah, O. RADIC: A Tool for Diagnosing COVID-19 from Chest CT and X-Ray Scans Using Deep Learning and Quad-Radiomics. Chemom. Intell. Lab. Syst. 2023, 233, 104750. [Google Scholar] [CrossRef]
  9. Cardona, T.; Cudney, E.A.; Hoerl, R.; Snyder, J. Data Mining and Machine Learning Retention Models in Higher Education. J. Coll. Stud. Retent. Res. Theory Pract. 2023, 25, 51–75. [Google Scholar] [CrossRef]
  10. Liu, L.T.; Wang, S.; Britton, T.; Abebe, R. Reimagining the Machine Learning Life Cycle to Improve Educational Outcomes of Students. Proc. Natl. Acad. Sci. USA 2023, 120, e2204781120. [Google Scholar] [CrossRef]
  11. Sripathi, K.N.; Moscarella, R.A.; Steele, M.; Yoho, R.; You, H.; Prevost, L.B.; Urban-Lurain, M.; Merrill, J.; Haudek, K.C. Machine Learning Mixed Methods Text Analysis: An Illustration from Automated Scoring Models of Student Writing in Biology Education. J. Mix. Methods Res. 2023, 1–23. [Google Scholar] [CrossRef]
  12. Olan, F.; Liu, S.; Suklan, J.; Jayawickrama, U.; Arakpogun, E.O. The Role of Artificial Intelligence Networks in Sustainable Supply Chain Finance for Food and Drink Industry. Int. J. Prod. Res. 2022, 60, 4418–4433. [Google Scholar] [CrossRef]
  13. Zeng, F.; Wang, C.; Ge, S.S. A Survey on Visual Navigation for Artificial Agents with Deep Reinforcement Learning. IEEE Access 2020, 8, 135426–135442. [Google Scholar] [CrossRef]
  14. Attallah, O.; Ibrahim, R.A.; Zakzouk, N.E. CAD System for Inter-Turn Fault Diagnosis of Offshore Wind Turbines via Multi-CNNs & Feature Selection. Renew. Energy 2023, 203, 870–880. [Google Scholar]
  15. Attallah, O. Tomato Leaf Disease Classification via Compact Convolutional Neural Networks with Transfer Learning and Feature Selection. Horticulturae 2023, 9, 149. [Google Scholar] [CrossRef]
  16. Xiong, Y.; Li, Y.; Wang, C.; Shi, H.; Wang, S.; Yong, C.; Gong, Y.; Zhang, W.; Zou, X. Non-Destructive Detection of Chicken Freshness Based on Electronic Nose Technology and Transfer Learning. Agriculture 2023, 13, 496. [Google Scholar] [CrossRef]
  17. Amkor, A.; El Barbri, N. Classification of Potatoes According to Their Cultivated Field by SVM and KNN Approaches Using an Electronic Nose. Bull. Electr. Eng. Inform. 2023, 12, 1471–1477. [Google Scholar] [CrossRef]
  18. Piłat-Rożek, M.; Łazuka, E.; Majerek, D.; Szeląg, B.; Duda-Saternus, S.; Łagód, G. Application of Machine Learning Methods for an Analysis of E-Nose Multidimensional Signals in Wastewater Treatment. Sensors 2023, 23, 487. [Google Scholar] [CrossRef]
  19. Hamilton, S.; Charalambous, B. Leak Detection: Technology and Implementation; IWA Publishing: London, UK, 2013. [Google Scholar]
  20. Attallah, O.; Morsi, I. An Electronic Nose for Identifying Multiple Combustible/Harmful Gases and Their Concentration Levels via Artificial Intelligence. Measurement 2022, 199, 111458. [Google Scholar] [CrossRef]
  21. Arroyo, P.; Meléndez, F.; Suárez, J.I.; Herrero, J.L.; Rodríguez, S.; Lozano, J. Electronic Nose with Digital Gas Sensors Connected via Bluetooth to a Smartphone for Air Quality Measurements. Sensors 2020, 20, 786. [Google Scholar] [CrossRef] [Green Version]
  22. Fan, H.; Schaffernicht, E.; Lilienthal, A.J. Ensemble Learning-Based Approach for Gas Detection Using an Electronic Nose in Robotic Applications. Front. Chem. 2022, 10, 863838. [Google Scholar] [CrossRef]
  23. Manjula, R.; Narasamma, B.; Shruthi, G.; Nagarathna, K.; Kumar, G. Artificial Olfaction for Detection and Classification of Gases Using E-Nose and Machine Learning for Industrial Application. In Machine Intelligence and Data Analytics for Sustainable Future Smart Cities; Springer: Berlin/Heidelberg, Germany, 2021; pp. 35–48. [Google Scholar]
  24. Luo, J.; Zhu, Z.; Lv, W.; Wu, J.; Yang, J.; Zeng, M.; Hu, N.; Su, Y.; Liu, R.; Yang, Z. E-Nose System Based on Fourier Series for Gases Identification and Concentration Estimation from Food Spoilage. IEEE Sens. J. 2023, 23, 3342–3351. [Google Scholar] [CrossRef]
  25. Narkhede, P.; Walambe, R.; Mandaokar, S.; Chandel, P.; Kotecha, K.; Ghinea, G. Gas Detection and Identification Using Multimodal Artificial Intelligence Based Sensor Fusion. Appl. Syst. Innov. 2021, 4, 3. [Google Scholar] [CrossRef]
  26. Adefila, K.; Yan, Y.; Wang, T. Leakage Detection of Gaseous CO2 through Thermal Imaging. In Proceedings of the 2015 IEEE International Instrumentation and Measurement Technology Conference (I2MTC), Pisa, Italy, 11–14 May 2015; IEEE: Piscataway, NJ, USA, 2015; pp. 261–265. [Google Scholar]
  27. Jadin, M.S.; Ghazali, K.H. Gas Leakage Detection Using Thermal Imaging Technique. In Proceedings of the 2014 UKSim-AMSS 16th International Conference on Computer Modelling and Simulation, Cambridge, UK, 26–28 March 2014; IEEE: Piscataway, NJ, USA, 2014; pp. 302–306. [Google Scholar]
  28. Bin, J.; Rahman, C.A.; Rogers, S.; Liu, Z. Tensor-Based Approach for Liquefied Natural Gas Leakage Detection from Surveillance Thermal Cameras: A Feasibility Study in Rural Areas. IEEE Trans. Ind. Inform. 2021, 17, 8122–8130. [Google Scholar] [CrossRef]
  29. Steffens, C.R.; Messias, L.R.V.; Drews, P.J.L., Jr.; da Costa Botelho, S.S. On Robustness of Robotic and Autonomous Systems Perception. J. Intell. Robot. Syst. 2021, 101, 61. [Google Scholar] [CrossRef]
  30. Rahate, A.; Mandaokar, S.; Chandel, P.; Walambe, R.; Ramanna, S.; Kotecha, K. Employing Multimodal Co-Learning to Evaluate the Robustness of Sensor Fusion for Industry 5.0 Tasks. Soft Comput. 2022, 27, 4139–4155. [Google Scholar] [CrossRef]
  31. Attallah, O. CerCan·Net: Cervical Cancer Classification Model via Multi-Layer Feature Ensembles of Lightweight CNNs and Transfer Learning. Expert Syst. Appl. 2023, 229 Pt B, 120624. [Google Scholar] [CrossRef]
  32. Attallah, O.; Samir, A. A Wavelet-Based Deep Learning Pipeline for Efficient COVID-19 Diagnosis via CT Slices. Appl. Soft Comput. 2022, 128, 109401. [Google Scholar] [CrossRef]
  33. Kalman, E.-L.; Löfvendahl, A.; Winquist, F.; Lundström, I. Classification of Complex Gas Mixtures from Automotive Leather Using an Electronic Nose. Anal. Chim. Acta 2000, 403, 31–38. [Google Scholar] [CrossRef]
  34. Yang, T.; Zhang, P.; Xiong, J. Association between the Emissions of Volatile Organic Compounds from Vehicular Cabin Materials and Temperature: Correlation and Exposure Analysis. Indoor Built Environ. 2019, 28, 362–371. [Google Scholar] [CrossRef]
  35. Imahashi, M.; Miyagi, K.; Takamizawa, T.; Hayashi, K. Artificial Odor Map and Discrimination of Odorants Using the Odor Separating System. In AIP Conference Proceedings; American Institute of Physics: College Park, MD, USA, 2011; Volume 1362, pp. 27–28. [Google Scholar]
  36. Liu, H.; Meng, G.; Deng, Z.; Li, M.; Chang, J.; Dai, T.; Fang, X. Progress in Research on VOC Molecule Recognition by Semiconductor Sensors. Acta Phys.-Chim. Sin. 2020, 38, 2008018. [Google Scholar] [CrossRef]
  37. Charumporn, B.; Omatu, S.; Yoshioka, M.; Fujinaka, T.; Kosaka, T. Fire Detection Systems by Compact Electronic Nose Systems Using Metal Oxide Gas Sensors. In Proceedings of the 2004 IEEE International Joint Conference on Neural Networks (IEEE Cat. No. 04CH37541), Budapest, Hungary, 25–29 July 2004; IEEE: Piscataway, NJ, USA, 2004; Volume 2, pp. 1317–1320. [Google Scholar]
  38. Cheng, L.; Liu, Y.-B.; Meng, Q.-H. A Novel E-Nose Chamber Design for VOCs Detection in Automobiles. In Proceedings of the 2020 39th Chinese Control Conference (CCC), Shenyang, China, 27–29 July 2020; IEEE: Piscataway, NJ, USA, 2020; pp. 6055–6060. [Google Scholar]
  39. Ye, Z.; Liu, Y.; Li, Q. Recent Progress in Smart Electronic Nose Technologies Enabled with Machine Learning Methods. Sensors 2021, 21, 7620. [Google Scholar] [CrossRef]
  40. Wijaya, D.R.; Afianti, F.; Arifianto, A.; Rahmawati, D.; Kodogiannis, V.S. Ensemble Machine Learning Approach for Electronic Nose Signal Processing. Sens. Bio-Sens. Res. 2022, 36, 100495. [Google Scholar] [CrossRef]
  41. Feng, L.; Dai, H.; Song, X.; Liu, J.; Mei, X. Gas Identification with Drift Counteraction for Electronic Noses Using Augmented Convolutional Neural Network. Sens. Actuators B Chem. 2022, 351, 130986. [Google Scholar] [CrossRef]
  42. Li, Z.; Yu, J.; Dong, D.; Yao, G.; Wei, G.; He, A.; Wu, H.; Zhu, H.; Huang, Z.; Tang, Z. E-Nose Based on a High-Integrated and Low-Power Metal Oxide Gas Sensor Array. Sens. Actuators B Chem. 2023, 380, 133289. [Google Scholar] [CrossRef]
  43. Kang, M.; Cho, I.; Park, J.; Jeong, J.; Lee, K.; Lee, B.; Del Orbe Henriquez, D.; Yoon, K.; Park, I. High Accuracy Real-Time Multi-Gas Identification by a Batch-Uniform Gas Sensor Array and Deep Learning Algorithm. ACS Sens. 2022, 7, 430–440. [Google Scholar] [CrossRef]
  44. Faleh, R.; Kachouri, A. A Hybrid Deep Convolutional Neural Network-Based Electronic Nose for Pollution Detection Purposes. Chemom. Intell. Lab. Syst. 2023, 237, 104825. [Google Scholar] [CrossRef]
  45. Rahman, S.; Alwadie, A.S.; Irfan, M.; Nawaz, R.; Raza, M.; Javed, E.; Awais, M. Wireless E-Nose Sensors to Detect Volatile Organic Gases through Multivariate Analysis. Micromachines 2020, 11, 597. [Google Scholar] [CrossRef]
  46. Travis, B.; Dubey, M.; Sauer, J. Neural Networks to Locate and Quantify Fugitive Natural Gas Leaks for a MIR Detection System. Atmos. Environ. X 2020, 8, 100092. [Google Scholar] [CrossRef]
  47. De Pérez-Pérez, E.J.; López-Estrada, F.R.; Valencia-Palomo, G.; Torres, L.; Puig, V.; Mina-Antonio, J.D. Leak Diagnosis in Pipelines Using a Combined Artificial Neural Network Approach. Control Eng. Pract. 2021, 107, 104677. [Google Scholar] [CrossRef]
  48. Zhang, J.; Xue, Y.; Zhang, T.; Chen, Y.; Wei, X.; Wan, H.; Wang, P. Detection of Hazardous Gas Mixtures in the Smart Kitchen Using an Electronic Nose with Support Vector Machine. J. Electrochem. Soc. 2020, 167, 147519. [Google Scholar] [CrossRef]
  49. Ragila, V.V.; Madhavan, R.; Kumar, U.S. Neural Network-Based Classification of Toxic Gases for a Sensor Array. In Sustainable Communication Networks and Application; Springer: Berlin/Heidelberg, Germany, 2021; pp. 373–383. [Google Scholar]
  50. Peng, P.; Zhao, X.; Pan, X.; Ye, W. Gas Classification Using Deep Convolutional Neural Networks. Sensors 2018, 18, 157. [Google Scholar] [CrossRef] [Green Version]
  51. Spandonidis, C.; Theodoropoulos, P.; Giannopoulos, F.; Galiatsatos, N.; Petsa, A. Evaluation of Deep Learning Approaches for Oil & Gas Pipeline Leak Detection Using Wireless Sensor Networks. Eng. Appl. Artif. Intell. 2022, 113, 104890. [Google Scholar]
  52. Pan, X.; Zhang, H.; Ye, W.; Bermak, A.; Zhao, X. A Fast and Robust Gas Recognition Algorithm Based on Hybrid Convolutional and Recurrent Neural Network. IEEE Access 2019, 7, 100954–100963. [Google Scholar] [CrossRef]
  53. Liu, Q.; Hu, X.; Ye, M.; Cheng, X.; Li, F. Gas Recognition under Sensor Drift by Using Deep Learning. Int. J. Intell. Syst. 2015, 30, 907–922. [Google Scholar] [CrossRef]
  54. Marathe, S. Leveraging Drone Based Imaging Technology for Pipeline and RoU Monitoring Survey. In Proceedings of the SPE Symposium: Asia Pacific Health, Safety, Security, Environment and Social Responsibility, Kuala Lumpur, Malaysia, 23–24 April 2019. [Google Scholar]
  55. Liu, B.; Ma, H.; Zheng, X.; Peng, L.; Xiao, A. Monitoring and Detection of Combustible Gas Leakage by Using Infrared Imaging. In Proceedings of the 2018 IEEE International Conference on Imaging Systems and Techniques (IST), Krakow, Poland, 16–18 October 2018; IEEE: Piscataway, NJ, USA, 2018; pp. 1–6. [Google Scholar]
  56. Guo, W.; Wang, J.; Wang, S. Deep Multimodal Representation Learning: A Survey. IEEE Access 2019, 7, 63373–63394. [Google Scholar] [CrossRef]
  57. Ngiam, J.; Khosla, A.; Kim, M.; Nam, J.; Lee, H.; Ng, A.Y. Multimodal Deep Learning. In Proceedings of the ICML, Bellevue, WA, USA, 28 June–2 July 2011. [Google Scholar]
  58. Siami-Namini, S.; Tavakoli, N.; Namin, A.S. The Performance of LSTM and BiLSTM in Forecasting Time Series. In Proceedings of the 2019 IEEE International Conference on Big Data (Big Data), Los Angeles, CA, USA, 9–12 December 2019; IEEE: Piscataway, NJ, USA, 2019; pp. 3285–3292. [Google Scholar]
  59. Gao, J.; Li, P.; Chen, Z.; Zhang, J. A Survey on Deep Learning for Multimodal Data Fusion. Neural Comput. 2020, 32, 829–864. [Google Scholar] [CrossRef] [PubMed]
  60. Lahat, D.; Adali, T.; Jutten, C. Multimodal Data Fusion: An Overview of Methods, Challenges, and Prospects. Proc. IEEE 2015, 103, 1449–1477. [Google Scholar] [CrossRef] [Green Version]
  61. Attallah, O. A Computer-Aided Diagnostic Framework for Coronavirus Diagnosis Using Texture-Based Radiomics Images. Digit. Health 2022, 8, 20552076221092544. [Google Scholar] [CrossRef]
  62. Attallah, O. DIAROP: Automated Deep Learning-Based Diagnostic Tool for Retinopathy of Prematurity. Diagnostics 2021, 11, 2034. [Google Scholar] [CrossRef]
  63. Attallah, O. ECG-BiCoNet: An ECG-Based Pipeline for COVID-19 Diagnosis Using Bi-Layers of Deep Features Integration. Comput. Biol. Med. 2022, 142, 105210. [Google Scholar] [CrossRef]
  64. Boulahia, S.Y.; Amamra, A.; Madi, M.R.; Daikh, S. Early, Intermediate and Late Fusion Strategies for Robust Deep Learning-Based Multimodal Action Recognition. Mach. Vis. Appl. 2021, 32, 121. [Google Scholar] [CrossRef]
  65. Attallah, O.; Sharkas, M. GASTRO-CADx: A Three Stages Framework for Diagnosing Gastrointestinal Diseases. PeerJ Comput. Sci. 2021, 7, e423. [Google Scholar] [CrossRef]
  66. Liu, H.; Li, Q.; Gu, Y. A Multi-Task Learning Framework for Gas Detection and Concentration Estimation. Neurocomputing 2020, 416, 28–37. [Google Scholar] [CrossRef]
  67. Sarvamangala, D.R.; Kulkarni, R.V. Convolutional Neural Networks in Medical Image Understanding: A Survey. Evol. Intell. 2021, 15, 1–22. [Google Scholar] [CrossRef]
  68. Attallah, O. An Intelligent ECG-Based Tool for Diagnosing COVID-19 via Ensemble Deep Learning Techniques. Biosensors 2022, 12, 299. [Google Scholar] [CrossRef]
  69. He, K.; Zhang, X.; Ren, S.; Sun, J. Deep Residual Learning for Image Recognition. In Proceedings of the IEEE Conference on Computer Vision and Pattern Recognition, Las Vegas, NV, USA, 27–30 June 2016. [Google Scholar]
  70. Szegedy, C.; Vanhoucke, V.; Ioffe, S.; Shlens, J.; Wojna, Z. Rethinking the Inception Architecture for Computer Vision. In Proceedings of the IEEE Conference on Computer Vision and Pattern Recognition, Las Vegas, NV, USA, 27–30 June 2016; pp. 2818–2826. [Google Scholar]
  71. Howard, A.G.; Zhu, M.; Chen, B.; Kalenichenko, D.; Wang, W.; Weyand, T.; Andreetto, M.; Adam, H. Mobilenets: Efficient Convolutional Neural Networks for Mobile Vision Applications. arXiv 2017, arXiv:1704.04861. [Google Scholar]
  72. Hochreiter, S.; Schmidhuber, J. Long Short-Term Memory. Neural Comput. 1997, 9, 1735–1780. [Google Scholar] [CrossRef]
  73. Angeline, P.J.; Saunders, G.M.; Pollack, J.B. An Evolutionary Algorithm That Constructs Recurrent Neural Networks. IEEE Trans. Neural Netw. 1994, 5, 54–65. [Google Scholar] [CrossRef]
  74. Narkhede, P.; Walambe, R.; Chandel, P.; Mandaokar, S.; Kotecha, K. MultimodalGasData: Multimodal Dataset for Gas Detection and Classification. Data 2022, 7, 112. [Google Scholar] [CrossRef]
  75. Havens, K.J.; Sharp, E. Thermal Imaging Techniques to Survey and Monitor Animals in the Wild: A Methodology; Academic Press: Cambridge, MA, USA, 2015. [Google Scholar]
  76. Korotcenkov, G. Current Trends in Nanomaterials for Metal Oxide-Based Conductometric Gas Sensors: Advantages and Limitations. Part 1: 1D and 2D Nanostructures. Nanomaterials 2020, 10, 1392. [Google Scholar] [CrossRef]
  77. Morsi, I. Electronic Nose System and Artificial Intelligent Techniques for Gases Identification. Data Storage 2010, 80, 175–200. [Google Scholar]
  78. Lu, J.; Behbood, V.; Hao, P.; Zuo, H.; Xue, S.; Zhang, G. Transfer Learning Using Computational Intelligence: A Survey. Knowl.-Based Syst. 2015, 80, 14–23. [Google Scholar] [CrossRef]
  79. Miri, A.; Sharifian, S.; Rashidi, S.; Ghods, M. Medical Image Denoising Based on 2D Discrete Cosine Transform via Ant Colony Optimization. Optik 2018, 156, 938–948. [Google Scholar] [CrossRef]
  80. He, K.; Sun, J. Convolutional Neural Networks at Constrained Time Cost. In Proceedings of the IEEE Conference on Computer Vision and Pattern Recognition, Boston, MA, USA, 7–12 June 2015; pp. 5353–5360. [Google Scholar]
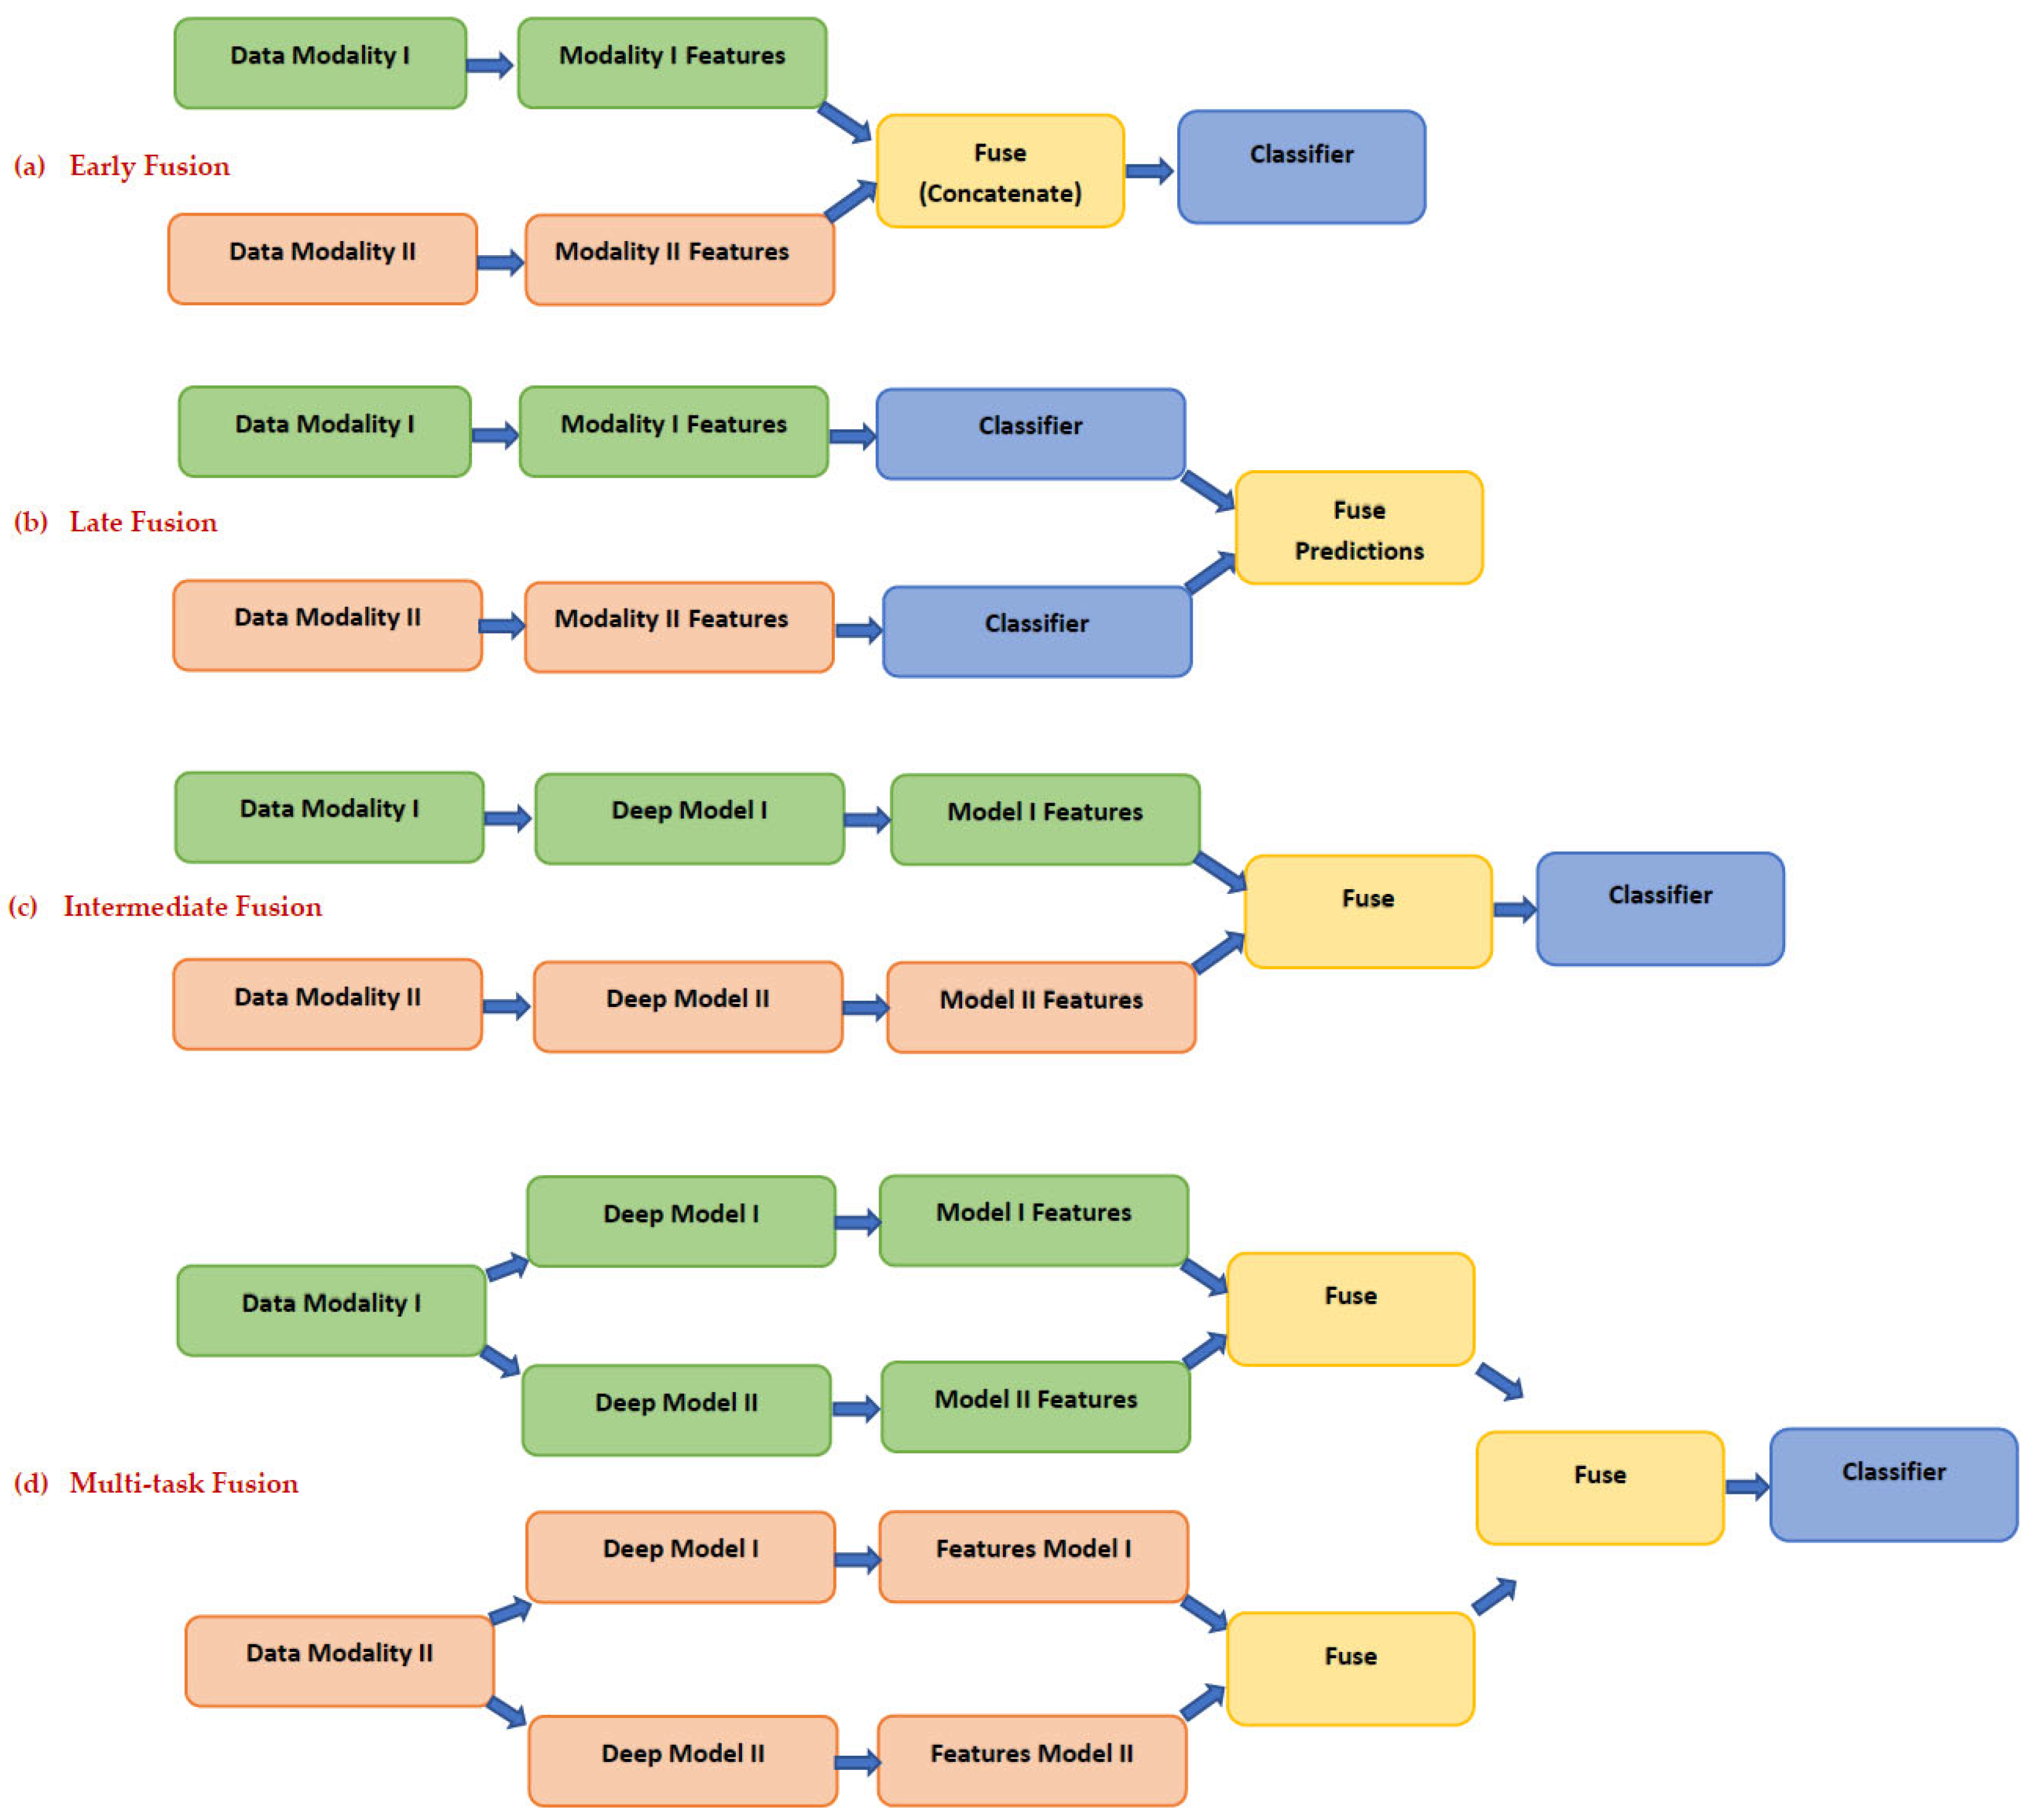
Figure 1. Multimodal data fusion methods: (a) early fusion, (b) late fusion, (c) intermediate fusion, and (d) multitask fusion.
Chemosensors 11 00364 g001
Figure 2. Stages of the proposed pipeline.
Chemosensors 11 00364 g002
Figure 3. The three scenarios of gas leakage detection and identification stage.
Chemosensors 11 00364 g003
Figure 4. The Bi-LSTM accuracy attained using the intermediate fusion procedure for each CNN of the proposed pipeline.
Chemosensors 11 00364 g004
Figure 5. The number of features used to train the Bi-LSTM before (Scenario I) and after the intermediate fusion (Scenario II).
Chemosensors 11 00364 g005
Figure 6. Confusion Matrices of the B-LSTM were achieved after the intermediate fusion process of (a) ResNet-50 features, (b) Inception features, and (c) MobileNet features.
Chemosensors 11 00364 g006
Figure 7. The number of features versus the accuracy attained after multitask fusion with DCT.
Chemosensors 11 00364 g007
Figure 8. A comparison between the highest accuracy attained using each scenario.
Chemosensors 11 00364 g008
Table 1. Examples of data from measurements made by gas sensors and their related thermal pictures [74]. The measurements from the gas sensors are MQ2, MQ3, MQ5, MQ6, MQ7, MQ8, and MQ135 in that order.
Gas TypeSample 1Sample 2
Gas SensorIR Thermal ImagingGas SensorIR Thermal Imaging
Smoke[615,339,396,412,574,598,312]Chemosensors 11 00364 i001[512,354,396,412,575,582,299]Chemosensors 11 00364 i002
Mixture[506,392,344,311,395,222,302]Chemosensors 11 00364 i003[530,397,370,338,409,248,355]Chemosensors 11 00364 i004
Perfume[753,523,489,461,685,696,495]Chemosensors 11 00364 i005[642,526,431,429,647,595,461]Chemosensors 11 00364 i006
NoGas[555,515,377,388,666,451,416]Chemosensors 11 00364 i007[669,525,422,419,650,648,449]Chemosensors 11 00364 i008
Table 2. The Bi-LSTM Testing Accuracy (%) for Scenario I.
CNN FeaturesGas SensorsIR Thermal Images
ResNet-5093.2795.55
Inception92.2893.60
MobileNet93.2794.22
Table 3. Performance metrics of the Bi-LSTM achieved after multitask fusion.
# FeaturesSensitivitySpecificityPrecisionF1-ScoreMCC
500.9800.9930.9800.9800.973
1000.9860.9950.9860.9860.981
1500.9870.9960.9870.9830.983
2000.9890.9960.9870.9870.983
2500.9870.9960.9870.9870.983
3000.9900.9970.9900.9900.986
3500.9920.9970.9920.9920.989
4000.9910.9970.9910.9910.988
4500.9910.9970.9910.9910.988
5000.9930.9970.9930.9930.990
5500.9920.9970.9920.9920.989
6000.9920.9970.9920.9920.990
Table 4. Performance of the proposed pipeline compared to recent relevant studies based on the same multimodal dataset.
ArticleMethodAccuracySensitivityPrecisionF1-Score
[25]LSTM + CNN
Early Fusion
0.9600.9630.9630.963
[30]LSTM + CNN
Intermediate Fusion
0.945---
[30]LSTM + CNN
Multitask Fusion
0.969
ProposedInception + DWT + Bi-LSTM
Intermediate Fusion
0.9850.9850.9850.985
Proposed(ResNet50 + Inception + MobileNet) + DWT + DCT + Bi-LSTM
Multitask Fusion
0.9920.9920.9920.992
Table 5. The complexity and computation analysis of the proposed pipeline.
ModelInput Size to the ModelSum of Parameters (H)Total Amount of LayersPer-Layer Training Complexity (O)Training Time
E-Nose DataIR Thermal Data
Offline Phase
ResNet-50Photos Aspect
224 × 224 × 3
23.0 M50 O ( n l 1 · s l 2 · m l 2 ) [80]
d: is the number of convolutional layers
n l : the total sum of filters in the lth layer
n l 1 : the number of input channels of the lth layer
s l : the spatial size of the filter’s kernel dimension
m l : the dimension of the output feature map
83 min 11 s72 min 37 s
InceptionPhotos Aspect
229 × 229 × 3
23.6 M48133 min 43 s144 min 27 s
MobileNetPhotos Aspect
224 × 224 × 3
3.5 M2879 min 43 s81 min 56 s
Online Phase
Scenario II256 Features for ResNet-50 and Inception
160 Features for MobileNet
H = 2 × 4 k + p k + k  
k: the number of hidden units
p: input size
1Bi-LSTM
O ( w
w: number of weights
ResNet-50 Fusion of Enose and IR thermal data
4 min 1 s
Inception Fusion of Enose and IR thermal data
4 min 0 s
MobileNet Fusion of Enose and IR thermal data
3 min 95 s
Scenario III500 Features H = 2 × 4 k + p k + k  
k: the number of hidden units 
p: input size
1Bi-LSTM 
O ( w
w: number of weights
4 min 3 s
Disclaimer/Publisher’s Note: The statements, opinions and data contained in all publications are solely those of the individual author(s) and contributor(s) and not of MDPI and/or the editor(s). MDPI and/or the editor(s) disclaim responsibility for any injury to people or property resulting from any ideas, methods, instructions or products referred to in the content.