Article

Nickel Tetrasulfonated Phthalocyanine Decorated with AuNP as a Double Sensorial Platform: SERS and Electrochemical

by
Cibely Silva Martin
,
Henry Seitiro Kavazoi
,
Celina Massumi Miyazaki
,
Priscila Alessio
and
Carlos José Leopoldo Constantino
*
Physics Department, School of Technology and Sciences, São Paulo State University (UNESP), Presidente Prudente 19060-900, SP, Brazil
*
Author to whom correspondence should be addressed.
Chemosensors 2023, 11(7), 372; https://doi.org/10.3390/chemosensors11070372
Submission received: 13 May 2023 / Revised: 22 June 2023 / Accepted: 30 June 2023 / Published: 3 July 2023
(This article belongs to the Special Issue Nanoparticles in Chemical and Biological Sensing)

Abstract

:
The development of materials for multiple applications is a challenge in the fields of technology and materials science. In this work, screen-printed carbon electrodes (SPCEs) were modified with an electropolymerized nickel tetrasulfonated phthalocyanine film (polymeric-NiTsPc = p-NiTsPc) decorated with gold nanoparticles (AuNP). The modified SPCEs were applied as a sensing platform for analysis via electrochemical and surface-enhanced Raman scattering (SERS) spectroscopy. The SPCEs modification was based on the potential cycling firstly in a NiTsPc solution and then in an AuHCl4 solution, with the fast formation of spherical AuNP through the p-NiTsPc film surface. The modified electrode based on SPCE/p-NiTsPc/AuNP showed a synergetic effect in voltammetric measurements in [Fe(CN)6]3−/[Fe(CN)6]4− probe as well as an electrocatalytic effect in the presence of dopamine. The calibration curve towards dopamine detection presented a linear range from 1 to 10 μmol/L with a limit of detection of 0.73 μmol/L. The spectroelectrochemistry measurements combining SERS and the applied potential of −60 mV showed that the SPCE/p-NiTsPc/AuNP and SPCE/AuNP can be powerfully used as a dual sensing platform for dopamine detection. In the case of SPCE/p-NiTsPc/AuNP, p-NiTsPc plays an important role in facilitating electron transfer during the electrochemical reaction, while AuNP is crucial for obtaining SERS signals for dopamine detection.

Graphical Abstract

1. Introduction

Spectroelectrochemistry is the combination of simultaneous electrochemical and spectroscopic measurements. It is a powerful tool for understanding reaction mechanisms during electrochemical processes [1,2]. Controlling the applied potential, spectroscopic information such as the vibrational modes of molecules formed during the applied potential can be investigated [3]. Besides that, the two techniques can be used for analyte determination, avoiding misinterpretation of electrochemical or spectroscopic data [3]. Based on this, using modified electrodes can be an alternative to increase the spectroelectrochemical application. Previous works reported the electrodeposition of NiTsPc on conventional electrodes to upgrade the electroactivity of glassy carbon electrodes (GCE) [4], carbon fiber [5], gold [6], and Pt disk [7] electrodes to, respectively, detect the nitrite, pesticide diuron, methanol, and nitric oxide. Additionally, Maringa and Nyokong have verified that electrodeposited AuNP and NiTsPc on a glassy carbon electrode (GCE) allowed nitrite detection at a lower potential when compared to the bare electrode (0.62 V versus 0.78 V) [4]. In this line of investigation, these previous works encourage us to take advantage of these materials to develop a new dual-sensor using SERS spectroelectrochemistry.
Related to its importance as a neurotransmitter as well as its electrochemical activity, dopamine (DA) was applied as a target molecule for spectroelectrochemical sensor application. DA is a neurotransmitter that plays an important role in human metabolism. Its abnormal level is associated with diseases such as Parkinson’s and schizophrenia [8,9]. The mostly used spectroelectrochemical set for dopamine is UV-vis absorption spectroscopy [10,11]. The simultaneous identification of dopamine, uric and ascorbic acids has been the aim of these works and since these three compounds are oxidized in similar potentials and their UV-vis absorption bands overlap, an additional chemometric tool is necessary for the analysis [10,11]. Other sets such as nuclear magnetic resonance (NMR) spectroelectrochemistry [12] and Fourier transform infrared (FTIR) spectroelectrochemistry [13] have been explored for the investigation of the products of dopamine oxidation. Concerning the SERS spectroelectrochemistry, Ibañez et al. [14] have electrodeposited AuNP on a single-walled carbon nanotubes electrode and studied the effect of experimental parameters (applied potential and deposition time) on the SERS effect. Raman spectroelectrochemistry was thus used to explain the oxidation mechanism and the orientation of guanine and adenine molecules (if parallel, tilted, or perpendicular to the AuNP surface). The mechanism of orientation was elucidated by the analysis of intensity and position changes of the Raman bands. Still, SERS spectroelectrochemistry is poorly explored.
In this work, we have modified commercial screen-printed carbon electrodes (SPCE) by the electropolymerization of nickel tetrasulfonated phthalocyanine (p-NiTsPc) and the electrodeposition of gold nanoparticles (AuNP). NiTsPc was chosen because of its electrocatalytic properties towards dopamine oxidation [15,16,17] while AuNP also exhibits high electrocatalytic properties besides its SERS capacity [18]. We have used dopamine to demonstrate the sensing capability of our spectroelectrochemical sensing platform.

2. Materials and Methods

2.1. Materials

Screen-printed carbon electrodes (SPCE) were purchased from DropSens (ref. 110, carbon as a working and a counter-electrode, silver as a reference electrode). Nickel tetrasulfonated phthalocyanine (NiTsPc, Sigma-Aldrich, Cotia-Brazil), chloroauric acid (HAuCl4⋅3H2O, Sigma-Aldrich), potassium chloride (KCl, Sigma-Aldrich), sodium hydroxide (NaOH, Sigma-Aldrich) and dopamine hydrochloride (Fluka Analytical) were used without any previous purification. All the solutions were prepared using ultrapure water (MilliQ system, 18.2 MΩ⋅cm).

2.2. Sensing Platform: Fabrication and Characterization

The SPCE modification was performed in two steps: (Step 1) electrodeposition of p-NiTsPc performed as described in the literature for other electrodes [5,7,19]. Briefly, the SPCE was washed with ultrapure water and immersed in a 2.0 mmol/L NiTsPc in 0.1 mol/L NaOH solution. Using a potentiostat/galvanostat μ-Autolab, type III with FRA 2 system (Metrohm), fifty potential cycles between 0 and +1.3 V were performed at 100 mV/s scan rate. The SPCE surface was then rinsed with ultrapure water and dried. (Step 2) The AuNP was electrodeposited on the SPCE/p-NiTsPc electrode following Li et al. [20]. Briefly, the previously modified electrode was immersed in a 0.5 mmol/L HAuCl4 containing a 0.1 mol/L KCl solution as a supporting electrolyte, and two potential cycles from −1.0 to 0.2 V at 100 mV/s were performed to produce the SPCE/p-NiTsPc/AuNP. As a comparison, SPCE/p-NiTsPc and SPCE/AuNP were also fabricated following only steps 1 and 2, respectively. The electrode modification was represented in Scheme 1A.
The bare and the modified SPCEs were characterized by cyclic voltammetry in the inert 0.1 mol/L KCl supporting electrolyte and also in a redox probe (5 mmol/L [Fe(CN)6]3−/[Fe(CN)6]4− solution). The scan rate study was performed in a [Fe(CN)6]3−/[Fe(CN)6]4− solution for the effective area evaluation. All electrodes were also characterized by electrochemical impedance spectroscopy (EIS) operating at open-circuit potential (OCP) using a sinusoidal voltage perturbation of 10 mV rms amplitude, integration time of 0.125 s, and 10 frequency steps/dec.
The SPCE/p-NiTsPc/AuNP was applied to the DA detection and determination of the limit of detection. The DA detection was performed using the differential pulse voltammetry (DPV) in a potential range from −0.4 to +0.2 V at 50 mV pulse amplitude and step potential of 0.005 V.

2.3. Surface Characterization and Spectroelectrochemical Analysis

The SEM images were acquired using a scanning electron microscope from Hitachi, model SU3800, without surface metallization. The structural characterization was performed by using the Renishaw micro-Raman spectrophotometer, model in-Via, coupled to a Leica microscope. The spectra were acquired using the laser line at 633 nm (grating of 1800 L/mm), with 10 s of acquisition time. Due to the resonance between the excitation laser line at 633 nm and the NiTsPc UV-Vis absorption, for p-NiTsPc were collected the resonance Raman spectra. The cyclic voltammetry characterization in inert supporting electrolytes and the presence of dopamine was performed by using a portable potentiostat Dropsens, model STAT400.
The spectroelectrochemical measurements were performed by coupling the portable potentiostat under the micro-Raman microscope, as represented in Scheme 1B. Firstly, the laser was focused on the electrode surface and further, a volume of 100 μL of the electrolyte (or dopamine) solution was dropped covering the three electrodes (reference, working, and counter electrodes). In the presence of dopamine, the Raman spectra (or SERS spectra) were collected before any potential application or applying the specific potential observed for dopamine oxidation (inferred by cyclic voltammetry for each electrode). Besides, after successive potential cycles, the Raman (resonance Raman) or SERS (SERRS) spectra were also collected keeping the solution at the electrode surface with no potential application.

3. Results and Discussion

3.1. Modified SPCE: Fabrications Steps and Surface Characterization

Figure 1A shows the cyclic voltammograms obtained for the electropolymerization of the p-NiTsPc film through fifty consecutive potential cycles between 0 and 1.3 V in 2.0 mM NiTsPc in a 0.1 M NaOH aqueous solution. The characteristic redox couple at 0.43 and 0.53 V can be ascribed to NiII/NiIII from the O–Ni–O oxo-bridges [7,21] formed during the process of electropolymerization (Scheme 1(A)). This redox couple can be easily verified in the inset in Figure 1. As previously reported, in the first potential cycle (see Supporting Information–Figure S1) the redox couple NiII/NiIII is absent, but an irreversible anodic process can be observed at positive potential due to the OH radical formation [22]. This is provided by the oxidation of the OH ions, which creates a variety of functional groups on the surface [22]. One should mention that the basic media and the extension of the potential range until the oxidation of OH ions are necessary for the electropolymerization of the NiTsPc. Starting from the second potential cycle, the continuous increase in the current amplitude of redox couple NiII/NiIII is a consequence of the anodic electropolymerization of the NiTsPc onto the electrode surface [23,24].
Following, AuNPs were electrodeposited onto the SPCE/p-NiTsPc surface by two potential cycles between −1.0 and 0.2 V at 100 mV/s in 0.5 mmol/L HAuCl4 in 0.1 mol/L KCl as a supporting electrolyte (Figure 1B). A large peak from −0.3 to −0.6V can be interpreted as the gold precursor adsorption on the electrode [25], or as a nucleation of the Au seeds [26]. The occurrence of nucleation and particle growth happened simultaneously at potentials more negative than −0.8 V [26].
The surface morphology of the modified SPCE/p-NiTsPc/AuNP indicated the presence of the AuNP with a size distribution of 41.6 ± 8.7 nm (Figure 2) homogeneously distributed along the film surface. A similar size distribution and SEM images were also observed for SPCE/AuNP (Figure S2), which indicates that the AuNP electrodeposition does not depend on the electrode surface composition. Furthermore, the NiTsPc film also showed complete coverage of the electrode surface (Figure S2), confirmed by the Raman mapping discussed below.
The modified SPCEs were characterized using micro-Raman spectroscopy and Raman mapping. The D and G characteristic carbon material bands [27,28] were observed on all the electrodes, but with the high intensity only for the bare SPCE and the SPCE/AuNP (Figure 3). The SPCE/p-NiTsPc and SPCE/p-NiTsPc/AuNP presented characteristic bands of NiTsPc, 1556 (C=C, C=N pyrrole stretching), 1334 (pyrrole stretching), 751 (macrocycle vibration), and 687 cm−1 (Pc breathing) with the band at 1334 cm−1 overlapped to the carbon D band [29]. These bands showed no significant shift in comparison to the Raman spectra of the NiTsPc powder (Figure 3C, band assignments summarized in Table S1 according to [15,29,30,31,32]). Wing and Callahan [33] predict that the metal-oxygen bridge vibrations would be observed at lower frequencies between 525–540 cm−1 (M–O–M symmetric stretching) and 795–885 cm−1 (anti-symmetric stretching). Moreover, these vibration modes are highly sensitive to molecule symmetry, being a centrosymmetric structure inactive to infrared measurements [33]. Fox et al. [34] showed the same dependence of M–O–M vibration using the resonance Raman for characterization of Fe–O–Fe center in Stearoyl-ACP Desaturase. Besides, according to Bosava et al. [35] based on DFT calculus and experimental results for (PcGa)2O (gallium phthalocyanine dimmer with μ-oxo bridge), there are no Raman active vibrations around 846 cm−1 ascribed to M–O–M, while the observed bands reflect only vibration modes ascribed to Pc ring breathing. The authors also reported that Ga–O–Ga vibration is active at lower frequencies (158, 225, 348 cm−1) and this characteristic originates from factor-group splitting [35]. In our case, there is no active vibration on resonance Raman spectra ascribed to M–O–M possibly due to the formation of a centrosymmetric structure. Even though the vibrations corresponding to the formation of the μ-oxo bridge were not observed, as previously explained, the electrochemical profile obtained during the film formation step confirms the electrodeposition of the film on the electrode surface through the formation of Ni–O–Ni bonds.
Furthermore, SERRS mapping of the 1550 cm−1 band (pyrrole C=C and C=N stretching) was performed for the SPCE/p-NiTsPc/AuNP indicating a uniform distribution (at micrometer scale), and nearly total coverage of the SPCE surface morphology with p-NiTsPc (Figure 3A). In addition, it is possible to observe some brighter regions, which indicates a greater amount of electrodeposited material.

3.2. Cyclic Voltammetry and Electrochemical Impedance Spectroscopy

Cyclic voltammetry analysis in a redox probe ([Fe(CN)6]3−/[Fe(CN)6]4−) solution was performed, indicating changes in the charge transfer (Figure 4A), which affect the effective surface area. By the Randles–Sevcik equation [36], Ip = 2.69 × 10⁵A D1/2 n3/2 v1/2C*; considering A as the effective surface area (cm2), D the diffusion coefficient of [Fe(CN)6]3− (7.6 × 10⁻⁶ cm2/s) [37,38], n the number of transferred electrons (n = 1), v the scan rate, and C* the bulk concentration of [Fe(CN)6]3− (5.0 × 10⁻⁶ mol/cm3); the effective surface area was estimated from the slope of the plot, Ip = f (v1/2) (Figure S3), being 0.004 (SPCE), 0.005 (SPCE/AuNP), 0.007 (SPCE/p-NiTsPc) and 0.011 cm2 (SPCE/p-NiTsPc/AuNP). The effective surface area indicates a better coverage for the SPCE/p-NiTsPc/AuNP, being the sum of the effective areas of the individual NiTsPc film and AuNP. Indeed, considering the cyclic voltammogram in the presence of the 5.0 mmol/L ([Fe(CN)6]3−/[Fe(CN)6]4−) probe, the SPCE/p-NiTsPc/AuNP showed the lowest peak-to-peak separation (ΔE = 128 mV) and half-wave potential (Ep/2 = 116 mV) when compared to the other electrodes (see Figure 4A and Table S2), indicating that a high surface coverage increases the charge transfer on the electrode surface.
The electrodes were characterized in the inert supporting electrolyte by cyclic voltammetry. As shown in Figure S4A the unmodified SPCE (bare SPCE) showed a significant capacitive current and a peak at −0.43 V ascribed to interaction with the O2 adsorbed in solution [39]. After the electropolymerization of p-NiTsPc, the redox couple NiII/NiIII was observed in more positive potentials (Figure S4B) when compared to the electropolymerization stage performed in basic media (Figure 1A). This dependence of redox couple NiII/NiIII on the supporting electrolyte was also observed on p-NiTsPc electrodeposited films developed by Mbokou Foukmeniok et al. [5] and Agboola et al. [40].
The reduction peak from the phthalocyanine ring (Pc reduction [29]) was also observed. After the electrodeposition of AuNP onto the p-NiTsPc surface, the redox couple NiII/NiIII vanished (Figure S4C), which suggests an interaction between the AuNP and the metal center of p-NiTsPc on the surface. Indeed, from the SEM image (Figure 2), the AuNP is distributed along the film surface. The SPCE/AuNP showed characteristic peaks for gold oxidation (Figure S4C) similar to those observed by Elias et al. [25].
The EIS measurements also indicated changes in the electron transfer of the modified electrodes in comparison to the bare SPCE. The Nyquist plot (Figure 4B) of bare SPCE and modified electrodes showed a semicircle in the high-frequency range ascribed to charge transfer control [41] and a linear part in the lower frequency range ascribed to the diffusion control [41]. The typical Randles-type circuit (inset in Figure 4B-a) fitted the experimental data of bare SPCE, SPCE/AuNP, and SPCE/p-NiTsPc/AuNP. In this circuit, the cell resistance (RΩ) is in series with a parallel combination of a constant phase element (CPE) and a charge transfer resistance (Rct) in series with a Warburg Impedance (Zw), as represented in Figure 4B-a.
For the fitting of the SPCE/p-NiTsPc experimental data, the Randles equivalent circuit was modified with the addition of a new set of a parallel combination of CPE and Rct (see Figure 4B-b). A similar circuit was used to fit the EIS data of a drop-cast film of NiTsPc developed by Kavazoi et al. [42] This suggests that NiTsPc molecules in thin film promote an additional charge transfer resistance and an increased capacitance of the electrode surface. However, the SPCE/NiTsPc film also showed a lower Rct than the bare SPCE (Rct = 597 Ω), indicating an increase in charge transfer of probe redox species.
The fitted values of the Rct decreased with the sequence AuNP (260 Ω) > p-NiTsPc (135 Ω) > p-NiTsPc/AuNP (97 Ω). All modifications showed good conductivity and superior electron transfer in relation to the bare SPCE, as expected for AuNPs [43,44] and phthalocyanine conducting films [45,46,47]. However, the SPCE/p-NiTsPc/AuNP (Rct = 97 Ω) showed a synergetic effect decreasing 84% the Rct when compared to the bare SPCE (597 Ω), i.e., increasing significantly the conductivity of the electrode surface. Indeed, the SPCE/p-NiTsPc/AuNP indicated the best charge transfer, which is in agreement with the cyclic voltammetry (Figure 4) in which the SPCE/p-NiTsPc/AuNP provided the highest magnitude of current and the lowest half-wave potential. Thus, the combination of p-NiTsPc and AuNP promotes an increased charge transfer, suggesting that the combination may have better potential as a sensing platform.

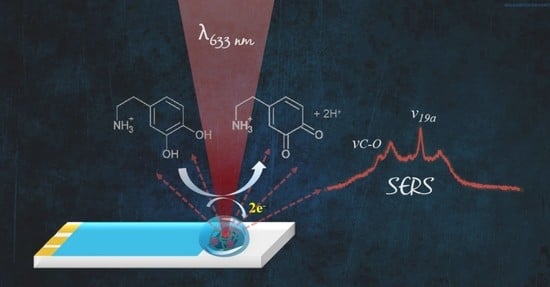
3.3. Spectroelectrochemistry of SPCE/p-NiTsPc/AuNP towards Dopamine Oxidation

The electrodeposited film was evaluated as a sensing platform for the detection of dopamine by using simultaneous Raman spectroscopy and cyclic voltammetry. The cyclic voltammogram of films in the presence of 10−4 mol/L dopamine showed only a discrete and irreversible oxidation peak at about −60 mV of dopamine to dopamine quinone [48], as shown in Figure 5A,B. However, an important decrease in the value of oxidation potential was observed when comparing the modified-SPCEs to the bare one (Figure S6A).
The bare SPCE presented a large capacitive current and in the presence of 1.0 × 10⁻⁴ mol/L dopamine, only a discrete oxidation peak current was observed (Figure S6A). Shi et al. have also observed poor electrochemical behavior for dopamine oxidation with SPCE/AuNP [49]. However, the potential depends on the electrode modification [49,50]. Despite the SPCE/AuNP presenting a discrete oxidation peak for DA (Figure 5A), an increase of almost three times the peak current was achieved with the SPCE/p-NiTsPc/AuNP (Figure 5B), indicating a synergetic effect between AuNP and NiTsPc towards dopamine oxidation. The SPCE/p-NiTsPc/AuNP also presented an increased oxidation current when compared to SPCE/p-NiTsPc (Figure S6B).
A simultaneous detection by using the application of potential and SERS was also evaluated in the presence of 10−4 mol/L of dopamine. Initially, the SERS spectra were collected at the electrode surface in the presence of a drop containing the 1.0 × 10⁻⁴ mol/L dopamine in the supporting electrolyte (0.1 mol/L KCl) with the electrochemical cell turned off (Figure 5C,D). A minimum variation of the profile spectra obtained for the dried film surface was verified (Figure 3D). However, applying a potential of −60 mV (dopamine oxidation) on only the SPCE/p-NiTsPc/AuNP and SPCE/AuNP showed the presence of two characteristic vibrational modes of dopamine. The bands at 1270 and 1483 cm−1 ascribed to C–O stretching and catechol ring breathing [51,52], respectively, were observed in the SERS spectra. Other bands from dopamine c.a. 1328 and 1428 cm−1, ascribed to (v8, C–OH) and (v19a, catechol ring breathing) [51,52], respectively, may be overlapped by the carbon bands (D band). Additionally, the SERS spectra during the application of the reduction potential at +180 mV were collected, and no Raman band from dopamine was observed. This behavior suggests that the electrochemical dopamine oxidation (and consequently the formation of quinone products) induced the adsorption of molecules on the AuNP surface possibly through the catechol group complexation and generation of the SERS signal (Scheme 2). This can be reinforced by the presence of the band at 1270 cm−1 ascribed to C–O stretching.
On the other hand, for the SPCE/p-NiTsPc/AuNP and SPCE/AuNP after a few potential cycles, the characteristic bands of dopamine (1270 and 1483 cm−1) were present even after the electrochemical cell was turned off (see Figure 5D) while, when using SPCE/p-NiTsPc, no DA band was observed after the cell was off (Figure S5). Thus, the results suggest that the DA oxidation products adsorb preferentially on the AuNP surface. Additionally, a higher SERS signal was observed for SPCE/p-NiTsPc/AuNP after the potential cycling (cell off) in comparison to the measurements carried out during the potential application.
Comparing the results from the cyclic voltammetry and SERS measurements for dopamine detection, the p-NiTsPc plays an important role in the charge transfer for dopamine oxidation, while the AuNP in the enhancement of the dopamine Raman signal (SERS signal) is due to the adsorption of DA molecules through catechol complexation on the AuNP surface, as represented by the Scheme 2.

3.4. Determination of Dopamine at the SPCE/p-NiTsPc/AuNP

Due to the high sensitivity of the differential pulse voltammetry (DPV), the calibration curve and the limit of detection were estimated by applying a 50 mV amplitude pulse within a potential range from −0.4 to 0.4 V. The calibration curve for DA detection exhibited a linear range from 1 to 10 μmol/L, as shown in Figure 6, leading to a limit of detection of 0.73 μmol/L (3xSD/Slope, SD is the standard deviation of the blank and slope from the calibration curve). The linear regression equation was expressed as Ip(μA)= 0.00438 + 0.051717 [DA](μmol/L), with R2 = 0.981, n = 5. The linear range of DA concentration as well as the limit of detection was similar for other modified electrodes using the AuNP or phthalocyanine film derivatives, the values of which are summarized in Table 1.
The decrease in the sensitivity to DA concentration higher than 10 μmol/L can be ascribed to kinetic limitation, being related to irreversible adsorption of the DA molecules at electrode surface [65,66]. Indeed, the SPCE/p-NiTsPc/AuNP even in a solution in the absence of DA also showed DA peak oxidation (Figure S7) and the SERRS spectra also showed the DA vibration at 1483 cm−1. These results are in agreement with the adsorption of DA onto an AuNP surface discussed using the spectroelectrochemical measurements.

4. Conclusions

The screen-printed carbon electrode modified with p-NiTsPc and decorated with AuNPs, both obtained by potential cycles, showed a promissory application as a platform for both electrochemical and SERS detection. The AuNP modification process was easily promoted by a few potential cycles. The characterization showed both uniform distribution and predominance of NiTsPc profile in the Raman characterization. In the voltammetry and impedance measurements in [Fe(CN)6]3−/[Fe(CN)6]4− probe, the SPCE/p-NiTsPc/AuNP showed better conductivity behavior as well as a better catalytic effect in the presence of dopamine. Regarding the in situ SERS spectra in the presence of dopamine, the characteristic bands of dopamine were observed only at −60 mV, which can be ascribed to the signal of dopamine quinone (oxidized species). Additionally, when the oxidation potential of dopamine was applied, its adsorption on the modified electrode surface allows obtaining the SERS spectra of dopamine even after the electrochemical cell is turned off. Thus, the SPCE-modified electrode showed a potential application as both an electrochemical and SERS sensing platform, where p-NiTsPc plays an important role in the electrochemical detection of dopamine, while the AuNP in the SERS dopamine signal.

Supplementary Materials

The following supporting information can be downloaded at: https://www.mdpi.com/article/10.3390/chemosensors11070372/s1, Figure S1: Cyclic voltammogram for the 1st and 50th potential cycle applied for electropolymerization of p-NiTsPc; Figure S2: SEM images of the SPCE bare, SPCE/p-NiTsPc, SPCE/p-NiTsPc/AuNP and the SPCE/AuNP; Figure S3: Variation of anodic peak current in the function of the square root of scan rate. Scan rate study performed in 5 mmol/L [Fe(CN)6]3−/[Fe(CN)6]4−. Figure S4: Cyclic voltammogram of SPCE (A) unmodified, modified with (B) p-NiTsPc, (C) AuNP, and (B) p-NiTsPc/AuNP recorded in the presence of 10−4 mol/L dopamine and containing 0.1 mol/L KCl at 50 mV/s. Figure S5: Raman spectra for SPCE/p-NiTsPc/AuNP, SPCE/AuNP, and SPCE/p-NiTsPc were collected with electrochemical cell off after the potential measurements in dopamine. Laser line at 633 nm. All the spectra were plotted with normalized intensity; Figure S6: Cyclic voltammogram recorded to (A) bare SPCE and (B) SPCE/p-NiTsPc in 0.1 mol/L KCl in the absence and presence of dopamine (10−4 mol/L). Scan rate of 50 mV/s; Table S1: Raman bands assignments for NiTsPc powder; Table S2: Peak potential, peak separation, and half-wave potential values obtained from the voltammogram shown in Figure S4. Figure S7: (A) Differential pulse voltammograms of SPCE/p-NiTsPc/AuNP in KCl 0.1 mol/L before and after measurements in DA solution. (B) SERRS spectra collected at SPCE/p-NiTsPc/AuNP after and before measurements in DA solution (cell off).

Author Contributions

Conceptualization, C.S.M., C.M.M. and H.S.K.; methodology, C.S.M., C.M.M. and H.S.K.; software, C.S.M. and C.M.M.; formal analysis, C.S.M., C.M.M. and H.S.K.; investigation, C.S.M., C.M.M. and H.S.K.; resources, C.J.L.C. and P.A.; data curation, C.S.M., C.M.M. and H.S.K.; writing—original draft preparation, C.S.M., C.M.M. and H.S.K.; writing—review and editing, C.S.M., C.M.M., C.J.L.C. and P.A.; visualization, C.S.M. and C.M.M.; supervision, C.J.L.C. and P.A.; project administration, C.J.L.C. and C.S.M.; funding acquisition, C.J.L.C. and P.A. All authors have read and agreed to the published version of the manuscript.

Funding

FAPESP (2018/22214-6, 2017/15019-0, 2020/11803-0), UNESP/PROPe, CNPq (422163/2018–0, and 316535/2021–4), CAPES, and INCT/INEO (CNPq process number 465572/2014–6, FAPESP 2014/50869–6, and CAPES 23038.000776/201754).

Institutional Review Board Statement

Not applicable.

Informed Consent Statement

Not applicable.

Data Availability Statement

The data presented in this study are available on request from the corresponding author.

Acknowledgments

The authors gratefully acknowledge the financial support granted by the FAPESP (2018/22214-6, 2017/15019-0, 2020/11803-0), UNESP/PROPe (04/2022 C.S.M and 13/2022 C.M.M), CNPq, CAPES, and INCT/INEO.

Conflicts of Interest

The authors declare no conflict of interest.

References

  1. Zhai, Y.; Zhu, Z.; Zhou, S.; Zhu, C.; Dong, S. Recent advances in spectroelectrochemistry. Nanoscale 2018, 10, 3089–3111. [Google Scholar] [CrossRef]
  2. Kaim, W.; Fiedler, J. Spectroelectrochemistry: The best of two worlds. Chem. Soc. Rev. 2009, 38, 3373–3382. [Google Scholar] [CrossRef]
  3. Dos Santos, M.F.; Katic, V.; Dos Santos, P.L.; Pires, B.M.; Formiga, A.L.B.; Bonacin, J.A. 3D-Printed low-cost spectroelectrochemical cell for in situ raman measurements. Anal. Chem. 2019, 91, 10386–10389. [Google Scholar] [CrossRef]
  4. Maringa, A.; Nyokong, T. The influence of gold nanoparticles on the electroactivity of nickel tetrasulfonated phthalocyanine. J. Porphyr. Phthalocyanines 2014, 18, 642–651. [Google Scholar] [CrossRef]
  5. Mbokou Foukmeniok, S.; Bako, R.F.Y.; Ilboudo, O.; Karanga, Y.; Njanja, E.; Pontie, M.; Tapsoba, I.; Tonle Kenfack, I.; Djouaka, R. Sensitive Carbon Fiber Microelectrode for the Quantification of Diuron in Quality Control of a Commercialized Formulation. Int. J. Anal. Chem. 2022, 2022, 9p. [Google Scholar] [CrossRef]
  6. Musa, I.; Raffin, G.; Hangouet, M.; Martin, M.; Alcacer, A.; Zine, N.; Bellagambi, F.; Jaffrezic-Renault, N.; Errachid, A. Development of a Chitosan/Nickel Phthalocyanine Composite based Conductometric Micro-sensor for Methanol Detection. Electroanalysis 2022, 34, 1–11. [Google Scholar] [CrossRef]
  7. Pereira-Rodrigues, N.; Albin, V.; Koudelka-Hep, M.; Auger, V.; Pailleret, A.; Bedioui, F. Nickel tetrasulfonated phthalocyanine based platinum microelectrode array for nitric oxide oxidation. Electrochem. Commun. 2002, 4, 922–927. [Google Scholar] [CrossRef]
  8. Xu, H.; Yang, F. The interplay of dopamine metabolism abnormalities and mitochondrial defects in the pathogenesis of schizophrenia. Transl. Psychiatry 2022, 12, 1–13. [Google Scholar] [CrossRef] [PubMed]
  9. Birtwistle, J.; Baldwin, D. Role of dopamine in schizophrenia and Parkinson’s disease. Br. J. Nurs. 1998, 7, 832–841. [Google Scholar] [CrossRef]
  10. Olmo, F.; Garoz-Ruiz, J.; Colina, A.; Heras, A. Derivative UV/Vis spectroelectrochemistry in a thin-layer regime: Deconvolution and simultaneous quantification of ascorbic acid, dopamine and uric acid. Anal. Bioanal. Chem. 2020, 412, 6329–6339. [Google Scholar] [CrossRef]
  11. González-Diéguez, N.; Colina, A.; López-Palacios, J.; Heras, A. Spectroelectrochemistry at screen-printed electrodes: Determination of dopamine. Anal. Chem. 2012, 84, 9146–9153. [Google Scholar] [CrossRef] [PubMed]
  12. Zhang, X.P.; Sun, W.; Cao, S.H.; Jiang, W.L.; Peng, H.; Cai, S.H.; Chen, Z. NMR spectroelectrochemistry in studies of dopamine oxidation. Electrochemistry 2020, 88, 200–204. [Google Scholar] [CrossRef] [Green Version]
  13. Wang, X.; Baokang, J.I.N.; Xiangqin, L.I.N. In-situ FTIR spectroelectrochemical study of dopamine at a glassy carbon electrode in a neutral solution. Anal. Sci. 2002, 18, 931–933. [Google Scholar] [CrossRef] [PubMed] [Green Version]
  14. Ibañez, D.; Santidrian, A.; Heras, A.; Kalbáč, M.; Colina, A. Study of adenine and guanine oxidation mechanism by surface-enhanced Raman spectroelectrochemistry. J. Phys. Chem. C 2015, 119, 8191–8198. [Google Scholar] [CrossRef] [Green Version]
  15. de Lucena, N.C.; Miyazaki, C.M.; Shimizu, F.M.; Constantino, C.J.L.; Ferreira, M. Layer-by-layer composite film of nickel phthalocyanine and montmorillonite clay for synergistic effect on electrochemical detection of dopamine. Appl. Surf. Sci. 2018, 436, 957–966. [Google Scholar] [CrossRef] [Green Version]
  16. Martin, C.S.; Rubira, R.J.G.; Silva, J.N.; Aléssio, P. Role of Iron Phthalocyanine Coordination in Catecholamines Detection. Surfaces 2021, 4, 323–335. [Google Scholar] [CrossRef]
  17. Martin, C.S.; Gouveia-Caridade, C.; Crespilho, F.N.; Constantino, C.J.L.; Brett, C.M.A. Iron Phthalocyanine Electrodeposited Films: Characterization and Influence on Dopamine Oxidation. J. Phys. Chem. C 2016, 120, 15698–15706. [Google Scholar] [CrossRef]
  18. Yusoff, N.; Pandikumar, A.; Ramaraj, R.; Lim, H.N.; Huang, N.M. Gold nanoparticle based optical and electrochemical sensing of dopamine. Microchim. Acta 2015, 182, 2091–2114. [Google Scholar] [CrossRef]
  19. Pérez-Morales, M.; Muñoz, E.; Martín-Romero, M.T.; Camacho, L. Anodic electrodeposition of NiTSPP from aqueous basic media. Langmuir 2005, 21, 5468–5474. [Google Scholar] [CrossRef]
  20. Li, J.; Xie, H.; Chen, L. A sensitive hydrazine electrochemical sensor based on electrodeposition of gold nanoparticles on choline film modified glassy carbon electrode. Sensors Actuators B Chem. 2011, 153, 239–245. [Google Scholar] [CrossRef]
  21. Obirai, J.; Bedioui, F.; Nyokong, T. Electro-oxidation of phenol and its derivatives on poly-Ni(OH)TPhPyPc modified vitreous carbon electrodes. J. Electroanal. Chem. 2005, 576, 323–332. [Google Scholar] [CrossRef]
  22. Rosłonek, G.; Taraszewska, J. Electrocatalytic oxidation of alcohols on glassy carbon electrodes electrochemically modified with nickel tetraazamacrocyclic complexes: Mechanism of f. J. Electroanal. Chem. 1992, 325, 285–300. [Google Scholar] [CrossRef]
  23. Trévin, S.; Bedioui, F.; Devynck, J. New electropolymerized nickel porphyrin films. Application to the detection of nitric oxide in aqueous solution. J. Electroanal. Chem. 1996, 408, 261–265. [Google Scholar] [CrossRef]
  24. Trevin, S.; Fethi, B.; Villegas, M.G.G.; Bied-Charreton, C. Electropolymerized nickel macrocyclic complex-based films: Design and electrocatalytic application. J. Mater. Chem. 1997, 7, 923–928. [Google Scholar] [CrossRef]
  25. Elias, J.; Gizowska, M.; Brodard, P.; Widmer, R.; Dehazan, Y.; Graule, T.; Michler, J.; Philippe, L. Electrodeposition of gold thin films with controlled morphologies and their applications in electrocatalysis and SERS. Nanotechnology 2012, 23. [Google Scholar] [CrossRef]
  26. Wang, Y.; Deng, J.; Di, J.; Tu, Y. Electrodeposition of large size gold nanoparticles on indium tin oxide glass and application as refractive index sensor. Electrochem. Commun. 2009, 11, 1034–1037. [Google Scholar] [CrossRef]
  27. Resmi, P.E.; Raveendran, J.; Suneesh, P.V.; Ramanchandran, T.; Nair, B.G.; Satheesh Babu, T.G. Screen-printed carbon electrode for the electrochemical detection of conjugated bilirubin. Mater. Lett. 2021, 304, 130574. [Google Scholar] [CrossRef]
  28. Mazzaracchio, V.; Tomei, M.R.; Cacciotti, I.; Chiodoni, A.; Novara, C.; Castellino, M.; Scordo, G.; Amine, A.; Moscone, D.; Arduini, F. Inside the different types of carbon black as nanomodifiers for screen-printed electrodes. Electrochim. Acta 2019, 317, 673–683. [Google Scholar] [CrossRef]
  29. Furini, L.N.; Martin, C.S.; Camacho, S.A.; Rubira, R.J.G.; Fernandes, J.D.; Silva, E.A.; Gomes, T.C.; Stunges, G.M.; Constantino, C.J.L.; Alessio, P. Electrochemical properties of nickel phthalocyanine: The effect of thin film morphology tuned by deposition techniques. Thin Solid Films 2020, 699, 137897. [Google Scholar] [CrossRef]
  30. Maximino, M.D.; Martin, C.S.; Paulovich, F.V.; Alessio, P. Layer-by-Layer Thin Film of Iron Phthalocyanine as a Simple and Fast Sensor for Polyphenol Determination in Tea Samples. J. Food Sci. 2016, 81, C2344–C2351. [Google Scholar] [CrossRef]
  31. Zucolotto, V.; Ferreira, M.; Cordeiro; Ḿarcia, R.; Constantino, C.J.L.; Balogh, D.T.; Zanatta, A.R.; Moreira, W.C.; Oliveira, O.N. Unusual interactions binding iron tetrasulfonated phthalocyanine and poly(allylamine hydrochloride) in layer-by-layer films. J. Phys. Chem. B 2003, 107, 3733–3737. [Google Scholar] [CrossRef]
  32. Aroca, R.; Martin, F. Trace analysis of tetrasulphonated copper phthalocyanine by surface enhanced Raman spectroscopy. J. Raman Spectrosc. 1986, 17, 243–247. [Google Scholar] [CrossRef]
  33. Wing, R.M.; Callahan, K.P. Characterization of metal-oxygen bridge systems. Inorg. Chem. 1969, 8, 871–874. [Google Scholar] [CrossRef]
  34. Fox, B.G.; Shanklin, J.; Ai, J.; Loehr, T.M.; Sanders-Loehr, J. Resonance Raman Evidence for an Fe-O-Fe Center in Stearoyl-ACP Desaturase. Primary Sequence Identity with Other Diiron-Oxo Proteins. Biochemistry 1994, 33, 12776–12786. [Google Scholar] [CrossRef] [PubMed]
  35. Basova, T.V.; Kiselev, V.G.; Latteyer, F.; Peisert, H.; Chassé, T. Molecular organization in the thin films of gallium(III) phthalocyanine chloride and its μ-(oxo)dimer: Optical spectroscopy and XPS study. Appl. Surf. Sci. 2014, 322, 242–248. [Google Scholar] [CrossRef]
  36. Bard, A.J.; Faulkner, L.R. Electrochemical Methods: Fundamentals and Applications, 2nd ed.; John Wiley & Sons: Hoboken, NJ, USA, 2000; ISBN 978-0-471-04372-0. [Google Scholar]
  37. Ognjanović, M.; Stanković, D.M.; Jović, M.; Krstić, M.P.; Lesch, A.; Girault, H.H.; Antić, B. Inkjet-Printed Carbon Nanotube Electrodes Modified with Dimercaptosuccinic Acid-Capped Fe3O4 Nanoparticles on Reduced Graphene Oxide Nanosheets for Single-Drop Determination of Trifluoperazine. ACS Appl. Nano Mater. 2020, 3, 4654–4662. [Google Scholar] [CrossRef]
  38. Petković, B.B.; Ognjanović, M.; Krstić, M.; Stanković, V.; Babincev, L.; Pergal, M.; Stanković, D.M. Boron-doped diamond electrode as efficient sensing platform for simultaneous quantification of mefenamic acid and indomethacin. Diam. Relat. Mater. 2020, 105, 107785. [Google Scholar] [CrossRef]
  39. Lee, J.; Murugappan, K.; Arrigan, D.W.M.; Silvester, D.S. Oxygen reduction voltammetry on platinum macrodisk and screen-printed electrodes in ionic liquids: Reaction of the electrogenerated superoxide species with compounds used in the paste of Pt screen-printed electrodes? Electrochim. Acta 2013, 101, 158–168. [Google Scholar] [CrossRef] [Green Version]
  40. Agboola, B.O.; Ozoemena, K.I.; Nyokong, T. Electrochemical properties of benzylmercapto and dodecylmercapto tetra substituted nickel phthalocyanine complexes: Electrocatalytic oxidation of nitrite. Electrochim. Acta 2006, 51, 6470–6478. [Google Scholar] [CrossRef]
  41. Brett, C.M.A.; Brett, A.M.O. Electrochemistry: Principles, Methods, and Applications; Oxford University Press: Oxford, UK, 1993; ISBN 0198553889. [Google Scholar]
  42. Kavazoi, H.S.; Martin, C.S.; Alessio, P. Comparative study of tetrasulfonated phthalocyanine modified screen-printed electrodes in paraquat. Synth. Met. 2022, 284, 116988. [Google Scholar] [CrossRef]
  43. Boonkaew, S.; Chaiyo, S.; Jampasa, S.; Rengpipat, S.; Siangproh, W.; Chailapakul, O. An origami paper-based electrochemical immunoassay for the C-reactive protein using a screen-printed carbon electrode modified with graphene and gold nanoparticles. Microchim. Acta 2019, 186. [Google Scholar] [CrossRef]
  44. Khater, M.; de la Escosura-Muñiz, A.; Quesada-González, D.; Merkoçi, A. Electrochemical detection of plant virus using gold nanoparticle-modified electrodes. Anal. Chim. Acta 2019, 1046, 123–131. [Google Scholar] [CrossRef] [Green Version]
  45. Chaiyo, S.; Mehmeti, E.; Siangproh, W.; Hoang, T.L.; Nguyen, H.P.; Chailapakul, O.; Kalcher, K. Non-enzymatic electrochemical detection of glucose with a disposable paper-based sensor using a cobalt phthalocyanine–ionic liquid–graphene composite. Biosens. Bioelectron. 2018, 102, 113–120. [Google Scholar] [CrossRef] [PubMed]
  46. Tiwari, B.R.; Noori, M.T.; Ghangrekar, M.M. Carbon supported nickel-phthalocyanine/MnOx as novel cathode catalyst for microbial fuel cell application. Int. J. Hydrogen Energy 2017, 42, 23085–23094. [Google Scholar] [CrossRef]
  47. Georgescu State, R.; Stefanov, C.; van Staden, J.K.F.; van Staden, R.I.S. Application of a Tetraamino Cobalt(II) Phthalocyanine Modified Screen Printed Carbon Electrode for the Sensitive Electrochemical Determination of L-Dopa in Pharmaceutical and Biological Samples. Electroanalysis 2021, 33, 1778–1788. [Google Scholar] [CrossRef]
  48. Cheng, H.; Qiu, H.; Zhu, Z.; Li, M.; Shi, Z. Investigation of the electrochemical behavior of dopamine at electrodes modified with ferrocene-filled double-walled carbon nanotubes. Electrochim. Acta 2012, 63, 83–88. [Google Scholar] [CrossRef]
  49. Shi, Z.; Wu, X.; Zou, Z.; Yu, L.; Hu, F.; Li, Y.; Guo, C.; Li, C.M. Screen-printed analytical strip constructed with bacteria-templated porous N-doped carbon nanorods/Au nanoparticles for sensitive electrochemical detection of dopamine molecules. Biosens. Bioelectron. 2021, 186, 113303. [Google Scholar] [CrossRef]
  50. Ibáñez-Redín, G.; Wilson, D.; Gonçalves, D.; Oliveira, O.N. Low-cost screen-printed electrodes based on electrochemically reduced graphene oxide-carbon black nanocomposites for dopamine, epinephrine and paracetamol detection. J. Colloid Interface Sci. 2018, 515, 101–108. [Google Scholar] [CrossRef]
  51. Jha, O.; Yadav, T.K.; Yadav, R.A. Structural and vibrational study of a neurotransmitter molecule: Dopamine [4-(2-aminoethyl) benzene-1,2-diol]. Spectrochim. Acta Part A Mol. Biomol. Spectrosc. 2018, 189, 473–484. [Google Scholar] [CrossRef]
  52. Figueiredo, M.L.B.; Martin, C.S.; Furini, L.N.; Rubira, R.J.G.; Batagin-Neto, A.; Alessio, P.; Constantino, C.J.L. Surface-enhanced Raman scattering for dopamine in Ag colloid: Adsorption mechanism and detection in the presence of interfering species. Appl. Surf. Sci. 2020, 522, 146466. [Google Scholar] [CrossRef]
  53. Zhao, Y.; Zhou, J.; Jia, Z.; Huo, D.; Liu, Q.; Zhong, D.; Hu, Y.; Yang, M.; Bian, M.; Hou, C. In-situ growth of gold nanoparticles on a 3D-network consisting of a MoS2/rGO nanocomposite for simultaneous voltammetric determination of ascorbic acid, dopamine and uric acid. Microchim. Acta 2019, 186, 92. [Google Scholar] [CrossRef] [PubMed]
  54. Huang, X.; Shi, W.; Bao, N.; Yu, C.; Gu, H. Electrochemically reduced graphene oxide and gold nanoparticles on an indium tin oxide electrode for voltammetric sensing of dopamine. Microchim. Acta 2019, 186, 310. [Google Scholar] [CrossRef] [PubMed]
  55. Harsini, M.; Widyaningrum, B.A.; Fitriany, E.; Paramita, D.R.A.; Farida, A.N.; Baktir, A.; Kurniawan, F.; Sakti, S.C.W. Electrochemical synthesis of polymelamine/gold nanoparticle modified carbon paste electrode as voltammetric sensor of dopamine. Chin. J. Anal. Chem. 2022, 50, 100052. [Google Scholar] [CrossRef]
  56. Ben Ali Hassine, C.; Kahri, H.; Barhoumi, H. Enhancing Dopamine Detection Using Glassy Carbon Electrode Modified with Graphene Oxide, Nickel and Gold Nanoparticles. J. Electrochem. Soc. 2020, 167, 027516. [Google Scholar] [CrossRef]
  57. Mahalakshmi, S.; Sridevi, V. In Situ Electrodeposited Gold Nanoparticles on Polyaniline-Modified Electrode Surface for the Detection of Dopamine in Presence of Ascorbic Acid and Uric Acid. Electrocatalysis 2021, 12, 415–435. [Google Scholar] [CrossRef]
  58. Uppachai, P.; Srijaranai, S.; Poosittisak, S.; Md Isa, I.; Mukdasai, S. Supramolecular Electrochemical Sensor for Dopamine Detection Based on Self-Assembled Mixed Surfactants on Gold Nanoparticles Deposited Graphene Oxide. Molecules 2020, 25, 2528. [Google Scholar] [CrossRef]
  59. Sipuka, D.S.; Arotiba, O.A.; Sebokolodi, T.I.; Tsekeli, T.R.; Nkosi, D. Gold-dendrimer Nanocomposite Based Electrochemical Sensor for Dopamine. Electroanalysis 2023, 35. [Google Scholar] [CrossRef]
  60. Luo, Q.; Su, Y.; Zhang, H. Sensitive dopamine sensor based on electrodeposited gold nanoparticles and electro-modulated MoS2 nanoflakes. J. Iran. Chem. Soc. 2023, 20, 731–738. [Google Scholar] [CrossRef]
  61. Pari, M.; Reddy, K.R.V.; Fasiulla, K.B.C. Amperometric determination of dopamine based on an interface platform comprising tetra-substituted Zn2+ phthalocyanine film layer with embedment of reduced graphene oxide. Sensors Actuators A Phys. 2020, 316, 112377. [Google Scholar] [CrossRef]
  62. Luhana, C.; Mashazi, P. Simultaneous Detection of Dopamine and Paracetamol on Electroreduced Graphene Oxide–Cobalt Phthalocyanine Polymer Nanocomposite Electrode. Electrocatalysis 2023, 14, 406–417. [Google Scholar] [CrossRef]
  63. Luhana, C.; Moyo, I.; Tshenkeng, K.; Mashazi, P. In-sera selectivity detection of catecholamine neurotransmitters using covalent composite of cobalt phthalocyanine and aminated graphene quantum dots. Microchem. J. 2022, 180, 107605. [Google Scholar] [CrossRef]
  64. Mounesh; Malathesh, P.; Praveen Kumara, N.Y.; Jilani, B.S.; Mruthyunjayachari, C.D.; Venugopala Reddy, K.R. Synthesis and characterization of tetra-ganciclovir cobalt (II) phthalocyanine for electroanalytical applications of AA/DA/UA. Heliyon 2019, 5, e01946. [Google Scholar] [CrossRef] [PubMed] [Green Version]
  65. Mazloum-Ardakani, M.; Beitollahi, H.; Ganjipour, B.; Naeimi, H.; Nejati, M. Electrochemical and catalytic investigations of dopamine and uric acid by modified carbon nanotube paste electrode. Bioelectrochemistry 2009, 75, 1–8. [Google Scholar] [CrossRef]
  66. Wang, H.-S.; Li, T.-H.; Jia, W.-L.; Xu, H.-Y. Highly selective and sensitive determination of dopamine using a Nafion/carbon nanotubes coated poly(3-methylthiophene) modified electrode. Biosens. Bioelectron. 2006, 22, 664–669. [Google Scholar] [CrossRef]
Scheme 1. (A) Schematic representation of the electrode modification, step 1: the electropolymerization of NiTsPc, and step 2: the electrodeposition of AuNP. Highlighting the chemical structure of NiTsPc monomer and the formation of dimers during the electropolymerization step through μ-oxo bridges between two moieties of NiTsPc (Ni–O–Ni). (B) Schematic representation of electrode and laser focus configuration for spectroelectrochemical measurements. Highlighting the dopamine oxidation at the electrode surface.
Chemosensors 11 00372 sch001
Figure 1. Cyclic voltammograms of (A) electropolymerization of the p-NiTsPc film on the SPCE by immersion into 2.0 mmol/L NiTsPc in 0.1 M NaOH solution in a potential range from 0 to 1.3 V and scan rate of 100 mV/s. First potential cycle and the 50th potential cycle are showed as red and green line, respectively. Inset: magnification of 50th potential cycle for electropolymerization of p-NiTsPc; (B) electrodeposition of AuNP onto the SPCE/p-NiTsPc by two potential cycles between −1.0 and 0.2 V at 100 mV/s in 0.5 mmol/L HAuCl4 in 0.1 mol/L KCl solution as a supporting electrolyte.
Chemosensors 11 00372 g001
Figure 2. SEM images of the bare SPCE and the SPCE/p-NiTsPc/AuNP, and the distribution size of the electrodeposited AuNP at SPCE/p-NiTsPc/AuNP.
Chemosensors 11 00372 g002
Figure 3. (A) SERRS mapping of the 1550 cm−1 band for SPCE/p-NiTsPc/AuNP superimposed on the optical image. (B) Raman spectra for bare SPCE, resonance Raman spectra for SPCE/p-NiTsPc, SERS spectra for SPCE/AuNP, and SERRS spectra for SPCE/p-NiTsPc/AuNP. (C) Resonance Raman spectra for NiTsPc powder. Laser line at 633 nm. All the spectra were plotted with normalized intensity and baseline correction. R* in (B) represents the resonance Raman (SPCE/pNiTsPc), Raman(SPCE), SERS (SPCE/AuNP), or SERRS (SPCE/pNiTsPc/AuNP) depending on the surface from which the spectra were collected.
Chemosensors 11 00372 g003
Figure 4. (A) Cyclic voltammogram at 50 mV/s and (B) Nyquist plot (complex plane impedance spectra) in OCP for bare SPCE and modified SPCE/p-NiTsPc, SPCE/AuNP and SPCE/p-NiTsPc/AuNP in 5 mmol/L [Fe(CN)6]3−/[Fe(CN)6]4− probe solution. Inset: the equivalent electrical circuit used to fit the impedance spectra for the (a) SPCE bare, SPCE/AuNP, SPCE/p-NiTsPc/AuNP, and (b) SPCE/p-NiTsPc.
Chemosensors 11 00372 g004
Figure 5. Cyclic voltammogram of (A) SPCE/AuNP and (B) SPCE/p-NiTsPc/AuNP recorded in 10−4 mol/L dopamine solution in 0.1 mol/L KCl at 50 mV/s. (C) SERS spectra of SPCE/AuNP and (D) SERRS spectra of SPCE/NiTsPc/AuNP electrode surface in the presence of 10−4 mol/L dopamine solution. Spectra collected with electrochemical cell off before the potential application, with constant applications of −60 and 180 mV and cell off after the measurements.
Chemosensors 11 00372 g005
Scheme 2. Representation of the electrochemical oxidation of dopamine to dopamine–quinone at the electrode interface and adsorption of dopamine intermediate species on AuNP surface during the applied potential of −60 mV.
Chemosensors 11 00372 sch002
Figure 6. (A) Differential pulse voltammograms of SPCE/p-NiTsPc/AuNP in KCl 0.1 mol/L with addition of DA: 1, 2.5, 5.0, 7.5, 10, 25 and 50 μmol/L. (B) Plots of current intensities against DA concentration. The red dashed line represents the linear regression obtained between 1 and 10 μmol/L, and the grey dot line represents the second linear range between 10 and 50 μmol/L.
Chemosensors 11 00372 g006
Table 1. Comparison of performance of SPCE/p-NiTsPc/AuNP and sensors based on modification with AuNP or phthalocyanine film derivatives.
Electrode ModifierLinear Range
(μmol/L)
Limit of Detection (μmol/L)Ref.
3D-MoS2/rGO/Au 0.3–198.30.11[53]
ErGO-AuNP/ITO0.02–2000.015[54]
AuNPs/polymelanine/CPE0.1–110.067[55]
GCE/EG-Ni-Au(NPs)0.2–1000.10[56]
GCE/PANI/AuNPs20–10016.0[57]
TBABr/SDS⋅AuNPs/GO/GCE0.02–1.00.01[58]
GCE-PPI-AuNPs0.1–1250.16[59]
AuNPs/1T-MoS2/GCE0.2–800.16[60]
GCE/rGO−Zn(II)TPEBiPc0.05–0.80.0016[61]
GCE-ERGO/polyCoTAPc 2.0–1000.095[62]
Au-IPA-AmGQD-CoTCPhOPc1.0–500.20[63]
CoTGPc/GCE2–121.0[64]
Disclaimer/Publisher’s Note: The statements, opinions and data contained in all publications are solely those of the individual author(s) and contributor(s) and not of MDPI and/or the editor(s). MDPI and/or the editor(s) disclaim responsibility for any injury to people or property resulting from any ideas, methods, instructions or products referred to in the content.

