Article

Haptoglobin Electrochemical Diagnostic Method for Subclinical Mastitis Detection in Bovine Milk

by
Soledad Carinelli
1,
Iñigo Fernández
1,*,
José Luis González-Mora
1,2 and
Pedro A. Salazar-Carballo
1
1
Laboratory of Sensors, Biosensors and Advanced Materials, Faculty of Health Sciences, University of La Laguna, Campus de Ofra s/n, 38071 La Laguna, Spain
2
Instituto Universitario de Neurociencia (IUNE), University of La Laguna, 38071 La Laguna, Spain
*
Author to whom correspondence should be addressed.
Chemosensors 2023, 11(7), 378; https://doi.org/10.3390/chemosensors11070378
Submission received: 20 April 2023 / Revised: 27 June 2023 / Accepted: 29 June 2023 / Published: 6 July 2023
(This article belongs to the Special Issue Electrochemical Biosensors and Bioassays Based on Nanomaterials)

Abstract

:
This work proposes an outstanding screening magneto-bioassay for the early identification of bovine subclinical mastitis. Haptoglobin (Hp) was used as a promising biomarker for the diagnosis of subclinical mastitis. To this end, novel chitosan-modified magnetic particles, coated with haemoglobin-modified polyaniline (MNPs@Chi/PANI-Hb), have been integrated in a sensitive electrochemical Hp bioassay. Haemoglobin was used as bioreceptor due to its high affinity against Hp. The appropriateness of their synthesis and their modifications were demonstrated by XRD, FT-IR spectroscopy, thermogravimetry and N2 adsorption–desorption analyses. After the optimization of the experimental parameters the main analytical features were obtained showing excellent performance. The electrochemical biosensor in milk matrix presented a dynamic range of 0.001 to 0.32 μg mL−1 with a detection limit of 0.031 μg mL−1, a value much lower than the normal Hp values in bovine milk, making it highly suitable for such determinations. Finally, real milk samples, obtained from local dairy farmers, were analysed by the electrochemical bioassay and compared against a commercial ELISA kit for Hp detection. Milk samples were correctly classified as “acceptable” or “unacceptable” milk considering the Hp concentration obtained with the proposed bioassay, confirming its excellent predictive capacity for subclinical mastitis diagnosis.

1. Introduction

Mastitis is the most common infection in mammals and is highly prevalent in dairy cattle [1,2]. Mastitis is an inflammatory process of the mammary gland because of the entry of microorganisms into the gland through the teat canal [3,4]. It can be caused by several microorganisms, such as bacteria, fungi, virus, mycobacteria, among others. However, such infections can also be promoted by physical damage produced by milking, poor hygienic practices, and by different environmental factors [5]. According to the symptoms, mastitis is classified as subclinical mastitis, when there are no obvious alterations in the udder or in the milk; or as clinical mastitis, when pain, redness, and inflammation is observed in the udder, as well as changes in the milk, such as a foul smell, discoloured serum, and the presence of clots and/or blood.
The economic losses from mastitis in the dairy industry are incalculable and include direct costs related to diagnosis, medication, veterinary services, infection of other cows, personal care, discarded milk and occasional deaths [1,2]. Moreover, there are many other indirect costs generated by mastitis infections, such as a future decrease in milk yield, reduced reproduction, culling of continually infected cows and replacement of mastitic cows in some cases [6]. Preventive measures and management may reduce the economic impact that this infection has on dairy farming. Mastitis management improves the economic efficacy by control programs that could include routine tests since early detection of the disease prevents its transmission to other cows and shortens the treatment times and leads to faster recovery for the animals [7].
The diagnosis of acute mastitis is mainly based on indicators during a physical examination, such as inflammation of the udder and abnormalities in the milk. However, the diagnosis of subclinical mastitis requires the isolation and identification of the causative agent or the detection of inflammation markers in milk, such as the elevated presence of somatic cells [8]. A lack of any manifestation complicates the subclinical mastitis diagnosis, and specific tests are then necessary for mastitis diagnosis. The California test is the most widely used diagnostic tool in the dairy industry for the detection of mastitis in cattle. The California test qualitatively estimates the number of somatic cells in milk using a detergent and a pH indicator. The test is based on the reaction of the detergent that lyses the cells, causing the release of DNA that tends to agglutinate, forming gels. Thus, the degree of gelling is used as an indicator of the number of somatic cells present in the milk, with the reading being a visual parameter. In addition, the pH is an additional indicator since normal milk tends to be acidic, while mastitic milk tends to be alkaline. Although this test is rapid, simple, and economical, the results are interpreted subjectively, depending on the experience of the person doing the test. Furthermore, false positives are common in young animals or in cows with age-related depleted milk production, and it shows false negatives in acute clinical mastitis since the some microorganisms causing the infection release toxins that destroy somatic cells [9,10].
The development of a new and quick diagnosis, which can be integrated into the animal management, is still a challenge in dairy farming. Moreover, a good understanding of mastitis infection is crucial for the development of an integrated control program [11]. An approach that meets these requirements was presented by Oliveira et al.: They developed a non-invasive diagnostic tool for mastitis based on measurement of cow udder temperature by infrared thermography [12]. However, such technology faces obstacles, such as the udder surface temperature variation between the months of the year.
Due to their great veterinary interest, new target molecules and many different detection methods have been investigated and developed as mastitis diagnostic tools [13,14,15]. Over the last ten years, several biomarkers have been used for the identification of bovine mastitis, such as genomic and proteomic analyses, the level of enzymes associated with the diseases, acute-phase protein concentrations, and specific miRNAs, among others [16,17].
Although some commercial tests are currently available in the market for enzymatic activity detection related with mastitis, they still present low diagnostic sensitivities [18]. Another alternative for the early diagnosis of mastitis is the quantification of some acute-phase proteins (APPs), which are produced by the immune system in response to the infection [11]. APPs have been defined as proteins whose concentrations markedly increase/decrease during the inflammatory process [19,20]. APPs are now important biomarkers for the diagnosis of different diseases in both the veterinary and human health fields. These proteins include C-reactive protein, α1- acid glycoprotein, α1-antitrypsin, fibrinogen and ceruloplasmin, serum amyloid A (SAA), and haptoglobin (Hp), with the last two being the major APPs in ruminants that change their concentration over 100 times after infection/inflammation [21,22]. In addition, they have been demonstrated to be good prognostic biomarkers of mastitis in milk [23].
Otsuka et al. have developed rapid turbidimetric latex particle agglutination immunoassays for three APPs (SAA, Hp, and α1-acid glycoprotein). This assay showed low sensitivity for Hp and α1-acid glycoprotein and was performed on bovine blood, not milk matrices [24]. More recently, Bassols et al. have designed a immunoturbidimetric assay for bovine Hp and α-trypsin inhibitor heavy chain H4, also intended for serum analysis [25]. An SPR sensor for the detection of Hp using haemoglobin as a bioreceptor molecule was developed by Akerstedt et al. This sensor presented a limit of detection (LOD) of 1.1 µg mL−1. However, when the detection efficiency of the sensor was compared to a commercial ELISA kit for Hp, the quantification of Hp by the sensor was lower than by ELISA [26]. The underestimation was attributed, according to the authors, to the possible interference of blood impurities in the milk. Finally, Nirala et al. have been working intensively on the development of a chemiluminescent method based on modified magnetic nanoparticles (MNPs) for the detection of haptoglobin [27,28]. However, most of these methods are still used only in research and have not reached clinical veterinary practice due to time-consuming, troublesome, and costly methods of analysis.
The development of electrochemical biosensors becomes an important growth area to satisfy the demand of rapid, user-friendly, and “real time” devices in the environmental and health fields. Biosensor technology has the potential to speed up detection and to increase specificity and sensitivity due to the use of highly specific bioreceptors. Moreover, electrochemical transduction offers the advantages of high sensitivity, which can be enhanced by attaching biocatalytic labels to bioreceptor-target complexes, thereby, amplifying the detection signal. Furthermore, electrochemical transduction is easily miniaturized and has a low cost of production, as it does not require expensive read-out instrumentation [29].
Since the commercialization of the first commercial electrochemical sensor, also known as a glucometer, various electrochemical biosensor platforms have been established, from typical catalytic biosensors to self-powered or fully biodegradable sensor platforms. The implementation of nanomaterials has contributed to the fabrication of biosensors with improved characteristics through transduction surface modification, electrical signal amplification, or biofunctionalization.
This work presents a simple electrochemical screening bioassay based on polyaniline-modified nanoparticles for subclinical mastitis detection. The use of biofunctionalized magnetic nanomaterials and the electrochemical detection systems provide an economically accessible technology for the readout of the analytical signal and offer the versatility and simplicity of the use of the MNPs for separation and labelling purposes. The MNPs were synthesized in our laboratory and modified with haemoglobin for integration into the Hp-sensing platform. The different stages of the synthesis as well as their biofunctionalization were evaluated using the most common characterization techniques. After determining the main analytical parameters, such as the linear range, limit of detection, and sensitivity, the ability to confirm a diagnosis for cows suspected of having subclinical mastitis as a function of Hp concentration in real samples was compared to a commercial ELISA kit for bovine Hp.

2. Materials and Methods

2.1. Reagents and Solutions

Bovine haptoglobin was obtained from MyBioSource (Cat No. MBS563276). Primary and alkaline phosphatase (ALP)-modified secondary anti-Hp antibodies (Cat. No. PA1-29740 and A16151, respectively) were purchased from Invitrogen (Waltham, MA, USA). Bovine Haptoglobin ELISA kit (Cat. No. ab137977) was obtained from Abcam (Cambridge, UK). The milk samples were obtained from local dairy farms, which were provided by the Department of Agriculture and Livestock Farming of the Canary Islands Government. Other analytical reagents, such as haemoglobin from bovine blood, naphthyl phosphate monosodium salt monohydrate, bovine serum albumin, Iron (III) chloride (FeCl3), Iron (II) sulphate heptahydrate (FeSO4·7H2O), sodium hydroxide (NaOH), concentrated hydrochloric acid (HCl), aniline, glutaraldehyde (25% w/v), ammonium persulfate (APS), glacial acetic acid (CH3COOH), ethanol, chitosan, and Trizma® Base were acquired from Sigma-Aldrich.
The composition of the buffer solutions are detailed in the Supplementary Materials.

2.2. Instrumentation

The voltametric and impedimetric measurements were carried out on commercial screen-printed electrodes (SPCE, Cat No. DRP-110, Dropsens, Oviedo, Spain) using a portable biopotentiostat DRP-STAT-i-400 purchased from Dropsens (Metrohm Dropsens, Oviedo, Spain). The data were analysed using DropView 8400 software (2009 version). The washings of the magnetic particles were performed using the DynaMag™ (Cat. No. 12321D, Invitrogen), facilitating the magnetic separation of the MNPs from the supernatant by attracting them to a side wall of the tube where the magnet was located.
Magnetic nanoparticles were characterized by thermogravimetric analyses using a Perkin Elmer Pyris Diamond TG/DTA apparatus. A panalytical X’Pert Pro diffractometer was used to obtain X-ray diffraction (XRD) diffractogram, while Fourier-transform infrared spectroscopy (FT-IR) analyses were performed with respect to air using a Jasco FT/IR-6800 IRT-7200 spectrophotometer. The surface area, pore size distribution, and pore volume were evaluated by N2 adsorption–desorption isotherms using a TriStar II analyser (Micromeritics) at 77.3 K. The evaluation of the correct synthesis and chemical modification of the MNPs surface was done by studying their interfacial properties by cyclic voltammetry (CV) and electrochemical impedance spectroscopy (EIS).

2.3. Synthesis and Functionalization of the Polyaniline Coated Magnetic Nanoparticles

Polyaniline-modified magnetic nanoparticles (MNPs@Chi/PANI) were obtained by coprecipitation, and according to [30], with some modifications (for details see the Supplementary Materials). In a second step, MNPs@Chi were functionalized with polyaniline (PANI). To do this, MNPs@Chi (2 g) and aniline monomer (0.5 g) were added to 100 mL of water under stirring conditions, and the pH value was adjusted to 2 with 1 M HCl. After waiting forty-five minutes, to improve the dispersion and solution of the reactants, 0.6 g of ammonium persulfate (APS) were added, and the solution was stirred at room temperature overnight. The APS/aniline ratio was selected at 1.2. This value was chosen according to the optimum range value (1–1.3) previously reported in the literature [31,32]. After finishing the reaction, the MNPs@Chi/PANI nanocomposite was decanted using a permanent magnet and rinsed completely with water, water/ethanol (1:1 v/v%), and ethanol (three times each). Finally, the MNPs@Chi/PANI nanocomposite was dried at 60 °C for 24 h and stored in a desiccator before use.

2.4. Biofunctionalization of the Polyaniline Coated Magnetic Nanoparticles

MNPs@Chi/PANI were functionalized with glutaraldehyde for the covalent immobilization of the biorecognition element. To do this, 100 mg of the magnetic beads were dispersed in a stirred 10% v/v glutaraldehyde solution (10 mL) at room temperature for 12 h. The Glutaraldehyde-modified nanocomposite (MNPs@Chi/PANI-Glut) was then decanted and washed three times with water and resuspended at 20 mg mL−1 in water. For clarification purposes, the nomenclature used for this adduct will be MNPs@Chi/PANI.
MNPs@Chi/PANI were biofunctionalized with haemoglobin (Hb) as follows: 200 µL of MNPs@Chi/PANI were added to 1 mL haemoglobin in phosphate-buffered solution at pH 7.4. In order to optimize the biofunctionalization, different parameters were evaluated (for details see Section 3.2). Hb was incubated overnight while under agitation conditions at 25 °C. Non-reacted Hb was removed by three washing steps. Finally, Hb-modified nanoparticles (MNPs@Chi/PANI-Hb) were redispersed in PBS to a concentration of 20 mg mL−1 and stored at 4 °C until use.

2.5. Electrochemical Determination of Haptoglobin Using MNPs@Chi/PANI-Hb

The Hp determination in milk by electrochemical sensing was performed in three steps as depicted in Figure 1. One hundred microliters of sample were incubated with 200 μg of MNPs@Chi/PANI-Hb for 40 min at 37 °C in Tris incubation buffer. At this stage, haptoglobin binds to the haemoglobin on the surface of the MNPs and remains attached to them. The second step involves immunolabeling with the primary antihaptoglobin antibody and immunoenzymatic labelling by incubating 1 μg mL−1 of anti-Hp and 2 μg mL−1 of ALP-conjugated secondary antibody for 40 min at 37 °C in Tris incubation buffer. After each incubation step, the sample matrix as well as the excess reagent were removed by two washing steps with 200 μL of washing buffer. Prior to the last step, the sample was conditioned in Tris buffer at pH 9, as this is the optimum pH for the ALP enzyme. Finally, the Hp concentration was indirectly determined by electrochemical detection of ALP activity. Thus, the higher the amount of Hp in the milk sample, the higher the immunoenzymatic labelling and therefore the higher the enzyme activity. For this purpose, the sample was incubated at room temperature with 5 mM of 1-naphthyl phosphate as the enzyme substrate. After five minutes of reaction, the solution was transferred to the SPCE surface for electrochemical determination. The production of 1-napthol (electroactive product) was determined by differential pulse voltammetry (DPV) from −0.15 to 0.6 V (scan rate of 0.05 V/s, pulse amplitude 0.7 V, pulse width 0.007 V, time pulse 50 ms).
The concentrations of reagents, as well as different quality analytical parameters, were evaluated in order to select the optimal conditions that would give the highest sensitivity and the shortest assay time.

2.6. Sample Preparation

Raw milk samples were provided by the Department of Agriculture and Livestock Farming of the Canary Islands Government. The samples were collected from Friesian cows at local dairy farms in 10 mL sterile containers and refrigerated until they were transported to the laboratory, where they were analysed within twenty-four hours. A volume of 5 mL was centrifuged at 2000× g for 10 min, and the samples were stored at 4 °C until analysis.

2.7. Bovine Haptoglobin Determination by ELISA Kit

The Hp concentration of milk samples was quantified using a bovine haptoglobin ELISA kit according to the manufacturer’s instructions. Briefly, a calibration curve was performed by preparing different Hp standard solutions. Milk samples were fifty-fold diluted with 1X Diluent buffer and were tested in duplicate following the protocol recommendations. Finally, the Hp concentration of the milk samples was estimated using the calibration curve.

3. Results and Discussion

3.1. Characterization of MNPs@Chi/PANI Core–Shell Nanoparticles

Chitosan-modified magnetic nanoparticles (MNPs@Chi) were modified with PANI according to previous works [30] (see above). During the polymerization reaction, the nanocomposite changed from a brown (MNPs@Chi) to black (MNPs@Chi/PANI) colour, confirming the correct formation of the core–shell structure. In addition, different characterization techniques were used to obtain the chemical and phase composition as well as the morphological features of the obtained nanocomposite.
Figure 2a shows the diffractogram obtained for the MNPs@Chi and MNPs@Chi/PANI nanoparticles (for comparison purposes, the diffractogram for nonmodified MNPs is also shown). Based on the thick diffraction lines obtained in all configurations, we can intuit the similar and small grain size of all nanoparticles. Diffraction peaks at 30.1°, 35.5°, 43.2°, 53.6°, 57.3°, and 62.9° were assigned to the (220), (311), (400), (422), (551), and (440) Bragg reflections of the maghemite phase (γ-Fe2O3), respectively. Moreover, all configurations showed a polycrystalline nature and the typical diffractograms of the cubic inverse spinel structures [33,34]. The mean average crystallite size (β) was estimated using the Scherrer equation:
L = k ·   λ β · c o s   θ
where L is the mean average crystallite size; k is a shape factor that depends on parameters, such as the shape of the crystal and the Miller index of the reflection plain, and normally has a value of 0.94; λ is the X-ray wavelength (0.154 nm); β is the full-width at half maximum (FWHM) of the selected diffraction peak; and θ is the Bragg angle in degrees. The mean average crystallite size of the three nanoparticles were calculated according to the FWHM values of the 331 XRD line (2θ = 35.5°) and using Equation (1). The three configurations presented similar results with a mean average crystallite size of about 8 nm.
Figure 2b shows the FT-IR spectra for the MNPs@Chi/PANI nanoparticles. The spectra for unmodified MNPs, Chi, and PANI are also shown for comparison (individual material descriptions are found in the Supplementary Materials). The FT-IR spectrum for MNPs@Chi/PANI shows two absorption peaks ca. 1570 and 1490 cm−1, which were assigned to the quinoid and benzene rings, respectively [31], proving the correct polymerization of PANI on the surface of the nanoparticles. The peak centred at 1300 cm−1 was assigned to the stretching vibration of C-N bonds from the secondary aromatic amines from Chi. In addition, another two chitosan absorption bands were observed at around 1040 cm−1 (C-O-C stretching) [35,36,37] and 960 cm−1 (C-H bond ring vibrations) [30]. Finally, the peak at about 600 cm−1 was assigned to Fe-O stretching vibrations. All these features confirmed the correct hybrid nature of the MNPs@Chi/PANI nanocomposite, with the slight shift of the Chi and PANI absorption peaks being attributed to their strong interaction with the surface of the MNPs.
The chemical composition and thermal stability for the MNPs@Chi/PANI nanocomposite was studied by thermogravimetric analysis. MNPs (Figure 3a, orange line) showed a 6% of weight loss in the range of 50–700 °C with two endothermic peaks at ca. 100 °C and 325 °C that can be attributed to the loss of moisture and other physically adsorbed molecules [38,39]. The thermogram for MNPs@Chi (Figure 3b, pink line) showed different steps of weight loss. The first one (<150 °C) was ascribed to the loss of moisture. However, the other ones, at higher temperatures, were related to the degradation of the organic structure of the chitosan and represented ca. 22% of the total mass of the nanoparticles. Furthermore, thermogravimetric for MNPs@Chi/PANI showed a weight loss of 5%, in the range of 50–200 °C, related to the evaporation of water. The second and third events represent a weight loss of about 12 and 16%, respectively, and were attributed to the degradation of the polysaccharide chains of chitosan and to the degradation of PANI [30,40,41,42,43]. This analysis verified the appropriate modification of the MNPs with Chi and PANI, with an organic mass contribution of about 28% of the total mass of the nanocomposite. Our data showed that PANI presented a small weight contribution (ca. 6%) of the total mass of the nanocomposite.
The surface properties, such as surface area analysis and pore size distribution, of the MNPs@Chi/PANI were studied using the Brunauer–Emmett-Teller (BET) and Barrett–Joyner–Halenda (BJH) methods, respectively [44]. Figure 3b shows the N2 adsorption/desorption isotherm for MNPs@Chi/PANI. The experimental isotherm of the sample (Figure 3b) showed a hysteresis loop, corresponding to the type IV isotherms according to the IUPAC classification, and confirmed the presence of a mesoporous structure [45]. Finally, the BET surface area and the BJH pore size were calculated as being about 83.7 m2 g−1 and 4 nm, respectively.
Finally, the evaluation of the correct synthesis and chemical modification of the MNP surface was done by studying their interfacial properties by means of CV and EIS. To this, the MNPs, supported in an SPE with a permanent magnet, were immersed in a 5 mM ferri/ferro-cyanide ([Fe (CN)6]3−/4−) redox probe solution supplemented with 0.1 M KCl. Figure 4 shows the voltammogram (Figure 4a) and the Nysquist curves (Figure 4b) for the different MNP configurations. Therefore, the peak current, in CV, and the semicircle portion (related to electron transfer processes on the MNPs surface), in EIS, were used as indicators of the adequate modification of the MNPs. Bare MNPs and the final configuration (MNPs@Chi/PANI-Hb) were included in this study for comparative purpose. Bare MNPs showed a lower peak current (ca. 104 µA) and a higher RÇct value (ca. 924.3 Ω). This value suggests a relatively sluggish electron transfer process and weaker electrostatic interactions between hydroxyl groups (-OH), present on the surface of the MNPs, and the redox couple. On the other hand, chitosan-modified MNPs showed a considerable increase in peak current (ca. 115 µA) and a decrease in R ct (628.8 Ω). These observations confirmed an enhanced electron transfer kinetic and stronger electrostatic interactions between the amino group (-NH2), from chitosan, and the redox probe. With the new MNPs@Chi/PANI configuration, the peak current further increased (ca. 129 µA), and the Rct value decreased (ca. 279.4 Ω). This fact implies an improved electron transfer process and stronger electrostatic interaction, likely due to the enhanced surface area and conductivity properties of the polyaniline shell. Finally, the Hb-modified MNPs (MNPs@Chi/PANI-Hb), which were deactivated with BSA, exhibited a slight decrease in peak current (ca. 117 µA) and a slightly increased Rct value (ca. 406.4 Ω). This result confirmed the adequate immobilization of the Hb and the deactivation of remanent aldehyde groups (from glutaraldehyde) with BSA, suggesting that the presence of theses biomolecules may slightly hinder the electron transfer kinetics and alter the surface interactions with the redox couple.

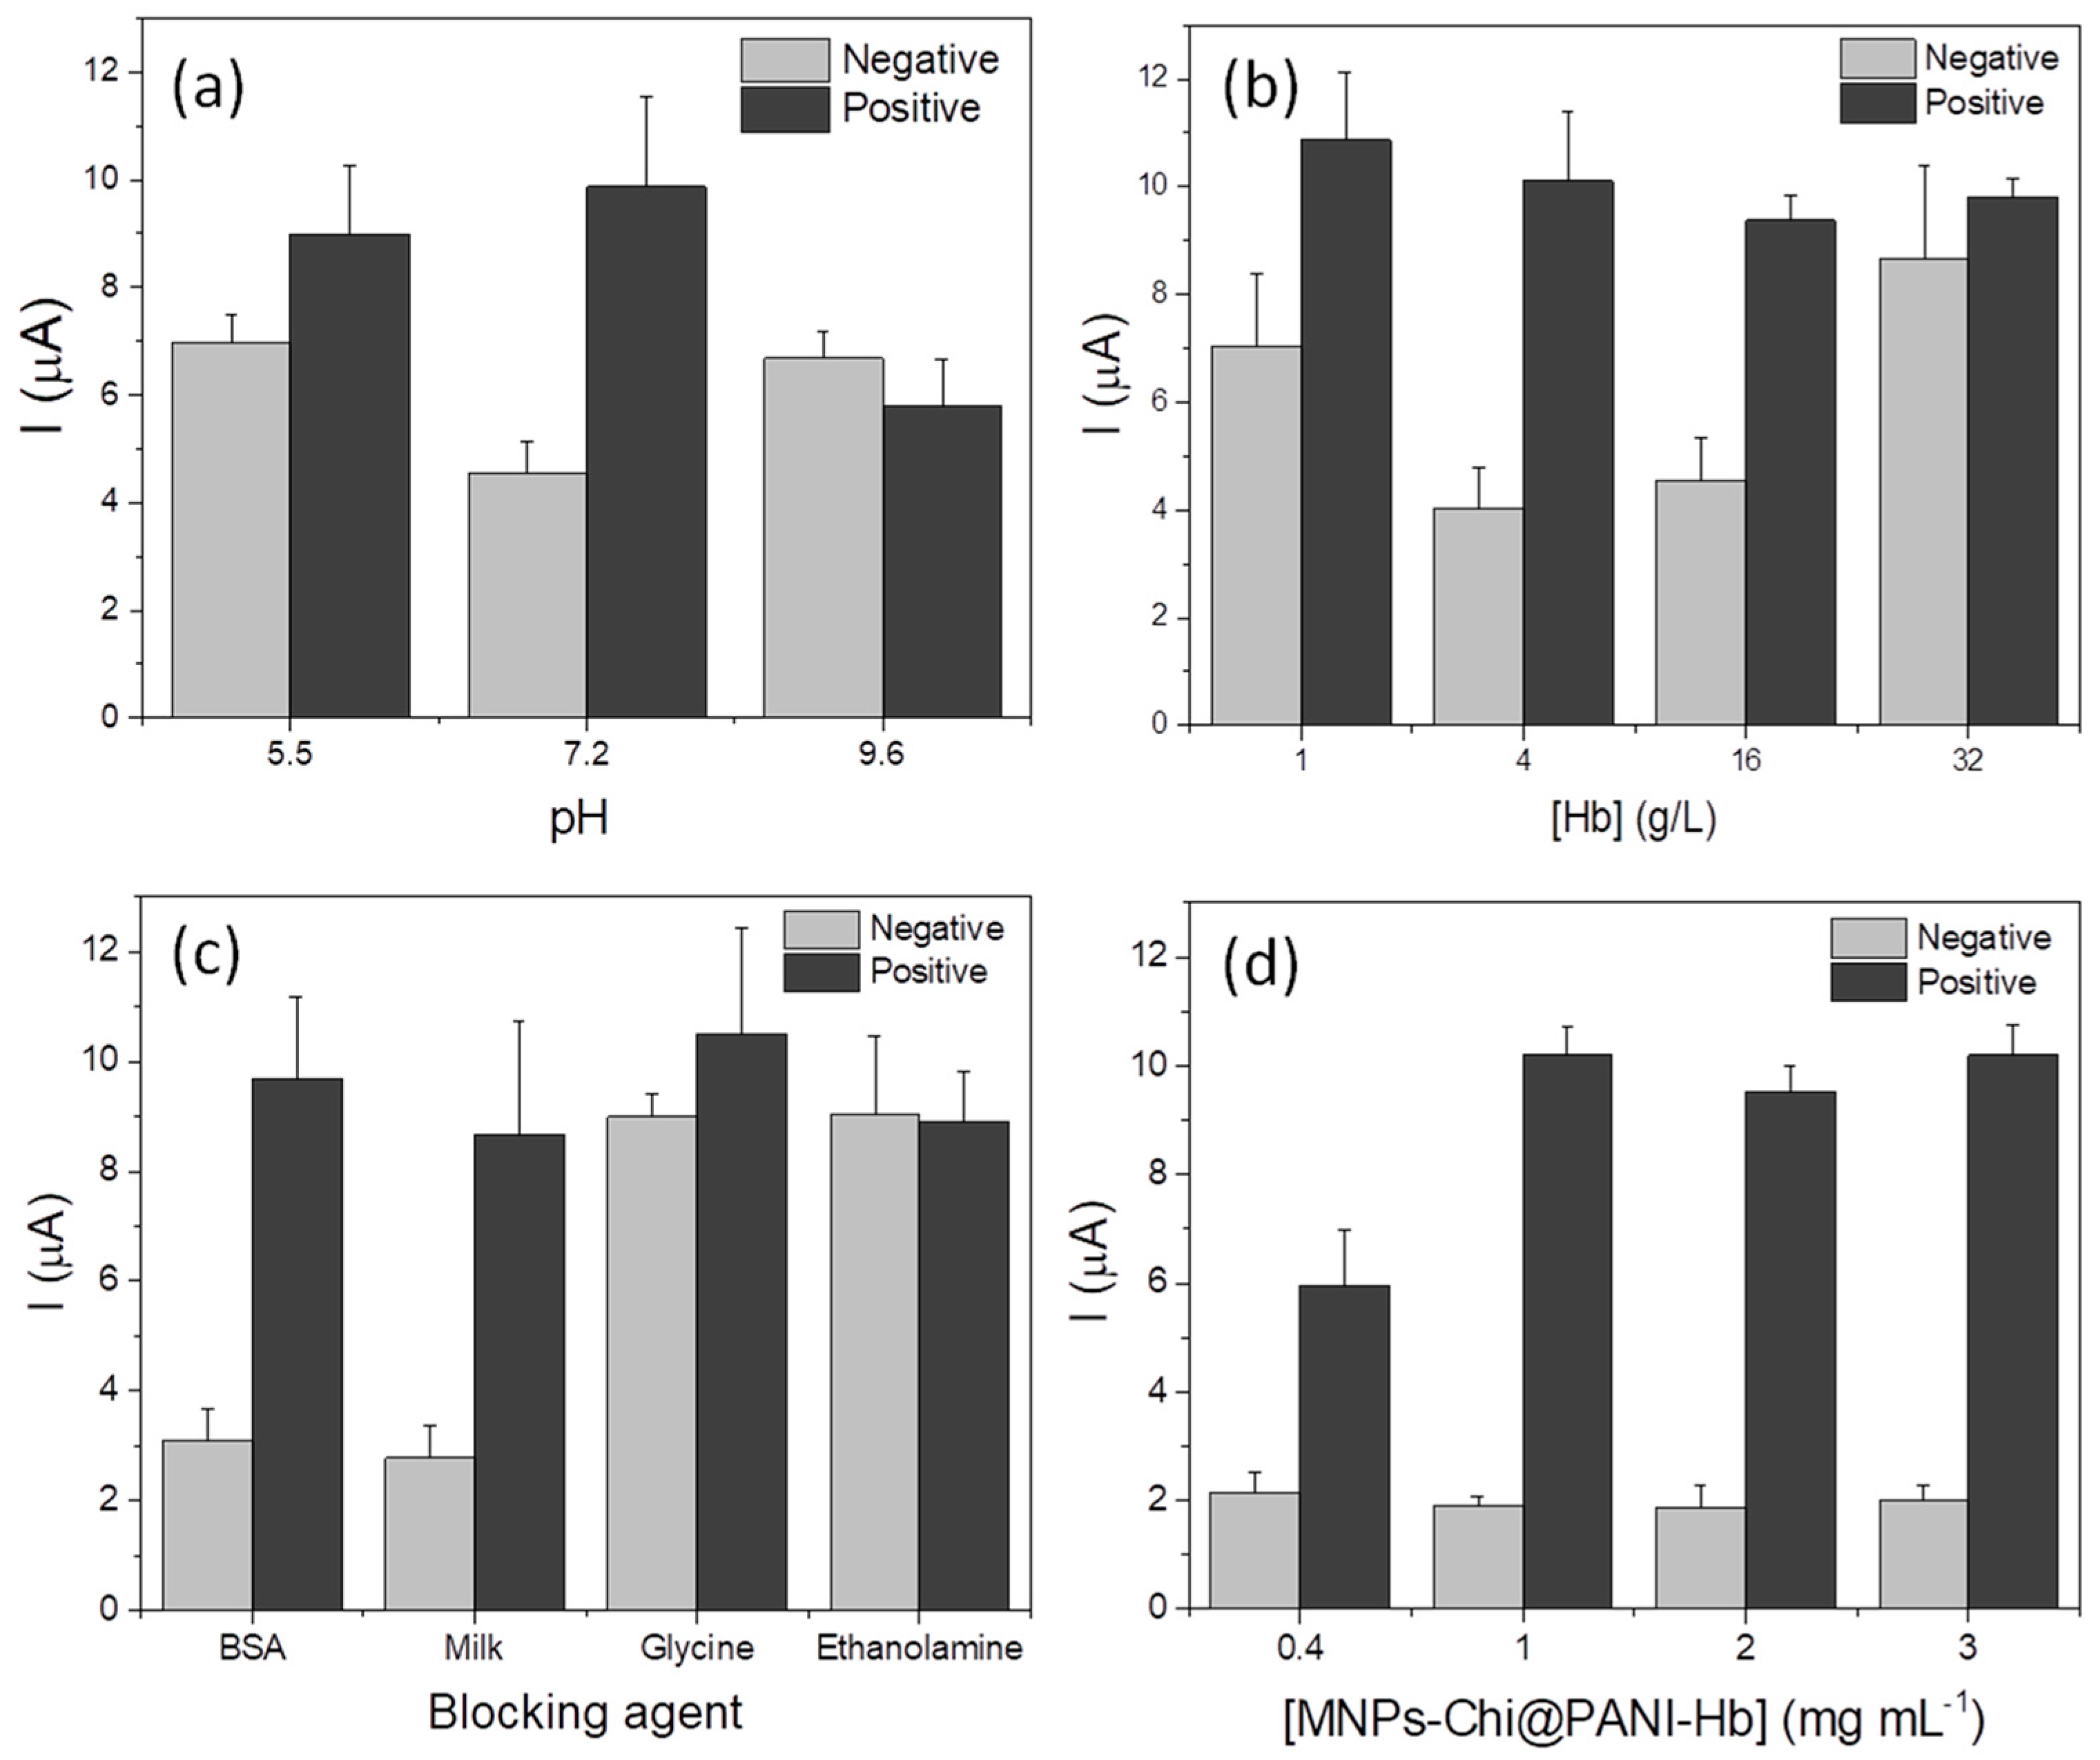
3.2. Optimization of Biofunctionalization of the MNPs@Chi/PANI with Hemoglobin

The covalent binding of haemoglobin (Hb) to the MNPs surface was performed using glutaraldehyde as a linker due to its high reactivity, low cost, and high availability. Glutaraldehyde can react with different functional groups of proteins and via different reaction mechanisms (amine, thiol, phenol and imidazole groups, aldol condensation, Michael-type addition, among others), generating more stable chemical and thermal crosslinking than other aldehydes [46].
The correct functionalization of haemoglobin on MNPs@Chi/PANI was optimized by evaluating the following factors: (1) the pH of the conjugation reaction; (2) the amount of Hb immobilized; (3) the blocking agents; and (4) the magnetic bead concentration used in the bioassay.
Figure 5 shows the results obtained after the evaluation of each parameter. The experimental details for each test are described in Supplementary Materials. The signal:background ratio (S/B) was used to select the optimum condition.
Figure 5a shows the results of the pH optimization. As can be seen, haemoglobin bioconjugation at a neutral pH gives the best conditions (being S/B about of 1.3, 2.6, and 0.87 for pHs 5.5, 7.2, and 9.6, respectively). This may be explained by the fact that the conjugation pH value is very close to the isoelectric point of Hb, which favours the insolubilization of the enzyme and therefore its immobilization with glutaraldehyde while maintaining its conformation and catalytic activity [46].
The evaluation of the amount of haemoglobin used for the modification of MNPs@Chi/PANI is shown in Figure 5b. It shows that a low and very high protein concentration promotes nonspecific binding and result in low S/B values. A low protein concentration favours intramolecular crosslinking, increasing the likelihood that the functional groups of different glutaraldehyde molecules will react with the same haemoglobin molecule [46]. According to these results, the biofunctionalization of magnetic particles was carried out with a 4 g L−1 Hb solution defined as the optimum protein concentration.
An essential and indispensable step in any surface modification strategy is the blocking of the remaining reactive groups after their biofunctionalization with the molecule of interest. In order to minimize the unspecific binding, four blocking agents, such as 2% BSA, 5% non-fat dry milk, 5% ethanolamine (adjusted to pH 7.4), and 0.5 M glycine were studied (see Figure 5c). The best results were obtained when using 2% BSA, obtaining almost the same S/B as with milk (being 3.12 and 3.10, respectively) but with a higher positive signal.
The concentration of MNPs@Chi/PANI-Hb used in the bioassay was evaluated from 0.4 to 3 mg mL−1. Figure 5d shows that at low MNP concentrations, the electrochemical response is lower, possibly because this amount is not enough to achieve the total Hp capture. At MNP concentrations higher than 1 mg mL−1, the electrochemical response does not change, indicating that the capture of the Hp in the sample is total. Thus, the optimal MNP concentration was defined as 2 mg mL−1 to ensure that all Hp is retained on the MPs in samples with concentrations higher than the one used in this optimization (0.34 μg mL−1).
Finally, the stability of MNPs@Chi/PANI-Hb was estimated by analysing 0.34 ng mL−1 of Hp on different days over a period of one month using the same MNPs@Chi/PANI-Hb stock, which was stored at 4 °C in PBS buffer. The covalent modification of the particles was stable for at least one month when stored at 4 °C in PBS buffer free of stabilizers and preservatives (Figure S1). After this period of time, both a decrease in the target signal and an increase in the nonspecific signal were observed, probably due to the binding of haemoglobin to the functional groups of the particles becoming unstable or due to a possible denaturation of the haemoglobin.
Other parameters, such as the concentration of the labelling antibody and incubation time, were optimized, and the results and discussions are shown in the Supplementary Materials (Figure S2). Moreover, other parameters, such as substrate concentration, enzymatic reaction time, evaluation of non-specific adsorption, have also been studied (data shown in Supplementary Materials, Figure S3).

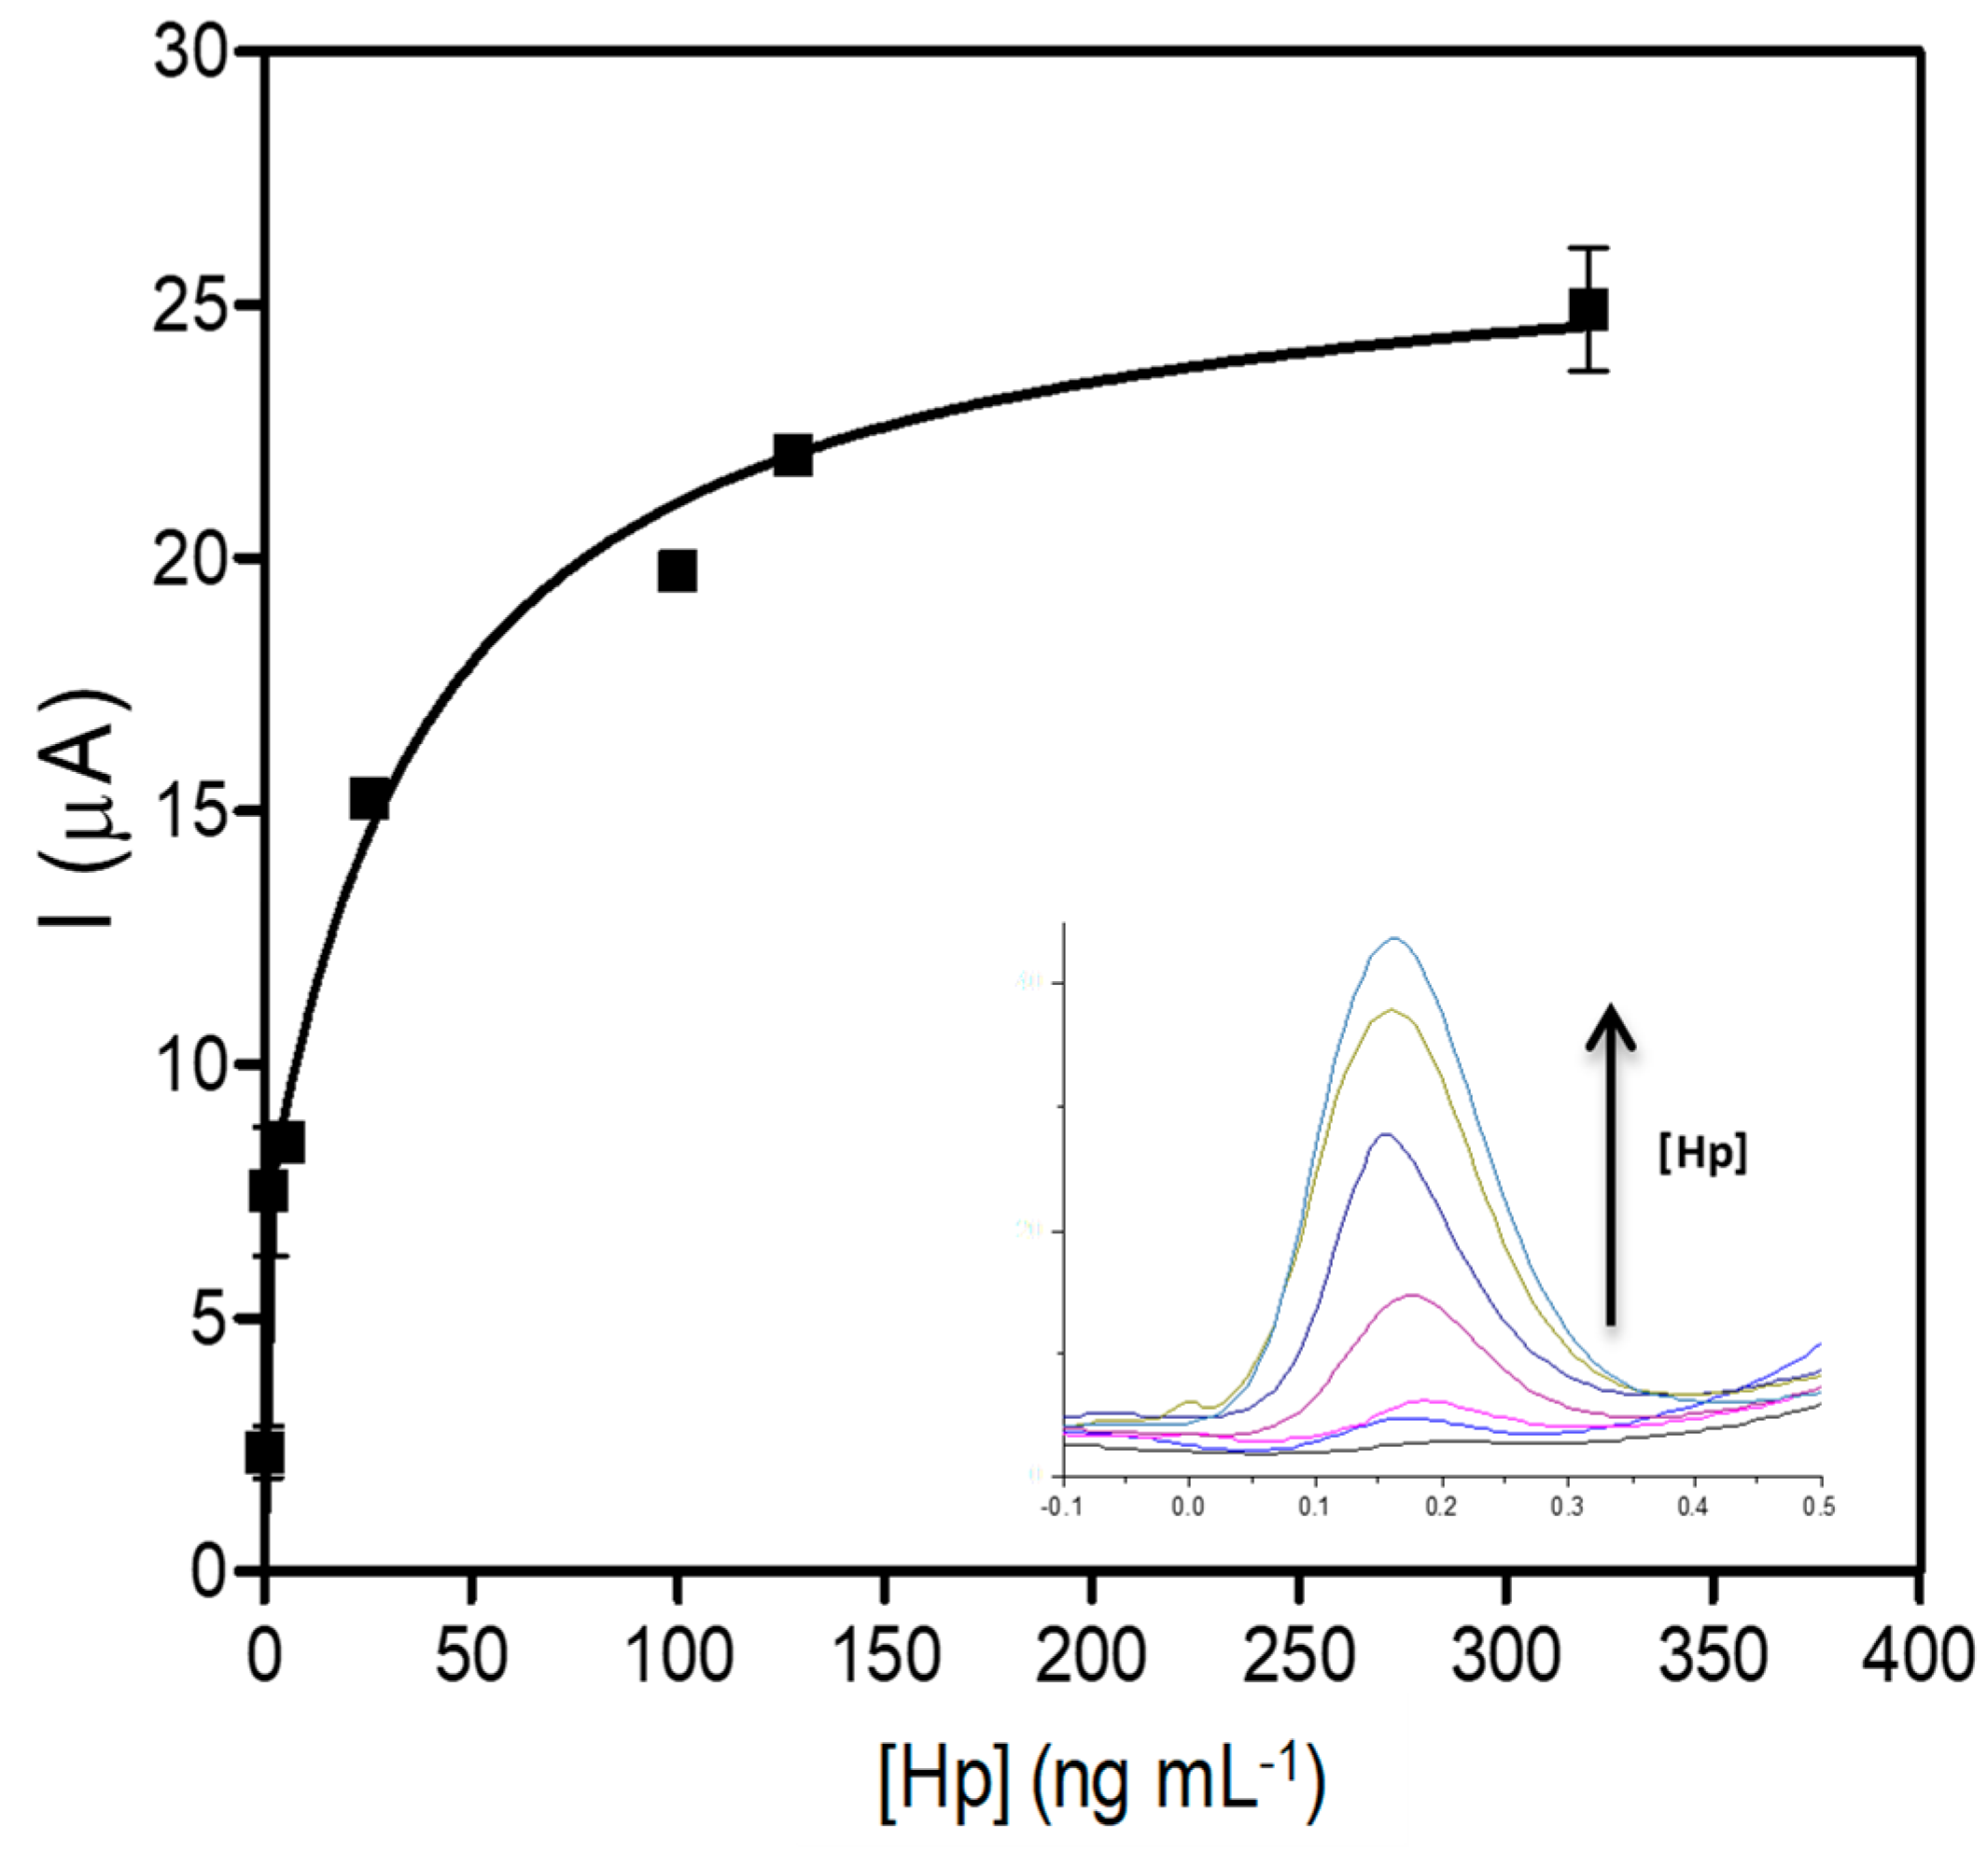
3.3. Calibration Curve for the Electrochemical Hp Detection

A calibration curve was prepared to evaluate the electrochemical detection of Hp in Tris buffer in the dynamic range from 0.02 to 0.25 μg mL−1 in triplicate. The mean signal was fitted versus Hp concentration using a linear regression (R2 = 0.996) (see Figure S4 for details). The sensor sensitivity for the electrochemical Hp was estimated at 76 ± 2 μA/(μg mL−1). The LOD was defined as the mean signal value of the blank plus three times its standard deviation (SD) and was estimated by processing eight negative (blank) samples. Thus, the LOD for bovine Hp in Tris buffer in the electrochemical bioassay was 1.3 ng mL−1.

3.4. Matrix Effect of Milk on Bioassay Performance

Since milk matrices contain a large number of compounds, including sugars, fatty acids, and some proteins, the effect of this matrix on the assay performance was evaluated. These compounds could affect the sensitivity of the methods as they interfere or block the signal due to nonspecific interactions with the surfaces, with the reagents, or even with the target molecule.
A parallelism test was performed to assess potential matrix effects using a serial dilution of the study sample. Three Hp samples were prepared in a milk matrix at the same Hp concentration as the buffer matrix for this study. Consequently, a spiked Hp sample was prepared, and from it, two 5-fold serial dilutions were prepared. To bring the measurements within the detection range, a 100-fold dilution of the samples in Tris buffer was performed, considering the observed sensitivity of the technique from the calibration curve. The same dilution protocol was applied to the samples prepared in Tris buffer. Figure 6 illustrates that the signal obtained from the samples prepared in milk is lower compared to the signal from the Hp samples in the buffer solution. This effect decreases as the concentration of Hp in the sample increases. This demonstrates that the milk components interfere with the detection of Hp, resulting in a decrease in the analytical signal, particularly at low and medium Hp concentrations. The matrix affects the determination of low Hp samples as the background from the milk endogenous compounds could hinder the Hp determination.
Due to the clear impact of the endogenous components in the sample matrix on the analyte response, it is recommended to use the same matrix as the sample when constructing the calibration curve. Therefore, a new calibration curve was generated using a milk solution that closely resembles the composition of an actual milk sample (achieved by diluting milk 100-fold in Tris buffer). This new calibration curve covers the dynamic range of 0.001 to 0.32 μg mL−1, as it is shown in Figure 7. The data were fitted using a nonlinear asymmetric regression (R2 = 0.9623), and the LOD for the nonlinear asymmetric regression was defined as the mean signal value of the blank plus three times its standard deviation (SD), and was estimated by processing eight negative (blank) samples. This value was then interpolated from the asymmetric five-parameter equation [47,48]. Thus, the LOD for Hp detection by the electrochemical bioassay was estimated at 0.031 μg mL−1.
The performance of the electrochemical Hp detection was compared to different bovine Hp detection strategies developed in the last 5 years, as well as to other relevant works. The main features (assay format, detection system, bioreceptor, detection range, LOD, and matrix) of each strategy are detailed in Table 1. The reported methods for Hp detection include different readouts from turbimetric [25,49], colorimetric [50,51] and (chemi)luminescence [27,52] detection, among others. Moreover, the LOD reported are in accordance with the complexity of these strategies. For example, the simplest strategies, such as colorimetry or turbidimetry, report higher LOD than the more sophisticated ones (milli/micrograms per millilitre vs. nano/picograms per millilitres). On the other hand, impedimetric or luminescent detection systems have reported extraordinarily high sensitivity for the detection of Hp (pico/femtograms per millilitre) [27,53]. However, most of them have been designed for the detection of haptoglobin in bovine serum as this acute-phase protein is increased during acute inflammation related to respiratory infections. In addition, many of them have not been tested on real samples. Thus, the method presented here reports an intermediate detection limit among previous studies; however, the sensitivity results very adequate for mastitis detection since the normal Hp level in bovine milk is two orders of magnitude higher than the LOD of the biosensor.
The validation of the bovine Hp biosensor for mastitis diagnosis was performed by testing nine bovine milk samples from healthy and sick cows provided by the Department of Agriculture and Livestock Farming of the Canary Islands Government. The determination of Hp was performed on the one hand by using a commercial ELISA kit (standard method) for Hp quantification and on the other hand by an electrochemical biosensor using the proposed adducts: MNPs@Chi/PANI for the classification of milk as “acceptable” or “unacceptable”. In both cases, a calibration curve was prepared to estimate the Hp concentration/mastitis status. In the case of the electrochemical biosensor, a cut-off current (Icut-off) was defined as the current generated by 10 μg mL−1 of Hp when analysed using this strategy. This value was based on the milk Hp values reported by Life Diagnostic Company (Cow Haptoglobin ELISA, Hapt-11; Life Diagnostics Inc., West Chester, PA, USA). The Hp levels in normal milk ranged from 5.8 to 6.6 µg ml−1, with an average of 6.09 ± 0.33 µg ml−1, while the Hp concentrations in milk from cows with mastitis ranged from 11.6 to 194.5 µg ml−1, with an average of 121.6 ± 90.7 µg ml−1. This current value was used to classify real milk sample into two groups: “acceptable” (Isample < Icut-off) or “unacceptable” (Isample > Icut-off). Table 2 shows the results of the sample quantification using the standard method (Hp ELISA kit) and their classification obtained with the Hp biosensing strategy, while Figure 8 shows the sample distribution regarding the cut-off current (red line). It can be observed that four milk samples coming from healthy cows were correctly classified as “acceptable” milk (true negatives, corresponding to samples 4, 5, 8, and 9), four milk samples coming from mastitic cows were correctly classified as “unacceptable” milk (true positives, corresponding to samples 1, 2, 3, and 7), and one milk sample coming from a mastitic cow was classified as “ambiguous” sample (false negative, corresponding to sample 6).
The metrics of the mastitis screening biosensor were calculated according to the Contingency Table. Parameter definitions for qualitative validation are described in the Supplementary Materials. Thus, the electrochemical biosensor for Hp presents 100% specificity, 80% sensibility, and 88.9% accuracy for mastitis detection in bovine milks based on Hp determination.
These results show the excellent efficiency of the biosensor in the milk classification by estimating the concentration of Hp, as demonstrated by comparing it with the standard method, allowing for the identification of mastitic cows by simple milk analysis. The electrochemical biosensor let the rapid identification of suspected mastitis cows, their removal from milking, and subsequent confirmation of the diagnosis. This fact allows for rapid preventive actions to limit the spread of mastitis to other cows and the avoidance of disposing large quantities of milk. Thus, its diagnostic capacity and the low LOD achieved by this strategy are comparable with other published works (Table 1) [26,54].
Many strategies and sensor platforms for the diagnosis of subclinical mastitis have been described in the literature. However, only a small number of papers have compared and validated the results obtained versus the Hp standard method. Nirala et al. have presented a chemiluminescent (CL) assay using Hb as a bioreceptor [27]. The inhibition of peroxidase activity when Hp binds to Hb was the principle used for Hp quantification. This assay presented one of the lowest limits of detection described in the literature (0.89 pg mL−1). Furthermore, this strategy was compared to the ELISA method, and although the CL method slightly overestimates Hp concentrations in the sample, it has great potential for use in mastitis diagnosis. Another example is the immunosensor developed by X. Tan et al. This device incorporated gold electrodes modified with anti-Hp antibodies on L-cysteine self-assembled layers [55]. The sensor exhibited a wide linear range (15–100 μg mL−1) and an excellent LOD of 0.63 μg mL−1. This strategy was tested on twenty real samples and compared with an ELISA kit, and although the Wilcoxon single-rank test showed no significant differences and satisfactory agreement, the authors report that the assay has practical problems with samples with high Hp concentrations, and there were differences between both methods that increase with increasing Hp concentrations (Bland–Altman difference plot showed R = 0.3304; slope −0.1255). Similar results were reported by M. Akerstedt et al. in the development of an affinity sensor for Hp based on SPR technology, showing an LOD of 1.1 μg mL−1 [26]. They found good agreement during the analysis of milk samples and the comparison of the results with the standard method. However, biosensor results were generally lower than ELISA, and the difference between the two methods seemed to increase with increasing Hp concentrations. Moreover, the Wilcoxon single-rank test indicates that the two methods disagree significantly (p < 0.001). Another simple and promising work was the colorimetric origami paper device presented by X. Weng et al. [51]. This is a paper-based test for the rapid detection (10 min total assay time) of Hp within a concentration range of 10 to 400 μg mL−1 with a LOD of 28 μg mL−1. This assay has been tested and used for the detection of Hp in serum samples and compared with ELISA detection showing excellent agreement and satisfactory recoveries (from 104–110%). However, no sample milks were tested.
Finally, the repeatability and reproducibility of Hp detection was calculated by measuring an Hp sample of 0.34 μg mL−1 Hp six times for one week to estimate each parameter. The relative standard deviation for the same Hp sample measurements performed on the same day (repeatability) was 6.7%, while the reproducibility (relative standard deviation of the means obtained on different days) was 11.8%.

4. Conclusions

Chitosan-modified magnetic particles coated with haemoglobin-modified polyaniline (MNPs@Chi/PANI-Hb) were synthesized and characterized for their integration into a sensitive electrochemical bioassay for the early mastitis detection by using the haptoglobin in bovine milk. Our data confirmed the adequate synthesis, biofunctionalization, and application of the proposed nanocomposite for Hp biosensing applications. The accuracy and validation, with real samples, of the bioassay were evaluated and compared with the ELISA standard method for Hp, demonstrating the excellent predictive capacity of the biosensing strategy. According with these results, the proposed method could be a promising diagnostic tool for the early detection of bovine mastitis and may reduce its economic impact on the dairy industry.

Supplementary Materials

The following are available online at https://www.mdpi.com/article/10.3390/chemosensors11070378/s1. Figure S1. Stability of MNPs@Chi/PANI-Hb. Each measurement was performed in triplicate with 0.34 g mL−1. The upper and lower dashed lines correspond to the (Mean ± SD)Day 1.; Figure S2. Evaluation of the incubation times and the secondary antibody concentration. (a) Incubation steps of target isolation and labelling for 10, 20, 30, and 40 min each. (b) Labelled antibody (Ab-ALP) optimization evaluated from 0.2 to 10 μg mL−1. Tests were performed with 0.34 g mL−1 (positive) and without (negative) Hp solution. In all cases, the concentration of reagents was 200 μg MNPs-Chi@PANI-Hb and 1 g mL−1 Ab1. Figure S3. Enzymatic reaction optimization. (a) Specific and nonspecific binding of the antibodies to the components of the assay in presence and absence of the target; (b) Reaction progression of 1-naphthyl hydrolysis by alkaline phosphatase enzyme; (c) Enzymatic substrate optimization (1-naphthyl concentration) evaluated in presence and absence of Hp (1μg mL−1). Figure S4. Calibration curve for haptoglobin in Tris buffer by the electrochemical determinations (n = 3).; Table S1. Optimization of the enzymatic substrate. Current obtained for the four naphthyl phosphate concentration in presence (1 g mL−1) and absence (negative control) of haptoglobin.; Table S2. Design of the contingency table and organization of the validation information for estimating quality parameters of the assay [56,57,58,59,60,61,62].

Author Contributions

Conceptualization, P.A.S.-C. and J.L.G.-M.; methodology, S.C. and I.F., validation, S.C., formal analysis, P.A.S.-C. and S.C.; investigation, S.C., P.A.S.-C. and J.L.G.-M.; data curation, S.C., P.A.S.-C. and J.L.G.-M.; writing—original draft preparation, P.A.S.-C. and S.C.; writing—review and editing, S.C., P.A.S.-C., I.F and. J.L.G.-M.; visualization, P.A.S.-C. and S.C.; supervision, P.A.S.-C.; funding acquisition, P.A.S.-C., J.L.G.-M. and S.C. All authors have read and agreed to the published version of the manuscript.

Funding

This work was supported by INMUNOMAST project, and financed by Fundación CajaCanarias/Fundación la Caixa, (2019SP30), and by Interreg MAC 2014–2020 program (project: MacBioidi 2). The authors are grateful for the help provided by the Area de Ganadería y Agricultura of Canary Government. Soledad Carinelli gratefully acknowledges the financial support of the “Juan de la Cierva Programme” (FJC2020-043734-I) financed by the “Ministerio de Ciencia e Innovación” and the “Agencia Estatal de Investigación” of the Spanish Government.

Institutional Review Board Statement

Not applicable.

Informed Consent Statement

Not applicable.

Data Availability Statement

The data presented in this study are available on request from the corresponding author.

Conflicts of Interest

The authors declare no conflict of interest.

References

  1. Petrovski, K.R.; Trajcev, M.; Buneski, G. A review of the factors affecting the costs of bovine mastitis. J. S. Afr. Vet. Assoc. 2006, 77, 52–60. [Google Scholar] [CrossRef] [Green Version]
  2. Seegers, H.; Fourichon, C.; Beaudeau, F. Production effects related to mastitis and mastitis economics in dairy cattle herds. Vet. Res. 2003, 34, 475–491. [Google Scholar] [CrossRef] [Green Version]
  3. Abb-Schwedler, K.; Maeschli, A.; Boss, R.; Graber, H.U.; Steiner, A.; Klocke, P. Feeding mastitis milk to organic dairy calves: Effect on health and performance during suckling and on udder health at first calving. BMC Vet. Res. 2014, 10, 267. [Google Scholar] [CrossRef]
  4. Neculai-Valeanu, A.S.; Ariton, A.M. Udder health monitoring for prevention of bovine mastitis and improvement of milk quality. Bioengineering 2022, 9, 608. [Google Scholar] [CrossRef] [PubMed]
  5. Van Soest, F.J.S.; Santman-Berends, I.M.G.A.; Lam, T.J.G.M.; Hogeveen, H. Failure and preventive costs of mastitis on Dutch dairy farms. J. Dairy Sci. 2016, 99, 8365–8374. [Google Scholar] [CrossRef] [PubMed] [Green Version]
  6. Reshi, A.A.; Husain, I.; Bhat, S.A.; Rehman, M.U.; Razak, R.; Bilal, S.; Mir, M.u.R. BOVINE MASTITIS AS AN EVOLVING DISEASE AND ITS IMPACT ON THE DAIRY INDUSTRY. Int. J. Curr. Res. Rev. 2015, 7, 48–55. [Google Scholar]
  7. Halasa, T.; Huijps, K.; Østerås, O.; Hogeveen, H. Economic effects of bovine mastitis and mastitis management: A review. Vet. Q. 2007, 29, 18–31. [Google Scholar] [CrossRef]
  8. FAO. Impact of Mastitis in Small Scale Dairy Production Systems; FAO: Rome, Italy, 2014. [Google Scholar]
  9. Corbellini, C.N. La mastitis bovina y su impacto sobre la calidad de la leche. In Seminario Internacional de Competitividad en Leche y Carne (3: Argentina); Memorias; INTA: Castelar, Argentina, 2002; pp. 251–263. [Google Scholar]
  10. Bedolla, C.; Castañeda, V.; Wolter, W. Métodos de detección de la mastitis bovina (Methods of detection of the bovine mastitis). Redvet 2007, 9. [Google Scholar]
  11. Hussein, H.A.; El-Razik, K.A.E.-H.A.; Gomaa, A.M.; Elbayoumy, M.K.; Abdelrahman, K.A.; Hosein, H.I. Milk amyloid A as a biomarker for diagnosis of subclinical mastitis in cattle. Vet. World 2018, 11, 34–41. [Google Scholar] [CrossRef] [Green Version]
  12. Oliveira, A.; Reis, E.; Ferraz, P.; Barbari, M.; Santos, G.; Cruz, M.; Silva, G.; Silva, A. Infrared thermography as a technique for detecting subclinical bovine mastitis. Arq. Bras. Med. Veterinária Zootec. 2023, 74, 992–998. [Google Scholar] [CrossRef]
  13. Addis, M.F.; Tedde, V.; Puggioni, G.M.G.; Pisanu, S.; Casula, A.; Locatelli, C.; Rota, N.; Bronzo, V.; Moroni, P.; Uzzau, S. Evaluation of milk cathelicidin for detection of bovine mastitis. J. Dairy Sci. 2016, 99, 8250–8258. [Google Scholar] [CrossRef] [Green Version]
  14. Mansor, R.; Mullen, W.; Albalat, A.; Zerefos, P.; Mischak, H.; Barrett, D.C.; Biggs, A.; Eckersall, P.D. A peptidomic approach to biomarker discovery for bovine mastitis. J. Proteom. 2013, 85, 89–98. [Google Scholar] [CrossRef] [Green Version]
  15. Åkerstedt, M.; Waller, K.P.; Larsen, L.B.; Forsbäck, L.; Sternesjö, Å. Relationship between haptoglobin and serum amyloid A in milk and milk quality. Int. Dairy J. 2008, 18, 669–674. [Google Scholar] [CrossRef] [Green Version]
  16. Chakraborty, S.; Dhama, K.; Tiwari, R.; Iqbal Yatoo, M.; Khurana, S.K.; Khandia, R.; Munjal, A.; Munuswamy, P.; Kumar, M.A.; Singh, M. Technological interventions and advances in the diagnosis of intramammary infections in animals with emphasis on bovine population—A review. Vet. Q. 2019, 39, 76–94. [Google Scholar] [CrossRef] [PubMed] [Green Version]
  17. Leroux, C.; Pawlowski, K.; Billa, P.-A.; Pires, J.A.; Faulconnier, Y. Milk fat globules as a source of microRNAs for mastitis detection. Livest. Sci. 2022, 263, 104997. [Google Scholar] [CrossRef]
  18. Martins, S.A.; Martins, V.C.; Cardoso, F.A.; Germano, J.; Rodrigues, M.; Duarte, C.; Bexiga, R.; Cardoso, S.; Freitas, P.P. Biosensors for on-farm diagnosis of mastitis. Front. Bioeng. Biotechnol. 2019, 7, 186. [Google Scholar] [CrossRef]
  19. Engler, R. Acute-phase proteins in inflammation. Comptes Rendus Seances Soc. Biol. Ses Fil. 1995, 189, 563–578. [Google Scholar]
  20. Jain, S.; Gautam, V.; Naseem, S. Acute-phase proteins: As diagnostic tool. J. Pharm. Bioallied Sci. 2011, 3, 118. [Google Scholar] [CrossRef]
  21. Tothova, C.; Nagy, O.; KOVAC, G. Acute phase proteins and their use in the diagnosis of diseases in ruminants: A review. Vet. Med. 2014, 59, 163. [Google Scholar] [CrossRef] [Green Version]
  22. Eckersall, P.; Conner, J. Bovine and canine acute phase proteins. Vet. Res. Commun. 1988, 12, 169–178. [Google Scholar] [CrossRef]
  23. Grönlund, U.; Hultén, C.; Eckersall, P.D.; Hogarth, C.; Waller, K.P. Haptoglobin and serum amyloid A in milk and serum during acute and chronic experimentally induced Staphylococcus aureus mastitis. J. Dairy Res. 2003, 70, 379–386. [Google Scholar] [CrossRef] [PubMed]
  24. Otsuka, M.; Sugiyama, M.; Ito, T.; Tsukano, K.; Oikawa, S.; Suzuki, K. Diagnostic utility of measuring serum amyloid A with a latex agglutination turbidimetric immunoassay in bovine mastitis: Comparison with haptoglobin and alpha 1 acid glycoprotein. J. Vet. Med. Sci. 2021, 83, 329–332. [Google Scholar] [CrossRef]
  25. Bassols, A.; Robles-Guirado, J.A.; Arroyo, L.; Soler, L.; García, N.; Pato, R.; Peña, R.; Saco, Y.; Armengol, R.; Lampreave, F. Validation of new automated turbidimetric immunoassays for the measurement of haptoglobin and inter-α-trypsin inhibitor heavy chain H4 specific for the bovine species. Vet. Clin. Pathol. 2023, 52, 64–74. [Google Scholar] [CrossRef] [PubMed]
  26. Åkerstedt, M.; Björck, L.; Waller, K.P.; Sternesjö, Å. Biosensor assay for determination of haptoglobin in bovine milk. J. Dairy Res. 2006, 73, 299–305. [Google Scholar] [CrossRef] [PubMed] [Green Version]
  27. Nirala, N.R.; Harel, Y.; Lellouche, J.-P.; Shtenberg, G. Ultrasensitive haptoglobin biomarker detection based on amplified chemiluminescence of magnetite nanoparticles. J. Nanobiotechnol. 2020, 18, 6. [Google Scholar] [CrossRef] [Green Version]
  28. Nirala, N.R.; Pinker, N.; Desitti, C.; Shtenberg, G. Milk haptoglobin detection based on enhanced chemiluminescence of gold nanoparticles. Talanta 2019, 197, 257–263. [Google Scholar] [CrossRef]
  29. Ronkainen, N.J.; Halsall, H.B.; Heineman, W.R. Electrochemical biosensors. Chem. Soc. Rev. 2010, 39, 1747–1763. [Google Scholar] [CrossRef]
  30. Razavi, N.; Es’haghi, Z. Employ of magnetic polyaniline coated chitosan nanocomposite for extraction and determination of phthalate esters in diapers and wipes using gas chromatography. Microchem. J. 2018, 142, 359–366. [Google Scholar] [CrossRef]
  31. Jiang, X.; Cheng, J.; Zhou, H.; Li, F.; Wu, W.; Ding, K. Polyaniline-coated chitosan-functionalized magnetic nanoparticles: Preparation for the extraction and analysis of endocrine-disrupting phenols in environmental water and juice samples. Talanta 2015, 141, 239–246. [Google Scholar] [CrossRef]
  32. Jang, J.; Ha, J.; Lim, B. Synthesis and characterization of monodisperse silica–polyaniline core–shell nanoparticles. Chem. Commun. 2006, 15, 1622–1624. [Google Scholar] [CrossRef] [Green Version]
  33. Martín, M.; González Orive, A.; Lorenzo-Luis, P.; Hernández Creus, A.; González-Mora, J.L.; Salazar, P. Quinone-Rich Poly(dopamine) Magnetic Nanoparticles for Biosensor Applications. ChemPhysChem 2014, 15, 3742–3752. [Google Scholar] [CrossRef] [PubMed]
  34. Prodan, A.M.; Iconaru, S.L.; Chifiriuc, C.M.; Bleotu, C.; Ciobanu, C.S.; Motelica-Heino, M.; Sizaret, S.; Predoi, D. Magnetic Properties and Biological Activity Evaluation of Iron Oxide Nanoparticles. J. Nanomater. 2013, 2013, 893970. [Google Scholar] [CrossRef] [Green Version]
  35. Esyanti, R.R.; Zaskia, H.; Amalia, A.; Nugrahapraja, D.H. Chitosan Nanoparticle-Based Coating as Post-harvest Technology in Banana. J. Phys. Conf. Ser. 2019, 1204, 012109. [Google Scholar] [CrossRef]
  36. Nirmala, R.; Il, B.W.; Navamathavan, R.; El-Newehy, M.H.; Kim, H.Y. Preparation and characterizations of anisotropic chitosan nanofibers via electrospinning. Macromol. Res. 2011, 19, 345. [Google Scholar] [CrossRef]
  37. Liu, Y.; Jia, S.; Wu, Q.; Ran, J.; Zhang, W.; Wu, S. Studies of Fe3O4-chitosan nanoparticles prepared by co-precipitation under the magnetic field for lipase immobilization. Catal. Commun. 2011, 12, 717–720. [Google Scholar] [CrossRef]
  38. Zulfikar, M.A.; Afrita, S.; Wahyuningrum, D.; Ledyastuti, M. Preparation of Fe3O4-chitosan hybrid nano-particles used for humic acid adsorption. Environ. Nanotechnol. Monit. Manag. 2016, 6, 64–75. [Google Scholar] [CrossRef]
  39. Davodi, B.; Jahangiri, M.; Ghorbani, M. Magnetic Fe3O4@ polydopamine biopolymer: Synthesis, characterization and fabrication of promising nanocomposite. J. Vinyl Addit. Technol. 2019, 25, 41–47. [Google Scholar] [CrossRef]
  40. Ziegler-Borowska, M.; Chełminiak, D.; Kaczmarek, H. Thermal stability of magnetic nanoparticles coated by blends of modified chitosan and poly(quaternary ammonium) salt. J. Therm. Anal. Calorim. 2015, 119, 499–506. [Google Scholar] [CrossRef] [Green Version]
  41. Li, W.; Xiao, L.; Qin, C. The Characterization and Thermal Investigation of Chitosan-Fe3O4 Nanoparticles Synthesized Via A Novel One-step Modifying Process. J. Macromol. Sci. Part A 2010, 48, 57–64. [Google Scholar] [CrossRef]
  42. Unsoy, G.; Yalcin, S.; Khodadust, R.; Gunduz, G.; Gunduz, U. Synthesis optimization and characterization of chitosan-coated iron oxide nanoparticles produced for biomedical applications. J. Nanopart. Res. 2012, 14, 964. [Google Scholar] [CrossRef]
  43. Yavuz, A.G.; Uygun, A.; Bhethanabotla, V.R. Substituted polyaniline/chitosan composites: Synthesis and characterization. Carbohydr. Polym. 2009, 75, 448–453. [Google Scholar] [CrossRef]
  44. Alothman, Z.A. A Review: Fundamental Aspects of Silicate Mesoporous Materials. Materials 2012, 5, 2874–2902. [Google Scholar] [CrossRef] [Green Version]
  45. Schneider, P. Adsorption isotherms of microporous-mesoporous solids revisited. Appl. Catal. A Gen. 1995, 129, 157–165. [Google Scholar] [CrossRef]
  46. Migneault, I.; Dartiguenave, C.; Bertrand, M.J.; Waldron, K.C. Glutaraldehyde: Behavior in aqueous solution, reaction with proteins, and application to enzyme crosslinking. Biotechniques 2004, 37, 790–802. [Google Scholar] [CrossRef]
  47. Carinelli, S.; Xufré, C.; Martí, M.; Pividori, M.I. Interferon gamma transcript detection on T cells based on magnetic actuation and multiplex double-tagging electrochemical genosensing. Biosens. Bioelectron. 2018, 117, 183–190. [Google Scholar] [CrossRef]
  48. Masdor, N.A. Determination of the detection limit using the four-parameter logistic model for the double-antibody sandwich ELISA for the rapid detection of Bacillus cereus in food. J. Environ. Microbiol. Toxicol. 2017, 5, 12–13. [Google Scholar] [CrossRef]
  49. Brady, N.; O’Reilly, E.L.; McComb, C.; Macrae, A.I.; Eckersall, P.D. An immunoturbidimetric assay for bovine haptoglobin. Comp. Clin. Pathol. 2019, 28, 21–27. [Google Scholar] [CrossRef]
  50. Mohamad, A.; Keasberry, N.A.; Ahmed, M.U. Enzyme-free gold-silver core-shell nanozyme immunosensor for the detection of haptoglobin. Anal. Sci. 2018, 34, 1257–1263. [Google Scholar] [CrossRef] [Green Version]
  51. Weng, X.; Ahmed, S.R.; Neethirajan, S. A nanocomposite-based biosensor for bovine haptoglobin on a 3D paper-based analytical device. Sens. Actuators B Chem. 2018, 265, 242–248. [Google Scholar] [CrossRef]
  52. Botía, M.; López-Arjona, M.; Escribano, D.; Contreras-Aguilar, M.; Vallejo-Mateo, P.; Cerón, J.; Martínez-Subiela, S. Measurement of haptoglobin in saliva of cows: Validation of an assay and a pilot study of its potential application. Res. Vet. Sci. 2023, 158, 44–49. [Google Scholar] [CrossRef]
  53. N Sonuc, M.; K Sezgintürk, M. A Disposable, highly sensitive biosensing system: Determination of haptoglobin as a significant acute phase biomarker. Curr. Anal. Chem. 2016, 12, 43–53. [Google Scholar] [CrossRef]
  54. Carinelli, S.; Fernandez, I.; González-Mora, J.L.; Salazar-Carballo, P.A. Hemoglobin-modified nanoparticles for electrochemical determination of haptoglobin: Application in bovine mastitis diagnosis. Microchem. J. 2022, 179, 107528. [Google Scholar] [CrossRef]
  55. Tan, X.; Ding, S.Q.; Hu, Y.X.; Li, J.J.; Zhou, J.Y. Development of an immunosensor assay for detection of haptoglobin in mastitic milk. Vet. Clin. Pathol. 2012, 41, 575–581. [Google Scholar] [CrossRef]
  56. Quy, D.V.; Hieu, N.M.; Tra, P.T.; Nam, N.H.; Hai, N.H.; Thai Son, N.; Nghia, P.T.; Anh, N.T.V.; Hong, T.T.; Luong, N.H. Synthesis of Silica-Coated Magnetic Nanoparticles and Application in the Detection of Pathogenic Viruses. J. Nanomater. 2013, 2013, 603940. [Google Scholar] [CrossRef] [Green Version]
  57. Martín, M.; Salazar, P.; Campuzano, S.; Villalonga, R.; Pingarrón, J.M.; González-Mora, J.L. Amperometric magnetobiosensors using poly(dopamine)-modified Fe3O4 magnetic nanoparticles for the detection of phenolic compounds. Anal. Methods 2015, 7, 8801–8808. [Google Scholar] [CrossRef] [Green Version]
  58. Petcharoen, K.; Sirivat, A. Synthesis and characterization of magnetite nanoparticles via the chemical co-precipitation method. Mater. Sci. Eng. B 2012, 177, 421–427. [Google Scholar] [CrossRef]
  59. De Queiroz Antonino, R.S.C.M.; Lia Fook, B.R.P.; de Oliveira Lima, V.A.; de Farias Rached, R.Í.; Lima, E.P.N.; da Silva Lima, R.J.; Peniche Covas, C.A.; Lia Fook, M.V. Preparation and Characterization of Chitosan Obtained from Shells of Shrimp (Litopenaeus vannamei Boone). Mar. Drugs 2017, 15, 141. [Google Scholar] [CrossRef] [PubMed] [Green Version]
  60. Zhu, H.; Peng, S.; Jiang, W. Electrochemical Properties of PANI as Single Electrode of Electrochemical Capacitors in Acid Electrolytes. Sci. World J. 2013, 2013, 940153. [Google Scholar] [CrossRef] [PubMed]
  61. Trchová, M.; Šeděnková, I.; Tobolková, E.; Stejskal, J. FTIR spectroscopic and conductivity study of the thermal degradation of polyaniline films. Polym. Degrad. Stab. 2004, 86, 179–185. [Google Scholar] [CrossRef]
  62. Malorny, B.; Hoorfar, J.; Bunge, C.; Helmuth, R. Multicenter validation of the analytical accuracy of Salmonella PCR: Towards an international standard. Appl. Environ. Microbiol. 2003, 69, 290–296. [Google Scholar] [CrossRef] [Green Version]
Figure 1. Schematic representation of haptoglobin electrochemical determination involving MNPs-Chi@PANI-Hb.
Chemosensors 11 00378 g001
Figure 2. (a) Experimental XRD patterns for bare magnetic nanoparticles (MNPs), hybrid chitosan-magnetic nanoparticles (MNPs@Chi) and polyaniline coated nanoparticles (MNPs@Chi/PANI). (b) FT-IR spectra of bare MNPs, Chi, PANI, and MNPs@Chi/PANI.
Chemosensors 11 00378 g002
Figure 3. (a) Thermogravimetric curves of bare MNPs, MNPs@Chi, and MNPs@Chi/PANI nanoparticles. (b) N2 adsorption/desorption isotherm for MNPs@Chi/PANI (inset: pore size distribution).
Chemosensors 11 00378 g003
Figure 4. (a) Cyclic voltammograms (scan rate: 50 mV/s) and (b) Nyquist plots of bare MNPs, MNPs@Chi, MNPs@Chi/PANI, and MNPs@Chi/PANI-Hb in 0.1 M KCl solution with 5.0 mM [Fe(CN)6 ]3−/4− (working potential: 140 mV vs. pseudoreference Ag electrode; frequency range: 0.1–100 kHz).
Chemosensors 11 00378 g004
Figure 5. Evaluation of the optimal conditions for haemoglobin immobilization on MNPs-Chi@PANI. Optimization of (a) pH of biofunctionalization solution, (b) amount of haemoglobin, (c) blocking agents, and (d) amount of MNPs-Chi@PANI-Hb. Tests were performed with 0.34 g mL−1 (Positive) and without (Negative) Hp solution. In all cases, the concentration of reagents was 1 g mL−1 Ab1 and 2 g mL−1 Ab2-ALP.
Chemosensors 11 00378 g005
Figure 6. Matrix effect of milk on bioassay performance, evaluated in absence and in presence (2, 10 and 50 ng mL−1 of Hp). In all cases, the concentration of reagents was 2 μg mL−1 MNPs-Chi@PANI-Hb, 1 μg mL−1 Ab1, and 2 μg mL−1 Ab2-ALP.
Chemosensors 11 00378 g006
Figure 7. Calibration curve for haptoglobin in milk by the electrochemical determinations. (n = 3).
Chemosensors 11 00378 g007
Figure 8. Sample analysis and milk classification by Hp electrochemical biosensor.
Chemosensors 11 00378 g008
Table 1. Comparison of different methods developed for bovine haptoglobin detection.
Assay FormatDetection SystemBioreceptorDetection Range/LODMatrix/SampleDescriptionRef.
Bioassay based on magnetite nanoparticlesChemiluminescenceHaemoglobinRange: 1 pg mL−1 to 1 µg mL−1; LOD: 0.89 pg mL−1 Milk matrices
-
Peroxidase-like activity and inhibition due to Hb–Hp complex formation. Luminol/H2O2 substrate.
-
Sample pretreatment required: defatted by centrifugation.
-
CL bioassay compared with bovine ELISA technique. CL bioassay overestimates the spiked Hp concentration (both in buffer and milk matrices).
[27]
Antibody-modified latex microparticles
(immunoturbidimetry)
Turbidimetric detection Hp-specific antibodyRange: 0.250 to 0.016 mg mL−1;
LOD: 0.005 mg mL−1,
LOQ: 0.007 mg mL−1.
Serum from Holstein cows
-
Designed for acute inflammation detection.
-
Immunoturbidimetric method compared with: (a) in-house SRID: good agreement with proportional error and produced values higher than SRID method at high Hp concentrations, (b) ELISA (Acuvet): good agreement with slight constant error, and (c) colorimetric method (Tridelta): A proportional error found to be unacceptable.
-
Shows interference of around 25% for haemoglobin at 1.5 g/L.
[25]
Automated species-specific immunoturbidimetric (IT)ImmunoturbidimetricHp-specific antibodyRange: 0.2 to 1.5 g L−1;
LOD: 0.018 mg mL−1,
LOQ: 0.033 g L−1.
Spiked serum samples
-
Comparison to Hp ELISA kit.
-
Slight haemoglobin interference at 4 g/L (10%).
-
Not affected by icterus or lipaemia but had moderate interference from haemoglobin.
[47]
AlphaLISA technology, based on amplified luminescence by the proximity of donor and acceptor beads.Luminescent amplificationHp-specific antibodyRange: 8 to 533 ng mL−1;
LOQ: 7.9 ng mL−1.
The LOD could not be calculated since all values obtained were zero.
Bovine saliva
cow saliva, and simple
saliva samples were taken from Holstein–Friesen multiparous cows from a farm
-
Hp in bovine saliva and to study the possible changes in different inflammatory situations, such as peripartum period and lameness.
-
Recovery test 105.15%.
[50]
Paper-based immunochromatographic assayColour intensityHp-specific antibodyRange: 10 to 900 μg mL−1;
LOD: 28 μg mL−1.
Spiked
-
Semiquantitative test by naked eye or quantitative with image processing.
-
Compared to commercial ELISA.
[49]
ITO-based anti-Hp biosensorImpedimetric biosensorHp-specific antibodyRange: 0.2 to 1 fg mL−1;
LOD: 0.001 fg mL−1.
Artificial serum samples
-
Bioreceptor (anti-Hp).
-
Stability and storage: more than 3 weeks.
-
Recovery in serum: 108% for 0.2 fg mL−1 and 105.2% for 0.4 fg mL−1.
[51]
Enzyme-mimic NP immunoassay, enzyme-free gold–silver core–shell nanozyme immunosensor ColorimetricHp-specific antibodyRange: 100 to 1000 pg mL−1;
LOD: 100 pg mL−1.
Artificial and spiked serum samples
-
96-well plate.
-
Low recovery at low concentration.
[48]
Electrochemical Hp biosensor based on MNPs-Chi@PANI-HbDifferential pulse voltammetry HaemoglobinRange: 0.001 to 0.32 μg mL−1;
LOD: 31 ng mL−1.
Spiked milk and real milk sample
-
Stability and storage: 3 weeks.
-
Compared with commercial ELISA kit.
-
Tested in real milk samples coming from healthy and unhealthy cows.
-
High specificity and sensitivity.
This work
Table 2. Quantification of nine bovine milk samples using a commercial ELISA kit and their analysis using an electrochemical biosensor.
SamplesHp (ELISA) (μg mL−1) *Biosensor Classification
121.3 ± 0.9Unacceptable
250 ± 1Unacceptable
346.9 ± 0.3Unacceptable
47.42 ± 0.08Acceptable
57.6 ± 0.3Acceptable
640.9 ± 0.1Ambiguous
747 ± 1Unacceptable
89.0 ± 0.2Acceptable
90.13 ± 0.01Acceptable
* Hp values above 10 μg mL−1 are indicators of mastitis.
Disclaimer/Publisher’s Note: The statements, opinions and data contained in all publications are solely those of the individual author(s) and contributor(s) and not of MDPI and/or the editor(s). MDPI and/or the editor(s) disclaim responsibility for any injury to people or property resulting from any ideas, methods, instructions or products referred to in the content.

