1. Introduction
Dopamine (DA) controls many vital physiological functions and is critically involved in several neuropsychiatric disorders. Pathological mechanisms of DA action are related to the glutamate system. L-glutamate is known as the most common excitatory neurotransmitter in the mammalian central nervous system (CNS) [
1]. Abnormal transmission of L-glutamate can cause neurological diseases, such as communication dysfunction, cognitive impairments, schizophrenia, Parkinson’s disease, stroke, and epilepsy [
2,
3,
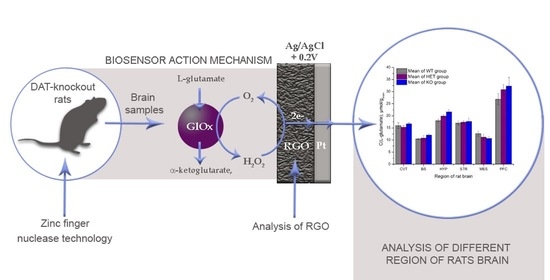
4]. Thus, investigations of L-glutamate release in living organisms can help to identify novel L-glutamate-related pathophysiological pathways. For this purpose, a newly developed strain of rats (DAT-knockout, DAT-KO rats) is tested, in which the gene encoding DAT is disrupted by using zinc finger nuclease (ZFN) technology [
5]. DAT-KO rats can provide a novel translational model for human diseases involving aberrant DA function and/or mutations affecting the DAT or related regulatory mechanisms. Investigations of L-glutamate release in rats and mice can help reveal the role of L-glutamate in DA transporter pathology; however, L-glutamate is related to other dysfunctions, such as acute pancreatitis [
6].
The glutamate content is usually assessed using the microdialysis-HPLC method [
7] and only a few electrochemical biosensors have been designed. However, over the past twenty years, there has been a dramatic increase in the development of amperometric L-glutamate biosensors due to their sensitivity, real-time analysis, cost effectiveness, and portability relative to conventional laboratory techniques, such as fluorescence [
8], gas chromatography–mass spectrometry [
9,
10], high-performance liquid chromatography [
11], or ELISA [
12]. Amperometric L-glutamate biosensors are generally developed using L-glutamate oxidase (GluOx) and Pt or Pt-modified electrodes [
12]. This enzyme has 100% specificity for L-glutamate [
13]. Moreover, Pt is the gold standard electrode because of its excellent catalytic activity toward hydrogen peroxide, the electroactive byproduct of most enzymatic biosensors, including L-glutamate [
14]. Thus, biosensors based on the pair of GluOx and Pt have several advantages, such as simple fabrication, good reproducibility, fast response time, and high sensitivity. Nonetheless, there are some disadvantages, including a narrow linear detection range, a short lifetime, and a high operating voltage (the potential that is most often used is from 0.5 to 0.7 V vs. Ag/AgCl) [
15]. For an analytical method, the linear part of the calibration curve of the biosensor should cover the concentration at which the sample is usually analyzed. In fact, the concentrations of L-glutamate in biofluids, such as plasma, whole blood, cerebrospinal fluid (CSF), saliva, and urine, are in the range of 5–100 μM, 150–300 μM, 0.5–2 μM, 0.232 ± 0.177 μM, and 8.5 (3.3–18.4) μM mM
−1 creatinine, respectively [
12,
15,
16]. Thus, the wide linear range is one of the most important characteristics of the biosensor to accurately detect and quantify L-glutamate in various biofluids.
To date, a growing body of the literature has examined in vivo L-glutamate biosensors that are helpful for understanding the physiology of neurotransmitters in the brain [
17]. However, in vivo sensors are extremely invasive and can cause additional complications, such as infections [
12]. Moreover, the operational stability of in vivo biosensors is poor. Wei et al. reported that the sensitivity of the biosensor decreased to 46.32 ± 5.08% after 9 h of in vivo measurements [
18]. Consequently, there is still a gap in the improvement in L-glutamate biosensors and fabricating suitable L-glutamate biosensors with a wide linear range, high sensitivity, good stability, and low operating voltage for in vitro monitoring remains a great challenge.
The properties of an amperometric biosensor for measuring L-glutamate based on Pt (GluOx/Pt) and the features of the same biosensor when enhanced by the addition of functionalized structures (GluOxRGO/Pt) are presented in this paper. The optimized biosensor is designed on the basis of a Pt electrode in combination with a biomembrane containing GluOx immobilized into a layer of hydrothermally reduced graphene oxide (RGO). The use of such a material significantly improves electron transfer in the bioelectrochemical reaction even at low electrode potentials. As a result, the biosensor displays good selectivity and sensitivity and can be used to assess a wide range of concentrations. Due to the biosensor’s high sensitivity, it is possible to assess and compare the concentrations of L-glutamate between DAT-KO and wild-type (WT) cases and identify variations in L-glutamate concentrations, even in different parts of the rat brain.
2. Materials and Methods
2.1. Materials
The L-glutamate oxidase was from Streptomyces sp., Merck KGaA, Germany. The catalase was from bovine liver, 2000–5000 U/mg protein, Merck KgaA, Germany. The brain extract was from bovine brain, Type VII, Merck KGaA, Germany. The mouse and rat brain extracts were obtained from the Department of Neurosciences, University of Mons, Belgium. Bovine serum albumin (BSA) was obtained from Merck KGaA, Germany. Semipermeable terylene membrane (thickness 12 µm, pore diameter 0.4 µm) was obtained from the Joint Institute of Nuclear Research, Russia. The L-glutamate assay kit was from Merck KGaA, Germany. The mouse brain (C57B6 (control or wild type mouse)) and rat brain samples were homozygous (DAT-KO rats (dopamine transporter knockout rats)) and heterozygous (RAT HET I BRAIN 212, RAT HET II BRAIN 212), and wild-type ((WT) RAT WT I BRAIN, RAT WT II BRAIN); they were obtained from the University of Mons. Other chemical reagents were obtained from Sigma–Aldrich and were of analytical grade unless otherwise mentioned. As the default buffer, 20 mM sodium phosphate buffer solution (PBS) containing 0.01 M KCl, pH = 7.2 was used. There was a stock solution of L-glutamate 1 M in PBS.
2.2. Hydrothermal Reduction of Graphene Oxide in the Presence of Malachite Green Dye
Graphene oxide (GO) was synthesized from natural graphite powder using a traditional Hummers’ method [
19]. A mixture of 0.1 g of GO and 0.125 g of malachite green (MG) dye was dispersed in 50.0 mL of distilled water and agitated for 3 h in a KS 130 Basic Orbital shaker (IKA). Afterward, the GO/MG suspension was sonicated for 1 h using a VibraCell VCX-130 (Sonics Inc., Newtown, PA, USA) ultrasonic processor. The precursor GO/MG suspension was transferred into a Teflon lined stainless-steel autoclave (100 mL) and held at 180 °C for 12 h. After cooling, the product was washed with deionized water several times and dried at ambient temperature. The sample obtained was denoted RGO.
2.3. Preparation of Inert and Enzymatic Membranes
First, on the surface, a semipermeable terylene film was fixed to a rubber ring (inner diameter of 3 mm). In the case of an inert membrane, 5 µL of a mixture containing bovine serum albumin in PBS and glutaraldehyde was deposited and held at 4 °C overnight. To design enzymatic membranes, 5 µL of a mixture containing L-glutamate oxidase, bovine serum albumin in PBS, and glutaraldehyde was deposited on the inner surface of the ring-fixed membrane and held at 4 °C overnight. In the case of the GluOxRGO/Pt biosensor, an additional layer was formed in the membrane (working area Ø 2.4 mm) using RGO paste, which was prepared by mixing RGO powder with a pasting liquid consisting of 10% polyvinyl dichloride in acetone.
2.4. L-Glutamate Biosensor Preparation
The principal scheme of the biosensor for investigations of L-glutamate is shown in
Figure 1.
The biosensor configuration included a semipermeable membrane containing immobilized GluOx, a working Pt electrode, isolating corps, and a contact zone. Chronoamperometric experiments were conducted using a custom-made potentiostat (Vilnius University, Life Sciences Center, Institute of Biochemistry) equipped with a conventional three-electrode system consisting of a platinum plate auxiliary electrode, a saturated Ag/AgCl reference electrode, and the biosensor as the working electrode. The chronoamperometric measurements were performed in a thermostatic electrochemical cell (volume 1.65 mL) at 20 °C, with the biosensor’s current–time response to L-glutamate recorded at working potentials of +0.6, 0.4, and 0.2 V vs. Ag/AgCl in stirred PBS buffer (pH of 7.2).
The electrochemical cell was filled with 1.65 mL of PBS; afterward, in the case of biosensor calibration, samples from 1 to 100 µL containing L-glutamate in PBS were added. In the case of brain extract assessments, 50 µL of samples previously diluted 10 times with PBS were added to the cell.
The apparent Michaelis constant (K
Mapp) was evaluated from the experimental dependence of the current (
I) vs. concentration of the substrate (C). For this, the response current was measured three times in the solution with C and the average response (I) was obtained. The experimental dependence I vs. C was approximated by OriginPro 8 according to the electrochemical version of the Michaelis–Menten equation [
20]. The sensitivities of the biosensors were defined as the slope of the linear range of the calibration curve. The limit of detection (LOD) was calculated according to the equation of the linear regression model reported by Shrivastava [
21]. This model was used to compute the sensitivity and the LOD. Therefore, the LOD could be expressed as LOD = 3Sa/b, where Sa is the standard deviation of the response and b is the slope of the calibration curve [
21]. In our systems, the LOD was calculated as the standard deviation of the current response to L-glutamate (one concentration in the linear calibration curve range) multiplied by three and divided by the sensitivity of the biosensor.
2.5. Colorimetric L-Glutamate Measurement in Mouse and Rat Brain Samples
In rat brain samples, L-glutamate was measured using the standard colorimetric method. The method was based on an enzymatic assay, which resulted in a colorimetric (450 nm) product proportional to the L-glutamate present in a sample. The measurement consisted of two steps: sample preparation and colorimetric enzymatic reaction.
Sample preparation was carried out using a modified procedure as described [
22]. Briefly, the sample was sonicated for 30 min to achieve a homogeneous mixture. Afterward, 100 µL of the sample was placed in 900 µL of standard measurement buffer solution (50 mM Na
2HSO
4 pH 7.4) and heat inactivated at 85 ℃ for 30 min. Afterward, the sample was cooled to room temperature and centrifuged at 13,000×
g for 15 min. Finally, 50 µL of supernatant was removed and used for L-glutamate measurements.
The measurement was conducted according to the standard procedure developed by Sigma [
23] following the technical bulletin. A 96-well flat-bottom plate was used for measurement. A calibration curve was set by placing 92 µL of L-glutamate assay buffer, 8 µL of L-glutamate developer solution, 2 µL of L-glutamate enzyme mix, and a respective volume of L-glutamate standard into different wells. The total volume was 150 µL and was achieved by adding a required volume of L-glutamate assay buffer to the wells. Samples were measured using a similar procedure, namely placing 92 µL of L-glutamate assay buffer, 8 µL of L-glutamate developer solution, 2 µL of L-glutamate enzyme mix, and 50 µL of sample into different wells. The reaction mixture was incubated at 37 °C for 30 min and the absorbance was measured and compared with the control at 450 nm. The concentration of L-glutamate was determined from the calibration curve. The calibration curve and all samples were measured in duplicate.
2.6. Structural Characterization of RGO
The surface functional groups of the RGO were determined using FTIR spectroscopy (PerkinElmer, Waltham, MA, USA) in the wavenumber range of 650–4000 cm−1. Spectra were recorded in transmission mode using KBr pellet technology with a spectral resolution of 4 cm−1. The Raman spectra were collected using a Witec Confocal Raman Microscope System alpha 300R (Witec Inc., Ulm, Germany) with a 532 nm laser wavelength and a 50× objective lens. To study the morphology of the sample, a scanning electron microscope (SEM, Hitachi SU-70, Tokyo, Japan) was used; its accelerating voltage was set at 10 kV. Surface chemistry analysis was performed using an X-ray photoelectron spectrometer (Kratos Axis Supra, Manchester, UK) with a monochromatic source of Al Kα X-rays (hν = 1486.69 eV, 25 mA, 15 kV) and an electron analyzer pass energy of 20 eV. The binding energy (B.E.) scale was calibrated with a carbon C1s signal at 284.6 eV.
3. Results
3.1. Characteristics of RGO
Nitrogen-doped RGO samples were prepared by a simple and facile one-pot hydrothermal reduction of GO in the presence of the dye malachite green, which was used as a nitrogen source for GO modification.
Figure 2a shows the SEM images of the RGO sheets, which appeared as randomly assembled thin sheets with distinct edges, wrinkles, and folding. Furthermore, the RGO was analyzed by Raman spectroscopy; the result is shown in
Figure 2b. The spectrum was deconvoluted using Gaussian–Lorentzian curves into three peaks, D, G, and D’’. The D band at 1343 cm
−1 arose from the defects and corresponded to a disordered network of sp
3 carbon atoms. The G band at 1579 cm
−1 corresponded to the ordered network of sp
2 carbon atoms. The D’’ band at 1454 cm
−1 was related to the amorphous phase [
24,
25]. The I
D/I
G ratio of RGO was measured as 1.00, whereas GO had an I
D/I
G ratio equal to 1.20 [
26]. The lower value of the I
D/I
G ratio for RGO suggested that the in-plane sp
2 bonding network was partially restored during the hydrothermal reduction process.
The results of the FT-IR analysis of RGO and MG dye are presented in
Figure 2c. For MG, peaks between 1500 and 650 cm
−1 corresponded to the mono-substituted and para-disubstituted benzene rings, which supported the peak at 1583 cm
−1, corresponding to the C=C stretching of the benzene ring. The spectrum showed bands at 1177 cm
−1 and 1373 cm
−1, corresponding to the C-N stretching vibrations, and bands at 2919 cm
−1 and 2852 cm
−1, corresponding to asymmetric and symmetric C–H stretching vibrations of the methyl group, respectively. The band located at 3443 cm
−1 was related to O–H or N-H stretching vibrations [
27,
28]. The presence of a signal at 3443 cm
−1 in the FT-IR spectrum of RGO suggested the possible presence of certain functional groups, such as -OH, -NH
2, or =NH, in the aromatic ring. This observation aligned with the findings from elemental analysis measurements (
Figure 2d insert table), indicating successful functionalization of GO with nitrogen-containing functional groups. Bands in the region of 1254 cm
−1–1023 cm
−1 should correspond to the C–O stretching of the carboxyl, phenolic, and epoxy groups. The bands at 1750 cm
−1 and 1652 cm
−1 can be attributed to the –C=O stretching vibrations of the –COOH groups and the aromatic –C=C stretching mode, respectively [
29].
The RGO sample was analyzed by X-ray photoelectron spectroscopy; the results are shown in
Figure 2d,e. XPS data indicated that RGO consisted of C, N, O, and S. Compared with GO [
30], there was a significant decrease in oxygen content in the RGO samples. However, the presence of residual oxygen-containing functional groups on the surface of RGO suggested that a partial reduction in GO occurred during hydrothermal treatment. Furthermore, the data presented in
Figure 2d indicate the existence of a small quantity of sulfur in the RGO sample. This sulfur was likely derived from residual substances, such as sulfates, which might not have been completely eliminated during the chemical treatment of pure graphite. Additionally, the XPS analysis provided evidence of the successful incorporation of nitrogen-containing functional groups on the GO structure during the hydrothermal treatment. As shown in
Figure 2d, the content of nitrogen functionalities on RGO (2.16 at.%) was significantly higher than that on GO (0.6 at.% N) [
30]. This finding indicates that the MB additive can be effectively employed as a nitrogen source for the modification of GO. To determine the origin of nitrogen, the N1s spectra were deconvoluted; the results are presented in
Figure 2e. The XPS N1s spectrum of RGO can be fitted into three peaks centered at 398.6 eV, 399.5 eV, and 400.5 eV. The peak at 398.6 eV with 17.3 at.% can be attributed to pyridinic nitrogen. The peak at 399.5 eV with 40.07 at.% can be attributed to pyridone nitrogen or -NH
2 functionalities. The last component at 400.5 eV (42.63 at.%) corresponded to pyrrole-like nitrogen [
31,
32].
3.2. Analysis of Sensitivity of the Biosensors
An amperometric L-glutamate biosensor (GluOx/Pt) was developed using an L-glutamate oxidase (GluOx) and Pt electrode. GluOx is a flavoenzyme that catalyzes the oxidative deamination of L-glutamate in the presence of oxygen and generates hydrogen peroxide. The biosensor action was based on the registration of current generated during the catalytic oxidation of hydrogen peroxide in the following reaction (
Figure 3).
First, the L-glutamate biosensor was examined in PBS (0.01 M; pH 7.2; 0.1 M KCl) to determine sensitivity, reliability, and stability.
Calibration curves obtained within fourteen days of biosensor exploitation are shown in
Figure 4.
A good linear relationship was obtained in the concentration range between 0.0005 and 0.15 mM, with a sensitivity of 15.7 ± 0.1 μA mM−1 cm−2. The LOD was three times higher than the noise, which was calculated to be 0.0005 mM. Investigation of the biosensor stability demonstrated quite good results, while, at 14 working days, 67% of the residual response remained.
To evaluate the accuracy of the analysis, a coefficient of variation (CV) was calculated. For this purpose, five different concentrations of L-glutamate were added to the electrochemical cell and the responses were recorded at least 10 times. The CV varied from 5.4 to 1.3% for 0.005 and 0.05 mM L-glutamate, respectively (
Figure 5).
These results show that the response of the proposed biosensor to L-glutamate was reproducible, despite a slight increase in CV values with decreasing glutamate concentrations.
3.3. Examination of the Biosensor in Bovine Brain Extract
To demonstrate the applicability of the L-glutamate biosensor in the analysis of complex real samples, quantification of L-glutamate in bovine brain extract was performed. First, five known concentrations (2.5, 5.0, 7.5, and 12.5 µM) of L-glutamate were added to the samples of bovine brain extract in PBS and the solutions obtained were analyzed by the biosensor GluOx/Pt. Two parallel dependences (current vs. concentration) were obtained for both experiments carried out in PBS and in bovine brain extract in PBS (
Figure 6). This experiment demonstrated that the biosensor can be applied for the analysis of complex media, such as brain extract.
While the L-glutamate level in the brain was very low, we needed strong evidence for detected L-glutamate. For this purpose, an experiment similar to that reported in [
33] (with the addition of two selective enzymes, GluOx and catalase) was performed on real brain samples. GluOx catalyzes the conversion of L-glutamate into α-ketoglutarate and H
2O
2; the latter (the resultant H
2O
2) oxidizes on the working surface of the electrode, generating the current (
Figure 3), which is proportional to the concentration of H
2O
2. Since catalase catalyzes the decomposition of H
2O
2 into water and oxygen, the addition of this enzyme to the sample must reduce the response. The conversion of L-glutamate to ketoglutarate by the release of H
2O
2 and subsequent electrooxidation on the Pt electrode is shown in
Figure 7.
As catalase is responsible for eliminating H
2O
2 produced during the conversion of L-glutamate to α-ketoglutarate, the current of the biosensor response was expected to approach zero. As shown in
Figure 8, the fast decrease in response to L-glutamate in the presence of GluOx and catalase was visible from the beginning of the measurement. The response, which decreased to the background level, showed that H
2O
2 released due to enzymatic L-glutamate conversion in the sample bulk was decomposed by catalase.
Thus, the data in
Figure 8 revealed the presence of L-glutamate in the brain sample and the zero value after 55 min confirmed the absence of a response to interfering compounds.
3.4. Examination of the Biosensor in Mouse Brain Samples
The biosensor GluOx/Pt accuracy was validated using an alternative colorimetric method. The method was based on an enzymatic assay, which resulted in a colorimetric (450 nm) product proportional to the L-glutamate present in a sample. In the samples, L-glutamate was measured using a standard colorimetric method. Three samples of mouse brain extracts obtained from the University of Mons were used under pre-centrifuged and non-centrifuged conditions. The amounts of L-glutamate found by the biosensor and using the colorimetric method are presented in
Table 1.
As shown in
Table 1, the assessments of L-glutamate in both centrifuged and non-centrifuged samples demonstrated only slightly lower values of L-glutamate in non-centrifuged samples than in centrifuged samples.
3.5. Optimization of the L-Glutamate Biosensor
To obtain good biosensor sensitivity and increase the accuracy, an additional layer of carbon structures—reduced graphene oxide (RGO) obtained by the hydrothermal reduction of graphene oxide in the presence of malachite green dye—was introduced in the biosensor membrane, creating a new version of the amperometric biosensor: GluOxRGO/Pt. This phenomenon increased the electrically conductive surface on which the oxidation of H
2O
2 could occur successfully. The addition of carbonaceous materials first allowed the biosensor electrode to reduce the operating potential to +0.4 and +0.2 V vs. Ag/AgCl. The calibration curves of the L-glutamate biosensor GluOxRGO/Pt obtained for different potential parameters +0.4 V and +0.2 V vs. Ag/AgCl are shown in
Figure 9.
The sensitivity of the GluOxRGO/Pt biosensor operating at +0.4 V was 7.5 ± 0.6 μA mM
−1 cm
−2; the apparent Michaelis constant K
Mapp = 0.88 ± 0.04 mM; at +0.2 V, the sensitivity was 1.5 ± 0.1 μA mM
−1 cm
−2 and K
Mapp = 1.47 ± 0.10 mM (
Table 2). The lowest detection concentration (LOD) was calculated to be 0.04 mM and 0.08 mM when GluOxRGO/Pt was operated at +0.4 V and +0.2 V, respectively. The linearity of the calibration curves ranged from 0.04 to 0.9 mM and from 0.08 to 1.2 mM at 0.4 V and 0.2 V, respectively.
3.6. Examination of GluOxRGO/Pt Biosensor in Real Samples
To determine whether any direct electrochemical transformations occurred when brain samples were tested and the electrode material RGO/Pt was used, an enzyme-free sensor with an inert membrane consisting of the electrode materials MGr and Pt was constructed. When this electrode was connected to the electrochemical system and 50 µL of rat brain extract (RAT WT II BRAIN) was added to 1 mL of the electrochemical cell, a signal was recorded (
Figure 10). For comparison, an anodic signal generated for the same amount of rat brain extract (RAT WT II BRAIN) of a biosensor with an enzyme membrane (GluOxRGO/Pt) was registered. The responses obtained are shown in
Figure 10.
In the case of GluOxRGO/Pt, the addition of rat brain extract to the electrochemical cell in 20 s showed a sudden and small jump in the cathodic current, followed by a sudden increase in the anodic current characteristic of the oxidation of H2O2 on the electrode surface by enzymatic catalysis. The numerical value of the resulting anodic signal clearly exceeded the value of the electrode background current (If) and was proportional to the amount of L-glutamate in the sample. In the case of RGO/Pt, after the introduction of the rat brain extract into the electrochemical cell, a decrease in the anodic current was seen, which gradually shifted to a steady current increase, returning to the numerical value of the electrode background current at 120 s. To summarize these results, we can conclude that the additional electrode material RGO/Pt in contact with Pt is not sensitive to the components of the rat brain extract.
3.7. L-Glutamate Biosensor Performance in Brain Samples
The aims of the present study were to develop and validate a biosensor that is sensitive to quantifying L-glutamate using small brain samples from rats and mice. The sensitivities of the biosensors were sufficient to determine the concentrations of L-glutamate in the brain. Thus, the brains of wild-type (WT), DAT-KO, and DAT-KO heterozygous (HET) rats and mice obtained from Mons University were examined. To ensure that the ability of the biosensor to work at low electrode operating potentials, to increase the accuracy of the analysis, and to ensure the ability to reliably detect low L-glutamate concentrations, brain samples were tested with both types of biosensors and the responses were compared with background signal responses (
Table 3).
Examining the proportion of background currents in the biosensor response, it can be seen that in the case of the GluOxRGO/Pt biosensor, the background current reached only 0.3–0.4% of the response to L-glutamate; in the case of GluOx/Pt, it reached 2–4% (
Table 3). Thus, moderately lower concentrations of L-glutamate than those of GluOx/Pt can be detected using a modification of the GluOxRGO/Pt biosensor.
The data in
Table 3 show that both the GluOx/Pt and GluOxRGO/Pt biosensors detected higher levels of L-glutamate in the RAT HET BRAIN 212 samples than in the other brain samples tested.
One of the main goals of the present study was to assess the L-glutamate distribution in different regions of rat brain samples. The GluOxRGO/Pt biosensor was validated to quantify L-glutamate in brain tissues, namely cerebellum (CVT), brainstem (BS), hippocampus (HYP), striatum (STR), mesencephalon (MES), and prefrontal cortex (PFC). Samples with weights ranging from 0.02 to 0.33 g were taken from different brain regions of HET, WT, and DAT-KO rats and diluted in 150 µL of PBS. The measured amounts of L-glutamate are shown in
Figure 11.
The results show that, in almost all cases in different regions of the brain, the concentration of L-glutamate in WT animals was lower than that in DAT-KO animals. The reliability of the studies was confirmed by the fact that DAT-KO HET (heterozygous) was always between WT and DAT-KO. The exception was in the CVT, where the concentration of L-glutamate in WT rats was slightly higher than that in DAT-KO HET rats. However, this fact will likely change with further measurements.
4. Discussion
Glutamate is a nonessential amino acid and a putative neurotransmitter. As is the case with much of the body, in regard to L-glutamate, it is all about balance. The problem occurs when the concentration of L-glutamate is overly high or low. Hence, low-cost, sensitive, and real-time monitoring of L-glutamate to quantify pain and to detect neurodegenerative diseases is imperative to improve pharmacotherapy and early diagnosis for health care. The literature shows that the concentrations of glutamate in biofluids, such as plasma, cerebral spinal fluid, urine, and saliva, are in the range of 5–100 μM, 0.5–2 μM, 8.5 (3.3–18.4) μM mM
−1 creatinine, and 0.232 ± 0.177 μM, respectively [
12]. Because of the large variety of L-glutamate contents in various biofluids, developing an analytical tool with a broad analytical range is a challenge. Here, we present an approach to design electrochemical biosensors that are compatible with glutamate detection under physiological conditions with high accuracy and for long durations.
In the case of GluOx/Pt, the biosensor can only operate reliably at a potential of at least +0.6 V vs. Ag/AgCl. A good linear relationship is obtained in the concentration range between 0.0005 and 0.15 mM, with a sensitivity of 15.7 ± 0.1 μA mM
−1 cm
−2. The LOD is considered to be three times higher than the calculated noise of 0.0005 mM. The accuracy of the analysis is evaluated by calculating the coefficient of variation (CV). CV varies from 5.4 to 1.3% for the lowest 0.005 and the highest 0.05 mM of L-glutamate, respectively (
Figure 5). Variations in responses reaching 5% are permissible for medical devices; thus, there is very good reproducibility and reliability of biosensor GluOx/Pt signals. The applicability of the glutamate biosensor in the analysis of complex real samples and the quantification of L-glutamate in bovine brain extract is demonstrated by performing an experiment in which five known concentrations of L-glutamate are added to the bovine brain extract in PBS; two parallel dependences (current vs. concentration) are obtained for both experiments carried out in PBS and in bovine brain extract in PBS (
Figure 6). This experiment demonstrates that the biosensor can be applied to the analysis of complex media, such as brain extracts. The selectivity of detection of L-glutamate using the proposed biosensor is confirmed in an experiment in which two enzymes are added to a sample of brain extract: L-glutamate oxidase and catalase. During this experiment, H
2O
2 produced due to the conversion of L-glutamate to α-ketoglutarate is eliminated by catalase and the current of the biosensor response approaches zero. The data shown in
Figure 8 reveal the presence of L-glutamate in the brain sample; the zero value after 55 min confirms the absence of influence of interfering compounds.
The biosensor GluOx/Pt accuracy is validated using an alternative colorimetric method. The assessments of L-glutamate by GluOx/Pt are performed in both centrifuged and non-centrifuged samples. The data reveal only slightly lower values of L-glutamate in non-centrifuged samples than in centrifuged samples (
Table 1). This phenomenon can correspond to the volume of biological tissue injected, which reduces the total volume of analyte in the sample. In fact, data show that non-centrifuged samples can be analyzed with the biosensor. This ability can greatly facilitate the analysis, as no pretreatment/pre-centrifugation of the sample is needed.
As shown in
Table 1, the colorimetric method gives slightly higher values for L-glutamate than the electrochemical method. This fact confirms that the amperometric biosensor does not register significant background signals consisting of possible oxidation of impurities on Pt.
To obtain good biosensor sensitivity and increase the accuracy, an additional layer of carbon structures—reduced graphene oxide (RGO) obtained by the hydrothermal reduction of graphene oxide in the presence of malachite green dye—is introduced in the biosensor GluOxRGO/Pt membrane. This phenomenon increases the electrically conductive surface on which the oxidation of H
2O
2 can occur successfully. However, the most important factor is that the addition of RGO allows the biosensor electrode to reduce the operating potentials to +0.4 and +0.2 V vs. Ag/AgCl (
Figure 9). The sensitivity of the GluOxRGO/Pt system does not increase significantly when the biosensor is operated at a low electrode potential, but this phenomenon always increases the reliability of the biosensor, as the possibility of oxidation of impurities is reduced by applying the lowest possible potential. The sensitivity of the GluOxRGO/Pt biosensor operating at +0.4 V is found to be 7.5 ± 0.6 μA mM
−1 cm
−2, K
Mapp = 0.88 ± 0.04 mM, and the sensitivity at +0.2 V is 1.5 ± 0.1 μA mM
−1 cm
−2, K
Mapp = 1.47 ± 0.10 mM. The linearity of the L-glutamate calibration curve ranges from 0.04 to 0.9 mM and 0.08 to 1.2 mM at +0.4 V and +0.2 V, respectively.
In fact, the addition of the RGO layer does not increase the sensitivity due to its action at electrode potentials lower than +0.6 V; however, the addition allows electron transfer between GluOx and the electrode surface, even at +0.2 V, and it significantly extends the linear part of the calibration curve. It can be concluded that, at such a low operating potential, the sensitivity of the biosensor is fully satisfactory; the increased K
Mapp values compared with the GluOx/Pt biosensor indicate that the linear part of the calibration curve of the system is elongated (
Table 2). This finding suggests that the range of L-glutamate concentrations that can be analyzed without additional sample dilutions has been extended.
To determine whether any direct electrochemical reactions occur when brain samples are tested using the additional electrode material RGO, two types of membranes are fixed on the Pt electrode: enzymatic with GluOx and inert without enzyme. The responses shown in
Figure 10 reveal that the additional electrode material RGO in contact with Pt is not sensitive to the components of the rat brain extract.
Notably, after the modification of the RGO electrode, the response of the biosensor is recorded within 10 s; without this modification, it develops within 20 s. In both cases, responses are rapid and comparable to those described in the literature [
12].
To evaluate the performance of both L-glutamate biosensors in real samples obtained from Mons University in which mutations in rats (DAT-knockout, DAT-KO) have been associated with dopamine transporter deficiency syndrome the brain extracts have been assessed as models of DTDS. The accuracy of the analysis in brain samples is tested using both types of biosensors and the responses are compared with the background signal responses (
Table 3). The results ensure that the ability of the biosensor to work at reduced electrode operating potentials increase the accuracy of the analysis. By examining the share of background currents in the biosensor response, in the case of the GluOxRGO/Pt biosensor, the background currents range from approximately 0.3% to 0.4% and the GluOx/Pt ranges from approximately 2% to 4% (
Table 3). From this finding, we conclude that the modification of the biosensor by RGO can result in the application of GluOxRGO/Pt for monitoring changes in lower concentrations of L-glutamate than GluOx/Pt.
The data in
Table 3 show that both the GluOx/Pt and GluOxRGO/Pt biosensors detect higher levels of L-glutamate in the RAT HET BRAIN 212 samples than in the other brain samples tested. RAT HET BRAIN 212 samples are from rats with dopamine transporter knockout mutation that are related to L-glutamate levels. The results presented in
Figure 11 demonstrate that the biosensors are suitable for analyzing changes in glutamate concentrations to investigate the role of L-glutamate in certain diseases, such as DTDS, which is a rare genetic disease affecting children with a deficit in the dopamine transporter. The results presented in
Figure 11 show that in almost all cases in different regions of the brain, the concentration of L-glutamate in WT animals is lower than that in DAT-KO animals. The reliability of the studies is confirmed by the fact that DAT-KO HET (heterozygous) is always between WT and DAT-KO. The largest amounts of L-glutamate are found in the PFC area in HYP and STR tissues. The highest differences in L-glutamate between DAT-KO and WT rats are found in the PFC and HYP regions. By considering that the weights of PFC, HYP, and STR tissues are approximately 10–15 or 3.4 times smaller than the weight of the CVT, it is evident that, in these zones of the brain, the role of L-glutamate is crucial. The fact that STR and PFC are important for behavior, especially in the development of adolescents, has been shown by Steinberg [
34]. In the area of MES, the opposite dependence is found, since the concentration of L-glutamate in DAT-KO is higher than that in WT. These facts allow the possibility of future studies exploring the potential of L-glutamate in the management of neurological diseases, such as DTDS.
5. Conclusions
Both GluOx/Pt and GluOxRGO/Pt biosensors can be applied for the detection of L-glutamate in bovine, mouse, and rat brain extracts. Slightly lower values of L-glutamate obtained in non-centrifuged samples than those obtained with centrifuged samples indicate that this type of biosensor can be applied for measurement in samples without any pretreatment.
The biosensor GluOx/Pt can operate reliably at a potential +0.6 V. The addition of RGO to the membrane of the GluOxRGO/Pt biosensor reduces the operating potential to +0.4 and +0.2 V. Additionally, the addition of the RGO layer significantly extends the linear part of the calibration curve.
Characterization of RGO reveals the functionalities that can be attributed to pyridinic nitrogen, pyridone nitrogen or -NH2 groups, and pyrrole-like nitrogen. In our opinion, these groups significantly improve electron transfer in the bioelectrochemical reaction, even at low electrode potentials. RGO acting in contact with Pt is not sensitive to the components of the rat brain extract. The results obtained in real samples of brain extracts ensure the biosensor ability to work at low electrode operating potentials, increasing the accuracy of the analysis. The modification of the biosensor by RGO can result in the application of GluOxRGO/Pt for monitoring changes in lower concentrations of L-glutamate than GluOx/Pt. More detailed studies with large cohort planning in the near future will provide a practical application for the investigation of CNS diseases, such as DTDS.


 ,
, 


