Article

A Fluorescence Strategy Based on Guanidinylated Carbon Dots and FAM-Labeled ssDNA for Facile Detection of Lipopolysaccharide

1
The 900th Hospital of Joint Logistics Team of the PLA, Fuzhou General Clinical Medical College of Fujian Medical University, Fuzhou 350025, China
2
Fujian Provincial Center for Disease Control and Prevention, Fuzhou 350012, China
3
Department of Pharmaceutical Analysis, School of Pharmacy, Fujian Medical University, Fuzhou 350122, China
*
Authors to whom correspondence should be addressed.
These authors contributed equally to this work.
Chemosensors 2024, 12(10), 201; https://doi.org/10.3390/chemosensors12100201
Submission received: 2 August 2024 / Revised: 9 September 2024 / Accepted: 27 September 2024 / Published: 1 October 2024

Abstract

:
The detection of lipopolysaccharide (LPS) has important value for the monitoring of diseases such as sepsis and the impurity control of drugs. In this work, we prepared guanidinylated carbon dots (GQ-CDs) and used them to adsorb 5-carboxyfluorescein (FAM)-labeled single-stranded DNA (ssDNA) to become GQ-CDs/FAM-DNA, resulting in quenched FAM. The quenching efficiency of the FAM-DNA by GQ-CDs in the GQ-CDs/FAM-DNA system was 91.95%, and this quenching was stable over the long term. Upon the addition of LPS, the quenched FAM-DNA in the GQ-CDs/FAM-DNA system regained fluorescence at 520 nm. The mechanism studies found that the addition of LPS promoted the dissociation of FAM-DNA adsorbed on GQ-CDs, thereby restoring fluorescence. The degree of fluorescence recovery was closely related to the content of LPS. Under optimized conditions, the fluorescence recovery was linearly related to LPS concentrations ranging from 5 to 90 μg/mL, with a detection limit of 0.75 μg/mL. The application of this method to plasma samples and trastuzumab injections demonstrated good spiked recoveries and reproducibility. This platform, based on GQ-CDs for the adsorption and quenching of FAM-DNA, enables the detection of LPS through relatively simple mixing operations, showing excellent competitiveness for the determination of actual samples under various conditions.

1. Introduction

Lipopolysaccharide (LPS) is a negatively charged amphiphilic polysaccharide. Structurally, it is composed of lipid A, extracellular polysaccharide O antigen, and interconnected core oligosaccharides [1]. LPS is the main structural component of the cell walls of Gram-negative bacteria and the main component of endotoxins [2,3]. LPS can induce host immune/inflammatory responses, cell apoptosis, and oxidative stress and cause inflammatory defense responses [1,2,3]. LPS is one of the most important factors inducing sepsis, which can cause serious consequences, such as high fever, septic shock, and even death [4,5]. Moreover, microorganisms, toxins, and other impurities may contaminate drugs during their manufacturing or use [6,7], which may result in the presence of heat sources, such as LPS or proteins in the drug, leading to the occurrence of drug fever. Therefore, the detection of LPS is essential for clinical toxin monitoring and drug impurity control.
The detection methods for LPS are mainly divided into two categories. The first group of analytical methods, including traditional rabbit pyrogenicity tests [6], horseshoe crab reagent tests [8], and monocyte activity tests [9,10], have been fabricated on the basis of the biological activity characteristics of LPS. The second group of quantitative methods, such as gas chromatography–mass spectrometry (GC-MS) [11], high-performance liquid chromatography–tandem mass spectrometry (HPLC/MS/MS) [12], and capillary zone electrophoresis (CE) [13], have been developed on the basis of the chemical structure of LPS. Although these methods have been developed for LPS detection, they have certain shortcomings, such as the limited sources of horseshoe crab reagents and the complexity of methods based on the structure of LPS. In recent years, detection methods based on biological recognition targets such as immune reactions and aptamers have gradually been paid attention to for the detection of LPS [14,15]. Among them, optical sensors have attracted great interest because of the advantages of stability, durability, and simplicity. Consequently, the use of LPS aptamers as recognition units, colorimetric methods [16], and fluorescence strategies [17,18] have been gradually designed for detecting LPS. The detection of LPS using fluorescent probe-labeled aptamers can achieve good sensitivity and operability [17,18]. However, most optical methods require recognition units similar to aptamers for LPS detection, which necessitates additional bonding coupling with increased costs. Establishing a detection system based on the direct interaction of LPS would be beneficial for ease of operation and reduced costs.
Carbon dots, a kind of fluorescent nanomaterial with a size below 10 nm and an adjustable surface, can exhibit excellent optical properties [19]. Increasing research has focused on designing and preparing a series of different carbon dots for pharmaceutical analysis methods for drug quality control [20]. Leveraging the diverse luminescent and surface properties of carbon dots, our group has conducted a series of studies on drug analysis and gene detection. These studies have leveraged the specific interactions between drugs and carbon dots [21,22,23], sometimes involving mediators to enhance these interactions [24,25]. By controlling the surface properties of carbon dots, we can achieve interactions between carbon dots and fluorescent dye-labeled ssDNA through electrostatic and/or hydrophobic interactions, resulting in fluorescence dye quenching [26]. Consequently, methods based on the signal-on strategy have been developed for detecting target genes using the interaction system of carbon dots and ssDNA [22,27]. Moreover, the specific interactions between carbon dots and bacterial cell walls can enhance the antibacterial activity of carbon dots [28,29,30]. Since LPS is a major component of bacterial cell walls, it is hypothesized that LPS may also directly interact with certain types of carbon dots, thereby establishing a detection platform for LPS.
Recently, effective carbon dots with guanidine and quaternary amino groups (abbreviated GQ-CDs) were prepared and applied to combat bacteria [31]. Inspired by the possible absorption system of carbon dots and ssDNA, herein, the interacting behavior of GQ-CDs and 5-carboxyfluorescein (FAM)-labeled single-stranded DNA (ssDNA) (FAM-DNA) was investigated. Unexpectedly, the quenched FAM-DNA, upon the introduction of GQ-CDs, can be recovered by the addition of LPS. The recovery levels from monitored FAM are controlled by the contents of LPS, as shown in Scheme 1. This method not only illustrated acceptable detection performance but also enabled the accurate determination of LPS in the plasma and pharmaceuticals. These findings suggest the feasibility of clinical diagnostics and pharmaceutical quality control methods without the need for specific LPS recognition agents, thereby offering enhanced convenience.

2. Experimental Section

2.1. Synthesis of GQ-CDs

GQ-CDs were prepared according to the reported work [31] with minor modulation. In a round-bottom flask, 0.2 g of CA was heated at 150 °C until completely melted. Then, 2 mL of DDA (60% aqueous solution) was added, and the reaction was continued for another 150 min. After adding 0.1 g of PHMG, the reaction was continued at 170 °C for one hour. After cooling down, the product was dialyzed (500–1000 D) for 48 h. Finally, the liquid was freeze-dried to obtain solid GQ-CDs and stored at 4 °C for further study.

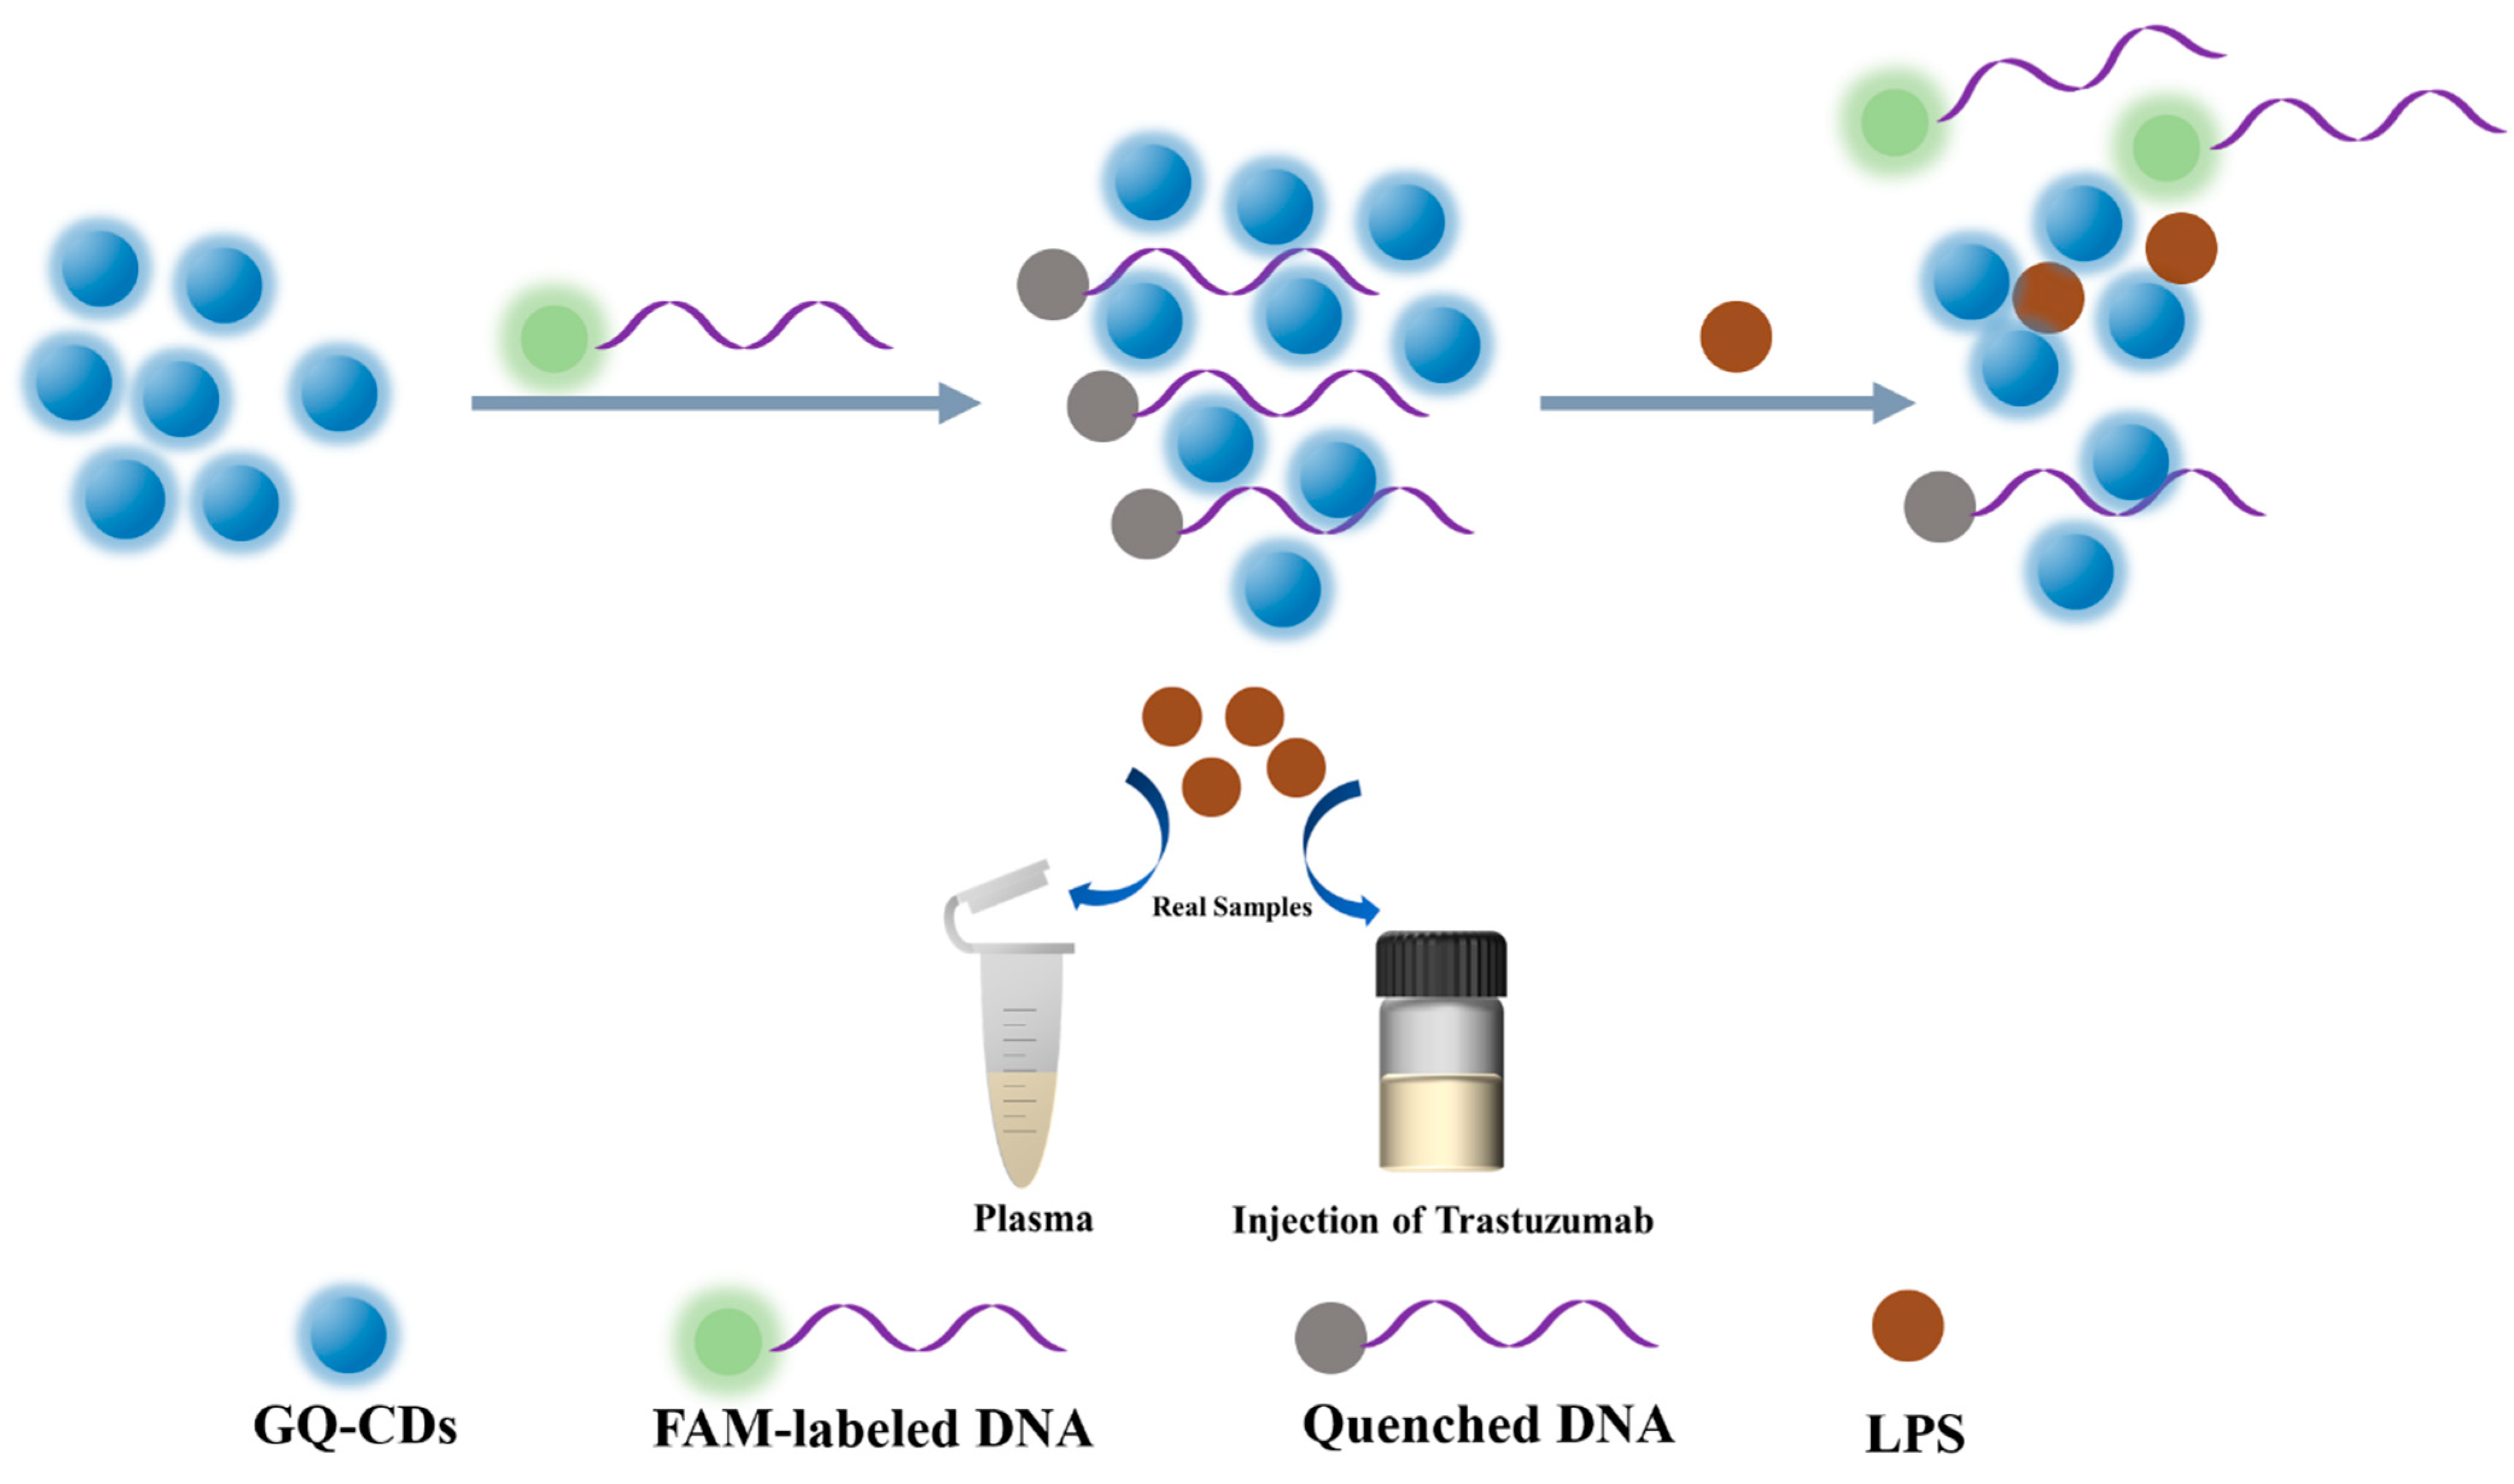
2.2. Establish the Quenching System of GQ-CDs and FAM-DNA (FAM-DNA/GQ-CDs)

The GQ-CDs were dispersed in pure water to prepare a series of solutions with concentrations of 0.625, 1.25, 2.5, 5, 10, 20, 40, and 80 μg/mL. Then, 100 μL of each GQ-CD solution was mixed with 100 μL of 100 nM FAM-DNA in the dark at room temperature for 10 min. The fluorescence intensity of each solution under excitation at 488 nm was measured. Fluorescence intensity spectra were plotted, and the quenching efficiencies were calculated to determine the optimal concentration for the quenching reaction. This process was repeated three times. Moreover, the fluorescence intensities of the GQ-CDs/FAM-DNA were continuously monitored with excitation at 488 nm for 22 days to assess the absorption stability of the GQ-CDs/FAM-DNA. The quenching efficiency (QE) was defined as the ratio of F/F0, where F0 and F are the fluorescence intensities of FAM-DNA in the absence and presence of GQ-CDs, respectively.

2.3. Feasibility of the GQ-CDs/FAM-DNA for LPS Detection

A quantity of 100 μL of 320 μg/mL LPS solution was added to 100 μL of the GQ-CDs/FAM-DNA quenching system. The mixture was allowed to react in the dark at room temperature for 10 min. Then, the fluorescence intensity of FAM was measured.

2.4. Analytical Performance of This Method for Detecting LPS

Under the optimal reaction conditions, the GQ-CDs/FAM-DNA quenching system was applied to detect LPS. First, 100 μL of LPS solution with concentrations ranging from 10 to 180 μg/mL were added to 100 μL of the GQ-CDs/FAM-DNA solution, respectively. The fluorescence spectra of each solution were measured with excitation at 488 nm. Fluorescence spectra were plotted and applied to evaluate the LPS concentrations on the basis of the intensities. Each process was repeated three times. The quantitative basis was the desorption rate ((F0 − F)/F0).
Using the same procedure, the GQ-CDs/FAM-DNA quenching system was applied to evaluate the selectivity against the common interfering substances.

2.5. Detection of LPS Content in Real Samples

Detecting the spiked recoveries of LPS in plasma samples: Blood plasma samples from three different healthy volunteers were collected and diluted 10-fold with PBS solution. Then, 20 μL of the diluted plasma samples and 80 μL of LPS solution with concentrations of 100, 150, and 200 μg/mL were added separately to 100 μL of the GQ-CDs/FAM-DNA solution. The reaction was carried out according to the previous operation conditions to monitor the fluorescence intensity, with excitation at 488 nm.
Detecting the spiked recovery of LPS in trastuzumab injections: First, 20 μL of trastuzumab injection solution with a concentration of 21 mg/mL and 80 μL of LPS solutions with concentrations of 50, 75, and 100 μg/mL were added separately to 100 μL of the GQ-CDs/FAM-DNA solution. The reaction was carried out according to the previous operation conditions to monitor the fluorescence intensity, with excitation at 488 nm.

3. Results and Discussion

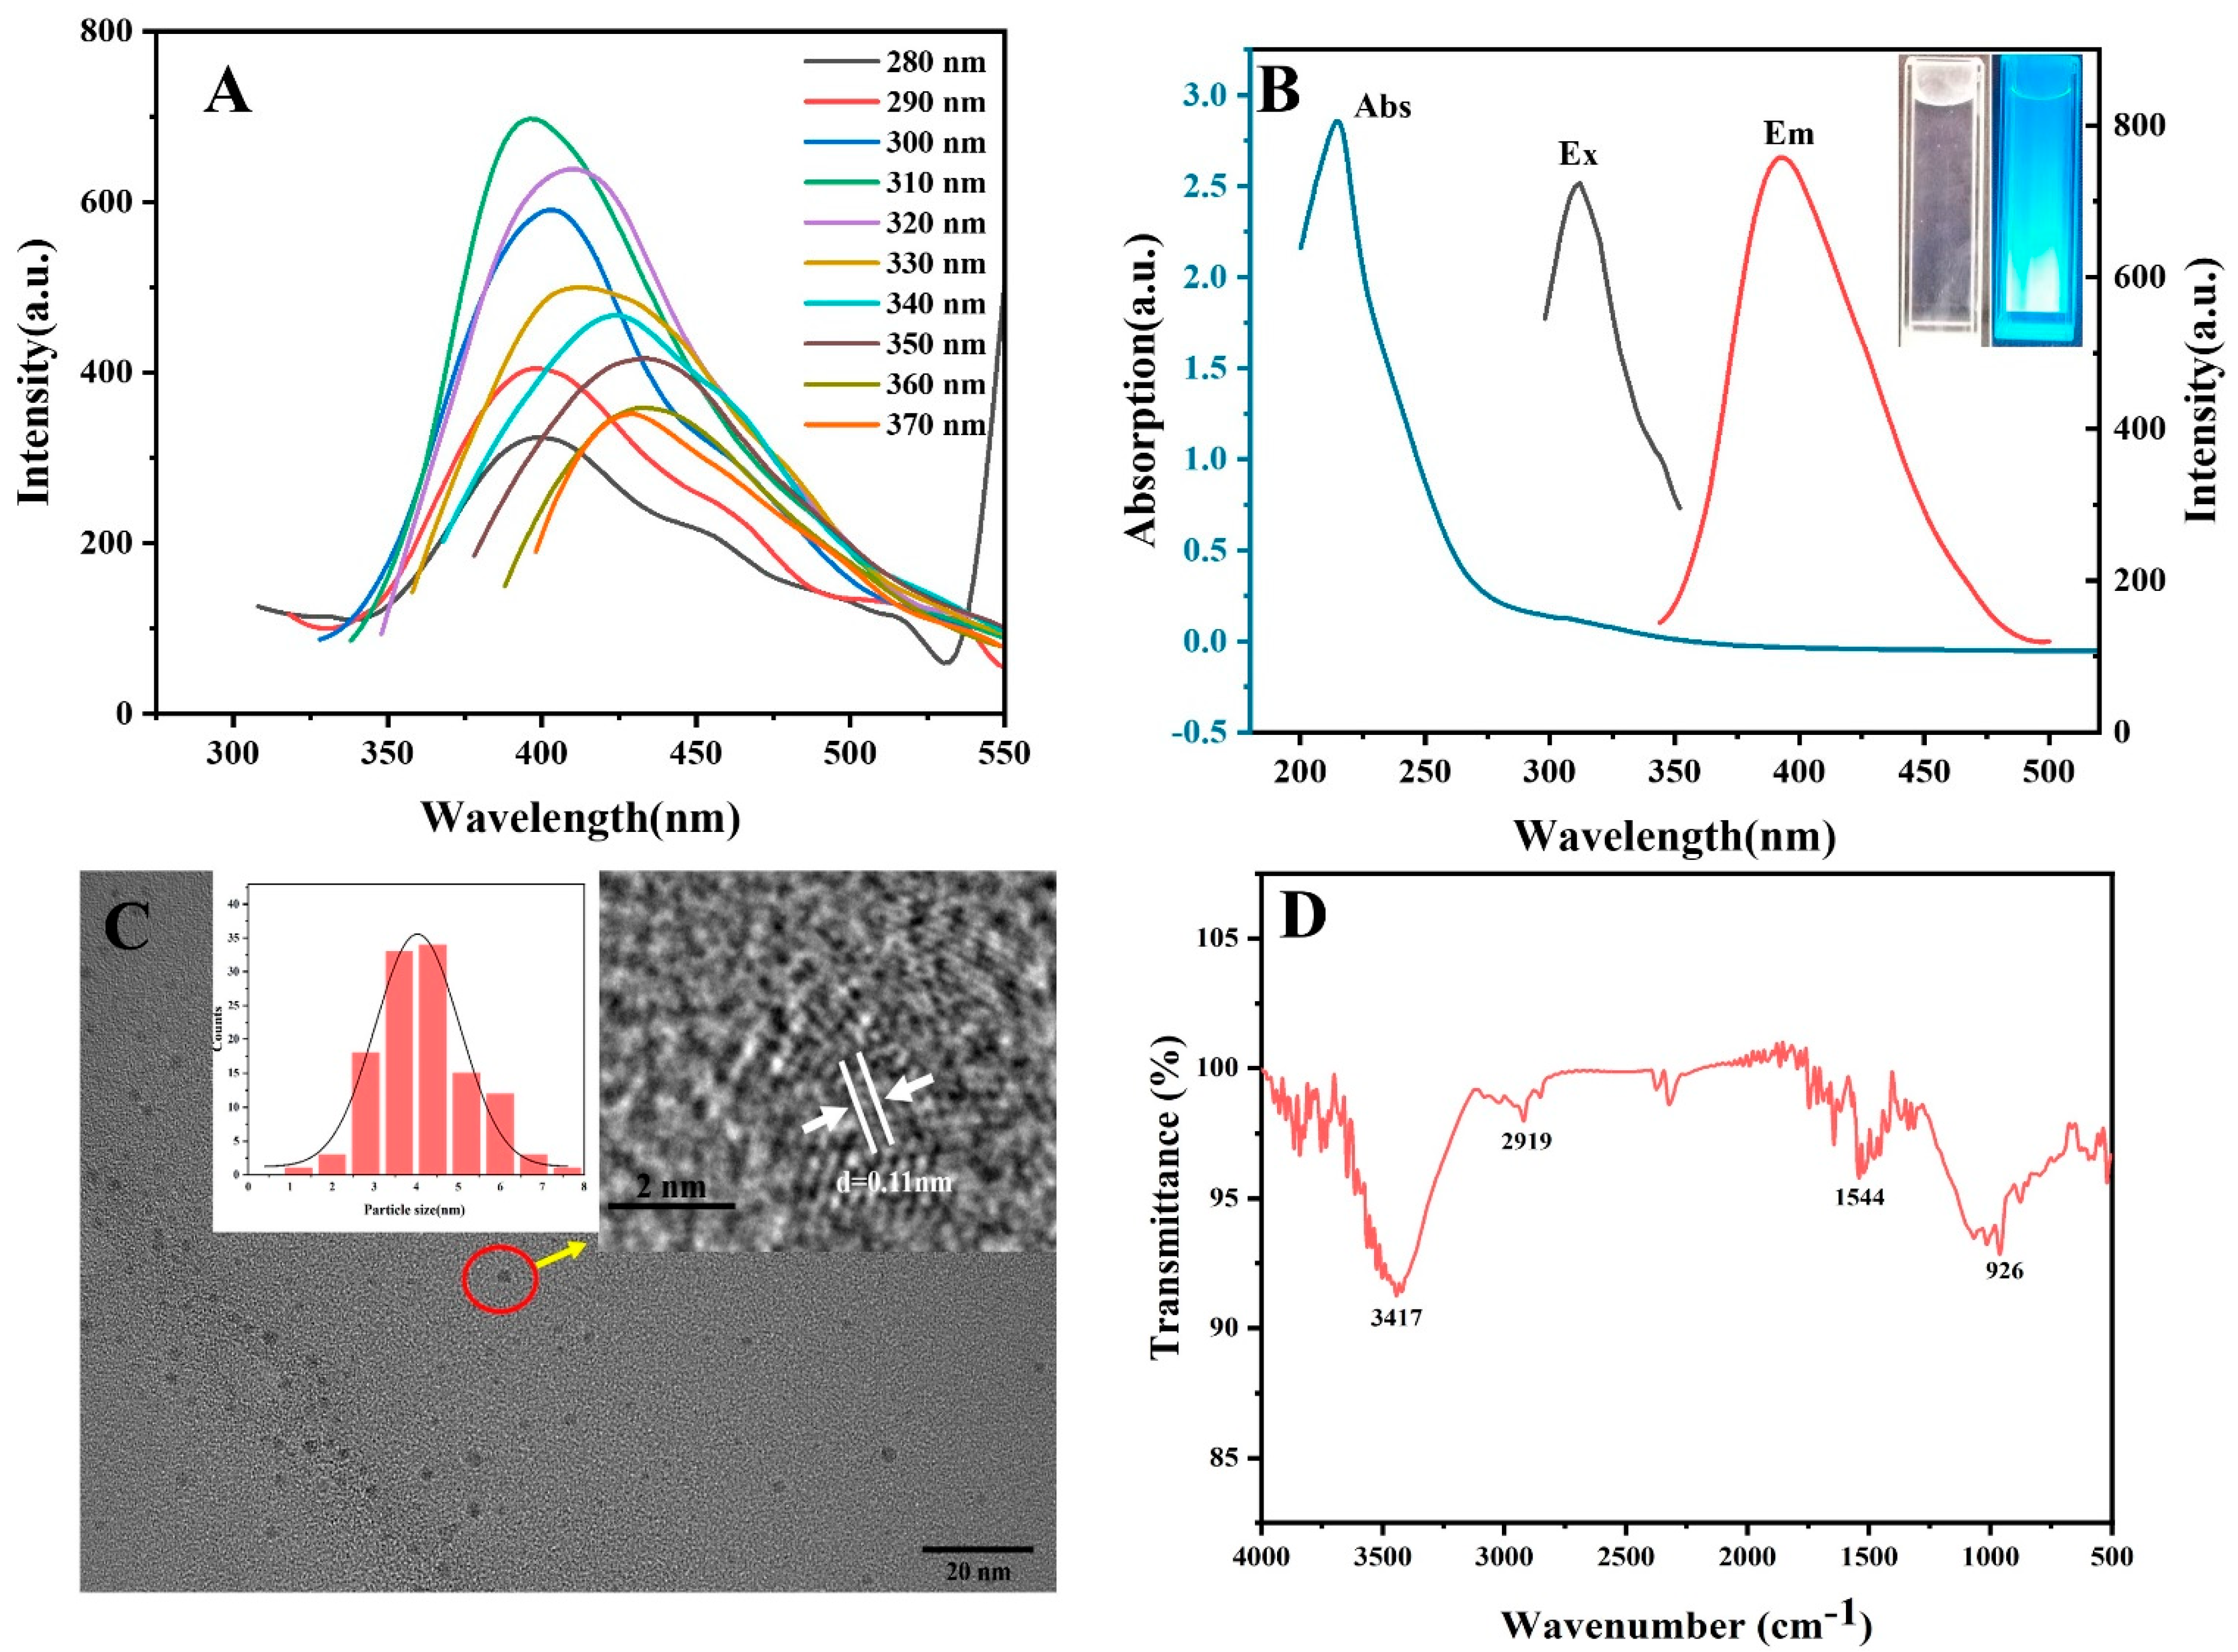
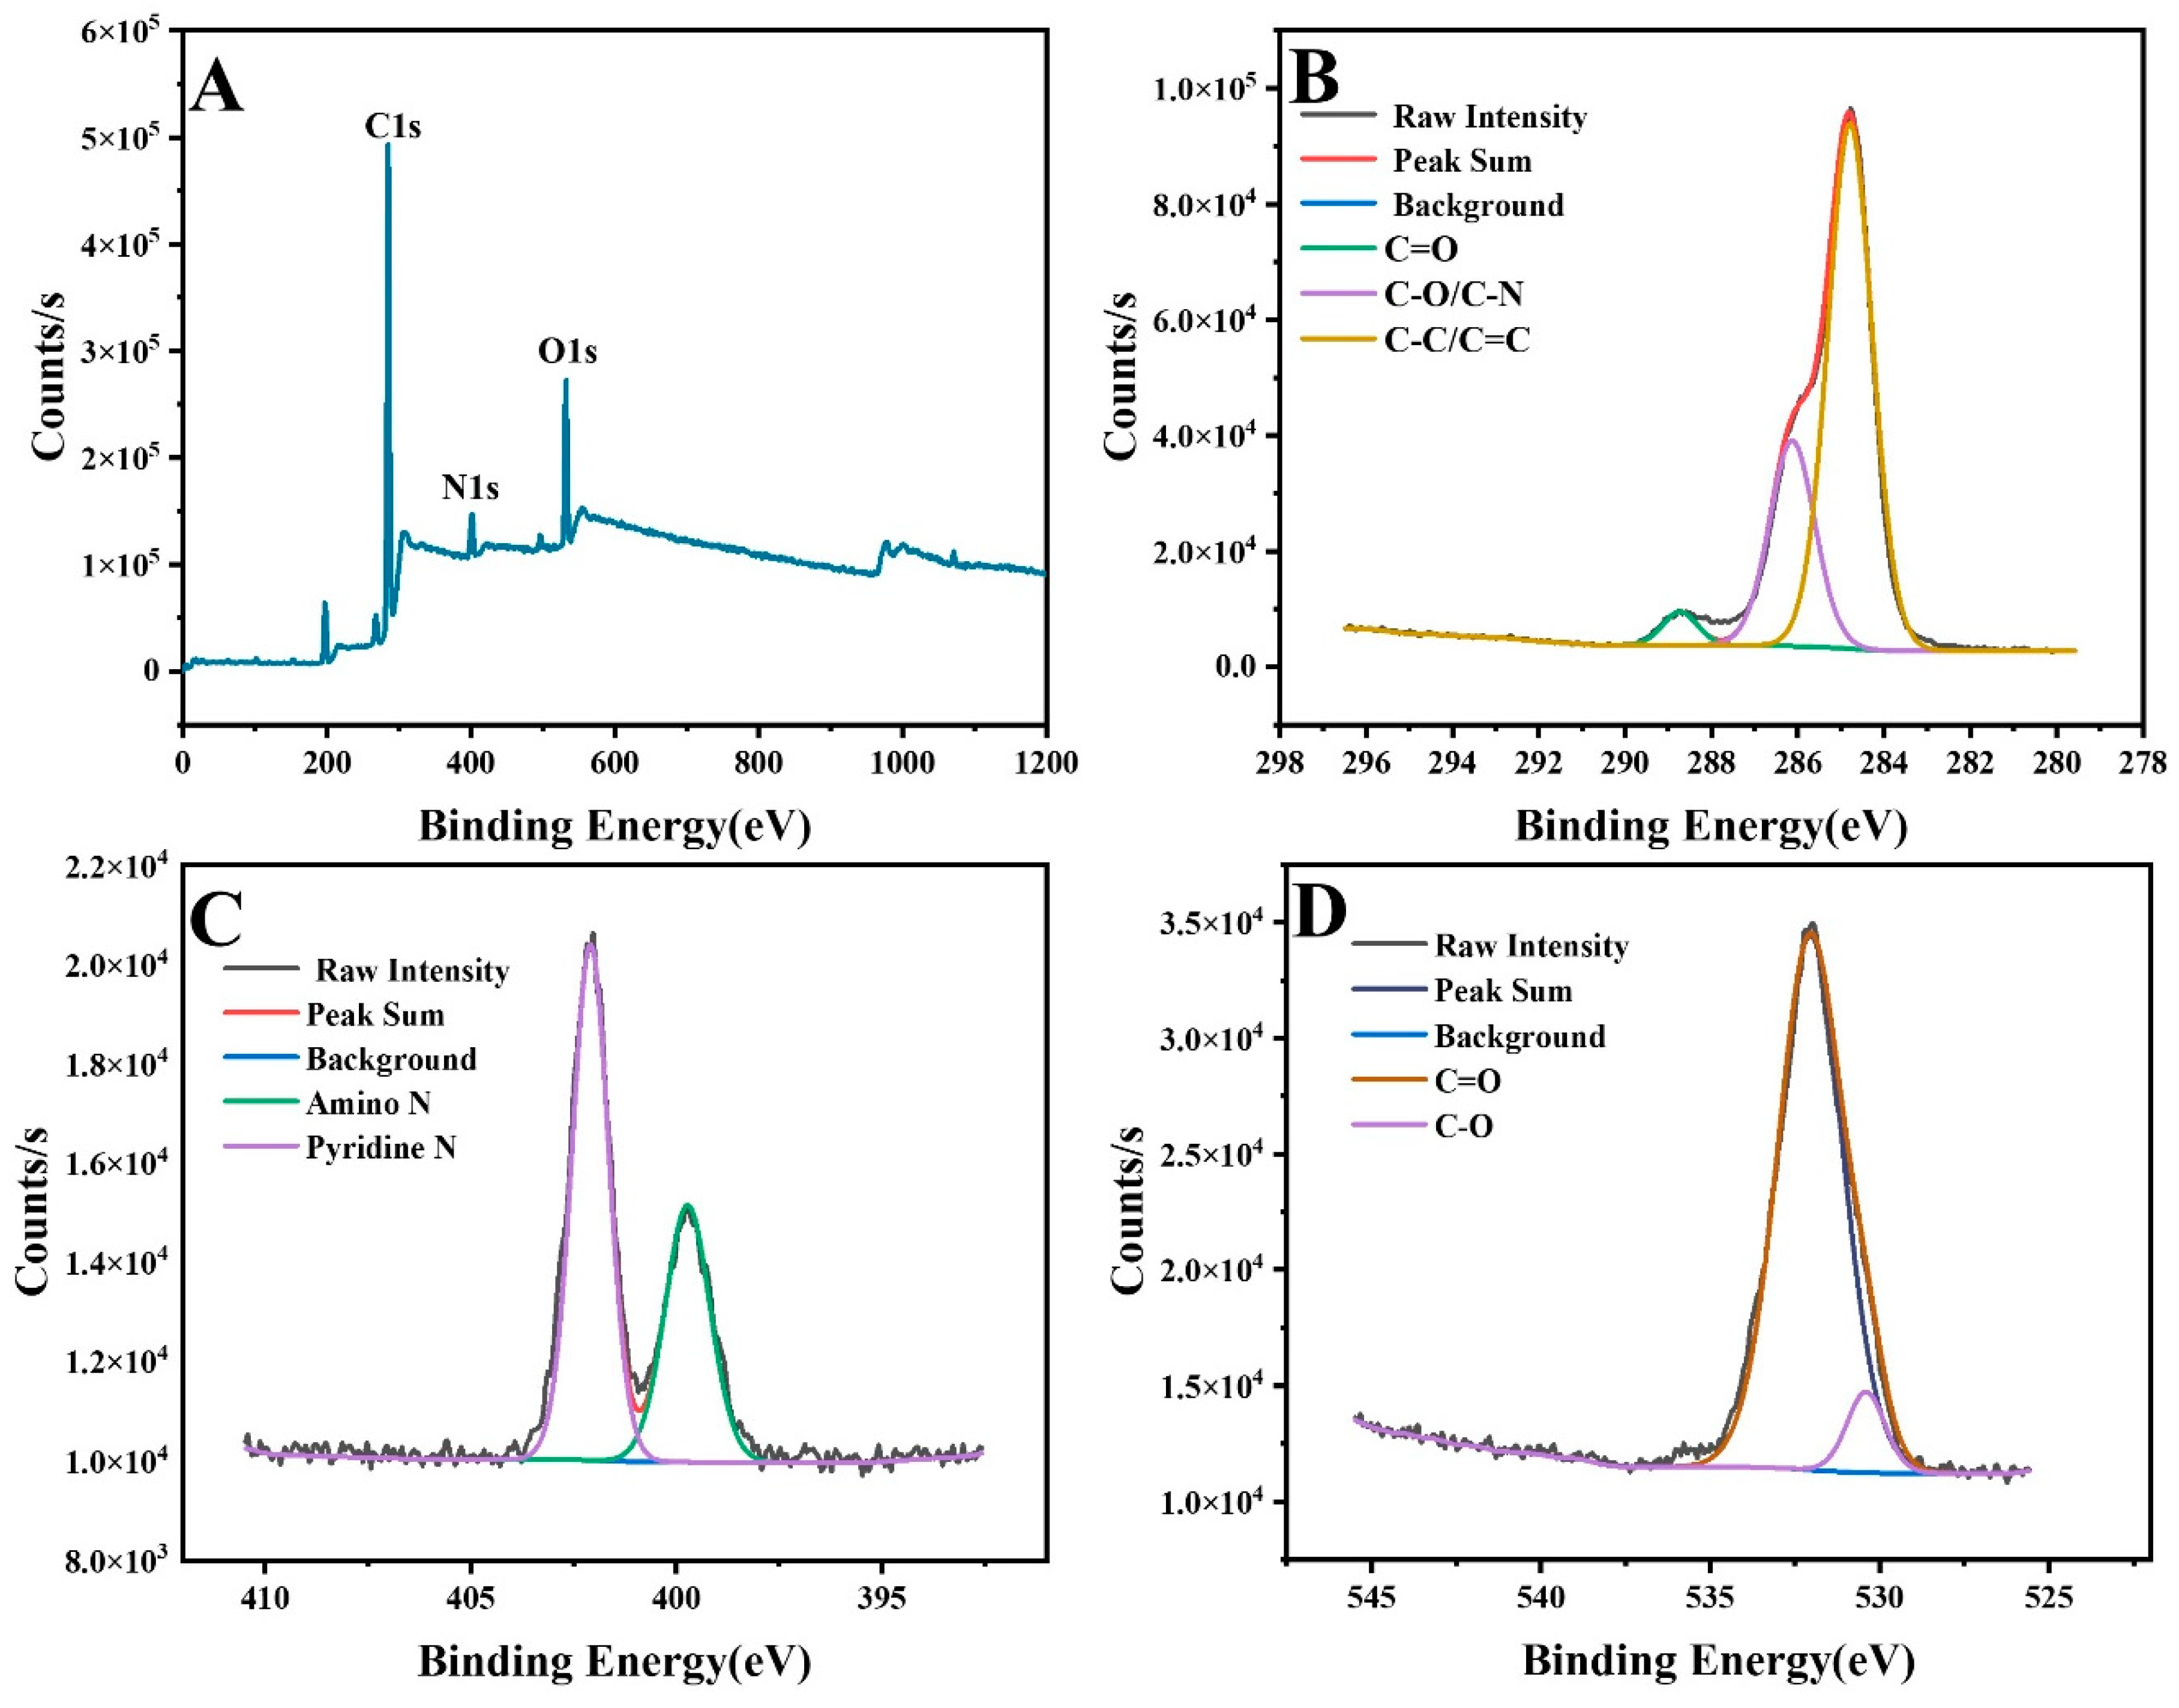
3.1. Characterization of GQ-CDs

The optical properties of GQ-CDs were characterized. The GQ-CDs exhibited variable emission wavelengths and intensities with different exciting wavelengths, suggesting the wavelength-dependent properties of GQ-CDs (Figure 1A). At the optimal excitation wavelength of 310 nm, the GQ-CDs exhibited an emission spectrum with a maximum peak of 390 nm (Figure 1B). The GQ-CDs were almost colorless and transparent under white light, but blue fluorescence appeared under ultraviolet light (inset of Figure 1B). The fluorescence intensities of the GQ-CDs showed little fluctuation with exposure to continuous UV illumination for 60 min, suggesting stability and excellent anti-photobleaching properties (Figure S1). Moreover, the UV–vis absorbance spectrum of the GQ-CDs exhibited a sharp absorption peak at 214 nm, ascribed to the π-π* of the C=C in sp2 hybridization carbon core (Figure 1B) [32]. The morphology of the GQ-CDs characterized by transmission electron microscopy (TEM) showed that the GQ-CDs appeared as dispersed, circular nanoparticles with an average diameter of approximately 2.25 nm (Figure 1C). High-resolution TEM (HRTEM) revealed a lattice spacing of 0.11 nm for GQ-CDs, and the size distribution implied the uniform structure of GQ-CDs.
The functional groups and elemental compositions of the GQ-CDs were characterized by FTIR and X-ray photoelectron spectroscopy (XPS). The FTIR analysis of the GQ-CDs identified several characteristic molecular groups (Figure 1D). A prominent peak at 3417 cm−1 corresponding to N-H stretching vibration indicated successful nitrogen doping. Additionally, a peak observed at 2919 cm−1 was associated with C-H bond stretching vibration. A distinct peak at 1544 cm−1 reflected a strong C=C stretching vibration, suggesting the effective formation of surface carbon nuclei. Moreover, the absorption peak at 926 cm−1 was attributed to the stretching vibration associated with the interaction between the positively charged nitrogen atom and the connected organic group, confirming the successful incorporation of surface quaternary ammonium salts (Figure 1D) [33]. XPS analysis provided detailed insights into the elemental composition and functional groups of GQ-CDs. The full-spectrum XPS mapping (Figure 2A) revealed signals corresponding to C1s (284.44 eV), N1s (401.91 eV), and O1s (531.89 eV), with atomic concentrations of 81.32%, 8.58%, and 10.1%, respectively. The high-resolution C1s XPS spectra displayed characteristic peaks for C-C/C=C (284.6 eV), C-O/C-N (285.7 eV), and C=O (286.3 eV) (Figure 2B). The high-resolution N1s XPS spectra exhibited two distinct binding energy peaks at 399.4 eV and 402.2 eV, attributed to -NH2, guanidine, and quaternary amine groups, respectively [31,34,35] (Figure 2C). The high-resolution O1s XPS spectra revealed two fitting bands at 531.5 eV for C-O and 532.4 eV for C=O (Figure 2D). Collectively, the FTIR and XPS results elucidated the structural characteristics of the GQ-CDs.

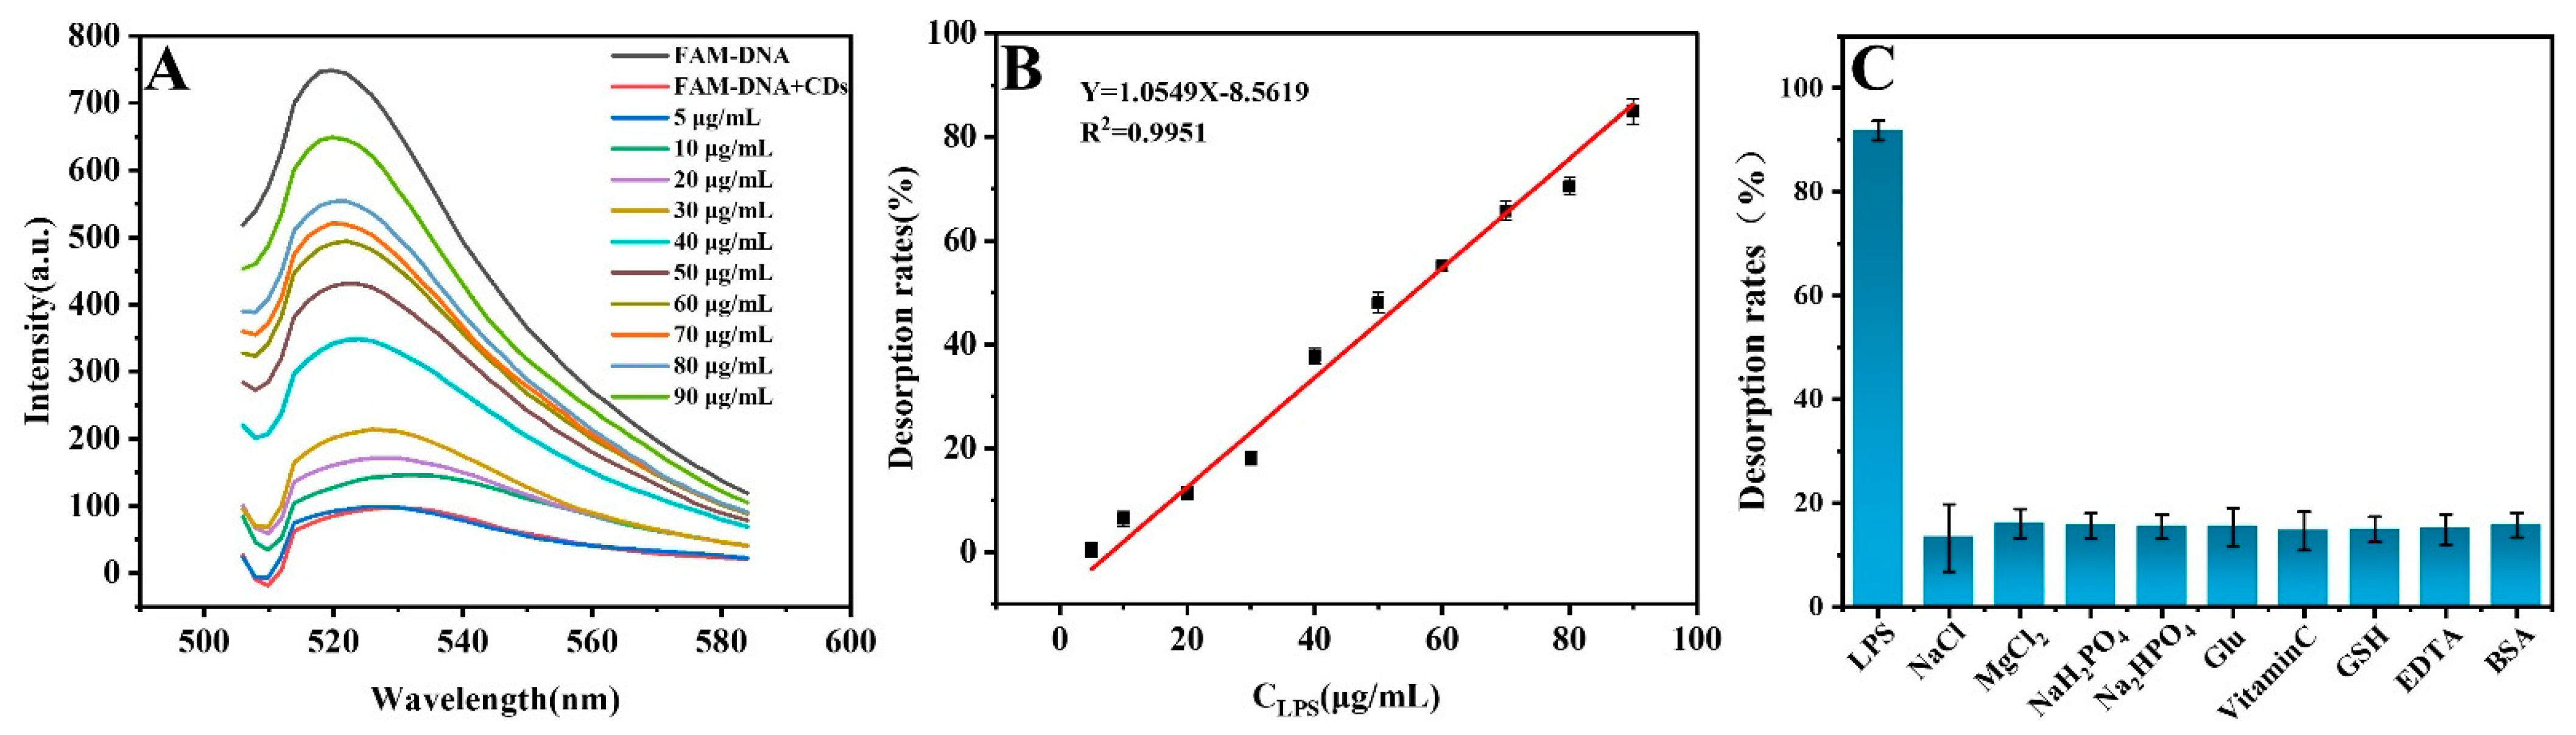
3.2. Establishment and Properties of GQ-CDs/FAM-DNA System

Using GQ-CDs as a potential absorption carrier, the interaction of GQ-CDs and FAM-DNA was investigated by monitoring the fluorescence response of FAM-DNA. At a fixed content of FAM-DNA, the fluorescence intensities decreased gradually with increasing concentrations of GQ-CDs (Figure 3A). This observation highlights the significant role of GQ-CDs in the absorption and quenching efficiency (QE) of FAM-DNA. Higher concentrations of GQ-CDs led to enhanced QE, with the QE reaching 90.23% when the GQ-CD concentration was 10 μg/mL. Further increases to 20 μg/mL and 40 μg/mL resulted in QEs of 91.33% and 91.95%, respectively, which remained relatively stable (Figure 3B). At a final concentration of 40 μg/mL, the dynamics of the absorption effect of the GQ-CDs on FAM-DNA were monitored. As shown in Figure 3C, the fluorescence intensity of FAM-DNA initially decreased sharply within 1 min of mixing with GQ-CDs and then stabilized, indicating rapid absorption kinetics. Over time, the QE was found to be consistently stable (Figure 3D). Optimal quenching conditions for the GQ-CDs/FAM-DNA system were determined to be 40 μg/mL of GQ-CDs and 10 min of interaction time to maintain system stability. Under light-shielded conditions at 4 °C over a period of 22 days, the QE of the GQ-CDs/FAM-DNA system showed minimal variation, with a QE of 81.82% observed after 22 days (Figure S2). This result underscores the system’s long-term stability, essential for practical applications in diagnostics and sensing.

3.3. The Feasibility and the Mechanism of the Detection Strategy

The feasibility of the detection of LPS using the direct interaction of LPS and the GQ-CDs/FAM-DNA system was carried out by monitoring the changed fluorescence of FAM-DNA. As shown in Figure 4A, the addition of LPS to the GQ-CDs/FAM-DNA system restored the fluorescence intensity of the quenched FAM-DNA to a certain degree. There was no change in the fluorescence of the GQ-CDs before and after the direct interaction with LPS (Figure 4B). The mechanism of LPS detection was further discussed. The zeta potential of the pure GQ-CDs was measured to be +4.01 mV (Figure 4C), indicating a positively charged surface due to the presence of amino, guanidine, and quaternary amine groups, which was proven by FTIR and XPS (Figure 1 and Figure 2). Correspondingly, the naturally negatively charged FAM-DNA can bind to GQ-CDs through electrostatic adsorption [26], thereby quenching its fluorescence. Further examination of the adsorption capacity and the interaction process of LPS in the GQ-CDs/FAM-DNA system was conducted by monitoring fluorescence anisotropy (FA). FA is a reproducible homogeneous detection method based on the rotational motion of fluorescently labeled molecules, with high FA observed when the fluorescent group is adsorbed on the nanomaterial surface and reduced FA when it is away from the material surface [36]. As shown in Figure 4D, the FA of free FAM-DNA was measured to be 0.027, while that of GQ-CDs/FAM-DNA was 0.278, indicating the anchoring of FAM-DNA on GQ-CDs. Upon the introduction of LPS, the FA sharply decreased to 0.035, close to that of free FAM-DNA, suggesting the detachment of FAM-DNA from GQ-CDs upon the addition of LPS. This result confirms that LPS can replace the adsorbed FAM-DNA, allowing FAM-DNA to dissociate and thereby restoring the luminescence of FAM. The recovery intensity of FAM was related to the concentration of LPS.

3.4. Evaluating the Analytical Performance

On the basis of the optimal quenching conditions (Figure 3), the reaction time and temperature of the interaction between LPS and the GQ-CDs/FAM-DNA were optimized. As the reaction time increased, the fluorescence intensities of FAM-DNA gradually recovered with increased desorption rates (Figure S3). Stable desorption rates were observed after 10 min, suggesting that this is the optimal time for detecting LPS. Correspondingly, when the reaction time was fixed, the highest recovered fluorescence intensity with the calculated desorption rate was observed at 25 °C (Figure S4). Thus, the optimal reaction time and temperature for LPS detection were set at 10 min and 25 °C, respectively.
Under the optimized conditions, the detection of different concentrations of LPS was carried out using the GQ-CDs/FAM-DNA. As shown in Figure 5A, the fluorescence intensities of FAM-DNA at around 520 nm gradually increased with the increasing concentrations of LPS. The desorption rates of FAM-DNA caused by LPS showed a good linear relationship with the concentrations of LPS in the range of 5–90 μg/mL, with a linear equation of Y = 1.8426 + 0.9605X and a coefficient of determination (R2) of 0.9951 (Figure 5B). The detection limit was calculated to be 0.75 μg/mL according to 3σ/S, where S is the slope of the linear fitting equation and σ is the SD of the blank (n = 10). Compared with the reported analytical methods for LPS [37,38,39,40], this method exhibited an acceptable detection limit with a wide linear range. Moreover, the selectivity of this method was evaluated using common possible interferents. As shown in Figure 5C, the potential coexisting ions, proteins, essential organic substances in the blood circulation, antioxidants, and free radical scavengers such as glutathione (GSH) were applied to investigate the anti-interference ability of this method for detecting LPS. Under the same experimental procedure, the desorption rate of LPS was significant, while the potential interfering substances failed to restore the fluorescence of FAM-DNA, indicating the high specificity of this method for detecting LPS based on the GQ-CDs/FAM-DNA system (Figure 5C).

3.5. Detection of Actual Samples

The real application potential of this method was investigated. Firstly, the feasibility of this method for detecting LPS in human plasma was evaluated using spiked recovery determination. As shown in Table S1, the spiked recoveries in the diluted plasma from three healthy volunteers were within the range of 95.13% to 103.95%, with RSDs of less than 2%. This indicates the potential value of the system for detecting LPS in plasma. In liquid formulations, injectables require procedures such as preparation, filtration, sealing, and sterilization to be completed within a specified time. Factors such as the quality of raw materials, preparation processes, and environmental cleanliness can introduce contaminants at each step. Therefore, using LPS as the representative heat source, the testing of LPS in injectables was carried out. Taking trastuzumab injection as an example, the proposed method was further applied to monitor the spiked recovery of LPS in actual injection samples. As shown in Table S2, the recoveries ranged from 91.81% to 102.50%, with RSDs of less than 2%, demonstrating the potential of the system for detecting LPS in pharmaceutical injectable samples for impurity testing.

4. Conclusions

We developed a simple approach for synthesizing stable blue-fluorescent carbon dots (GQ-CDs) using a one-pot method; these can interact with FAM-DNA and be employed for the detection of LPS. This study leveraged the robust electrostatic interactions between GQ-CDs and FAM-DNA, coupled with the competitive binding dynamics of LPS displacing FAM-DNA, enabling the rapid and ambient detection of LPS without the need for supplementary agents or operation procedures. Under optimized conditions, this method demonstrates acceptable performance regarding linearity and a low detection limit. Furthermore, the successful validation of this methodology in detecting LPS in authentic plasma samples and common clinical medications underscores its practical applicability. Although the detection performance still needs to be improved, this research underscores the pivotal role of surface charge engineering in fluorescent nanomaterials, such as carbon dots and alternative quantum dots, in guiding the design of DNA carriers and advancing the comprehension of the intricate interplay between fluorescent nanomaterials and DNA.

Supplementary Materials

The following supporting information can be downloaded at: https://www.mdpi.com/article/10.3390/chemosensors12100201/s1, Figure S1: The fluorescence intensities of GQ-CDs with exciting at 310 nm for 60 min; Figure S2: The QEs of FAM-DNA in GQ-CDs/FAM-DNA with the prolonged times; Figure S3: The effect of reacting time on the desorption rates of FAM-DNA in GQ-CDs/FAM-DNA with LPS; Figure S4: The effect of reacting temperatures on the desorption rates of FAM-DNA in GQ-CDs/FAM-DNA with LPS; Table S1: Detection of LPS in human plasma samples; Table S2: Recovery of LPS spiking in trastuzumab injections.

Author Contributions

Z.Z.: Methodology, Formal analysis; Writing—original draft, Project administration; J.L.: Methodology, Formal analysis, Data curation; G.P.: Methodology, Data curation; J.W.: Formal analysis, Investigation, Data Curation; Y.W.: Methodology, Software; K.P.: Investigation, Resources; X.Z.: Methodology, Data curation; Z.H.: Formal analysis, Investigation, Conceptualization; S.W.: Conceptualization, Writing—original draft. All authors have read and agreed to the published version of the manuscript.

Funding

This research was funded by the National Science Foundation of Fujian Province (Nos. 2022J01493 and 2021J01694).

Institutional Review Board Statement

The study was conducted in accordance with the Declaration of Helsinki, and approved by the Ethics Committee of the 900th Hospital of Joint Logistics Team of the PLA (2024-04-08).

Informed Consent Statement

Informed consent was obtained from all subjects involved in the study.

Data Availability Statement

Data are available from the authors upon reasonable request.

Acknowledgments

Not applicable.

Conflicts of Interest

The authors declare no conflicts of interest.

References

  1. Wang, X.Y.; Quinn, P.J. Lipopolysaccharide: Biosynthetic pathway and structure modification. Prog. Lipid Res. 2010, 49, 97–107. [Google Scholar] [CrossRef] [PubMed]
  2. Sperandeo, P.; Martorana, A.M.; Polissi, A. The lipopolysaccharide transport (Lpt) machinery: A nonconventional transporter for lipopolysaccharide assembly at the outer membrane of Gram-negative bacteria. J. Biol. Chem. 2017, 292, 17981–17990. [Google Scholar] [CrossRef] [PubMed]
  3. Cross, A.S. Hit ‘em Where It Hurts: Gram-Negative Bacterial Lipopolysaccharide as a Vaccine Target. Microbiol. Mol. Biol. Rev. 2023, 87, e00045-22. [Google Scholar] [CrossRef]
  4. Ma, F.B.; Li, Z.; Cao, J.; Kong, X.Q.; Gong, G.P. A TGFBR2/SMAD2/DNMT1/miR-145 negative regulatory loop is responsible for LPS-induced sepsis. Biomed. Pharmacother. 2019, 112, 108626. [Google Scholar] [CrossRef]
  5. Ji, Z.R.; Xue, W.L.; Zhang, L.; Schisandrin, B. Attenuates Inflammation in LPS-Induced Sepsis Through miR-17-5p Downregulating TLR4. Inflammation 2019, 42, 731–739. [Google Scholar] [CrossRef]
  6. Solati, S.; Zhang, T.; Timman, S. The monocyte activation test detects potentiated cytokine release resulting from the synergistic effect of endotoxin and non-endotoxin pyrogens. Innate Immun. 2022, 28, 130–137. [Google Scholar] [CrossRef] [PubMed]
  7. An, Z.F.; Jang, C.H. Simple and Label-Free Liquid Crystal-based Optical Sensor for Highly Sensitive and Selective Endotoxin Detection by Aptamer Binding and Separation. ChemistrySelect 2019, 4, 1416–1422. [Google Scholar] [CrossRef]
  8. Yamashita, K.; Takahashi, D.; Yamamoto, Y.; Kiyomoto, S.; Shibata, T.; Kawabata, S. Effects of Ca2+ ions on the horseshoe crab coagulation cascade triggered by lipopolysaccharide. J. Biochem. 2023, 174, 47–58. [Google Scholar] [CrossRef] [PubMed]
  9. Pardo-Ruiz, Z.; Menéndez-Sardiñas, D.E.; Pacios-Michelena, A.; Gabilondo-Ramírez, T.; Montero-Alejo, V.; Perdomo-Morales, R. Soluble β-(1,3)-glucans enhance LPS-induced response in the monocyte activation test, but inhibit LPS-mediated febrile response in rabbits: Implications for pyrogenicity tests. Eur. J. Pharm. Sci. 2016, 81, 18–26. [Google Scholar] [CrossRef]
  10. Stang, K.; Fennrich, S.; Krajewski, S.; Stoppelkamp, S.; Burgener, I.A.; Wendel, H.; Post, M. Highly sensitive pyrogen detection on medical devices by the monocyte activation test. J. Mater. Sci. Mater. Med. 2014, 25, 1065–1075. [Google Scholar] [CrossRef]
  11. Cui, F.C.; Zhu, P.; Ji, J.; Blaženović, I.; Gholami, M.; Zhang, Y.Z.; Sun, X.L. Gas chromatography-mass spectrometry metabolomic study of lipopolysaccharides toxicity on rat basophilic leukemia cells. Chem.-Biol. Interact. 2018, 281, 81–88. [Google Scholar] [CrossRef]
  12. de Barros, J.P.P.; Gautier, T.; Sali, W.; Adrie, C.; Choubley, H.; Charron, E.; Lalande, C.; Guern, N.L.; Deckert, V.; Monchi, M.; et al. Quantitative lipopolysaccharide analysis using HPLC/MS/MS and its combination with the limulus amebocyte lysate assay. J. Lipid Res. 2015, 56, 1363–1369. [Google Scholar] [CrossRef]
  13. Fung, F.M.; Su, M.; Feng, H.T.; Li, S.F.Y. Extraction, separation and characterization of endotoxins in water samples using solid phase extraction and capillary electrophoresis-laser induced fluorescence. Sci. Rep. 2017, 7, 10774. [Google Scholar] [CrossRef]
  14. Fux, A.C.; Melo, C.C.; Michelini, S.; Swartzwelter, B.J.; Neusch, A.; Italiani, P.; Himly, M. Heterogeneity of Lipopolysaccharide as Source of Variability in Bioassays and LPS-Binding Proteins as Remedy. Int. J. Mol. Sci. 2023, 24, 8395. [Google Scholar] [CrossRef]
  15. Ye, H.; Zhou, Y.; Ma, P.F.; Guo, Y.X.; Wang, Z.P. Analysis of the anti-inflammatory effect of the aptamer LA27 and its binding mechanism. Int. J. Biol. Macromol. 2020, 165, 308–313. [Google Scholar] [CrossRef]
  16. Zhu, L.J.; Li, S.T.; Shao, X.L.; Feng, Y.X.; Xie, P.Y.; Luo, Y.B.; Huang, K.L.; Xu, W.T. Colorimetric detection and typing of E-coli lipopolysaccharides based on adual aptamer-functionalized gold nanoparticle probe. Microchim. Acta 2019, 186, 111. [Google Scholar] [CrossRef]
  17. Niu, J.X.; Hu, X.M.; Ouyang, W.; Chen, Y.; Liu, S.W.; Han, J.; Liu, L.H. Femtomolar Detection of Lipopolysaccharide in Injectables and Serum Samples Using Aptamer-Coupled Reduced Graphene Oxide in a Continuous Injection-Electrostacking Biochip. Anal. Chem. 2019, 91, 2360–2367. [Google Scholar] [CrossRef]
  18. Yang, X.Y.; Li, J.Y.; Tan, X.H.; Yang, X.J.; Song, P.; Ming, D.M.; Yang, D.Q. Ratiometric fluorescence probe integrated with smartphone for visually detecting lipopolysaccharide. Spectrochim. Acta Part A Mol. Biomol. Spectrosc. 2023, 286, 121961. [Google Scholar] [CrossRef]
  19. Adeola, A.O.; Clermont-Paquette, A.; Piekny, A.; Naccache, R. Advances in the design and use of carbon dots for analytical and biomedical applications. Nanotechnology 2024, 35, 012001. [Google Scholar] [CrossRef]
  20. Mohiuddin, I.; Singh, R.; Kaur, V. A Review of Sensing Applications of Molecularly Imprinted Fluorescent Carbon Dots for Food and Biological Sample Analysis. Crit. Rev. Anal. Chem. 2023, 1–22. [Google Scholar] [CrossRef]
  21. Cai, R.Y.; Miao, C.F.; Zhang, L.; Zhou, Y.; Liu, Y.B.; Zheng, C.; Han, W.D.; Huang, Z.J.; Zhou, X.; Weng, S.H. Determination and the pharmacokinetic study of tigecycline by fluorescence strategy with F, N codoping carbon dots as probe. Sens. Actuators B Chem. 2022, 361, 131721. [Google Scholar] [CrossRef]
  22. Wang, Z.Z.; Chen, Y.P.; Zhang, M.H.; Xu, L.L.; Xu, Y.C.; Chen, L.; Yin, X.Y.; Yang, S.Y.; Weng, S.H.; Zheng, Y.J.; et al. Fluorine-doped carbon dots (F-CDs) adsorbing DNA via hydrophobic interaction play dual-role of quenching carrier and signal reference for ratiometric fluorescence strategy to detect microRNA. Sens. Actuators B Chem. 2024, 403, 135180. [Google Scholar] [CrossRef]
  23. Deng, X.Q.; Zhang, M.H.; Wang, Y.; Li, C.P.; Zhang, X.T.; Weng, S.H.; Li, Y.M. Carbon dots with selective fluorescence response to hydroxyl radical for sensitive detection of bleomycin. Spectrochim. Acta Part A Mol. Biomol. Spectrosc. 2024, 306, 123582. [Google Scholar] [CrossRef] [PubMed]
  24. Miao, C.F.; Guo, X.Z.; Zhang, X.T.; Lin, Y.N.; Han, W.D.; Huang, Z.J.; Weng, S.H. Ratiometric fluorescence assay based on carbon dots and Cu2+-catalyzed oxidation of O-Phenylenediamine for the effective detection of deferasirox. RSC Adv. 2021, 11, 34525–34532. [Google Scholar] [CrossRef]
  25. Han, W.D.; Miao, C.F.; Zhang, X.T.; Lin, Y.N.; Hao, X.L.; Huang, Z.J.; Weng, S.H.; Lin, X.H.; Guo, X.Z.; Huang, J.Y. A signal-off fluorescent strategy for deferasirox effective detection using carbon dots as probe and Cu2+ as medium. Anal. Chim. Acta 2021, 1179, 338853. [Google Scholar] [CrossRef]
  26. Guo, R.B.; Chen, B.; Li, F.L.; Weng, S.H.; Zheng, Z.F.; Chen, M.; Wu, W.; Lin, X.H.; Yang, C.Y. Positive carbon dots with dual roles of nanoquencher and reference signal for the ratiometric fluorescence sensing of DNA. Sens. Actuators B Chem. 2018, 264, 193–201. [Google Scholar] [CrossRef]
  27. Wang, Z.Z.; Xue, Z.Q.; Hao, X.L.; Miao, C.F.; Zhang, J.Z.; Zheng, Y.J.; Zheng, Z.F.; Lin, X.H.; Weng, S.H. Ratiometric fluorescence sensor based on carbon dots as internal reference signal and T7 exonuclease-assisted signal amplification strategy for microRNA-21 detection. Anal. Chim. Acta 2020, 1103, 212–219. [Google Scholar] [CrossRef]
  28. Zhang, X.T.; Wu, P.P.; Hao, X.L.; Liu, J.M.; Huang, Z.J.; Weng, S.H.; Chen, W.F.; Huang, L.L.; Huang, J.Y. Quaternization carbon dots with enhanced antimicrobial ability to Gram-negative bacteria for the treatment of acute peritonitis caused by E. coli. J. Mater. Chem. B 2023, 11, 7696–7706. [Google Scholar] [CrossRef]
  29. Hao, X.L.; Huang, L.L.; Zhao, C.F.; Chen, S.N.; Lin, W.J.; Lin, Y.N.; Zhang, L.R.; Sun, A.A.; Miao, C.F.; Lin, X.H.; et al. Antibacterial activity of positively charged carbon quantum dots without detectable resistance for wound healing with mixed bacteria infection. Mat. Sci. Eng. C-Mater. 2021, 123, 111971. [Google Scholar] [CrossRef]
  30. Zhao, C.F.; Wang, X.W.; Wu, L.N.; Wu, W.; Zheng, Y.J.; Lin, L.Q.; Weng, S.H.; Lin, X.H. Nitrogen-doped carbon quantum dots as an antimicrobial agent against Staphylococcus for the treatment of infected wounds. Colloids Surf. B Biointerfaces 2019, 179, 17–27. [Google Scholar] [CrossRef]
  31. Zhang, X.T.; Bai, X.X.; Deng, X.Q.; Peng, K.; Zheng, Z.F.; Xiao, J.C.; Zhang, R.; Huang, Z.J.; Huang, J.Y.; Chen, M.; et al. Long-term antibacterial activity of guanidinium carbon dots without detectable resistance for the effective treatment of pneumonia caused by Gram-negative bacteria. Carbon 2023, 213, 118229. [Google Scholar] [CrossRef]
  32. Zu, F.L.; Yan, F.Y.; Bai, Z.J.; Xu, J.X.; Wang, Y.Y.; Huang, Y.C.; Zhou, X.W. The quenching of the fluorescence of carbon dots: A review on mechanisms and applications. Microchim. Acta 2017, 184, 1899–1914. [Google Scholar] [CrossRef]
  33. Jian, Z.W.; Wang, H.; Liu, M.L.; Chen, S.Y.; Wang, Z.H.; Qian, W.; Luo, G.X.; Xia, H.S. Polyurethane-modified graphene oxide composite bilayer wound dressing with long-lasting antibacterial effect. Mater. Sci. Eng. C-Mater. 2020, 111, 110833. [Google Scholar] [CrossRef]
  34. Ye, S.J.; Wei, D.F.; Xu, X.; Guan, Y.; Zheng, A. Surface antimicrobial modification of polyamide by poly(hexamethylene guanidine) hydrochloride. Polym. Advan. Technol. 2020, 31, 1847–1856. [Google Scholar] [CrossRef]
  35. Zhu, Y.W.; Xu, C.; Zhang, N.; Ding, X.K.; Yu, B.R.; Xu, F.J. Polycationic Synergistic Antibacterial Agents with Multiple Functional Components for Efficient Anti-Infective Therapy. Adv. Funct. Mater. 2018, 28, 1706709. [Google Scholar] [CrossRef]
  36. Wang, Y.J.; Wang, L.; Wang, H.Y. Investigation on the Relationship Between Carbon Cores and Fluorescence Moieties by Measurement of Fluorescence Anisotropy of CDs with Different Sizes. Chem. Res. Chin. Univ. 2020, 36, 894–900. [Google Scholar] [CrossRef]
  37. Wu, J.; Zawistowski, A.; Ehrmann, M.; Yi, T.; Schmuck, C. Peptide Functionalized Polydiacetylene Liposomes Act as Fluorescent Turn-On Sensor for Bacterial Lipopolysaccharide. J. Am. Chem. Soc. 2011, 133, 9720–9723. [Google Scholar] [CrossRef]
  38. Gopal, J.; Abdelhamid, H.N.; Hua, P.Y.; Wu, H.F. Chitosan Nanomagnets for Effective Extraction and Sensitive Mass Spectrometric Detection of Pathogenic Bacterial Endotoxin from Human Urine. J. Mater. Chem. B 2013, 1, 2463–2475. [Google Scholar] [CrossRef]
  39. Paul, I.E.; Raichur, A.M.; Chandrasekaran, N.; Mukherjee, A. Fluorometric Sensing of Endotoxin Based on Aggregation of CTAB Capped Gold Nanospheres. J. Lumin. 2016, 178, 106–114. [Google Scholar] [CrossRef]
  40. Thakur, M.; Dan, A. Poly-L-lysine-Functionalized Green-Light-Emitting Carbon Dots as a Fluorescence Turn-on Sensor for Ultrasensitive Detection of Endotoxin. ACS Appl. Bio Mater. 2021, 4, 3410–3422. [Google Scholar] [CrossRef]
Scheme 1. The formation of GQ-CDs/FAM-DNA and the detection of LPS through the substitution effect.
Chemosensors 12 00201 sch001
Figure 1. The characterization of GQ-CDs. The emission spectra with different excitation wavelengths (A); UV–vis absorbance spectrum, with the maximum excitation and emission spectra and appearance under white and UV light (inset) (B); TEM, HRTEM, and size distribution (C); and the FTIR spectrum (D).
Chemosensors 12 00201 g001
Figure 2. The XPS characterization of the GQ-CDs. The wide-spectrum (A), C1s (B), N1s (C), and O1s (D) spectra.
Chemosensors 12 00201 g002
Figure 3. The interaction between GQ-CDs and FAM-DNA. The changed emission spectra of FAM-DNA with different contents of GQ-CDs (A), the variable QEs (B), the effect of time on the emission spectra of FAM-DNA (C), and QEs (D). n = 3.
Chemosensors 12 00201 g003
Figure 4. The emission spectra of FAM-DNA and GQ-CDs/FAM-DNA with and without LPS (A), the emission spectra of GQ-CDs with and without LPS (B), the zeta potential of GQ-CDs (C), the fluorescence anisotropy of FAM-DNA and GQ-CDs/FAM-DNA with and without LPS (D). n = 3.
Chemosensors 12 00201 g004
Figure 5. The detection of LPS. The emission spectra of FAM-DNA in GQ-CDs/FAM-DNA with different contents of LPS (A), the fitting equation of desorption rates and LPS (B), the specificity of this method to variable interferents (C). n = 3.
Chemosensors 12 00201 g005
Disclaimer/Publisher’s Note: The statements, opinions and data contained in all publications are solely those of the individual author(s) and contributor(s) and not of MDPI and/or the editor(s). MDPI and/or the editor(s) disclaim responsibility for any injury to people or property resulting from any ideas, methods, instructions or products referred to in the content.

