Article

Application of a Novel Disposable Flow Cell for Spectroscopic Bioprocess Monitoring

1
Institute of Technical Chemistry, Leibniz University, 30167 Hanover, Germany
2
LyteGate GmbH, 61169 Friedberg, Germany
*
Author to whom correspondence should be addressed.
Chemosensors 2024, 12(10), 202; https://doi.org/10.3390/chemosensors12100202
Submission received: 9 August 2024 / Revised: 27 September 2024 / Accepted: 29 September 2024 / Published: 1 October 2024

Abstract

:
The evaluation of the analytical capabilities of a novel disposable flow cell for spectroscopic bioprocess monitoring is presented. The flow cell is presterilized and can be connected to any kind of bioreactor by weldable tube connections. It is clamped into a reusable holder, which is equipped with SMA-terminated optical fibers or an integrated light source and detection unit. This modular construction enables spectroscopic techniques like UV-Vis spectroscopy or turbidity measurements by scattered light for modern disposable bioreactors. A NIR scattering module was used for biomass monitoring in different cultivations. A high-cell-density fed-batch cultivation with Komagataella phaffii and a continuous perfusion cultivation with a CHO DG44 cell line were conducted. A high correlation between the sensor signal and biomass or viable cell count was observed. Furthermore, the sensor shows high sensitivity during low turbidity states, as well as a high dynamic range to monitor high turbidity values without saturation effects. In addition to upstream processing, the sensor system was used to monitor the purification process of a monoclonal antibody. The absorption module enables simple and cost-efficient monitoring of downstream processing and quality control measurements. Recorded absorption spectra can be used for antibody aggregate detection, due to an increase in overall optical density.

1. Introduction

Pharmaceuticals must meet the high regulatory and quality requirements of the worldwide approval agencies, for example, the U.S. Food and Drug Administration (FDA) or the European Medicines Agency (EMA). The PAT initiative, launched in 2004, introduced a framework to better analyze, understand and control pharmaceutical manufacturing processes. The goal is to ensure final product quality by defining, measuring and controlling critical process parameters (CPP) that have an influence on the critical quality attributes (CQA) of the product [1]. Continuous monitoring of the production process is, therefore, essential if regulatory action is to be taken if necessary. Non-invasive optical measurement methods allow these process parameters to be recorded easily and without time delay. This reduces batch-to-batch variability, shortens batch release times and prevents the dismissal of whole batches [2,3,4,5].
Optical detection systems for bioprocesses are commonly made for stainless steel reactors. Several sensors with different wavelength ranges, for example, ultraviolet–visible (UV-Vis), near infrared (NIR), mid-infrared (MIR), fluorescence and Raman spectroscopy, are available for research and industrial applications [2,6]. These systems are generally sterilizable in place by steam together with the reactor, using standardized ports and interfaces [4,5,7,8]. However, currently, only a few optical detection systems are available for disposable bioreactors because the interfaces are lacking [9,10]. Disposable bioreactors are presterilized by gamma radiation, therefore no probe can be installed afterward without breaking the sterile barrier. Instead, they feature a small variety of preassembled measurement systems, which lack in quantity and quality compared to the reusable systems.
As this means that only limited inline sensor technology can be used on disposable bioreactors, other and new sensor concepts must be developed to reach the goal of PAT with a holistic bioprocess monitoring and control process [11]. As an alternative to inline sensor technology, at-line or online sensor technology can be used. As the majority of sensors cannot yet be directly integrated into disposable bioreactors, bypasses can be used to overcome those challenges [2,10,12]. In such a bypass, any sensor technology can be used with suitable measuring chambers and connected to disposable bioreactor systems by sterile tube connections. This enables online spectroscopic measurements to monitor bioprocesses in a variety of modern disposable bioreactors [10,13].
Bypasses are not widely used in industrial biotechnology because they pose a risk of contamination. However, until new sensor concepts for disposable bioreactors are developed, integrated and approved in the respective vessels or bags, only the possibility of measurement in a bypass remains [10,14]. One advantage of measurement in the bypass is the transferability and scalability, especially during process development. Since the measuring system can easily be connected to different reactor types and scales, the measurements are comparable and transferable [8,15].
The disposable and presterilized flow cell (BioFlowCell), as described by Raithel [16] and Thiel [17], has been shown to be suitable for measurements of bioprocesses. The design concept and modular layout of the measuring system enable a reproducible measurement of turbidity and UV-Vis absorption [16]. The biocompatibility of the flow cell as well as the requested selectivity and sensitivity for important bioprocess variables is given [17]. Based on this, the current study uses various examples to demonstrate the analytical capabilities of the sensor system for various upstream and downstream applications. Two different flow cell concepts were tested: a scattering module for single-wavelength multi-angle NIR spectroscopy and an absorption module for UV-Vis spectroscopy [16].
NIR scattering is established for offline reference measurements, commonly known as optical density (OD) measurements. Online turbidity measurement is known for only one angle (transmission, or more commonly, reflection) [18]. However, the newly designed scattering module allows online biomass monitoring in a wide range of biomass concentrations due to its multi-angle detection method. In this context, a continuous perfusion cultivation with Chinese hamster ovary (CHO) cells [19] and a fed-batch cultivation with Komagataella phaffii [20] were conducted. Both cultivation concepts set different requirements for the sensor performance regarding long-term measurement stability and dynamic range.
The absorption module is used to observe purification of a monoclonal antibody using fast-protein–liquid-chromatography (FPLC). The absorption at 280 nm is established to monitor the chromatographic process of loading, washing and elution. Moreover, the ability to detect product quality loss by protein aggregates is shown [21].
The presented application shows the capability of the novel disposable flow cell for online monitoring of up- and downstream bioprocesses. Based on this, spectroscopic monitoring process optimization or control can be implemented in the sense of PAT.

2. Materials and Methods

2.1. Biomass Monitoring Using NIR Scattering Flow Cell

For online turbidity measurements, the NIR scattering flow cell is connected to the bioreactor via a sterile tube connection (bypass). The BioFlowCell is equipped with sealed weldable tubings (C-Flex®, Saint-Gobain, Charny, France) during the production process and is packed vacuum sealed before final gamma-sterilization. The reactor itself is equipped with weldable tubing of the same dimensions (inner diameter: 1/8″). The connections to assemble the bypass are established during the process setup using the BioWelder® TC (Sartorius Stedim Biotech GmbH, Göttingen, Deutschland). The fluid is pumped through the flow cell from the bottom up to allow air bubbles to pass the device. A constant flow rate is set using the MINISTAR Miniature DC Peristaltic Pump (World Precision Instruments GmbH, Friedberg, Germany). The system uses a vertical-cavity surface-emitting laser (VCSEL) module at 850 nm to measure transmission (0°) and scattered light at multiple angles (20°, 90°, 200°). Transmission is used to detect biomass in low concentrations and backscattering for high biomass. The backscattering is realized with light at 200° and for the biomass concentration light at 90° is used. The additional 20° light is similar to the transmitted light. Opacity was calculated by taking the reciprocal of the transmission value.

2.2. Fed-Batch Cultivation with Komagataella phaffii

Cultivation of Komagataella phaffii strain GS115 (his4) was chosen as an application because very-high cell densities occur and the range of the developed sensor can, therefore, be demonstrated. This cultivation was performed using a stainless steel bioreactor (Biostat® Cplus, Sartorius Stedim Biotech GmbH, Göttingen, Germany) with a maximum working volume of 30 L. Cells were previously transformed with pPic9K-GelMP expression vector to produce a gelatin mimetic protein (GelMP). The pre-culture was grown in shake flasks until an optical density (OD600) of 10–15 was reached. The culture was used to inoculate the main culture to an OD600 = 0.1 with a total volume of 10 L. The cells were cultivated at 30 °C, pH 5, dissolved oxygen (DO) level of 30% air saturation and a gas flow rate of 10 L·min−1. After depletion of a carbon source (glycerol), methanol feed was set to 0.2% v/v methanol to induce GelMP production. Further information, including media and reactor preparation, are described by Gellermann et al. [20].
The measuring interval was set to 10 s, to generate as much data as possible. A time of 10 s was defined as the smallest interval in order to guarantee secure data recording and storage with the selected computer. During the measurement, a constant flow rate of 5 mL·min−1 was present in the bypass, achieved using a peristaltic pump. Depending on the length of the bypass and the tube diameter, both oxygen limitation and sedimentation could be avoided without cell damage.

2.3. Perfusion Cultivation with CHO Cells

In order to demonstrate the long-term stability of the BioFLowCell, continuous cultivation was selected. In addition, the use of a disposable bioreactor with mammalian cell cultivation demonstrates the relevance of the development to modern high-value-added cultivations.
For perfusion cultivation, CHO DG44 cells (Sartorius Stedim Cellca GmbH, Göttingen, Germany) were cultivated using the Ambr® 250 Modular system (Sartorius Stedim Biotech, Göttingen, Germany). The cell line produces an Immunoglobulin G1 (IgG1) monoclonal antibody. Chemically defined media for seed culture (SMD) and production media for the main culture (PM) were used from the Sartorius Stedim Cellca Platform.
The inoculum was prepared in 5 passages and incubated in 7.5% CO2/air mixture, 85% relative humidity at 36.8 °C on a shaking platform (120 rpm) using 500 mL Erlenmeyer shake flasks containing 150 mL SMD. The main culture was inoculated from the seed train to obtain an initial viable cell concentration of 1 million cells min−1 in the bioreactor, with an actual working volume of 0.24 L.
Cultivation was performed at an agitation of 855 rpm and a temperature of 36.8 °C with setpoints for pH at 7.1 and dissolved oxygen at 60%, respectively. Antifoam C Emulsion 2% (Sigma-Aldrich, Inc., Saint-Louis, MO, USA) was added every 12 h to prevent foaming. The process started with a 3-day batch phase, continued with a perfusion phase and lasted 16 days in total. Further Information on reactor preparation, media, culture conditions and cell retention were described by Schellenberg et al. [19].
Analysis of viable cell count (VCC) and viability according to the total cell count (TCC) was performed using the Cedex HiRes® Analyzer (Roche Diagnostics GmbH, Mannheim, Germany). A bypass was implemented to install the NIR-scattering flow cell. The measuring interval was set to 10 s. During the measurement, a constant flow rate of 5 mL·min−1 was maintained in the bypass, achieved using a peristaltic pump.

2.4. UV-Vis Measurements Using Absorption Flow Cell

The downstream process, which is highly relevant for product quality, was also monitored with the developed BioFLowCell to demonstrate the possibilities for automation and quality control. To observe the purification process of a monoclonal antibody, the flow cell was connected to an ÄKTA pure chromatography system (GE Healthcare, Uppsala, Sweden) via PEEK tubing (i.d. 0.5 mm) and flangeless fittings (1/4″—28 UNF). A flow cell with a path length of 1.2 mm was placed into a reusable flow cell holder. To measure the absorption spectra, a spectrometer (TIDAS S520 1994 DH, J & M Analytik AG, Essingen, Germany) was connected via SMA-terminated optical fibers to the flow cell holder. Dark-corrected intensity spectra were recorded, processed and exported as spc-files with TIDASDAQ3 Software (J & M Analytik AG, Essingen, Germany). Integration time (It) was adjusted to guarantee an optimal detector saturation of 80%. Measuring frequency was set to 250 ms. Reference measurements were conducted with the internal single wavelength UV monitor (U9-L, Cytiva Europe GmbH, Freiburg, Germany) in a flow-through cuvette of 2 mm path length.

2.5. Protein A Capture Step

The monoclonal antibody was produced in CHO DG44 cells and secreted into the media. Cells and cell debris were removed from the supernatant by centrifugating the cell culture media. Afterward, a two-step depth filtration was performed using Sartoclear® DL90 and Sar-toclear® DL20 (Sartorius Stedim Biotech, Göttingen, Germany).
The clarified material was purified using a HiTrapTM Protein A column (volume 1 mL, GE Healthcare, Chicago, IL, USA) implemented in an ÄKTA pure chromatography system (GE Healthcare, Uppsala, Sweden) [22].

2.6. EC-HPLC

Antibody aggregate and fragment concentrations were analyzed using a commercial HPLC system (Chromaster, VWR International, Radnor, PA, USA) operated with the column Yarra™ 3 µm SEC-3000 (Phenomenex, Torrance, CA, USA). Samples were diluted to a concentration of about 0.5 g·L−1, filtered (0.2 µm) and cooled in an autosampler (10 °C). The system was set to a flow rate of 1 mL· min−1 using a combination of 100 mM odium phosphate buffer and 100 mM sodium sulfate at pH 6.6 as the mobile phase.

2.7. Antibody Aggregation by Freeze–Thawing

Antibody stock solution was diluted with SEC-buffer to a concentration of 1 g·L−1. A total of 5 different 1 mL samples were frozen in a cooling bath (dry ice, 99.9% ethanol for 1 min, then thawed at 30 °C and 300 rpm for 4 min. The process was repeated for different numbers of cycles, varying from 10 to 50. Different numbers of cycles were tested to determine optimal parameters for aggregate formation.

2.8. Spectral Data Post-Processing and Analysis

First, equilibration and washing steps were cut and negative data points were removed. The reference spectrum was then calculated by averaging the first ten spectra. For each measurement time point, the absorption was calculated and smoothed using a median filter (sampling window f = 41). Chromatograms can be plotted over time for various wavelength (measuring range: 185 nm–941 nm).
For comparison of specific absorption spectra, the time point of maximal absorption was determined automatically. A Savitzky–Golay filter was then applied to the data before plotting (filter width w = 11, order o = 2).

3. Results and Discussion

The developed flow cell has been tested for various applications. The tests range from the use of the scattered light flow cell upstream with high and low cell numbers to the downstream UV-Vis absorption measurement of a monoclonal antibody. It is shown that the cell can be used throughout the entire process chain of a bioprocess and which advantages and new insights can be gained by online spectroscopic monitoring.

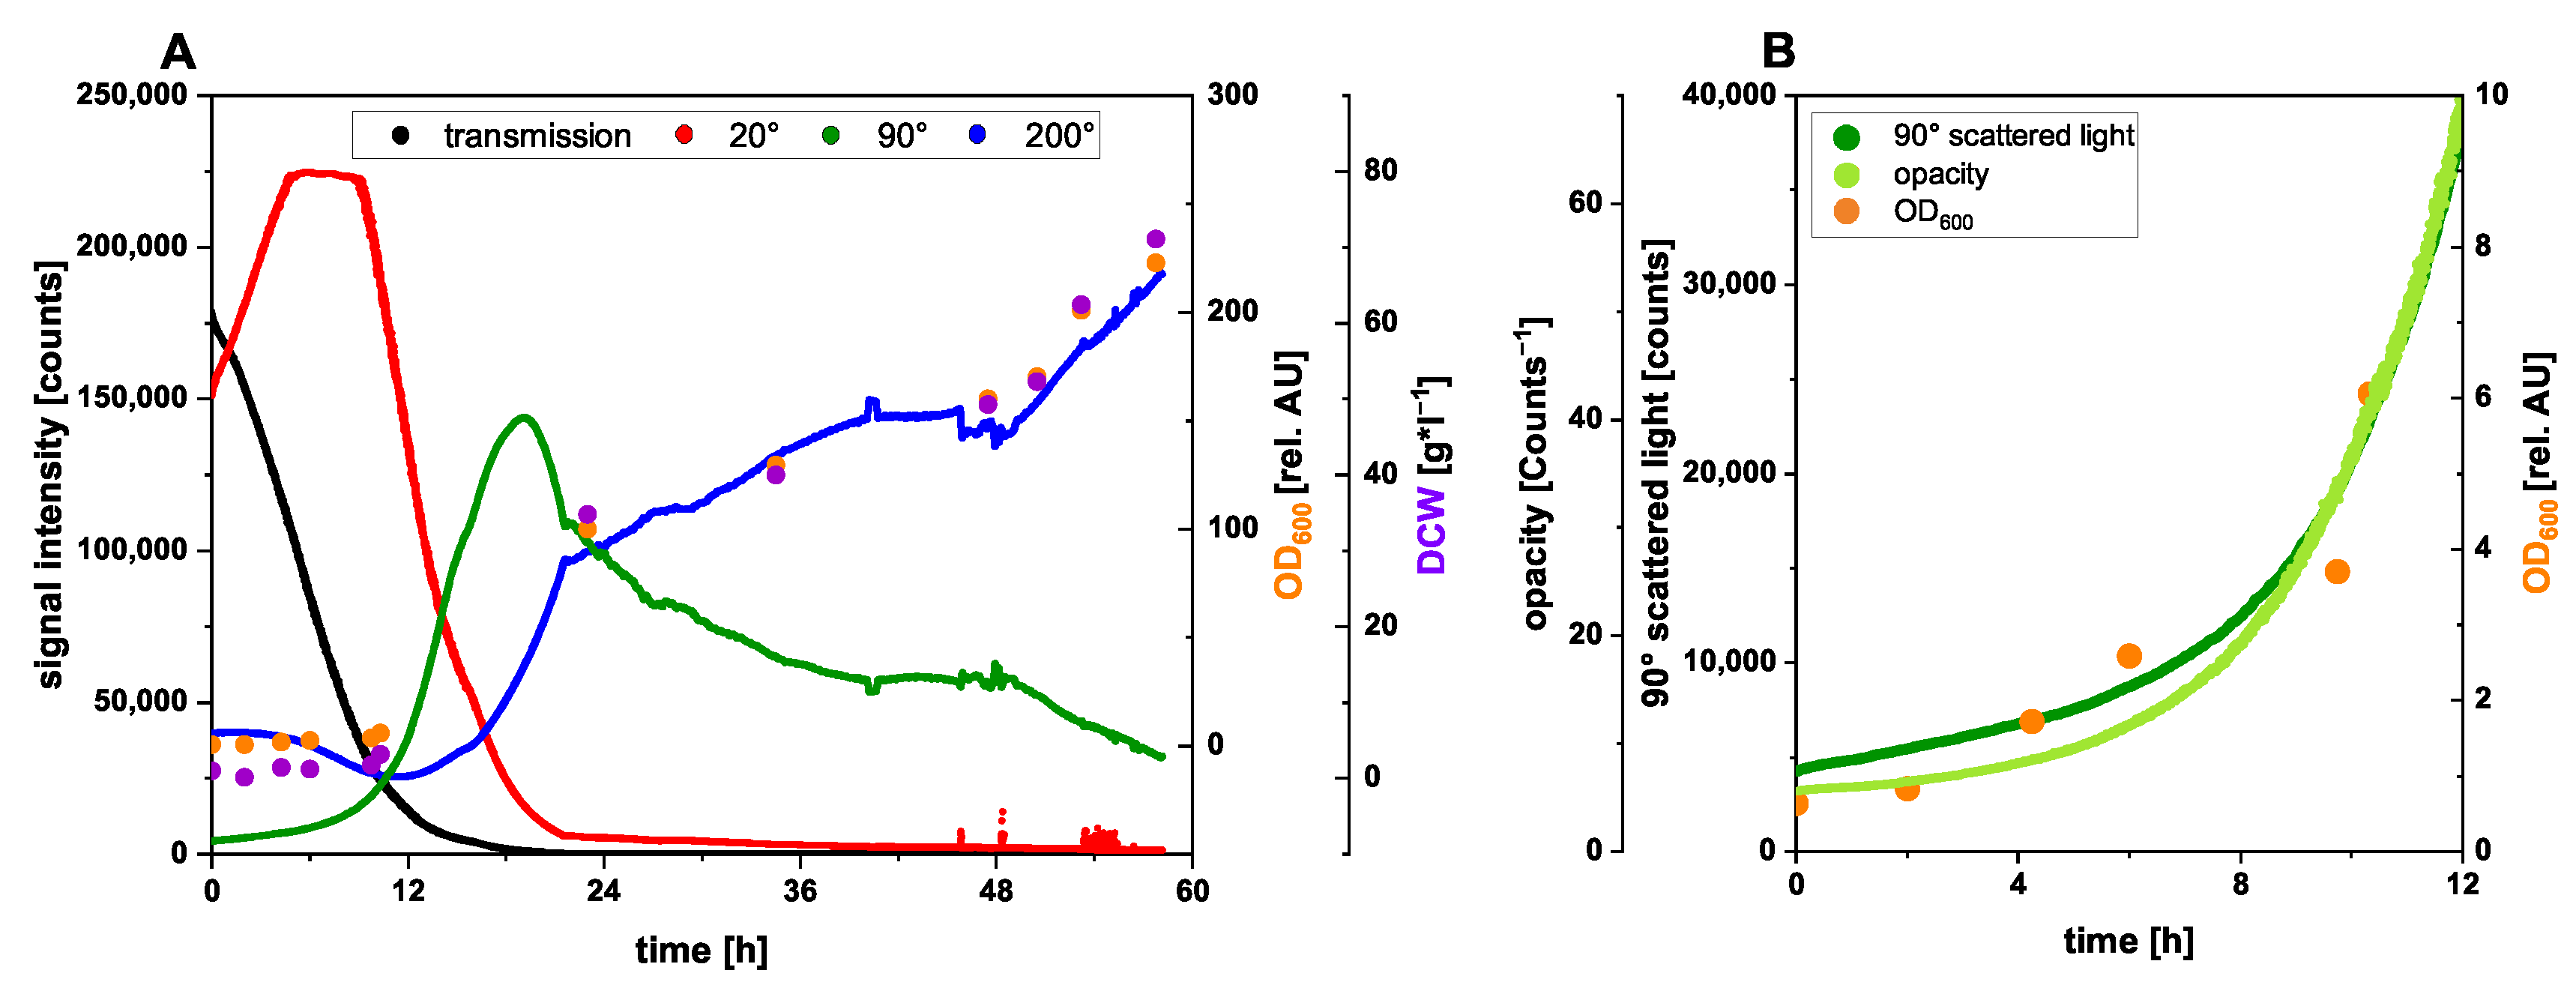
3.1. NIR Scattering for Biomass Monitoring

With the help of the measuring cell, which detects the scattered light at different angles, biomass growth can be observed from low cell numbers to high cell densities. Monitoring biomass using NIR scattered light is an established method [23], but here, it is used simultaneously at different angles to increase the detection range and provide additional information about the cells.

3.1.1. Biomass Monitoring during Komagataella phaffii High-Cell-Density Fed-Batch Cultivation

Data from all four measuring channels for NIR scattering and offline data for optical density and dry cell weight are shown in Figure 1A. Depending on the angle of detection, the intensity of the scattered light is very different throughout the cultivation. In the beginning (low cell density), most of the light is transmitted through the media with low backscattering, resulting in high signals in the transmission channel (0°) and low-angle scattering channel (20°). Whereas the stray light channels with high angle of detection (90°, 200°) deliver low signal intensity, due to the low number of particles in the media.
Increasing cell growth leads to changes in signal intensity, which are highly dependent on the angle of detection. Transmission is highly sensitive during the low turbidity that exists across the first 12 h (Figure 1A) and the reciprocal of the transmission, the opacity, shows a high correlation to the optical density up to an OD of 10 (Figure 1B). The intensity of 90° stray light describes the offline data as well as the opacity (Figure 1B). Additionally, the 90°-scattered light seems to be more sensitive up to an OD of 100, but this range is unfortunately not supported with offline measurements. Higher angles of detection are less sensitive in monitoring low cell densities. This observation agrees with the theory of Mie scattering. For increasing cell densities, the signals of the 20° and 90° detectors reach a maximum.
Although they have poor sensitivity during the low-turbidity phase, higher detection angles have major advantages for high-turbidity measurements. Backscattering is particularly suitable for high-cell-density cultivations. The signal shows a linear response to optical density and dry cell weight throughout almost the whole process time (with the exception of the first 12 h).
The sensor delivers useful data for monitoring cell growth during the initial phase of the cultivation and shows high dynamic range up to optical densities of more than 200. Therefore, the developed sensor system is easily usable to monitor the cell growth of yeast cultivations.

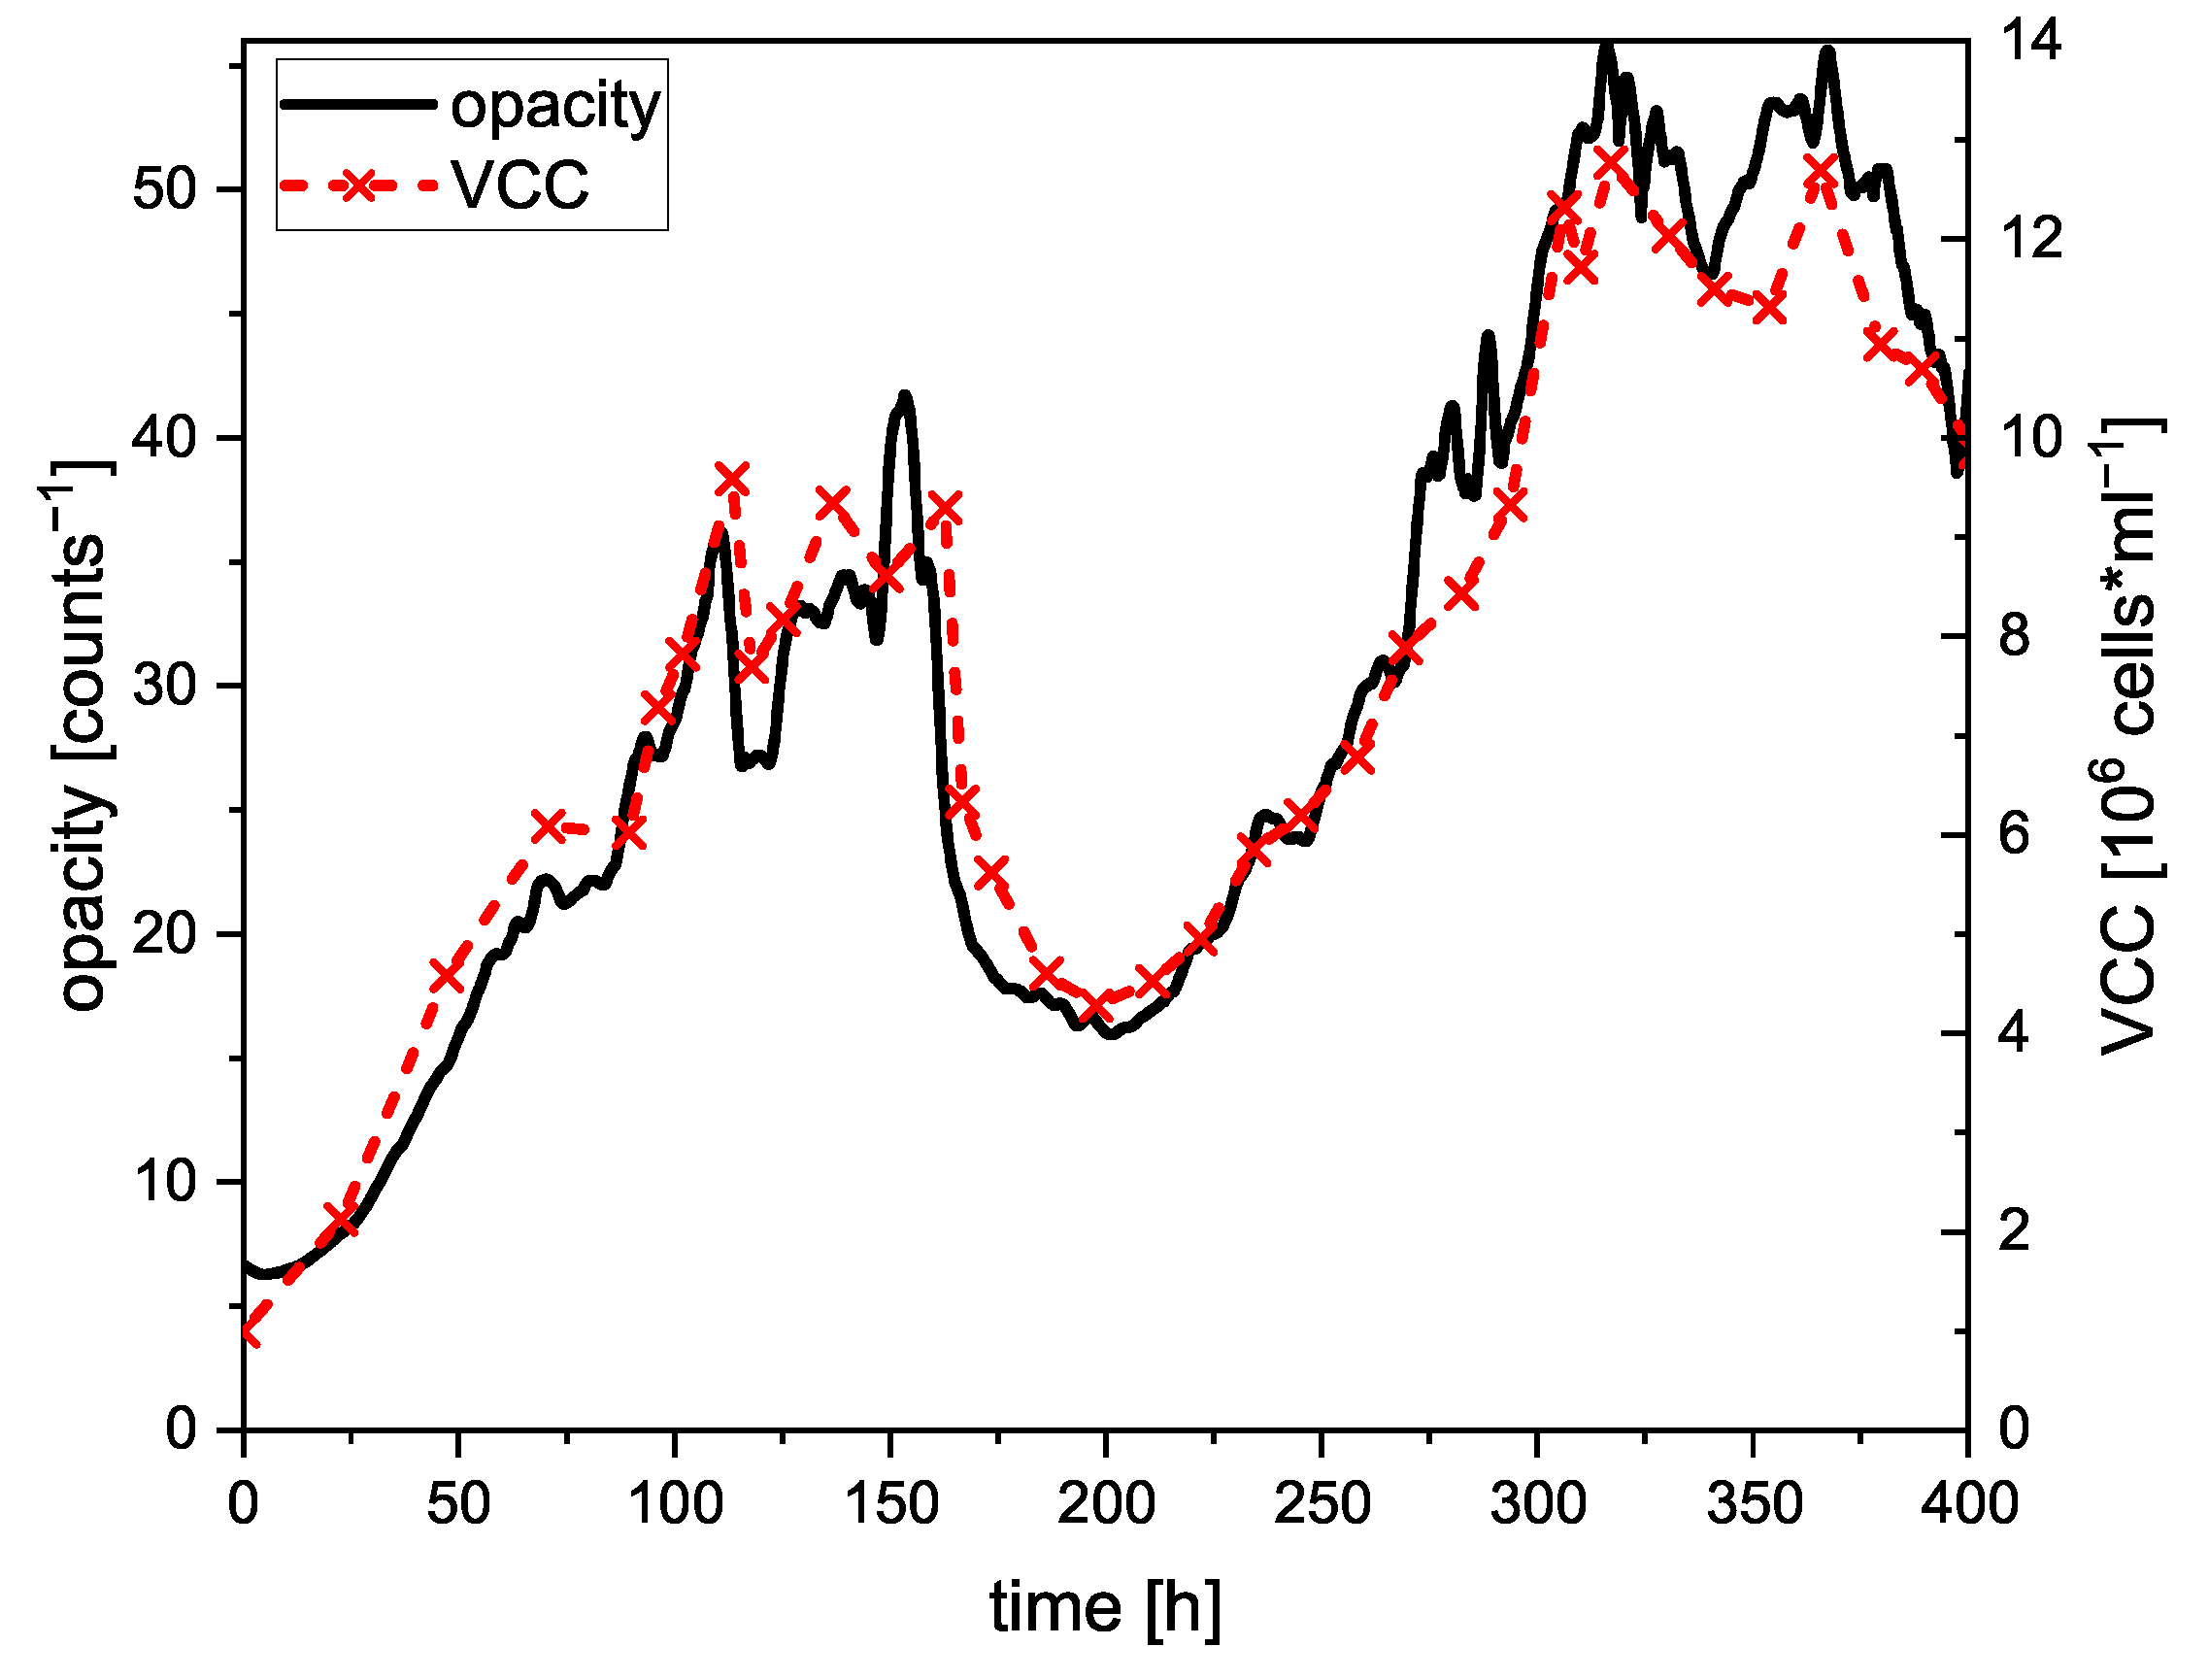
3.1.2. Long-Term Turbidity Measurement during CHO Perfusion Cultivation

Despite a high dynamic range, long-term stability can be a critical challenge for online measurements. Cultivations of mammalian cell cultures can last several days to weeks. To observe the long-term stability of the sensor, a CHO DG44 cell line was continuously cultivated in Ambr® 250 Modular, using a cell retention device [19]. In addition to central control parameters like pH, pO2 and air flow, offline measurements for cell concentration and viability are typically conducted. For small bioreactors, offline sampling can only be carried out rarely, to prevent volume loss. Online sensors provide short measurement intervals without volume reduction and time delay.
The presterilized, disposable flow cell for NIR scattering for online turbidity measurements was installed in a bypass of a CHO perfusion process. To evaluate the applicability of the sensor as an online tool for cell density determination, the viable cell count (VCC) and viability were measured offline. Figure 2 shows the opacity, the reciprocal of the transmission, and offline measurements for viable cell count (VCC).
The initial batch phase lasted until approximately 75 h; then, the feed and cell retention were activated. At the end of the batch phase, the VCC shows a small plateau and before then, the cell count increases until a first stationary phase (100–150 h). VCC was successfully adjusted in a range between 8 and 10 × 106 cells mL−1. At 150 h after inoculation, a malfunction of the cell retention system occurred and consequently, the cell concentration decreased to 4 × 10⁶ cells mL−1. After replacing the device, the VCC increased up to 12 × 106 cells mL−1 and held at a second stationary state until over 400 h of process time.
The opacity, measured using the NIR scattering flow cell, correlates with the VCC very well. The transmission signal was selected because of its good sensitivity during low- to mid-range turbidity states. Opacity was calculated to obtain a proportional signal response to the cell count. The sensor enables the quick and accurate monitoring of an increase and decrease in VCC without any volume loss. Furthermore, stationary phases can be identified as well. There are some outliers, which show significant deviation from offline data (e.g., at 250 h). These are mostly due to debris or cluster of cells accumulating in the measuring chamber. Therefore, a flushing routine is sensible to avoid artefacts in the data. Short-time outliers were smoothed by applying a median filter to the data.
The long-term stability of the measurement was confirmed, as there was no increase in noise or deviation from the reference measurements during the process observed. Overall, the sensor is qualified to replace or at least complement offline measurements of VCC. Time- and labor-intensive sampling becomes evitable. This increases the yield, as there is no need to remove samples from the system. In that regard, the risk of contamination is reduced as well since the system remains closed. Another advantage is the gapless monitoring, which enables faster interventions when necessary. Furthermore, automated feed and bleed rate control is feasible.

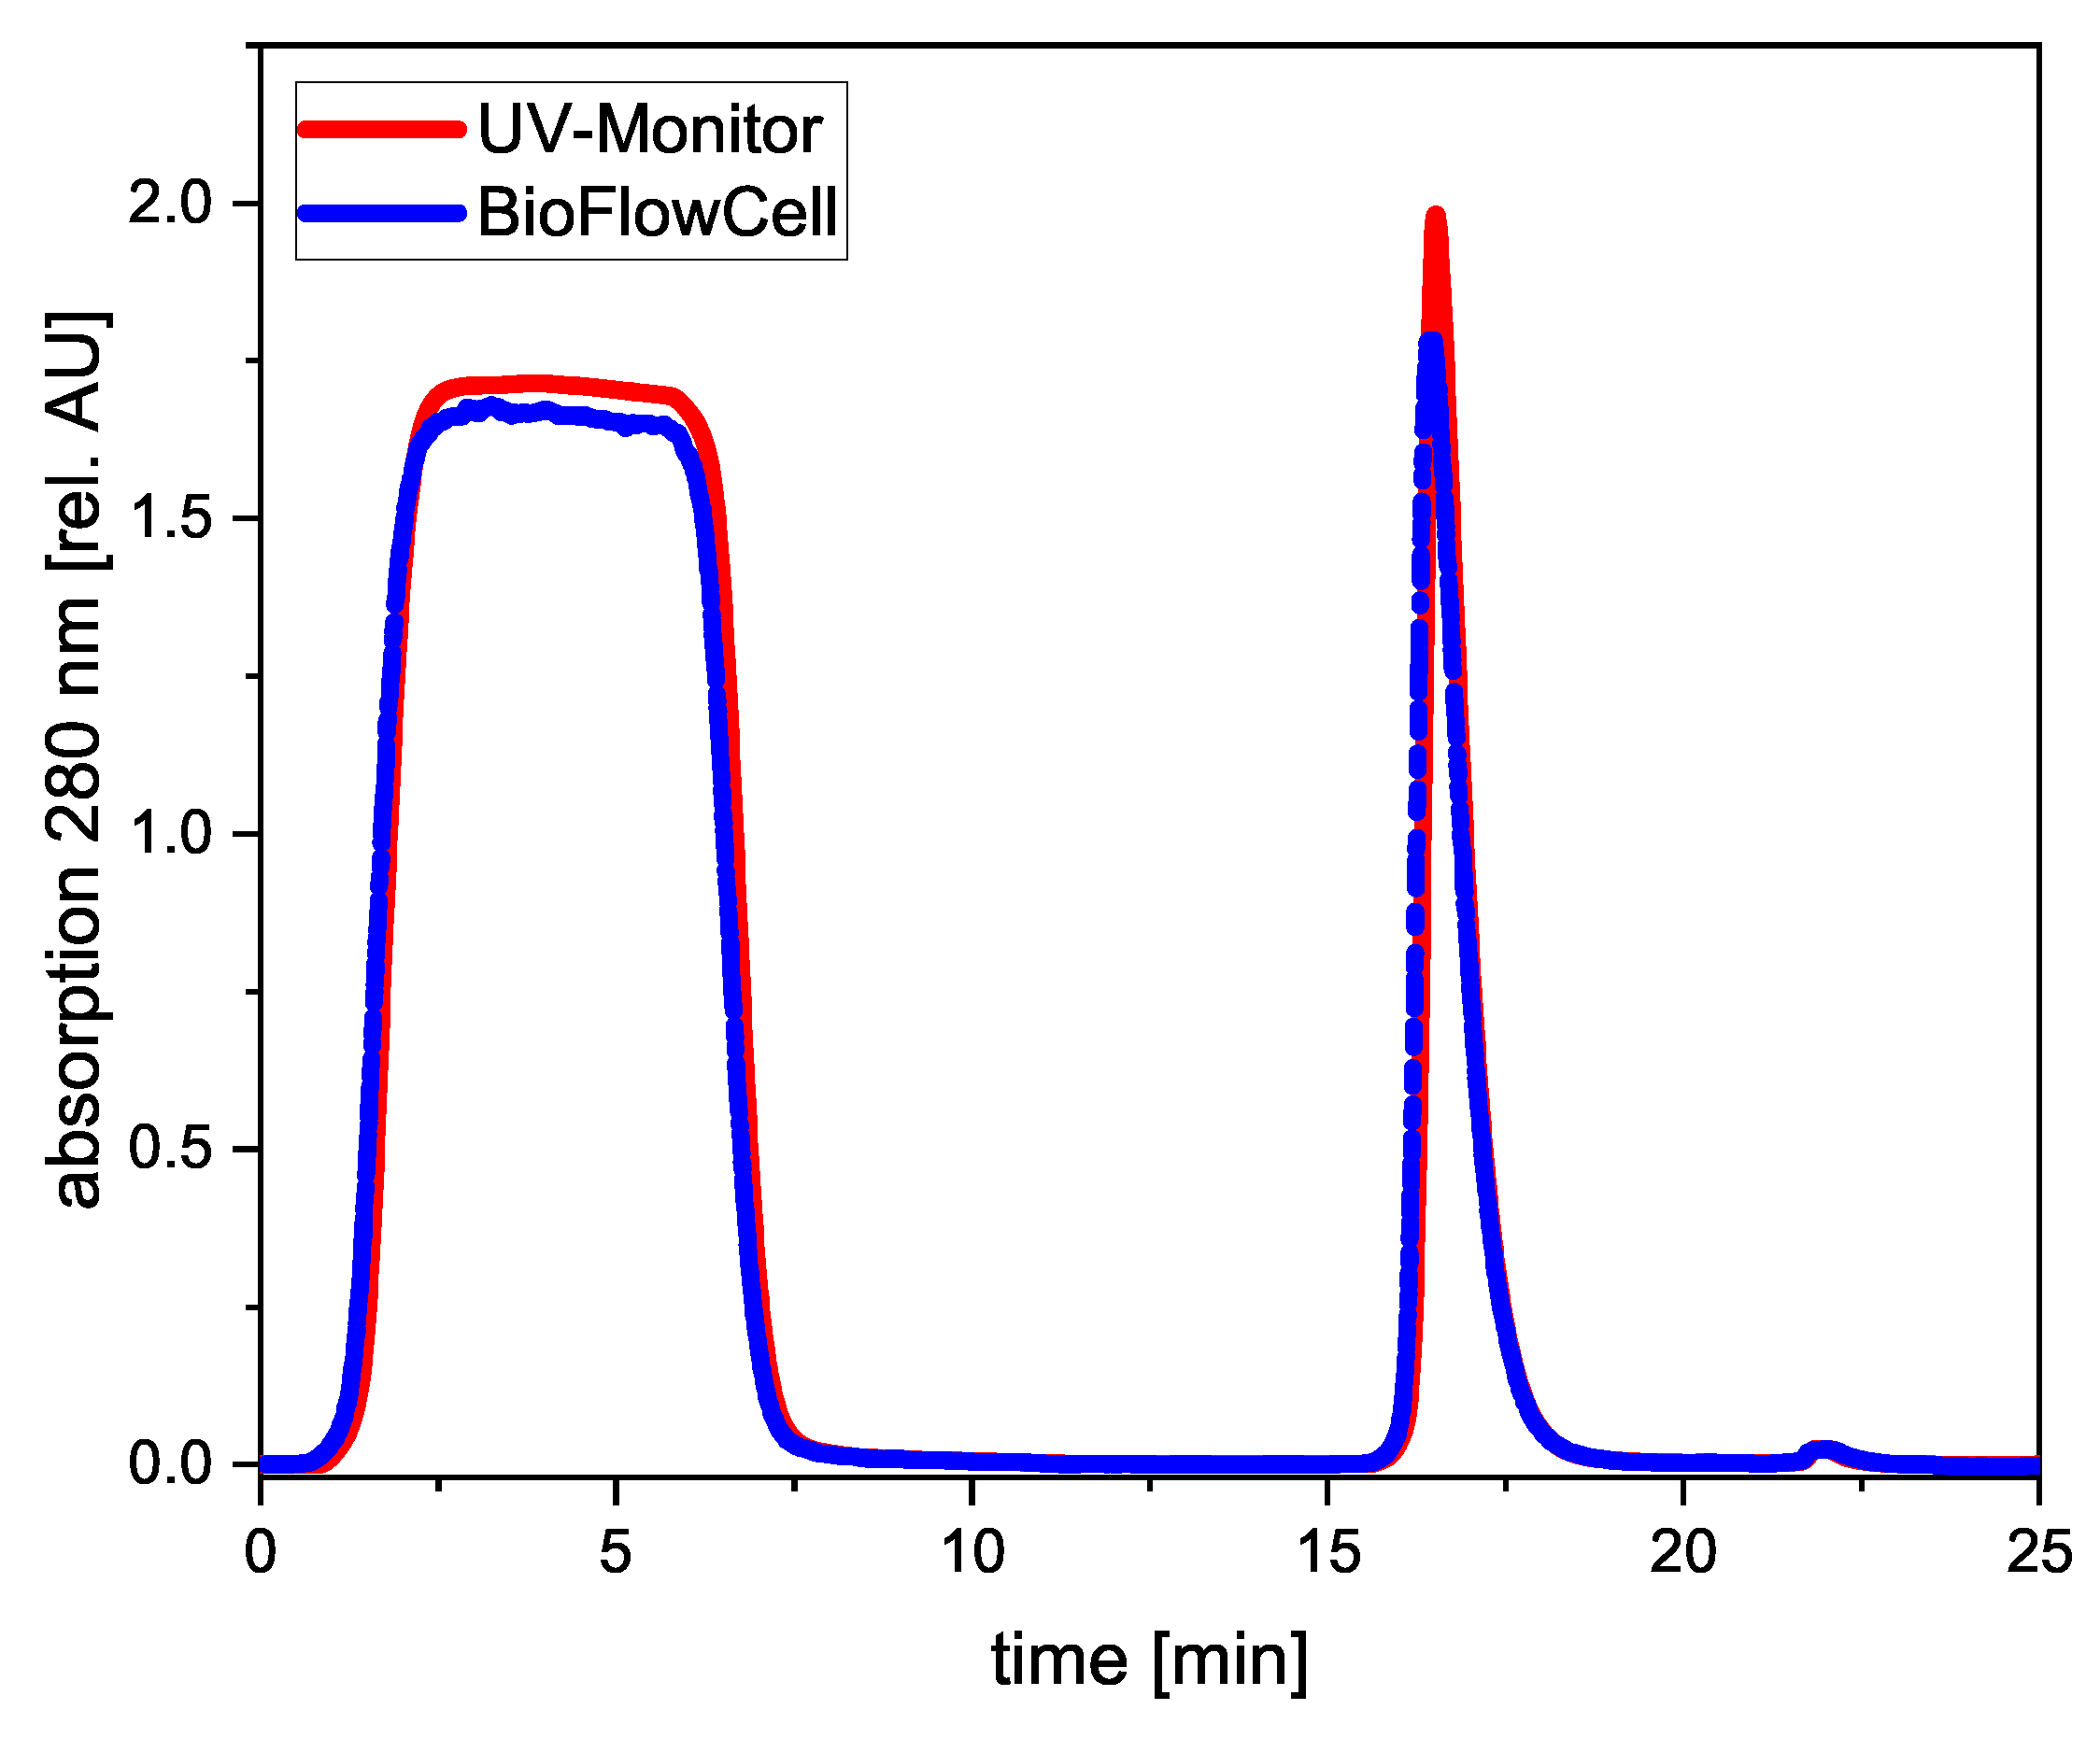
3.2. UV-Vis Spectroscopy during Purification of a Monoclonal Antibody

Biotechnological products undergo extensive treatments to remove unwanted components like proteins, nucleic acids, or media compounds. To ensure the high purity and quality standards of the final product, continuous documentation of the downstream process is necessary. Thus, methods for preparative and analytical analyses like UV-absorption or SEC-HPLC are typically conducted. Online monitoring during downstream processing is necessary for process automation and higher product yields. Here, the new disposable flow cell is used to monitor chromatographic purification steps in order to determine the optimum cutting limits in the process and to monitor product quality.

3.2.1. Protein A Capture Step

For a first proof of concept, a commercially available UV detector for monitoring FPLC runs of a Protein A column is compared to the novel disposable flow cell absorption module. The flow cell was installed between the column and the fraction collector to record comparable data to the preinstalled UV detector. The absorption at 280 nm was recorded with both detectors and compared over time (Figure 3). Unbound components pass the column and can be seen between minutes 1 and 7 (loading peak). During a washing step, the absorption drops back to the baseline level. Elution of the monoclonal antibody can be seen at 16.5 min, followed by a cleaning step at 22 min.
The two sensors recorded very similar signal curves. The duration and shape of the peaks are almost congruent. There is a small offset in peak height, which may be a consequence of the different path lengths of the flow cells. Due to resolution limit of the 3D Printer, deviations in path length are possible. Hence, the calculated correction factor may contain errors.
Therefore, the developed flow cell can be used to monitor chromatopgraphy processes with equivalent performance, while being smaller, more versatile and easier to use.

3.2.2. Detection of Antibody Aggregates

In addition to process-related contaminants (host cell proteins, nucleic acids), there are also product-related quality losses like fragments or aggregates. Here, aggregation was induced intentionally by freeze–thawing to evaluate the capability of the sensor to detect the presence of aggregates. The analysis was based on the measured absorption spectra of a specific sample and compared to a chromatogram of an SEC-HPLC run, which is the standard method to detect aggregates.
The SEC-HPLC column efficiently separated the aggregate and the monomer peak (Figure 4). A distinct monomer peak can be observed after 8.5 min of retention. The aggregates leave the column beforehand at 7.5 min. The percentage of the aggregate peak to the total peak area was 2.17% (Table 1). Comparing the chromatograms of the different freeze–thawed samples, a shift from the mAb peak to the aggregate peak can be observed (Figure 4). An increasing number of cycles leads to a greater amount of aggregates. For 50 cycles of freeze–thawing, the peak area percentage of aggregates more than doubled up to 5.51%.
These results show that aggregates of the antibody could be successfully produced.
Aggregates cannot be detected by a single-wavelength detector, which is usually installed in FPLC systems during protein purification. According to Hawe et al. [24], UV-Vis spectroscopy can be used to detect aggregated antibodies as well, due to an increase in overall optical density. The novel sensor system is capable of recording whole UV-Vis absorption spectra during FPLC runs instead of the absorption of only one wavelength.
The recorded UV-Vis spectra of the aggregated samples are plotted in Figure 5A. All samples show the expected protein absorption peak at 280 nm. The control sample shows almost no absorption for higher wavelengths. Freeze–thawing leads to significant shifts in absorption, especially at 250 nm, and for wavelengths above 320 nm, whereas absorption at 280 nm remains nearly unchanged. The increased absorption level for higher wavelengths can be emphasized by logarithmic scaling (Figure 5B).
The aggregation index (AI), described by Hawe et al. [24], is calculated from the absorption values at 280 nm and 350 nm (Table 2). The samples that had been subject to repeated freeze–thaw cycles show a higher aggregation index than the control sample.
Overall, UV-Vis spectroscopy data and SEC-HPLC data correlate well in assessing the presence of aggregated antibodies. The increased optical density above 320 nm is attributed to light scattering by aggregated particles, as aggregate-free protein solutions do not absorb any light in this region [25]. Thus, UV absorbance measurements can be used as a quick tool to evaluate the quality of a protein sample. This method offers several advantages like low sample volume, easy instrument setup and very short analysis time. Samples can also be reused, which enables integration in existing FPLC systems.

4. Concluding Remarks

This research clearly presents the potential of the novel flow cell as a PAT tool for various biopharmaceutical applications. The flow cell itself is disposable and comes with a reusable holder. The holder can be used to integrate optics and a detection unit. Third-party devices can be connected via SMA-terminated optical fibers. This enables great versatility for different applications. We introduced two different modules, which can be employed to monitor up- and downstream processes. The two modules both use the disposable flow cell in different designs and can easily be connected to any kind of bioreactor.
The NIR scattering module delivers reliable data for biomass monitoring. The results demonstrate that the device can be used for different cell types and cultivation strategies. It has been tested with large-scale stainless steel reactors and small-scale disposable bioreactors. Due to its robust and compact design, special applications like monitoring of shake flask cultivations in incubators is also feasible. In addition to its versatility, the scattering module stands out for its high dynamic range. The multi-channel design with detection of stray light at different angles, covers a broad range of turbidities. This enables sensitive measurements during low turbidity states and prevents saturation effects for high turbidities without diluting the sample.
In addition, a generic step in the purification process of a monoclonal antibody was successfully monitored. The sensor system delivers a chromatogram that is nearly congruent to the one created by the preinstalled UV monitor. No significant deviations like fronting, tailing, or saturation effects were detected. Thus, the developed flow cell is qualified to acct as an alternative to established single-wavelength detectors. As further analyses, the BioFlowCell allows recording of full absorption spectra, a simple method to detect antibody aggregates was presented, which may also be possible during FPLC runs in the future.
Due to its modularity and different flow cell designs, the system can be applied along the whole supply chain of biopharmaceutical products. In summary, the BioFlowCell combines the versatility and accuracy of common sensor systems with the advantages of single-use technology and opens up the disposable world for spectroscopy.

Author Contributions

Conceptualization, project administration and funding acquisition, M.B., T.S. and D.S.; methodology, T.S. and P.R.; investigation, writing and visualization, T.S.; resources and data curation, J.S., C.K. and P.G.; writing—review and editing and supervision, D.S. All authors have read and agreed to the published version of the manuscript.

Funding

This research was funded by BMWI ZIM grant number 16KN062927.

Institutional Review Board Statement

Not applicable.

Informed Consent Statement

Not applicable.

Data Availability Statement

The data presented in this study are available on request from the corresponding author.

Conflicts of Interest

Author Philipp Raithel and Mathias Belz were employed by the company LyteGate GmbH. The remaining authors declare that the research was conducted in the absence of any commercial or financial relationships that could be construed as a potential conflict of interest.

References

  1. FDA. Guidance for Industry Guidance for Industry PAT—A Framework for Innovative Pharmaceutical; FDA: Silver Spring, MD, USA, 2004; p. 19.
  2. Gerzon, G.; Sheng, Y.; Kirkitadze, M. Process Analytical Technologies—Advances in bioprocess integration and future perspectives. J. Pharm. Biomed. Anal. 2022, 207, 114379. [Google Scholar] [CrossRef] [PubMed]
  3. Kessler, D.P. (Ed.) Prozessanalytik: Strategien und Fallbeispiele aus der Industriellen Praxis; Wiley-VCH Verlag: Weinheim, Germany, 2006. [Google Scholar]
  4. Gillespie, C.; Wasalathanthri, D.P.; Ritz, D.B.; Zhou, G.; Davis, K.A.; Wucherpfennig, T.; Hazelwood, N. Systematic assessment of process analytical technologies for biologics. Biotechnol. Bioeng. 2022, 119, 423–434. [Google Scholar] [CrossRef] [PubMed]
  5. Wasalathanthri, D.P.; Patel, B.A. The Role of Process Analytical Technology (PAT) in Biologics Development. In Continuous Pharmaceutical Processing and Process Analytical Technology; CRC Press: Boca Raton, FL, USA, 2023; pp. 339–354. [Google Scholar]
  6. Brunner, V.; Siegl, M.; Geier, D.; Becker, T. Challenges in the Development of Soft Sensors for Bioprocesses: A Critical Review. Front. Bioeng. Biotechnol. 2021, 9, 722202. [Google Scholar] [CrossRef] [PubMed]
  7. Aslam, M.; Rani, A.; Khan, J.; Pant, B.N.; Pandey, G. Applications of Biotechnology in Pharmaceutical Product Analysis. In Concepts in Pharmaceutical Biotechnology and Drug Development; Interdisciplinary Biotechnological Advances; Bose, S., Shukla, A.C., Baig, M.R., Banerjee, S., Eds.; Springer: Singapore, 2024. [Google Scholar]
  8. Rodríguez-Duran, L.V.; Torres-Mancera, M.T.; Trujillo-Roldán, M.A.; Valdez-Cruz, N.A.; Favela-Torres, E.; Saucedo-Castañeda, G. Standard instruments for bioprocess analysis and control. In Current Developments in Biotechnology and Bioengineering; Elsevier: Amsterdam, The Netherlands, 2017; pp. 593–626. [Google Scholar]
  9. Mitra, S.; Murthy, G.S. Bioreactor control systems in the biopharmaceutical industry: A critical perspective. Syst. Microbiol. Biomanuf. 2022, 2, 91–112. [Google Scholar] [CrossRef] [PubMed]
  10. Steinwedel, T.; Dahlmann, K.; Solle, D.; Scheper, T.; Reardon, K.F.; Lammers, F. Sensors for Disposable Bioreactor Systems. In Single-Use Technology in Biopharmaceutical Manufacture; Wiley Online Library: Hoboken, NJ, USA, 2019; pp. 69–82. [Google Scholar]
  11. Lopes, A.G. Single-use in the biopharmaceutical industry: A review of current technology impact, challenges and limitations. Food Bioprod. Process. 2015, 93, 98–114. [Google Scholar] [CrossRef]
  12. Reardon, K.F. Practical monitoring technologies for cells and substrates in biomanufacturing. Curr. Opin. Biotechnol. 2021, 71, 225–230. [Google Scholar] [CrossRef] [PubMed]
  13. Lourenço, N.D.; Lopes, J.A.; Almeida, C.F.; Sarraguça, M.C.; Pinheiro, H.M. Bioreactor monitoring with spectroscopy and chemometrics: A review. Anal. Bioanal. Chem. 2012, 404, 1211–1237. [Google Scholar] [CrossRef] [PubMed]
  14. Furey, J.; Clark, K.; Card, C. Adoption of single-use sensors for bioprocess operations. BioProcess Int. 2011, 9, 36–42. [Google Scholar]
  15. Bareither, R.; Pollard, D. A review of advanced small-scale parallel bioreactor technology for accelerated process development: Current state and future need. Biotechnol. Prog. 2011, 27, 2–14. [Google Scholar] [CrossRef]
  16. Raithel, P.; Steinwedel, T.; Belz, M.; Solle, D. Disposable flowcell for spectroscopic analysis in bioprocesses. In Proceedings of the Optical Fibers and Sensors for Medical Diagnostics, Treatment and Environmental Applications XXI, Online, 6–12 March 2021; Volume 11635, pp. 157–164. [Google Scholar]
  17. Thiel, P.; Steinwedel, T.; Raithel, P.; Belz, M.; Solle, D. Development of a novel disposable flowcell for spectroscopic bioprocess monitoring. Chemosensors 2024. [Google Scholar]
  18. Benavides, M.; Mailier, J.; Hantson, A.L.; Muñoz, G.; Vargas, A.; Van Impe, J.; Vande Wouwer, A. Design and test of a low-cost RGB sensor for online measurement of microalgae concentration within a photo-bioreactor. Sensors 2015, 15, 4766–4780. [Google Scholar] [CrossRef] [PubMed]
  19. Schellenberg, J.; Dehne, M.; Lange, F.; Scheper, T.; Solle, D.; Bahnemann, J. Establishment of a Perfusion Process with Antibody-Producing CHO Cells Using a 3D-Printed Microfluidic Spiral Separator with Web-Based Flow Control. Bioengineering 2023, 10, 656. [Google Scholar] [CrossRef] [PubMed]
  20. Gellermann, P.; Schneider-Barthold, C.; Bolten, S.N.; Overfelt, E.; Scheper, T.; Pepelanova, I. Production of a Recombinant Non-Hydroxylated Gelatin Mimetic in Pichia pastoris for Biomedical Applications. J. Funct. Biomater. 2019, 10, 39. [Google Scholar] [CrossRef] [PubMed]
  21. Kortmann, C.; Habib, T.; Heuer, C.; Solle, D.; Bahnemann, J. A Novel 3D-Printed and Miniaturized Periodic Counter Current Chromatography System for Continuous Purification of Monoclonal Antibodies. Micromachines 2024, 15, 382. [Google Scholar] [CrossRef] [PubMed]
  22. Brämer, C.; Tünnermann, L.; Gonzalez Salcedo, A.; Reif, O.W.; Solle, D.; Scheper, T.; Beutel, S. Membrane Adsorber for the Fast Purification of a Monoclonal Antibody Using Protein A Chromatography. Membranes 2019, 9, 159. [Google Scholar] [CrossRef] [PubMed]
  23. Wolfrum, E.J.; Payne, C.; Schwartz, A.; Jacobs, J.; Kressin, R.W. A performance comparison of low-cost near-infrared (NIR) spectrometers to a conventional laboratory spectrometer for rapid biomass compositional analysis. BioEnergy Res. 2020, 13, 1121–1129. [Google Scholar] [CrossRef]
  24. Hawe, A.; Friess, W.; Sutter, M.; Jiskoot, W. Online fluorescent dye detection method for the characterization of immunoglobulin G aggregation by size exclusion chromatography and asymmetrical flow field flow fractionation. Anal. Biochem. 2008, 378, 115–122. [Google Scholar] [CrossRef] [PubMed]
  25. Burastero, O.; Draper-Barr, G.; Raynal, B.; Chevreuil, M.; Engl, P.; Garcia Alai, M. Raynals, an online tool for the analysis of dynamic light scattering. Acta Crystallogr. Sect. D Struct. Biol. 2023, 79, 673–683. [Google Scholar] [CrossRef] [PubMed]
Figure 1. Monitoring of a fed-batch cultivation with Komagataella phaffii [20]. (A) Scattering in various angles with offline measurements of optical density (OD) and cell dry weight (DCW). (B) the opacity is compared to the 90°-scattered light for optical densities (OD) up to 10.
Chemosensors 12 00202 g001
Figure 2. Opacity and viable cell density of a continuous perfusion cultivation of CHO DG44 cells [19]. The non-continuous course of the cell density is due to the process control [19], the online monitoring with the developed sensor shows changes quickly and reliably.
Chemosensors 12 00202 g002
Figure 3. Monitoring of an FPLC run of Protein A capture, comparison of different UV detectors.
Chemosensors 12 00202 g003
Figure 4. SEC-HPLC results to detect different rates of antibody aggregates by freeze–thaw cycles (FT) during downstream processing. (A) Complete HPLC chromatogram; (B) Focus on aggregate peak at 7.5 min.
Chemosensors 12 00202 g004
Figure 5. Absorption spectra for different aggregate rates by freeze–thaw cycles (FT). (A) FPLC chromatogram in normal scale; (B) FPLC chromatogram in logarithmic scale.
Chemosensors 12 00202 g005
Table 1. SEC-HPLC analysis of aggregate solution.
Aggregate peak
SampleRetention [min]Area [mAU2]Area [%]Height [mAU]Height [%]
Control7.4530,6302.177862.14
10 ×7.4931,0152.547662.37
50 ×7.5361,2895.5114224.77
mAb peak
SampleRetention [min]Area [mAU2]Area [%]Height [mAU]Height [%]
Control8.561,379,05697.833599997.86
10 ×8.581,191,01497.463157297.63
50 ×8.5931,051,36394.492841595.23
Table 2. Aggregation index.
Sample280 nm [AU]350 nm [AU]AI
Control0.2860.0010.211
10 × FT0.2840.0207.587
15 × FT0.3040.0248.661
30 × FT0.3130.05220.064
40 × FT0.3050.04718.344
50 × FT0.2980.05020.314
Disclaimer/Publisher’s Note: The statements, opinions and data contained in all publications are solely those of the individual author(s) and contributor(s) and not of MDPI and/or the editor(s). MDPI and/or the editor(s) disclaim responsibility for any injury to people or property resulting from any ideas, methods, instructions or products referred to in the content.

