Article

SERS-Driven Ceftriaxone Detection in Blood Plasma: A Protein Precipitation Approach

1
Leibniz Institute of Photonic Technology, Member of Leibniz Health Technologies, Member of the Leibniz Centre for Photonics in Infection Research (LPI), Albert-Einstein-Straße 9, 07745 Jena, Germany
2
Institute of Physical Chemistry (IPC) and Abbe Center of Photonics (ACP), Friedrich Schiller University Jena, Member of the Leibniz Centre for Photonics in Infection Research (LPI), Helmholtzweg 4, 07743 Jena, Germany
3
Silmeco ApS, Kenny Drews Vej 101, 2450 Copenhagen, Denmark
*
Author to whom correspondence should be addressed.
Chemosensors 2024, 12(10), 213; https://doi.org/10.3390/chemosensors12100213
Submission received: 5 July 2024 / Revised: 16 September 2024 / Accepted: 2 October 2024 / Published: 16 October 2024
(This article belongs to the Special Issue Surface-Enhanced Raman Spectroscopy for Bioanalytics)

Abstract

:
Accurate detection of antibiotics in biological samples is essential for clinical diagnoses and therapeutic drug monitoring. This research examines how proteins and other substances in blood plasma affect the detection of the antibiotic ceftriaxone using surface-enhanced Raman spectroscopy (SERS). We detected ceftriaxone spiked in blood plasma without sample preparation within the range of 1 mg/mL to 50 µg/mL. By employing a pretreatment approach involving methanol-based protein precipitation to eliminate interfering substances from a spiked blood plasma solution, we could detect ceftriaxone down to 20 µg/mL. The comparative analysis demonstrates that the protein precipitation step enhances the sensitivity of SERS-based detection of drugs in the matrix blood plasma. The insights derived from this study are highly beneficial and can prove advantageous in developing new antibiotic detection methods that are both sensitive and selective in complex biological matrices. These methods can have important implications for clinical treatments.

Graphical Abstract

1. Introduction

Understanding the relationship between drug dosage, its concentration in biological fluids, and its therapeutic effects is crucial in contemporary medicine. Therapeutic Drug Monitoring (TDM) is a valuable tool in determining the most effective treatment plan for patients individually by analyzing the pharmacokinetic parameters of the medication utilized [1,2]. TDM involves systematically monitoring drug concentrations in biofluids like blood plasma, serum, and urine, and ensuring precise adherence to prescribed dosages to achieve optimal therapeutic outcomes [3,4].
The vital analytical techniques utilized by TDM are advanced and comprise liquid chromatography–mass spectrometry (LC–MS) and other separation methods combined with mass spectroscopy [5]. Furthermore, studies have shown that various immunoassay platforms have proven effective for TDM [6]. While these techniques offer valuable information on measuring drug concentrations in biological samples, they also have advantages and disadvantages. Mass spectroscopy-based methods are highly regarded in clinical settings for their multiplexing capabilities and robustness. However, major disadvantages include labor-intensive, time-consuming, expensive, requiring bulky equipment, and requiring extensive sample preparation [7]. Immunoassays are generally preferred due to their inherent simplicity, ease of use, efficiency, and cost-effectiveness, thereby making them suitable for on-site analysis. At present, not all monitored drugs can be detected through immunoassays, as it necessitates the creation of a unique immune reagent for each analyte. In addition, other substances present in biological samples, like drugs with similar structures or natural compounds, can interfere with the accuracy of analytical signals [8,9].
In recent years, there has been a substantial increase in surface-enhanced Raman scattering (SERS) to advance diagnostic applications [10,11]. Nanostructures made up of mainly silver or gold with exceptional optical properties are utilized as SERS substrates to enhance the Raman active modes of the analyte. This highly sensitive and selective technique enables the detection and quantification of even trace amounts of drugs in complex biological matrices, thus being attractive in TDM. SERS has demonstrated remarkable adaptability in detecting an extensive array of analytes, ranging from minute organic biomolecules, pharmaceutical compounds, and proteins to intricate biological entities such as cells, tissues, and microorganisms [12,13,14,15]. Various drugs have been identified in biological matrices such as saliva, urine, and serum. However, body fluids are very complex mixtures of thousands of molecules in varying concentrations; moreover, some of their components, such as metabolites, proteins, and nucleotides, can interfere with the targeted drug to bind the SERS active sites of the metallic surface. This type of competitive adsorption termed the fouling effect, blocks the target analyte from reaching the SERS active regions, therefore, creating substantial background noise and reducing the detection sensitivity [16]. Several approaches are already used in the literature to reduce the significant background noise and diminish possible matrix contribution. These approaches include analyte separation via extraction or chromatography, magnetic bead separation [17] and chemometric signal processing of SERS signal (e.g., principle component analysis) [18]. The functionalized magnetic nanoparticles used in magnetic bead-based separation can selectively bind the target analytes through either affinity interactions or electrostatic binding. Then, this analyte is separated from the complex matrix through the application of an external magnetic field. These techniques are highly specific and independent of sample complexity. It is also fast and more compatible with automation, thus suitable for high-throughput applications [19,20]. However, some of its major drawbacks include the involvement of more complex steps, higher costs, and the co-isolation of excess magnetic nanoparticles, which can interfere with the quantification of the analyte molecule [17].
Blood-derived biofluids, including blood plasma and serum, are particularly interesting in SERS for TDM as they serve as valuable indicators, allowing personalized drug effects to be monitored through changes in drug concentration in these body fluids [21,22,23]. However, these fluids contain high levels of proteins that tend to form corona at metal surfaces, leading to surface fouling. These proteins also bind a significant fraction of the target drug, thereby hampering its direct interaction with the metal surface [24]. Some sample pre-processing steps, such as deproteinization or protein precipitation, are often employed prior to SERS measurement to avoid the problems of protein-based fouling and interference [18,21].
Protein precipitation is a two-step process where initially, an organic compound is added to the matrix, which changes the solvation of proteins in water, thus causing them to precipitate, and later on, these protein precipitates are separated from the target analyte via centrifugation [25]. Organic solvents such as methanol and acetonitrile are often used to extract and concentrate the desired analyte by removing proteins through various protein-precipitation techniques. Acetonitrile and methanol were used to study the precipitation of plasma proteins and found that methanol to plasma in a 1:1 ratio worked best [26]; methanol was also used in several studies for the protein precipitation step [27,28]. Some studies used acetonitrile alone or acidified with HCl to precipitate the plasma proteins [25,29,30]. In a particular study, butanol is used in an acidic environment to remove the proteins from a spiked serum sample [31]. Adding an acid further aids in protein denaturation and precipitation. Selection of an optimal organic solvent is crucial for protein removal, and the choice of organic compounds and precipitation method depends upon the specific requirements of the study, such as analysis technique (LC–MS, immunoassay, SERS), nature of the matrix, and desired analyte enrichment.
Ceftriaxone belongs to the time-dependent antibiotic family, cephalosporin, and is used in clinical practices to treat various bacterial infections. Its long half-life and broad application spectrum make it an essential therapeutic agent [32,33]. Like most antibiotics, ceftriaxone also has side effects, such as effects on some chronic and systemic diseases; therefore, accurate monitoring of ceftriaxone in biological matrices is of utmost importance to optimize dosage and prevent antibiotic resistance [34]. The emergence of antibiotic resistance is one of the crucial aspects of monitoring the concentration of dosage in patients to prevent the development of resistant strains. In the context of ceftriaxone, detection in biological matrices using SERS studies has been majorly carried out by Markina et al. [18,35,36]. The methods presented are based on the direct detection strategy of SERS and are compatible with the requirements of the TDM. The most promising result for ceftriaxone detection was obtained in urine as a biological matrix by a pretreatment step of sample purification using silica gel chromatography with Cu nanoparticles as SERS substrates [18]. However, detecting ceftriaxone in blood-derived biofluids such as plasma and serum is more challenging due to the presence of numerous interfering components such as proteins, lipids, and metabolites. It is important to note that the protein binding of ceftriaxone is relatively very high (95%), ref. [9] and in principle, only a free drug can interact with SERS active sites of the substrate. Therefore, new strategies are required to overcome the effect of these interfering species for the sensitive detection of ceftriaxone in blood plasma.
Partial least squares discriminant analysis (PLS-DA) is a robust multivariate chemometric technique that can be integrated with spectroscopic data to effectively differentiate a vast array of samples, where variables such as wavenumber are highly correlated. This method reduces dimensionality by projecting the data onto a smaller number of latent variables while maximizing covariance between the projected data and classification groups. Furthermore, the uncertainty estimation of this method provides insights into the reliability of the results. However, it is important to note that while PLS-DA is powerful in classifying, it may be prone to overfitting, particularly with smaller datasets [37,38]. To prevent such an overfitting or overestimation scenario an adapted cross validation strategy should be applied [39].
This study explores the impact of proteins on the SERS-based detection of the antibiotic ceftriaxone in blood plasma. We employed a methanol-assisted protein precipitation technique to enhance sensitivity and selectivity. By removing or reducing proteins from spiked plasma samples, we reduced background interference and improved signal quality, allowing for detection at lower concentrations of the target analyte. Additionally, a machine learning model was developed for the relevant concentration range, allowing the possibility of developing a standard protocol for detecting low-concentration ceftriaxone in precipitated blood plasma. This work enhances our understanding of protein-mediated interference in SERS-based antibiotic detection and suggests that selective protein removal through precipitation methods can lead to more reliable detection in complex biological environments. These findings have broader applications in clinical diagnostics and TDM. It is worth noting that the chemical state of the drug and its Raman spectrum may change after interaction with the body. This study aims to address the detection of ceftriaxone in its original form as a first step toward SERS-based drug monitoring. While this method may not capture all aspects of drug metabolism, it provides a foundation for further studies where advanced techniques can be integrated for more precise pharmacokinetic analysis.

2. Materials and Methods

Materials: Commercially available SERS substrates, consisting of silver-capped silicon nanopillars in the size of 2 × 2 mm2, were purchased from Silmeco ApS (Copenhagen, Denmark). Fresh blood plasma was purchased from a healthy volunteer from Universitätsklinikum Jena, which was then divided into 10–15 mL aliquots and frozen at −18 °C for storage. Afterward, the aliquots were thawed and brought to room temperature for further use. Ceftriaxone disodium salt hemiheptahydrate (>98.0%, C18H16N8Na2O7S3) was purchased from TCI chemicals. Methanol (99.8%) was purchased from Sigma-Aldrich (Darmstadt, Germany). All reagent solutions were prepared with ultra-high purity deionized water (18 MΩ).
Instrumentation: Raman and SERS measurements were recorded using a WITec alpha300 R confocal Raman microscope (Ulm, Germany) with a 785 nm laser. The Raman scattered light was collected through a 10× objective lens. The laser light incident on the sample was 1 mW. The Raman and SERS spectra were recorded using a 300 groove/mm grating and an integration time of 2 s with one accumulation. We used disposable plastic cuvettes to record the Raman spectra in an aqueous environment (saturated solution of ceftriaxone).
Precipitation of blood plasma: Methanol is used as the protein precipitating agent to eliminate blood plasma proteins. A ceftriaxone stock solution of 2 mg/mL is spiked into blood plasma at various concentrations ranging from 0 to 1 mg/mL and incubated for 30 min. Following this 500 μL of the spiked blood plasma is added to 1.5 mL of methanol (MeOH), maintaining a 3:1 ratio. The resulting mixture is vortexed for 30 s, incubated for 1 h, and then centrifuged at 8500 rpm for 10 min. The supernatant is termed as precipitated blood plasma in this report and is utilized for the SERS analyses.
SERS Investigation and Data Acquisition: All the SERS measurements were performed on commercially available silver SERS substrates (Silmeco ApS, Copenhagen, Denmark). The SERS substrates were incubated in the spiked blood plasma or spiked precipitated blood plasma for 1 h. After this incubation, the substrates were dried with Argon gas and used for the SERS measurements. For Figure 1, Raman spectra of ceftriaxone powder and in saturated aqueous media are the sum of 5 single spectra. For the SERS measurement of ceftriaxone in blood plasma, ten mean value spectra were measured at different points of the substrates, and each of these ten mean value spectra is an average of one area scan consisting of 200 spectra for each concentration. For Figure 2a (ceftriaxone in blood plasma) and Figure 4a (ceftriaxone in precipitated blood plasma), all the spectra were measured for three sample batches, which makes 30 mean value spectra per concentration for 30 different area scans (in summary, 600 single spectra per concentration). For Figures 2b and 4b, all the spectra were measured for one sample batch, which makes 10 mean value spectra per concentration for 10 different area scans (in summary, 200 single spectra per concentration) For supplementary Figure S1 (ceftriaxone in aqueous media), only one batch was measured, which makes ten mean value spectra per concentration for ten different area scans (in summary, 200 single spectra).
Spectra Visualization: Origin 2021b was utilized for plotting all the spectra, which involved averaging and error band calculation.
Data Analysis: The dataset for machine learning-based modelling comprised 1100 raw spectra of blood plasma and 1100 raw spectra for precipitated blood plasma. In each case, the training dataset consisted of ten points per concentration in three replicates for 0, 10, 100, 200, 600, and 1000 μg/mL. The test data consisted of one replicate with ten points per concentration for 20, 30, 50, and 70 μg/mL.
The preprocessing and the machine learning part of the analysis were performed using RAMANMETRIX software (https://docs.ramanmetrix.eu/, accessed on 15 September 2024) [40]. First, the spectra were de-spiked using spike detection with one-dimensional Laplacian [41] and interpolated onto a linear wavenumber axis with a step size of 3 cm−1. Then, the baseline was calculated using the Sensitive Non-Iterative Peak (SNIP) [42] algorithm on smoothed spectra and subtracted from non-smoothed spectra. The baseline corrected spectra were cut to 350–1750 cm−1 wavenumber range and vector normalized. Prior to machine learning-based modelling, normalized spectra were averaged per point (20 spectra per point), resulting in 180 averaged training spectra and 40 averaged test spectra for blood plasma and for precipitated blood plasma. See the average preprocessed spectra for test data in supplementary Figure S4.
Following the preprocessing, we utilized partial least squares discriminant analysis (PLS-DA) to build a 2-class model to differentiate between zero concentration and presence of ceftriaxone (10–1000 μg/mL, see Figure S3). The number of used latent variables was optimized using batch-out cross-validation [39] of training data, where a combination of replicate and concentration was considered as batches, resulting in 18 batches. The models were built and optimized separately for blood plasma and precipitated blood plasma and then applied to the respective test data in order to estimate the limit of detection for each case.

3. Results and Discussion

Figure 1 illustrates the Raman spectra obtained from various forms of ceftriaxone, including powder (red curve), saturated aqueous solution (black curve), and SERS spectra of ceftriaxone prepared in water and dried on the substrate (blue curve), providing insight into its different vibrational modes. The Raman spectrum of the powder form reveals several major vibrational modes of ceftriaxone. The band assignment of ceftriaxone is provided in Table S1 (see supporting information). Notably, ceftriaxone exhibits prominent vibrational modes, including the C-S stretch at 674 cm−1 and 719 cm−1, while peaks in the 880–1096 cm−1 range correspond to the C-N stretch. Additionally, the SERS mode at 1356 cm−1 is associated with the carboxylate (COO) mode and the mode at 1491 cm−1 can be linked to amide II vibration modes [18,43].
The Raman spectrum of ceftriaxone in saturated aqueous solution (black curve) exhibits similar vibrational modes as that of the powder form (red curve). However, it is worth noting that some bands, specifically those at 1037, 1096, 1364, 1396, and 1499 cm−1, exhibit minor shifts (~5 to 12 cm−1) in their peak position and intensity, indicating the solvation effects; the presence of water molecules in the close vicinity of ceftriaxone molecules can cause these slight changes to the vibrational modes of the molecule [44]. The SERS phenomenon is driven by two key enhancement mechanisms: electromagnetic and chemical. In the context of the SERS spectrum of ceftriaxone, specific vibrational modes, notably at 1096 and 1351 cm−1, undergo substantial enhancement under SERS conditions due to their interaction with the silver surface. The marker mode around 1351 cm−1, which is assigned to the carboxylate vibration, is dominating the SERS spectrum. This indicates that the interaction with the SERS active sensing surface is achieved via this moiety, which agrees with data from the literature [35]. Thus, both chemical and electromagnetic enhancement can contribute to the overall SERS spectrum. Figure S1 (see supporting information) displays the SERS spectra of ceftriaxone solutions prepared in water and dried on the SERS-active surface, for the concentration of 1 mg/mL and 0 µg/mL. Figure S2 illustrates that SERS substrates are able to detect ceftriaxone at concentrations as low as 10 μg/mL in precipitated blood plasma, thereby making them an optimal choice for bioanalytical detection schemes.
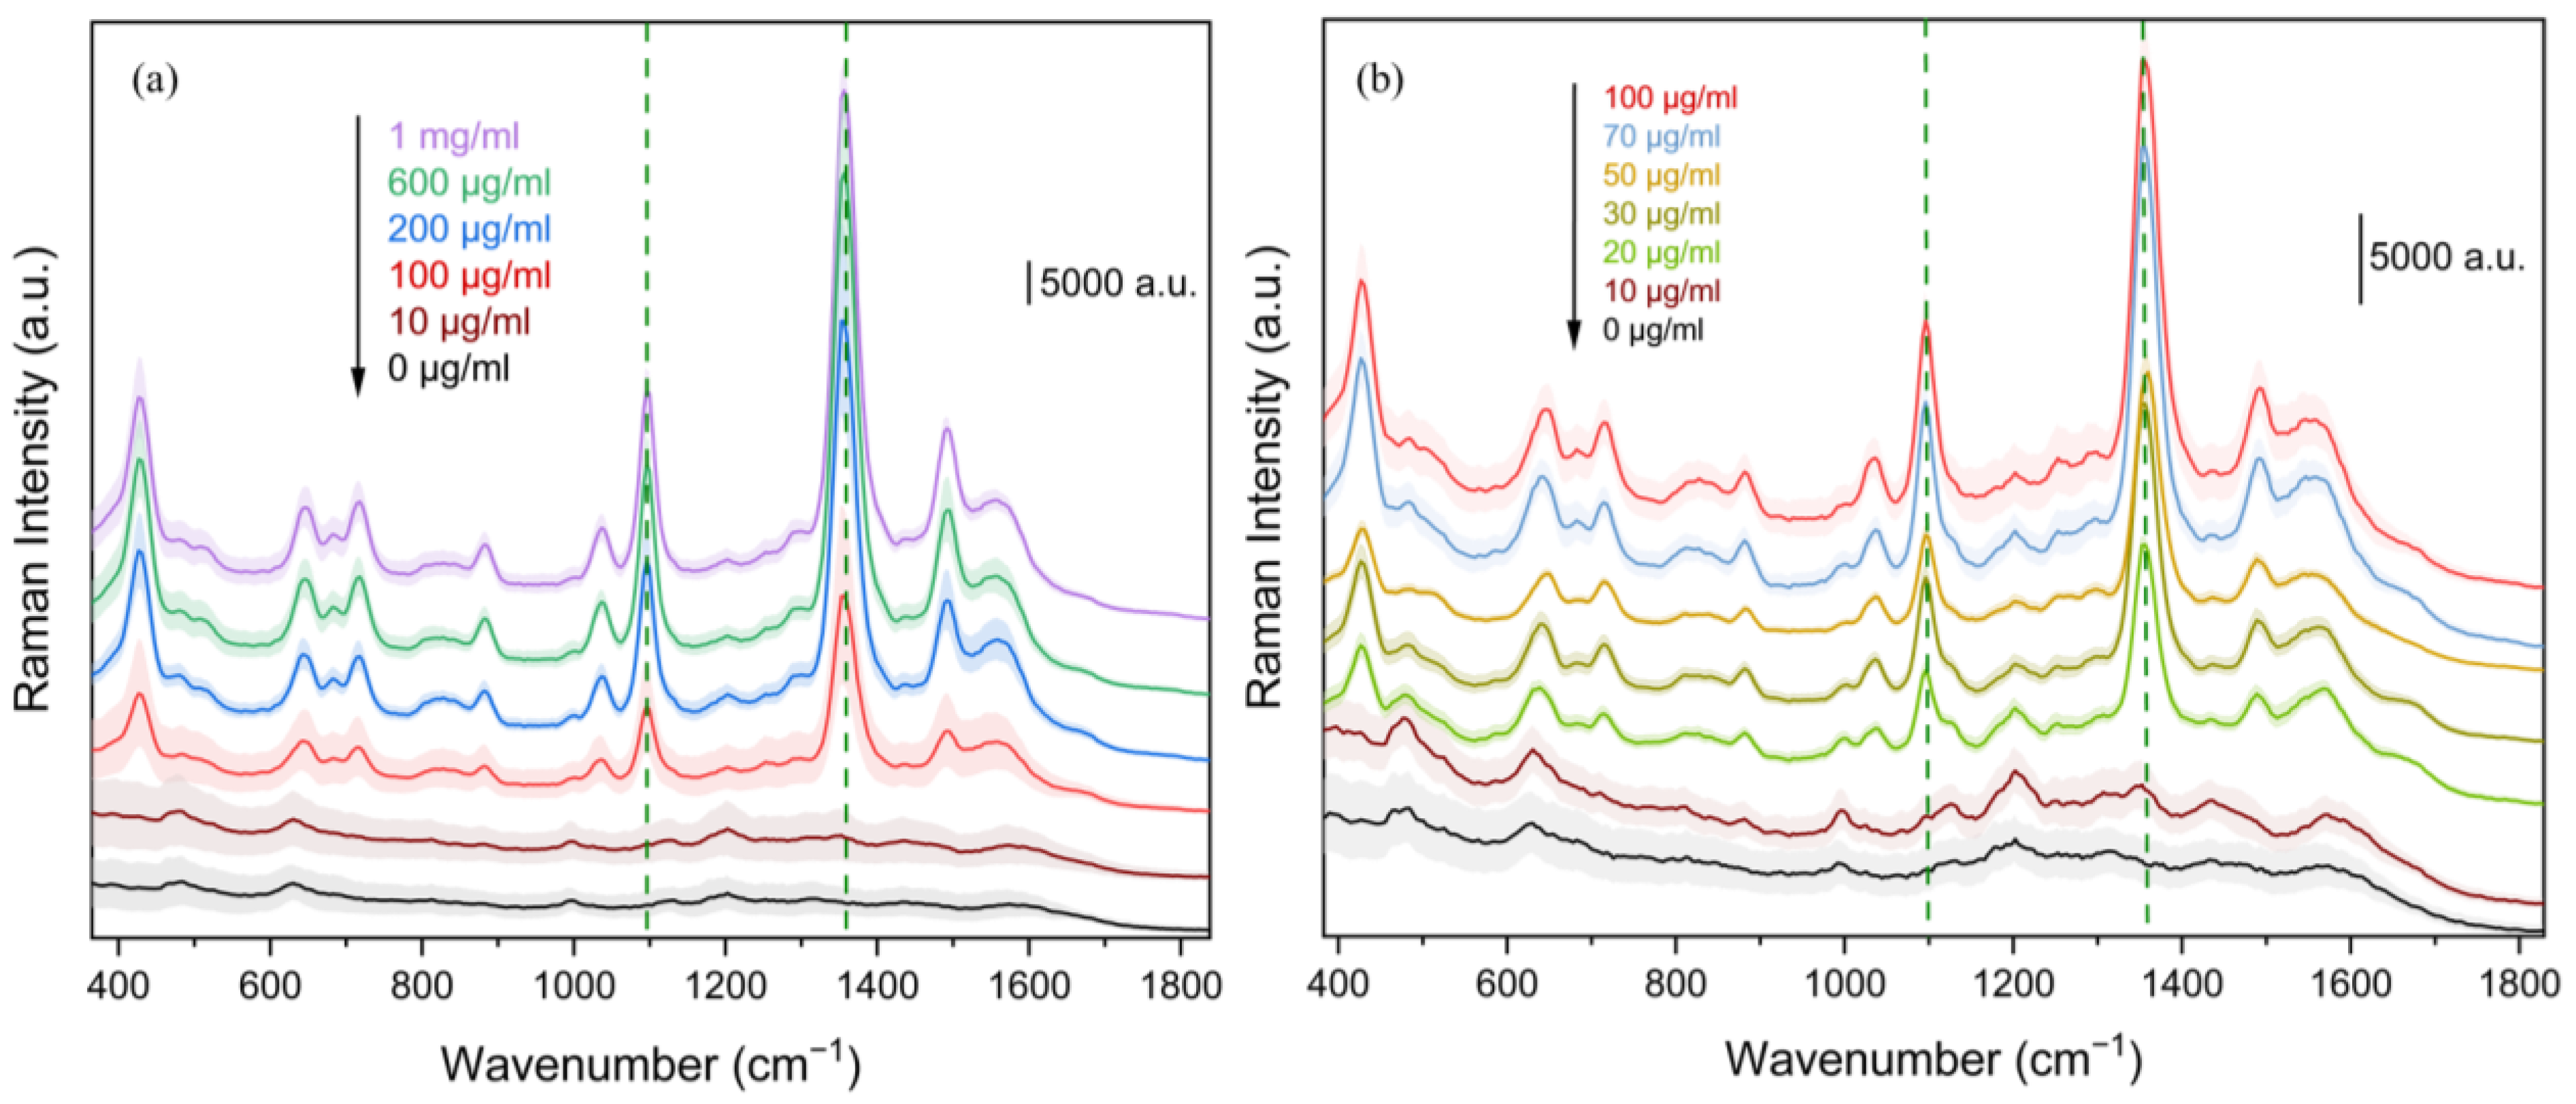
Detecting ceftriaxone in blood plasma is crucial for clinical applications such as precise monitoring during treatment with this drug in the case of critically ill patients [32,36]. The proteins and other components present in the blood plasma are known to interfere with the SERS signal by binding to the SERS active sites and creating a barrier for the analyte molecule to reach the SERS active hot spots and, therefore, can reduce the sensitivity of the SERS-based detection [16,21,24,45]. Blood plasma is a complex biological fluid that contains a variety of proteins such as albumin, globulins, fibrinogen, and other enzymes. These proteins play a critical role in different physiological processes [22,46]. Apart from these, other components present in blood plasma, such as different metabolites and electrolytes, can also interfere with the SERS signal of the analyte molecule. The SERS spectra of ceftriaxone spiked in blood plasma, covering concentrations from 1 mg/mL to 0 μg/mL are shown in Figure 2a. The SERS spectra reveal the characteristic peak of ceftriaxone around 1356 cm−1, detectable down to 100 μg/mL. This suggests a strong binding affinity of ceftriaxone to the SERS active silver substrate, facilitating the accurate quantification of the antibiotic. However, below 100 μg/mL, the characteristic SERS peak (1356 cm−1) disappears, indicating that the background signal from blood plasma influences the SERS response of ceftriaxone. Protein adsorption from blood plasma may be outcompeting the affinity of ceftriaxone for the SERS active hotspots, resulting in signal deterioration. This underscores the need for strategies to mitigate the interference of blood plasma components and enhance the detection sensitivity of ceftriaxone. Figure 2b sheds light on the lower concentrations ranging from 100 to 10 μg/mL. It demonstrates that the characteristic peak of ceftriaxone at 1356 cm−1 is detectable down to 70 μg/mL in blood plasma. Interestingly the SERS spectra at a concentration range below 70 μg/mL exhibit clear SERS peaks associated with the components of blood plasma rather than that of ceftriaxone [22]. This observation indicates that at concentrations below 70 μg/mL, blood plasma components began dominating the SERS signal. The interference of blood plasma components at lower concentrations indicates the challenges of the lower sensitivity of ceftriaxone in this complex matrix. SERS vibrational modes associated with the blood plasma components can be attributed to the adsorption and interaction of proteins, metabolites, and other components present in blood plasma on the SERS active regions. These findings emphasize the challenges of sensitive detection of ceftriaxone at lower concentrations in a very complex matrix and, therefore, the need for sample preparation to reduce the effect of different matrix components on SERS sites.
To enhance the detection sensitivity, a common practice is to remove these proteins using methanol incubation followed by centrifugation, which precipitates the bigger molecules in the solution [47]. Methanol-induced precipitation can reduce the molecular crowding effects such as lowering the formation of protein corona at SERS hot spots, while the reduced background signal improves the detection and quantification of the analyte. The procedure for precipitating blood plasma with methanol is depicted in Figure 3.
The obtained SERS spectra are presented in Figure 4a, covering the concentration range from 1 mg/mL to 0 μg/mL, mirroring the same concentration range as we investigated employing unprocessed blood plasma. The characteristic SERS mode of ceftriaxone at 1356 cm−1 can be easily observed down to 100 μg/mL, similar to that in blood plasma. Importantly, the SERS spectra from precipitated blood plasma exhibit significantly higher intensity across various ceftriaxone detection modes than those from blood plasma alone. Upon comparing the 10 μg/mL concentration in both detection schemes, a slight presence of the 1356 cm−1 mode in the precipitated blood plasma case becomes evident (see supporting information, Figure S2). This underscores the substantial enhancement in the detection sensitivity of ceftriaxone in the relatively simpler matrix of precipitated blood plasma. The SERS spectra in the lower concentration range of 100 μg/mL to 10 μg/mL are depicted in Figure 4b, demonstrating a significant improvement down to 20 μg/mL compared to the previous detection limit in blood plasma. This concentration of 20 μg/mL (36 μM) is lower than the clinical requirement range of 44–120 μM (24–66 μg/mL) for ceftriaxone detection in patients [12], indicating the importance of protein removal in complex matrices. The clinically relevant concentration range for ceftriaxone, particularly in the context of therapeutic drug monitoring (TDM), was reported to be 24–66 µg/mL for relevant plasma concentrations of ceftriaxone in critically ill patients [12,48] with another report describing peak concentrations of 79–255 µg/mL and a trough of 15–45 µg/mL for a daily dose of 1 g [49,50].
A straightforward comparison between Figure 2 and Figure 4 emphasizes the sample pretreatment using protein precipitation, which can effectively improve the signal-to-noise ratio and enhance the detectability of ceftriaxone. Removing interfering components can enable a more accurate and reliable analysis of analytes in complex media.
The band centered at 1351 cm−1 (characteristic mode of ceftriaxone) changes in intensity as a function of its concentration in solution. To demonstrate the potential of SERS in complex matrices and aid comprehension of this feature, a machine learning method, the PLS-DA model, was used for ceftriaxone presence prediction in the relevant detection range (Figure 5). The results demonstrate that the potential limit of detection in blood plasma and precipitated blood plasma can be as low as 50 μg/mL and 20 μg/mL, respectively. An overview of the detection limits reported for ceftriaxone is provided in Table 1.
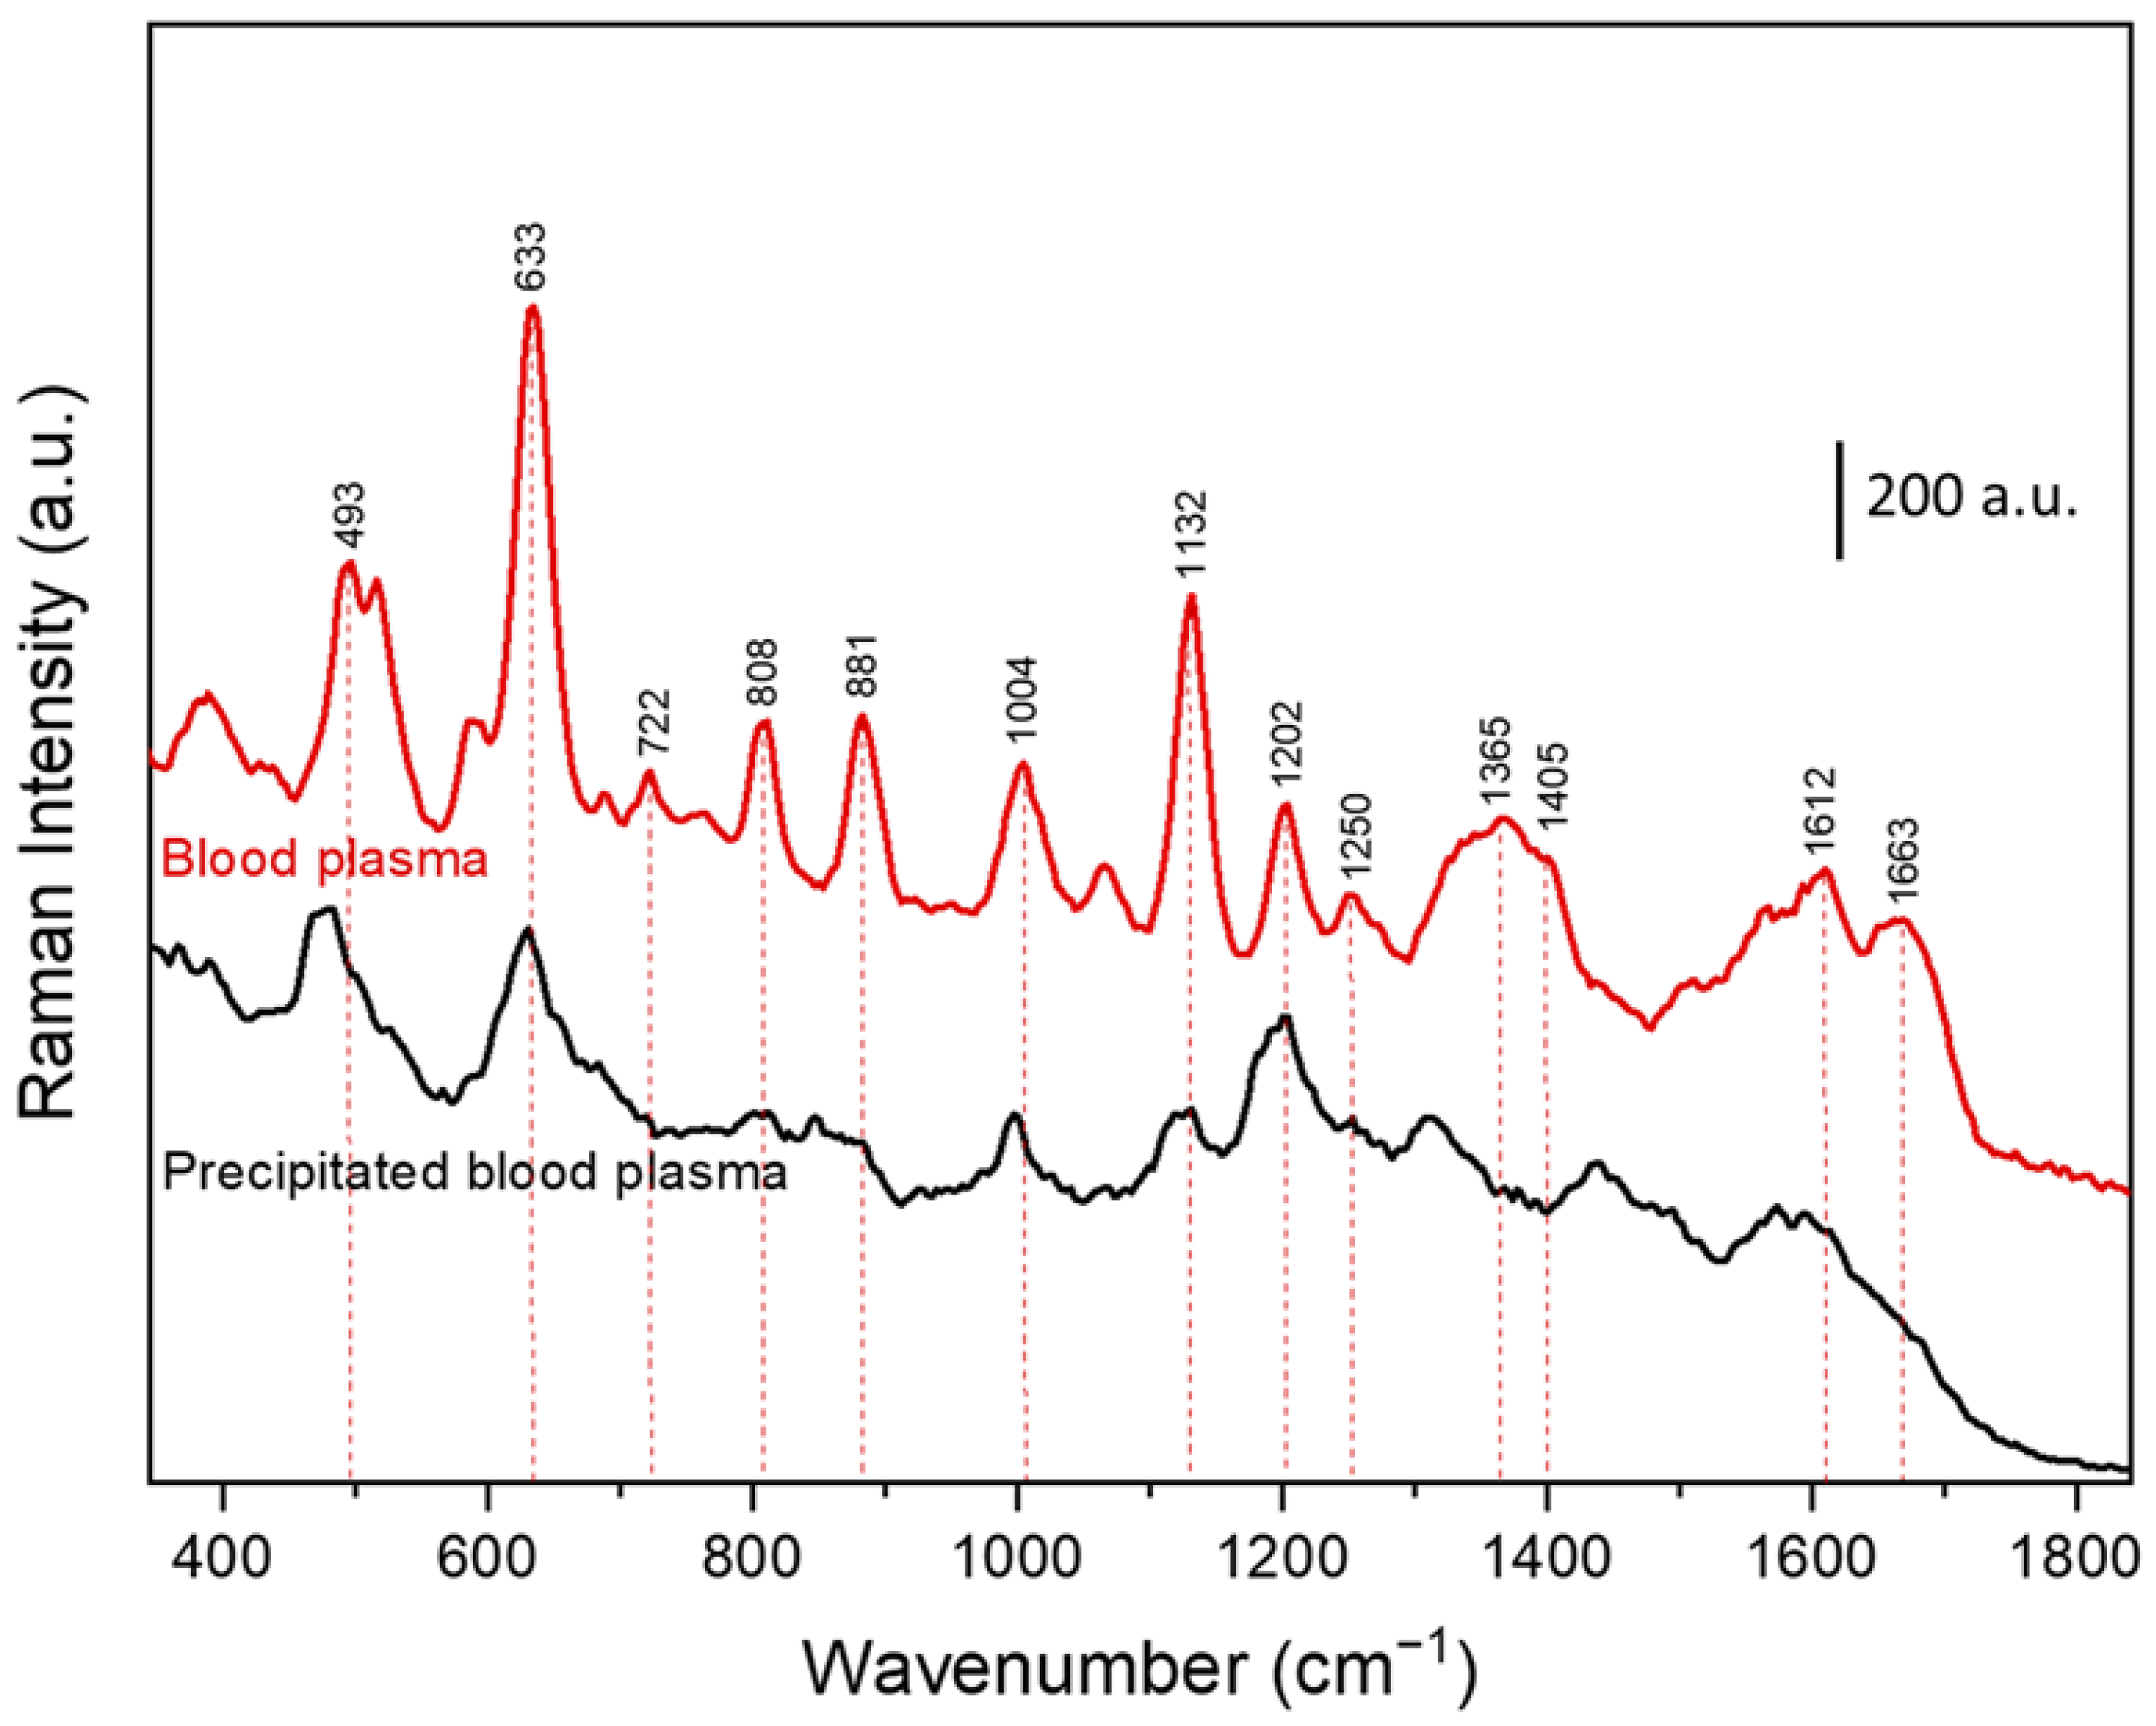
It is important to note that some of the Raman bands overlap in the ceftriaxone spectra and the background blood plasma spectra. This is particularly evident in the bands around ~500 cm⁻¹ and ~640 cm⁻¹. To ensure accurate results, it is essential to exclude the overlapping modes from the calibration process. To understand the background contribution from blood plasma and precipitated blood plasma, their SERS spectra are compared in Figure 5, which reflects the background SERS spectra (i.e., 0 µg/mL) in Figure 2 and Figure 4. The SERS spectra of blood plasma exhibit various vibrational modes arising from different components present in the blood plasma, such as uric acid, adenine, and hypoxanthine. The presence of these components leads to increased background and masking of ceftriaxone to reach the SERS active regions. Assigning the SERS characteristics peaks of blood plasma components to specific constituents can provide further insight into their contribution to the spectrum. The assignment of SERS bands to blood plasma is a topic of debate in the literature and several studies have been conducted on this subject [24,45,46]. One crucial point to be noted when assigning the bands to SERS spectra of blood plasma is to directly compare the SERS spectra of blood plasma with the SERS spectra of different constituent molecules rather than comparing it with their Raman spectra as shown in the different studies [22,52,53]. The vibrational modes in pure Raman spectra of the molecule are slightly different from that of their SERS spectra, and comparison with them can lead to erroneous band assignments as discussed in the literature [22,54]. The majority of SERS bands of blood plasma correspond to uric acid and hypoxanthine, owing to their high affinity towards the metal nanostructure surface. Based on this assumption and the literature, the blood plasma band assignments were performed and presented in Table 2.
The SERS spectra of precipitated blood plasma indicate the removal of rich background from blood plasma components, leading to increased SERS sensitivity towards the target analyte, i.e., ceftriaxone. As seen from Figure 6, precipitated blood plasma exhibits a significant reduction of several peaks associated with the blood plasma such as uric acid, hypoxanthine, and glutathione indicating the successful removal of interfering plasma components. In addition to proteins, other components of blood plasma, such as lipids and metabolites, may also be partially removed or reduced in the methanol-based precipitation step. Many studies have already backed up the claim to increase the signal-to-noise ratio and minimize interference as a result of protein precipitation [54]. The protein precipitation strategy has a high potential to be widely utilized in various studies to enhance the SERS sensitivity in complex biological matrices that SERS-based detection schemes will be routinely available for TDM.

4. Conclusions and Perspectives

In conclusion, this study investigates the SERS-based detection of ceftriaxone in blood plasma. Many key findings have emerged using several experiments and analyses of the spectra. It is possible to identify the SERS spectra of ceftriaxone in complex matrix-like blood plasma with a concentration of as low as 20 ug/mL. Methanol-assisted protein precipitation was successfully employed to interfere with species in blood plasma and improve the detection sensitivity. The detection sensitivity of ceftriaxone in precipitated blood plasma is significantly higher in SERS spectra, with the signal being visible even below the required clinical concentration. By comparing the spectra of blood plasma and precipitated blood plasma, it is evident that protein precipitation significantly improves detection sensitivity. Removing interfering species from blood plasma resulted in a much cleaner background and improved signal intensity. Overall, these results highlight the importance of protein precipitation in SERS-based detection in complex biological matrices. The findings of this study lay the foundation for further research and development in the sensitive detection of antibiotics in complex biological matrices, e.g., in the framework of TDM. One can further investigate optimizing the protein precipitation technique to improve the removal of interfering components and minimize SERS signal loss. This can involve exploring various solvents, temperatures, and other parameters. The methodology used in this study applies to other antibiotics found in different biological samples such as serum, tissue, and urine. Investigating the applicability of protein precipitation and SERS in various matrices will expand the scope of this research and can be influential in clinical diagnostics and therapeutic monitoring.

Supplementary Materials

The following supporting information can be downloaded at: https://www.mdpi.com/article/10.3390/chemosensors12100213/s1, Figure S1: Background Raman spectra of the substrate (black curve), SERS spectra of ceftriaxone in aqueous media at 1 mg/mL concentration; Figure S2: SERS spectra of ceftriaxone at 10 µg/mL concentration in blood plasma (black curve), and precipitated blood plasma (red curve); Figure S3: PLS-DA classification for ceftriaxone detection in blood plasma and precipitated blood plasma for broad range; Figure S4: Average preprocessed spectra of the test data in PLS-DA classification analysis for, (a) blood plasma, (b) precipitated blood plasma; Table S1: Band assignments for ceftriaxone. Reference [18] is cited in the Supplementary Materials.

Author Contributions

A.D.: Methodology, Conceptualization, Experiment, Data processing and Writing—original draft, Editing; O.R.: Methodology, Formal analysis; C.L.: Experiment and scientific discussion; E.F.: Scientific discussion; M.S.S.: Conceptualization, Writing—review; T.B.: Methodology, Supervision und Funding; J.P.: Supervision, Funding acquisition, Writing—review; D.C.-M.: Conceptualization, Experiment design, Funding acquisition, Writing—review and editing. All authors have read and agreed to the published version of the manuscript.

Funding

We gratefully acknowledge the DFG for funding project 465289819. We gratefully acknowledge the ACTPHAST 4.0 innovation support project in relation to Grant Agreement No 779472. This work is supported by the BMBF, funding program Photonics Research Germany (13N15466 (LPI-BT1-FSU), 13N15708 (LPI-BT3-IPHT)) and is integrated into the Leibniz Center for Photonics in Infection Research (LPI). The LPI initiated by Leibniz-IPHT, Leibniz-HKI, Friedrich Schiller University Jena and Jena University Hospital is part of the BMBF national roadmap for research infrastructures.

Institutional Review Board Statement

Not applicable.

Informed Consent Statement

Not applicable.

Data Availability Statement

The original contributions presented in the study are included in the article/Supplementary Materials, further inquiries can be directed to the corresponding author.

Conflicts of Interest

Author Michael Stenbæk Schmidt is an employee of the company Silmeco ApS. The remaining authors declare that the research was conducted in the absence of any commercial or financial relationships that could be construed as potential conflicts of interest.

References

  1. Patsalos, P.N.; Berry, D.J.; Bourgeois, B.F.D.; Cloyd, J.C.; Glauser, T.A.; Johannessen, S.I.; Leppik, I.E.; Tomson, T.; Perucca, E. Antiepileptic Drugs—Best Practice Guidelines for Therapeutic Drug Monitoring: A Position Paper by the Subcommission on Therapeutic Drug Monitoring, ILAE Commission on Therapeutic Strategies. Epilepsia 2008, 49, 1239–1276. [Google Scholar] [CrossRef] [PubMed]
  2. Kang, J.S.; Lee, M.H. Overview of Therapeutic Drug Monitoring. Korean J. Intern. Med. 2009, 24, 1–10. [Google Scholar] [CrossRef] [PubMed]
  3. Fernandez, E.L.; Parés, L.; Ajuria, I.; Bandres, F.; Castanyer, B.; Campos, F.; Farré, C.; Pou, L.; Queraltó, J.M.; To-Figueras, J. State of the Art in Therapeutic Drug Monitoring. Clin. Chem. Lab. Med. 2010, 48, 437–446. [Google Scholar] [CrossRef]
  4. Dasgupta, A. Usefulness of Monitoring Free (Unbound) Concentrations of Therapeutic Drugs in Patient Management. Clin. Chim. Acta 2007, 377, 1–13. [Google Scholar] [CrossRef] [PubMed]
  5. Gui, Y.; Lu, Y.; Li, S.; Zhang, M.; Duan, X.; Liu, C.C.; Jia, J.; Liu, G. Direct Analysis in Real Time-Mass Spectrometry for Rapid Quantification of Five Anti-Arrhythmic Drugs in Human Serum: Application to Therapeutic Drug Monitoring. Sci. Rep. 2020, 10, 15550. [Google Scholar] [CrossRef]
  6. Losoya-Leal, A.; Estevez, M.C.; Martínez-Chapa, S.O.; Lechuga, L.M. Design of a Surface Plasmon Resonance Immunoassay for Therapeutic Drug Monitoring of Amikacin. Talanta 2015, 141, 253–258. [Google Scholar] [CrossRef]
  7. Antunes, M.V.; Charão, M.F.; Linden, R. Dried Blood Spots Analysis with Mass Spectrometry: Potentials and Pitfalls in Therapeutic Drug Monitoring. Clin. Biochem. 2016, 49, 1035–1046. [Google Scholar] [CrossRef]
  8. Decosterd, L.A.; Widmer, N.; André, P.; Aouri, M.; Buclin, T. The Emerging Role of Multiplex Tandem Mass Spectrometry Analysis for Therapeutic Drug Monitoring and Personalized Medicine. TrAC Trends Anal. Chem. 2016, 84, 5–13. [Google Scholar] [CrossRef]
  9. Ates, H.C.; Roberts, J.A.; Lipman, J.; Cass, A.E.G.; Urban, G.A.; Dincer, C. On-Site Therapeutic Drug Monitoring. Trends Biotechnol. 2020, 38, 1262–1277. [Google Scholar] [CrossRef]
  10. Panikar, S.S.; Cialla-May, D.; De la Rosa, E.; Salas, P.; Popp, J. Towards Translation of Surface-Enhanced Raman Spectroscopy (SERS) to Clinical Practice: Progress and Trends. TrAC Trends Anal. Chem. 2021, 134, 116122. [Google Scholar] [CrossRef]
  11. Dina, N.E.; Tahir, M.A.; Bajwa, S.Z.; Amin, I.; Valev, V.K.; Zhang, L. SERS-Based Antibiotic Susceptibility Testing: Towards Point-of-Care Clinical Diagnosis. Biosens. Bioelectron. 2023, 219, 956–5663. [Google Scholar] [CrossRef]
  12. Fornasaro, S.; Cialla-May, D.; Sergo, V.; Bonifacio, A. The Role of Surface Enhanced Raman Scattering for Therapeutic Drug Monitoring of Antimicrobial Agents. Chemosensors 2022, 10, 128. [Google Scholar] [CrossRef]
  13. Jaworska, A.; Fornasaro, S.; Sergo, V.; Bonifacio, A. Potential of Surface Enhanced Raman Spectroscopy (SERS) in Therapeutic Drug Monitoring (TDM). A Critical Review. Biosensors 2016, 6, 47. [Google Scholar] [CrossRef] [PubMed]
  14. Liu, C.; Weber, S.; Peng, R.; Wu, L.; Zhang, W.-S.; Luppa, P.B.; Popp, J.; Cialla-May, D. Toward SERS-Based Therapeutic Drug Monitoring in Clinical Settings: Recent Developments and Trends. TrAC Trends Anal. Chem. 2023, 164, 117094. [Google Scholar] [CrossRef]
  15. Fornasaro, S.; Dalla Marta, S.; Rabusin, M.; Bonifacio, A.; Sergo, V. Toward SERS-Based Point-of-Care Approaches for Therapeutic Drug Monitoring: The Case of Methotrexate. Faraday Discuss. 2016, 187, 485–499. [Google Scholar] [CrossRef] [PubMed]
  16. Surendra Panikar, S.; Banu, N.; Haramati, J.; Yareli Gutierrez-Silerio, G.; Estela Bastidas-Ramirez, B.; Cecilia Tellez-Ba, M.; Camacho-Villegas, T.A.; del Toro-Arreola, S.; De la Rosa, E. Anti-Fouling SERS-Based Immunosensor for Point-of-Care Detection of the B7eH6 Tumor Biomarker in Cervical Cancer Patient Serum. Anal. Chim. Acta 2020, 1138, 110–122. [Google Scholar] [CrossRef]
  17. Chircov, C.; Grumezescu, A.M.; Holban, A.M. Materials Magnetic Particles for Advanced Molecular Diagnosis. Materials 2019, 12, 2158. [Google Scholar] [CrossRef]
  18. Markina, N.E.; Goryacheva, I.Y.; Markin, A.V. Sample Pretreatment and SERS-Based Detection of Ceftriaxone in Urine. Anal. Bioanal. Chem. 2018, 410, 2221–2227. [Google Scholar] [CrossRef]
  19. Giovannini, G.; De Angelis, F. Novel Electro-Magnetophoretic Separation Method for the Highly Sensitive Detection of Analytes. Nanoscale Horiz. 2020, 5, 95–101. [Google Scholar] [CrossRef]
  20. Pezzi, H.M.; Guckenberger, D.J.; Schehr, J.L.; Rothbauer, J.; Stahlfeld, C.; Singh, A.; Horn, S.; Schultz, Z.D.; Bade, R.M.; Sperger, J.M.; et al. Versatile Exclusion-Based Sample Preparation Platform for Integrated Rare Cell Isolation and Analyte Extraction. Lab Chip 2018, 18, 3446–3458. [Google Scholar] [CrossRef]
  21. Guselnikova, O.; Lim, H.; Na, J.; Eguchi, M.; Kim, H.-J.; Elashnikov, R.; Postnikov, P.; Svorcik, V.; Semyonov, O.; Miliutina, E.; et al. Enantioselective SERS Sensing of Pseudoephedrine in Blood Plasma Biomatrix by Hierarchical Mesoporous Au Films Coated with a Homochiral MOF. Biosens. Bioelectron. 2021, 180, 113109. [Google Scholar] [CrossRef] [PubMed]
  22. Bonifacio, A.; Dalla Marta, S.; Spizzo, R.; Cervo, S.; Steffan, A.; Colombatti, A.; Sergo, V. Surface-Enhanced Raman Spectroscopy of Blood Plasma and Serum Using Ag and Au Nanoparticles: A Systematic Study. Anal. Bioanal. Chem. 2014, 406, 2355–2365. [Google Scholar] [CrossRef] [PubMed]
  23. Ehsan, U.; Nawaz, H.; Irfan Majeed, M.; Rashid, N.; Ali, Z.; Zulfiqar, A.; Tariq, A.; Shahbaz, M.; Meraj, L.; Naheed, I.; et al. Surface-Enhanced Raman Spectroscopy of Centrifuged Blood Serum Samples of Diabetic Type II Patients by Using 50KDa Filter Devices. Spectrochim. Acta Part A Mol. Biomol. Spectrosc. 2023, 293, 122457. [Google Scholar] [CrossRef] [PubMed]
  24. Sun, F.; Hung, H.C.; Sinclair, A.; Zhang, P.; Bai, T.; Galvan, D.D.; Jain, P.; Li, B.; Jiang, S.; Yu, Q. Hierarchical Zwitterionic Modification of a SERS Substrate Enables Real-Time Drug Monitoring in Blood Plasma. Nat. Commun. 2016, 7, 13437. [Google Scholar] [CrossRef]
  25. Dams, R.; Huestis, M.A.; Lambert, W.E.; Murphy, C.M. Matrix Effect in Bio-Analysis of Illicit Drugs with LC-MS/MS: Influence of Ionization Type, Sample Preparation, and Biofluid. J. Am. Soc. Mass. Spectrom. 2003, 14, 1290–1294. [Google Scholar] [CrossRef]
  26. Ma, J.; Shi, J.; Le, H.; Cho, R.; Huang, J.C.-j.; Miao, S.; Wong, B.K. A Fully Automated Plasma Protein Precipitation Sample Preparation Method for LC–MS/MS Bioanalysis. J. Chromatogr. B 2008, 862, 219–226. [Google Scholar] [CrossRef]
  27. Grigoriev, A.; Borisova, I.; Yaroshenko, I.; Sidorova, A. In Vitro and in Vivo Stability of Oseltamivir within a Bioequivalence Trial. Anal. Bioanal. Chem. 2016, 408, 3891–3897. [Google Scholar] [CrossRef]
  28. Dies, H.; Raveendran, J.; Escobedo, C.; Docoslis, A. Rapid Identification and Quantification of Illicit Drugs on Nanodendritic Surface-Enhanced Raman Scattering Substrates. Sens. Actuators B 2018, 257, 382–388. [Google Scholar] [CrossRef]
  29. Courlet, P.; Spaggiari, D.; Cavassini, M.; Du Pasquier, R.; Alves Saldanha, S.; Buclin, T.; Marzolini, C.; Csajka, C.; Decosterd, L. Determination of Nucleosidic/Tidic Reverse Transcriptase Inhibitors in Plasma and Cerebrospinal Fluid by Ultra-High-Pressure Liquid Chromatography Coupled with Tandem Mass Spectrometry. Clin. Mass Spectrom. 2018, 8, 8–20. [Google Scholar] [CrossRef]
  30. Stefancu, A.; Badarinza, M.; Moisoiu, V.; Iancu, S.D.; Serban, O.; Leopold, N.; Fodor, D. SERS-Based Liquid Biopsy of Saliva and Serum from Patients with Sjögren’s Syndrome. Anal. Bioanal. Chem. 2019, 411, 5877–5883. [Google Scholar] [CrossRef]
  31. Li, P.; Ge, M.; Cao, C.; Lin, D.; Yang, L. High-Affinity Fe3O4/Au Probe with Synergetic Effect of Surface Plasmon Resonance and Charge Transfer Enabling Improved SERS Sensing of Dopamine in Biofluids. Analyst 2019, 144, 4526–4533. [Google Scholar] [CrossRef] [PubMed]
  32. Meenks, S.; Le Noble, J.; Foudraine, N.; de Vries, F.; Janssen, P. Liquid Chromatography-Tandem Mass Spectrometry to Monitor Unbound and Total Ceftriaxone in Serum of Critically Ill Patients. Curr. Rev. Clin. Exp. Pharmacol. 2021, 16, 341–349. [Google Scholar] [CrossRef] [PubMed]
  33. Markina, N.E.; Markin, A.V. Application of Aluminum Hydroxide for Improvement of Label-Free SERS Detection of Some Cephalosporin Antibiotics in Urine. Biosensors 2019, 9, 91. [Google Scholar] [CrossRef]
  34. Norrby, S.R. Side Effects of Cepbalosporins. Drugs 1987, 34 (Suppl. 2), 105–120. [Google Scholar] [CrossRef]
  35. Markina, N.E.; Ustinov, S.N.; Zakharevich, A.M.; Markin, A.V. Copper Nanoparticles for SERS-Based Determination of Some Cephalosporin Antibiotics in Spiked Human Urine. Anal. Chim. Acta 2020, 1138, 9–17. [Google Scholar] [CrossRef]
  36. Markina, N.E.; Volkova, E.K.; Zakharevich, A.M.; Goryacheva, I.Y.; Markin, A.V. SERS Detection of Ceftriaxone and Sulfadimethoxine Using Copper Nanoparticles Temporally Protected by Porous Calcium Carbonate. Microchim. Acta 2018, 185, 481. [Google Scholar] [CrossRef]
  37. Guo, S.; Popp, J.; Bocklitz, T. Chemometric Analysis in Raman Spectroscopy from Experimental Design to Machine Learning–Based Modeling. Nat. Protoc. 2021, 16, 5426–5459. [Google Scholar] [CrossRef]
  38. Villa, J.E.L.; Quiñones, N.R.; Fantinatti-Garboggini, F.; Poppi, R.J. Fast Discrimination of Bacteria Using a Filter Paper–Based SERS Platform and PLS-DA with Uncertainty Estimation. Anal. Bioanal. Chem. 2019, 411, 705–713. [Google Scholar] [CrossRef]
  39. Guo, S.; Bocklitz, T.; Neugebauer, U.; Urgen Popp, J. Common Mistakes in Cross-Validating Classification Models. Anal. Methods 2017, 9, 4410–4417. [Google Scholar] [CrossRef]
  40. Storozhuk, D.; Ryabchykov, O.; Popp, J.; Bocklitz, T. RAMANMETRIX: A Delightful Way to Analyze Raman Spectra. arXiv 2022, arXiv:2201.07586. [Google Scholar]
  41. Ryabchykov, O.; Bocklitz, T.; Ramoji, A.; Neugebauer, U.; Foerster, M.; Kroegel, C.; Bauer, M.; Kiehntopf, M.; Popp, J. Automatization of Spike Correction in Raman Spectra of Biological Samples. Chemom. Intell. Lab. Syst. 2016, 155, 1–6. [Google Scholar] [CrossRef]
  42. Erb, D. Pybaselines: A Python Library of Algorithms for the Baseline Correction of Experimental Data; Zenodo: Geneva, Switzerland, 2022. [Google Scholar] [CrossRef]
  43. Koleva, B.B.; Kolev, T.M.; Spiteller, M. Determination of Cephalosporins in Solid Binary Mixtures by Polarized IR- and Raman Spectroscopy. J. Pharm. Biomed. Anal. 2008, 48, 201–204. [Google Scholar] [CrossRef] [PubMed]
  44. Ingraham, H.M.; Premasiri, W.R.; Ziegler, L.D. NIR Surface Enhanced Raman Spectra of Biological Hemes: Solvation and Plasmonic Metal Effects. J. Raman Spectrosc. 2021, 52, 2500–2515. [Google Scholar] [CrossRef]
  45. Feng, S.; Chen, R.; Lin, J.; Pan, J.; Chen, G.; Li, Y.; Cheng, M.; Huang, Z.; Chen, J.; Zeng, H. Nasopharyngeal Cancer Detection Based on Blood Plasma Surface-Enhanced Raman Spectroscopy and Multivariate Analysis. Biosens. Bioelectron. 2010, 25, 2414–2419. [Google Scholar] [CrossRef] [PubMed]
  46. Premasiri, W.R.; Lee, J.C.; Ziegler, L.D. Surface-Enhanced Raman Scattering of Whole Human Blood, Blood Plasma, and Red Blood Cells: Cellular Processes and Bioanalytical Sensing. J. Phys. Chem. B 2012, 116, 9376–9386. [Google Scholar] [CrossRef]
  47. Bruce, S.J.; Tavazzi, I.; Parisod, V.; Rezzi, S.; Kochhar, S.; Guy, P.A. Investigation of Human Blood Plasma Sample Preparation for Performing Metabolomics Using Ultrahigh Performance Liquid Chromatography/Mass Spectrometry. Anal. Chem. 2009, 81, 3285–3296. [Google Scholar] [CrossRef]
  48. Roberts, J.A.; Paul, S.K.; Akova, M.; Bassetti, M.; De Waele, J.J.; Dimopoulos, G.; Kaukonen, K.-M.; Koulenti, D.; Martin, C.; Montravers, P.; et al. DALI: Defining Antibiotic Levels in Intensive Care Unit Patients: Are Current β-Lactam Antibiotic Doses Sufficient for Critically Ill Patients? Clin. Infect. Dis. 2014, 58, 1072–1083. [Google Scholar] [CrossRef]
  49. Pollock, A.A.; Tee, P.E.; Patel, I.H.; Spicehandler, J.; Simberkoff, M.S.; Rahal, J.J., Jr. Pharmacokinetic Characteristics of Intravenous Ceftriaxone in Normal Adults. Antimicrob. Agents Chemother. 1982, 22, 816–823. [Google Scholar] [CrossRef]
  50. Liu, C.; Franceschini, C.; Weber, S.; Dib, T.; Liu, P.; Wu, L.; Farnesi, E.; Zhang, W.-S.; Sivakov, V.; Luppa, P.B.; et al. SERS-Based Detection of the Antibiotic Ceftriaxone in Spiked Fresh Plasma and Microdialysate Matrix by Using Silver-Functionalized Silicon Nanowire Substrates. Talanta 2024, 271, 125697. [Google Scholar] [CrossRef]
  51. Liu, Z.; Li, Z.; Kong, D.; Yuan, L.; Yang, J.; Zhang, J.; Luo, M.; Teng, P.; Gao, D.; Yang, X.; et al. Optofluidic In-Fiber Integrated Surface-Enhanced Raman Spectroscopy Detection Based on a Hollow Optical Fiber with a Suspended Core. Opt. Lett. 2019, 44, 5173–5176. [Google Scholar] [CrossRef]
  52. Avci, E.; Yilmaz, H.; Sahiner, N.; Tuna, B.G.; Cicekdal, M.B.; Eser, M.; Basak, K.; Altıntoprak, F.; Zengin, I.; Dogan, S.; et al. Label-Free Surface Enhanced Raman Spectroscopy for Cancer Detection. Cancers 2022, 14, 5021. [Google Scholar] [CrossRef] [PubMed]
  53. Bonifacio, A. Label-Free Surface-Enhanced Raman Scattering for Clinical Applications. In Principles and Clinical Diagnostic Applications of Surface-Enhanced Raman Spectroscopy; Elsevier: Amsterdam, The Netherlands, 2021; pp. 125–170. ISBN 9780128211212. [Google Scholar] [CrossRef]
  54. Bonifacio, A.; Cervo, S.; Sergo, V. Label-Free Surface-Enhanced Raman Spectroscopy of Biofluids: Fundamental Aspects and Diagnostic Applications. Anal. Bioanal. Chem. 2015, 407, 8265–8277. [Google Scholar] [CrossRef] [PubMed]
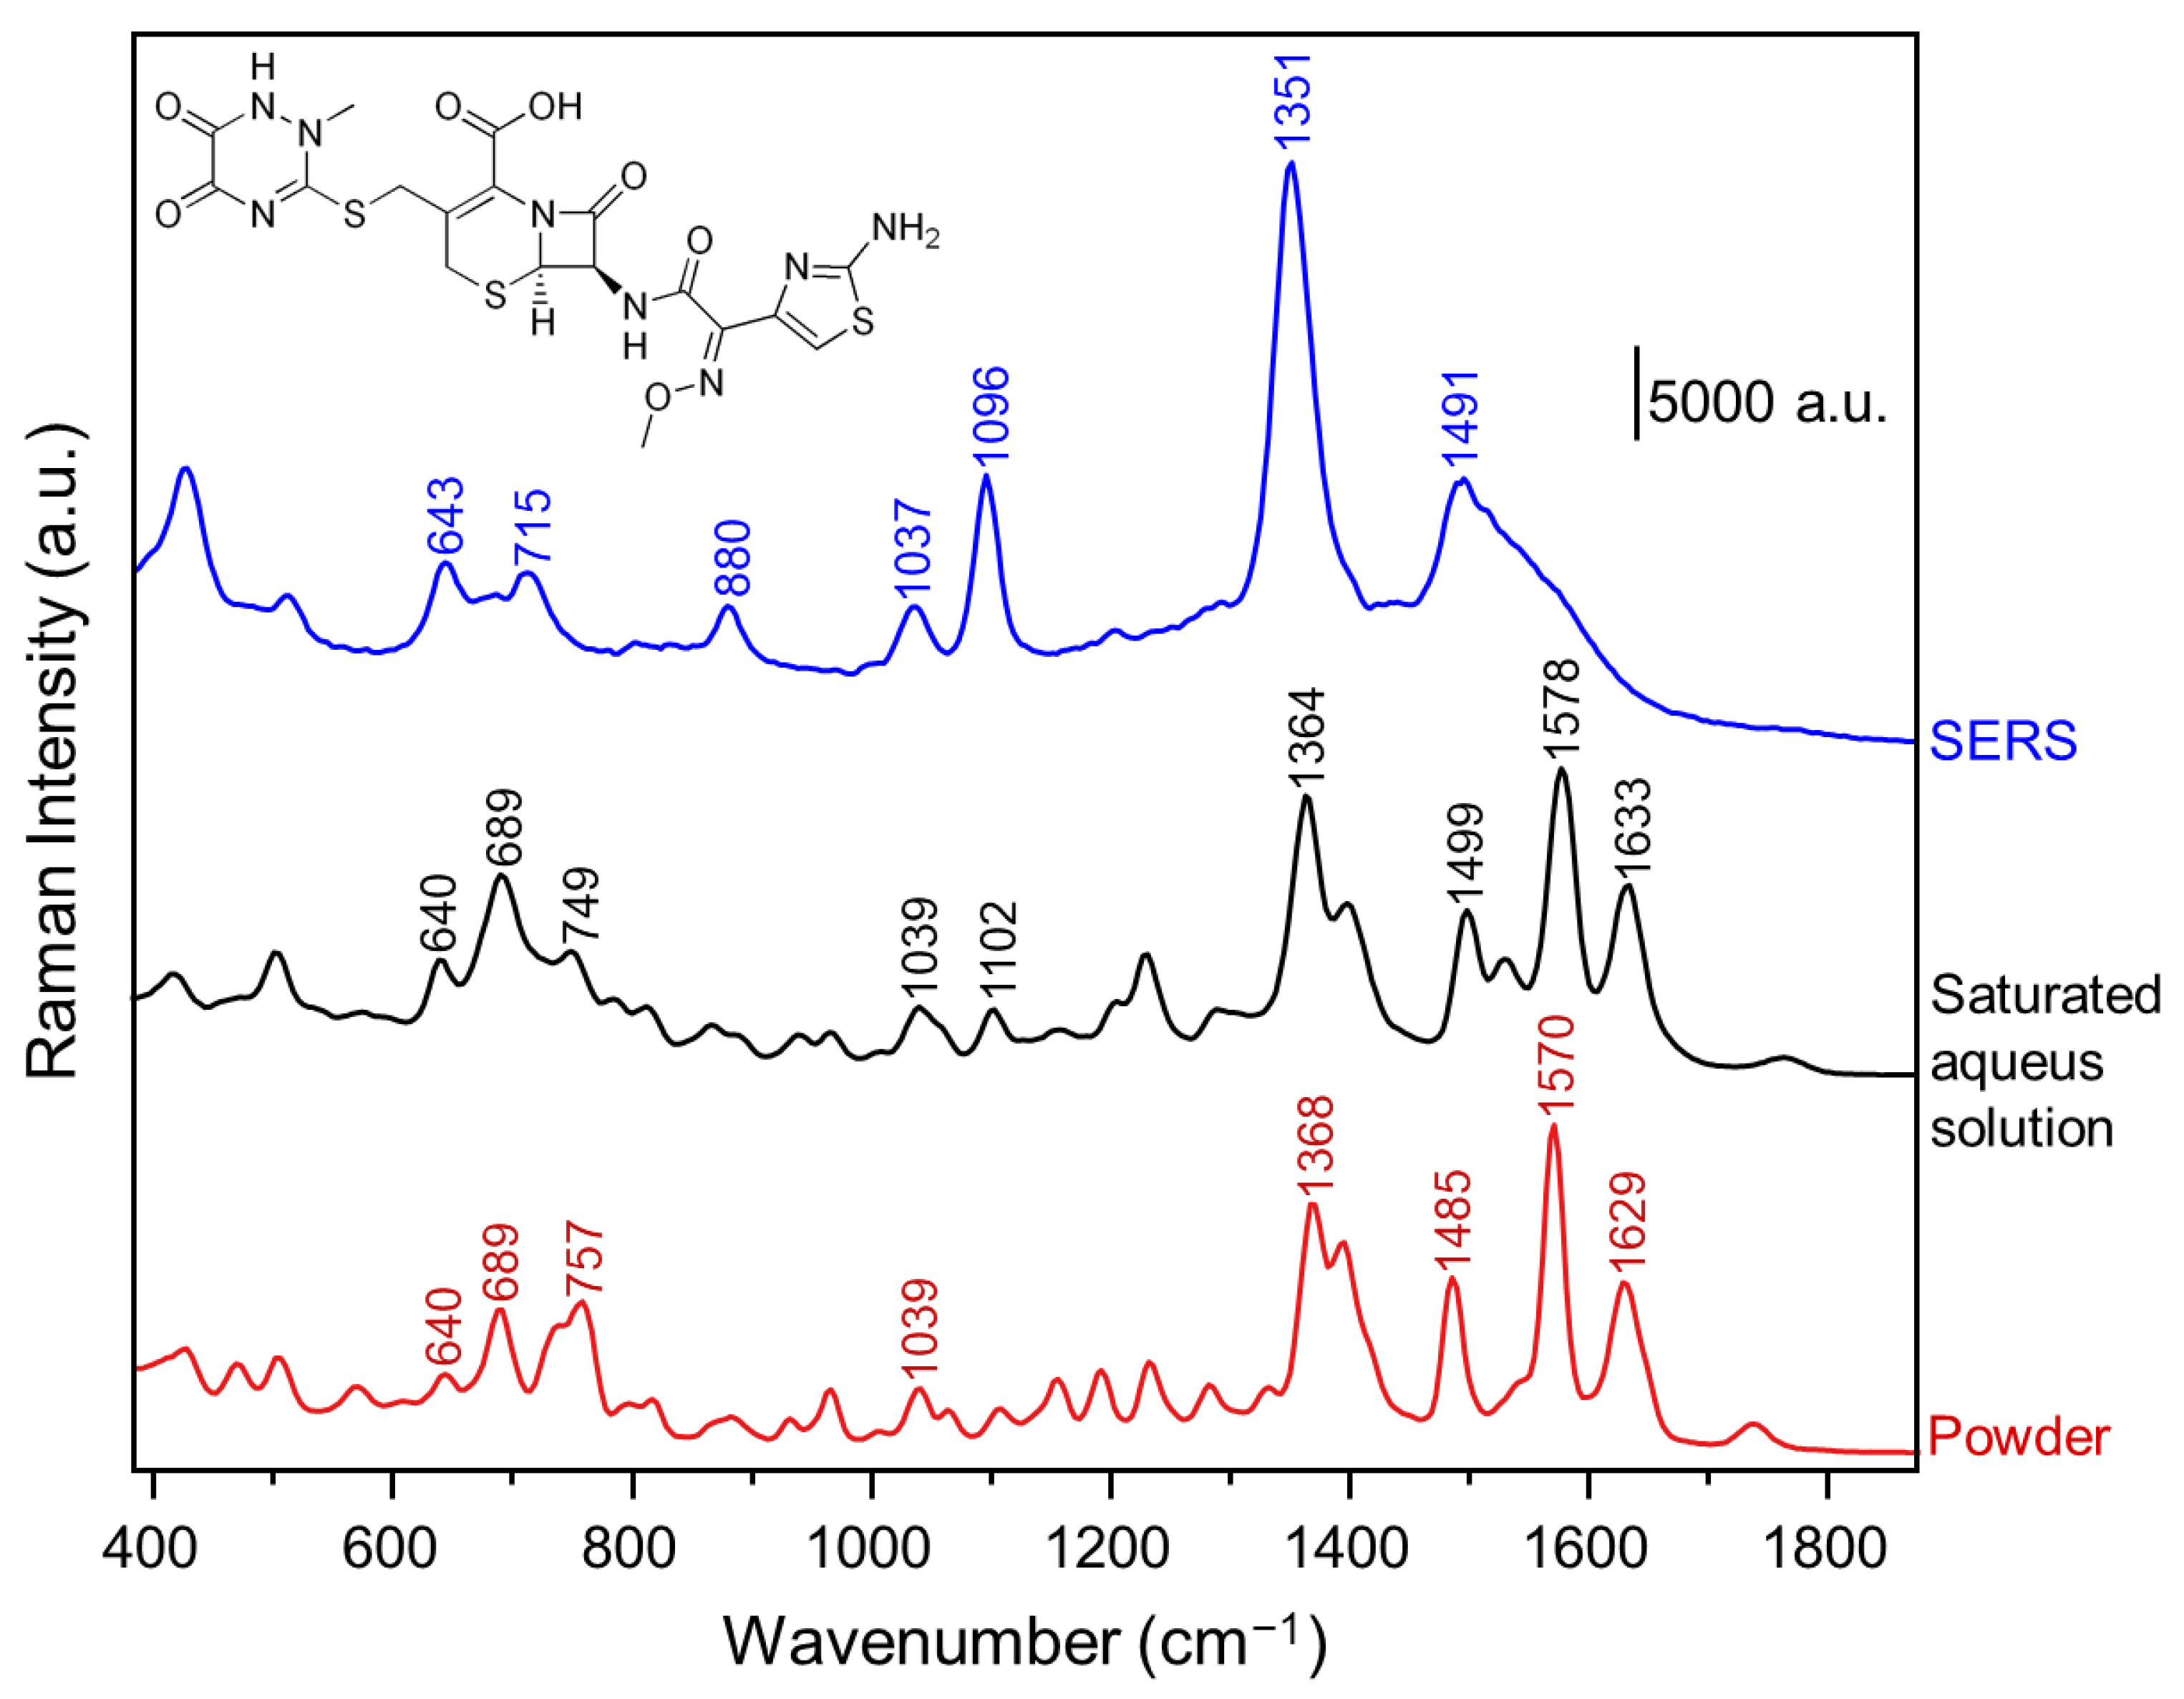
Figure 1. Raman spectra of ceftriaxone in powder form (red curve), saturated aqueous solution (black curve), and SERS spectra in aqueous media (blue curve).
Chemosensors 12 00213 g001
Figure 2. SERS spectra of ceftriaxone spiked in the blood plasma, in the concentration range: (a) 1 mg/mL to 0 μg/mL, (b) within the range 100 μg/mL to 0 μg/mL.
Chemosensors 12 00213 g002
Figure 3. Scheme for precipitated blood plasma sample preparation.
Chemosensors 12 00213 g003
Figure 4. SERS spectra of ceftriaxone spiked in the precipitated blood plasma, in the concentration range: (a) 1 mg/mL to 0 μg/mL, (b) within the range 100 μg/mL to 0 μg/mL.
Chemosensors 12 00213 g004
Figure 5. PLS-DA classification model test for ceftriaxone detection in: (a) blood plasma, and (b) precipitated blood plasma. The results demonstrate that ceftriaxone can be detected in blood plasma starting from 50 μg/mL, while in precipitated blood plasma, it can be detected already at 20 μg/mL.
Chemosensors 12 00213 g005
Figure 6. Background SERS spectra of blood plasma (red curve) and precipitated blood plasma (black curve).
Chemosensors 12 00213 g006
Table 1. An overview of the reported SERS-based ceftriaxone detection.
SERS SubstrateMatrixLowest Detected
Concentration (LOD)
Detection RangeReference
AgNPsurine0.4 μg mL−15–500 μg mL−1[18]
SERS optical fiberwater1 μM (0.5 μg mL−1)10–10,000 μM[51]
CuNPurine7.5 μg mL−150–500 μg mL−1[35]
AgNPsurine92 μg mL−1100–500 μg mL−1[33]
Ag@SiNWsBlood plasma94 μM (52 μg mL−1)1–1000 μM[50]
Ag@SiNWsMicrodialysate1.4 μM (0.8 μg mL−1)2.5–1000 μM[50]
Commercial substrate (Silmeco)Blood plasma20 μg mL−110–1000 μg mL−1This work
Table 2. SERS band assignment for blood plasma.
SERS Band Positions (cm−1)Assignments
493L-Arginine [24,45]
633Uric Acid [22,24]
722Hypoxanthine or Adenine [24,45]
808L-serine, Glutathione [45]
881Uric Acid [22,24]
1004Phenylalanine, Hypoxanthine [22,44]
1132Uric Acid [22,24]
1202L-tryptophan, Phenylalanine [45]
1250Amide Ⅲ [22]
1365Adenine [24]
1405CH2 deformation, phospholipids [22,24,45]
1612Uric acid [22]
1663Amide Ⅰ [22,24]
Disclaimer/Publisher’s Note: The statements, opinions and data contained in all publications are solely those of the individual author(s) and contributor(s) and not of MDPI and/or the editor(s). MDPI and/or the editor(s) disclaim responsibility for any injury to people or property resulting from any ideas, methods, instructions or products referred to in the content.