Vibrational Analysis and Concentration Dependent SERS Study of Cefoperazone


Abstract
1. Introduction
2. Materials and Methods
2.1. Materials
2.2. Synthesis of Ag Nanoparticles
2.3. Synthesis of Au Nanoparticles
2.4. Fourier Transform Infrared Spectroscopy Measurements
2.5. Raman Spectroscopy and SERS Measurements
2.6. Computational Details
3. Results and Discussion
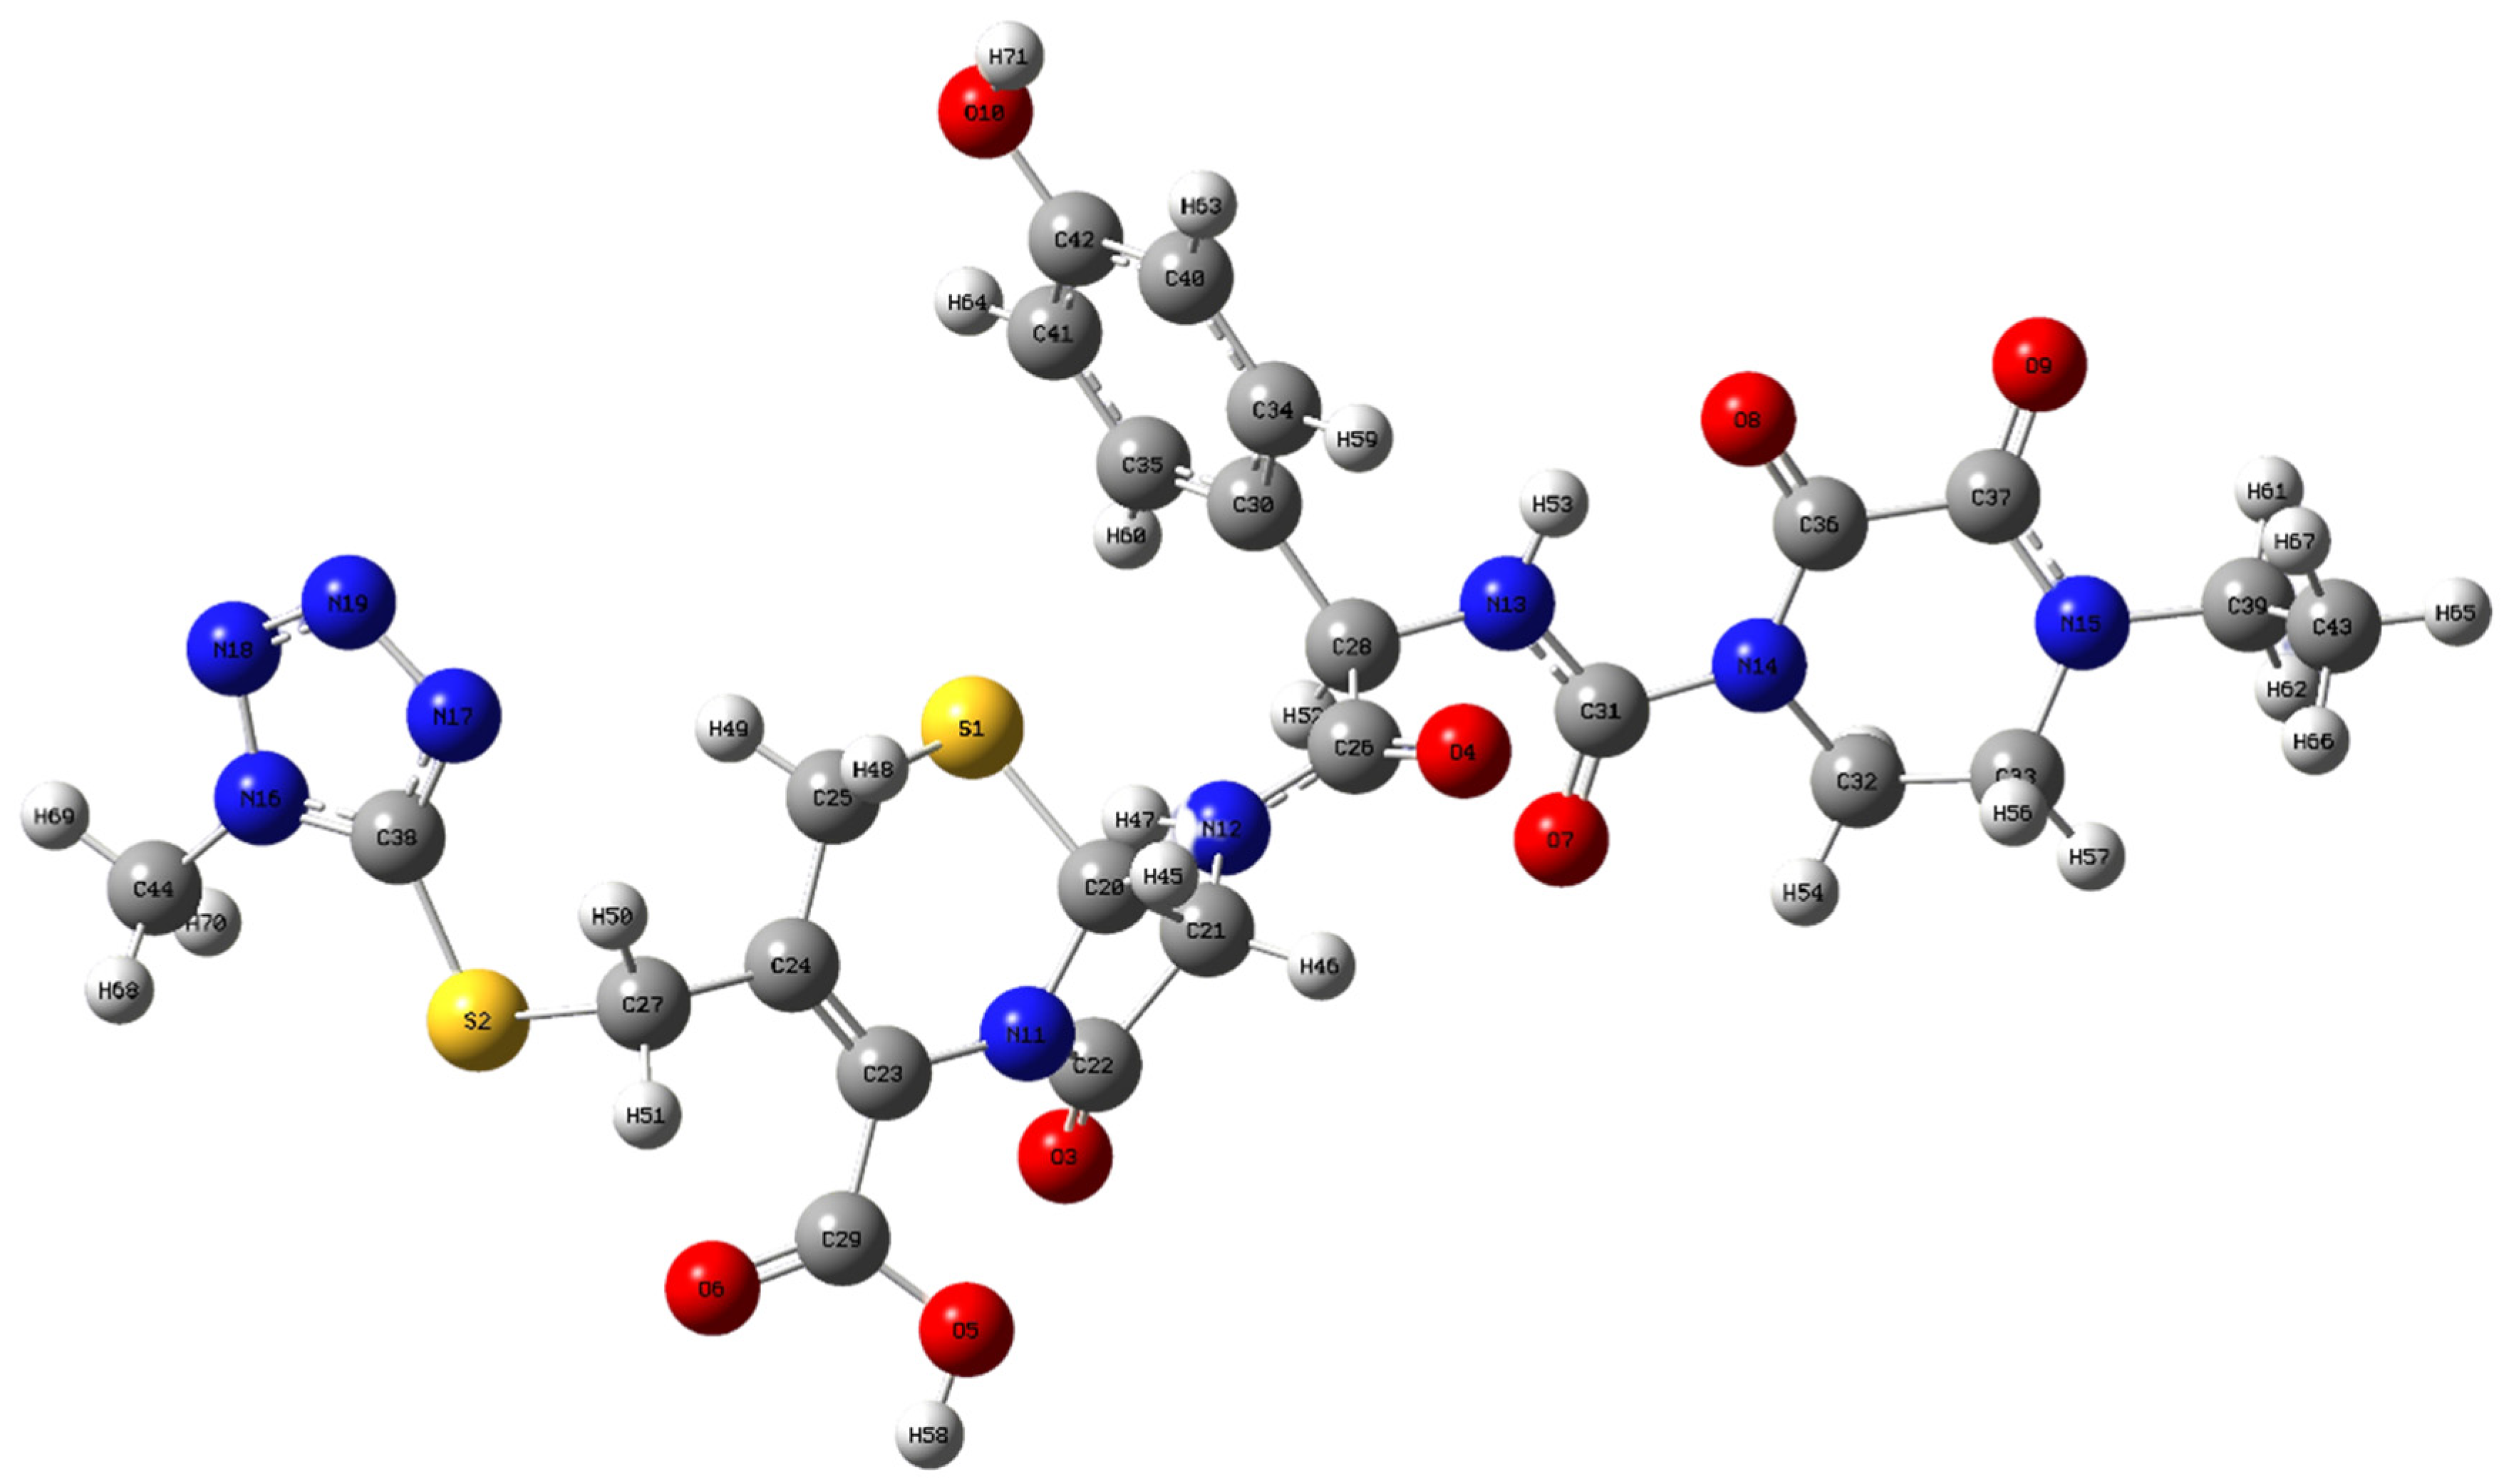
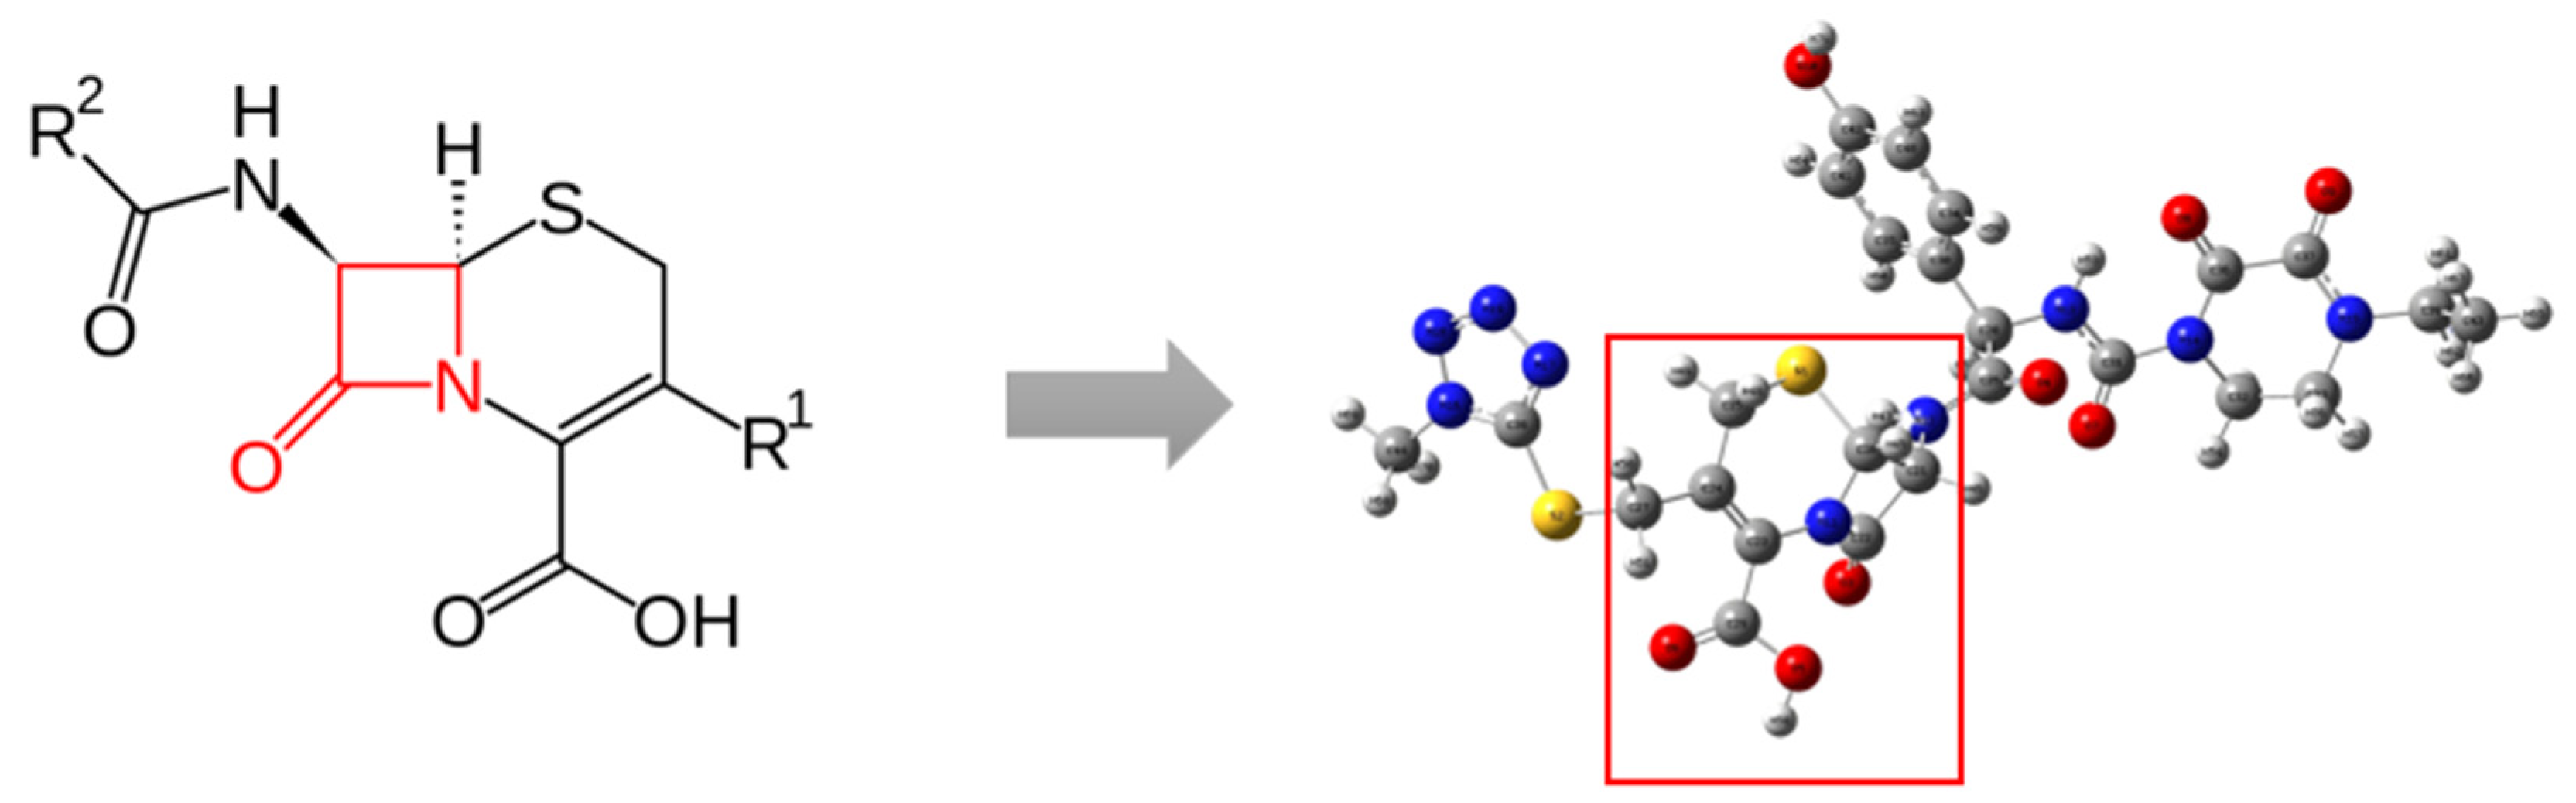
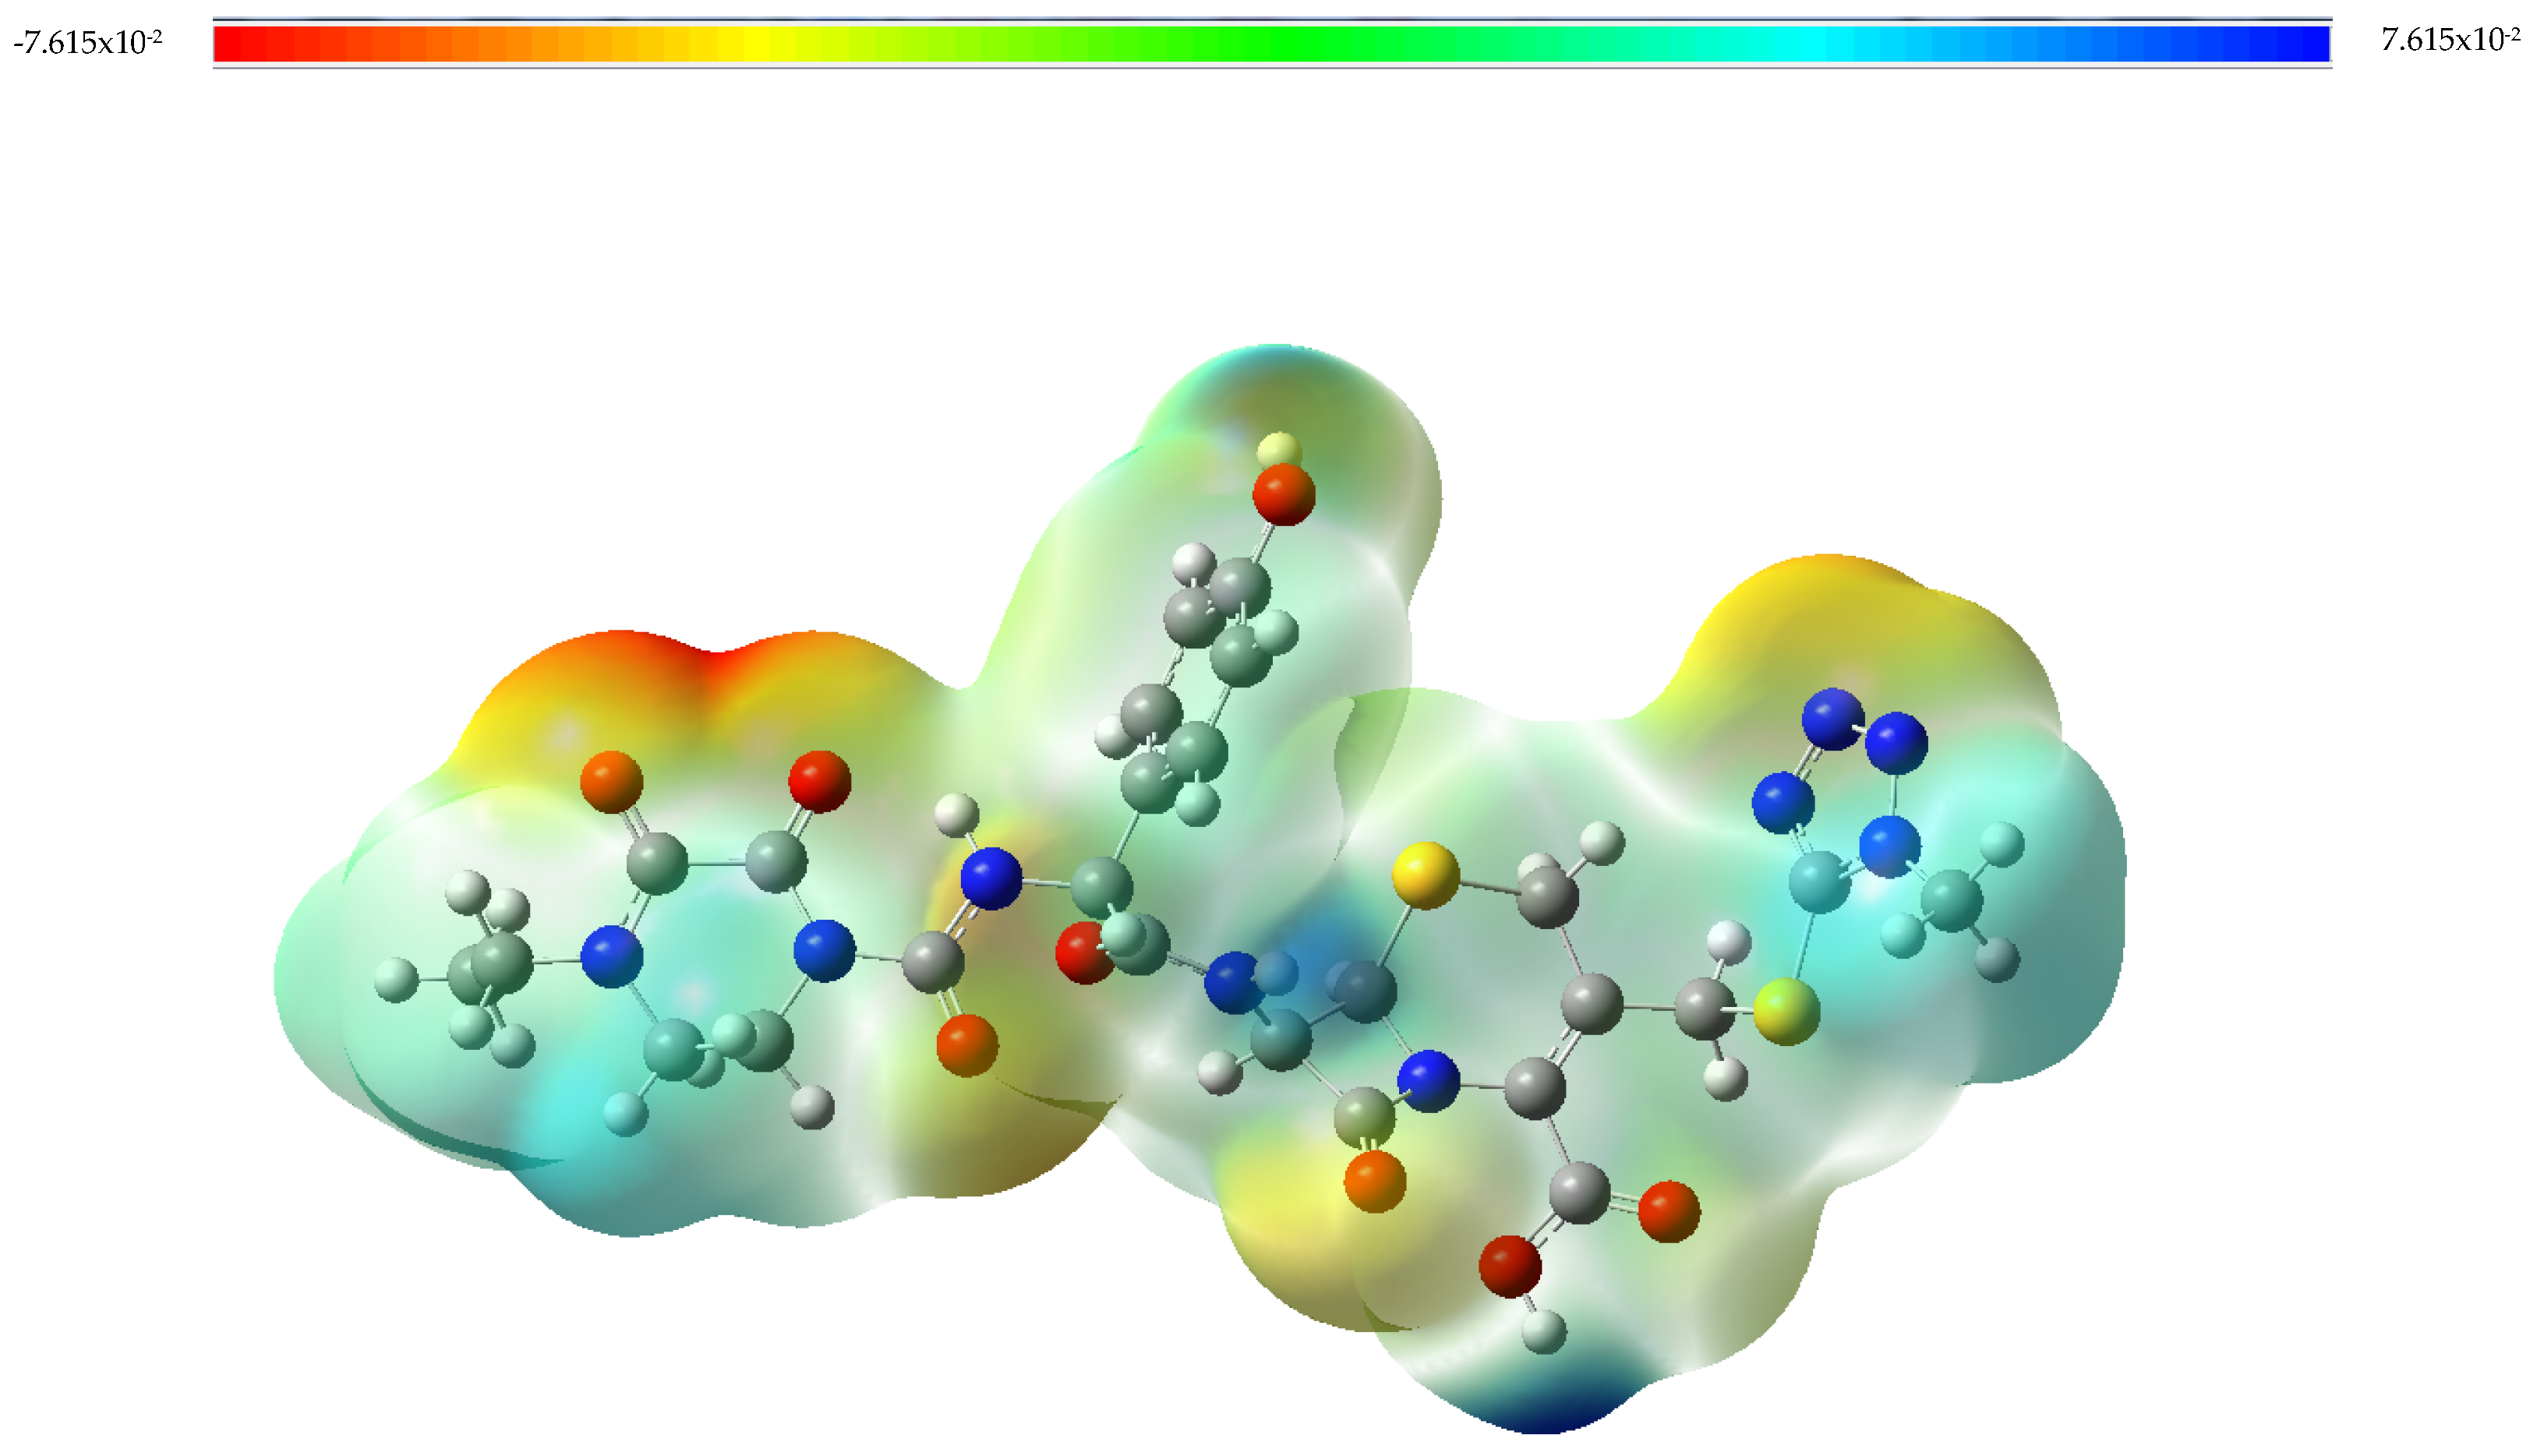
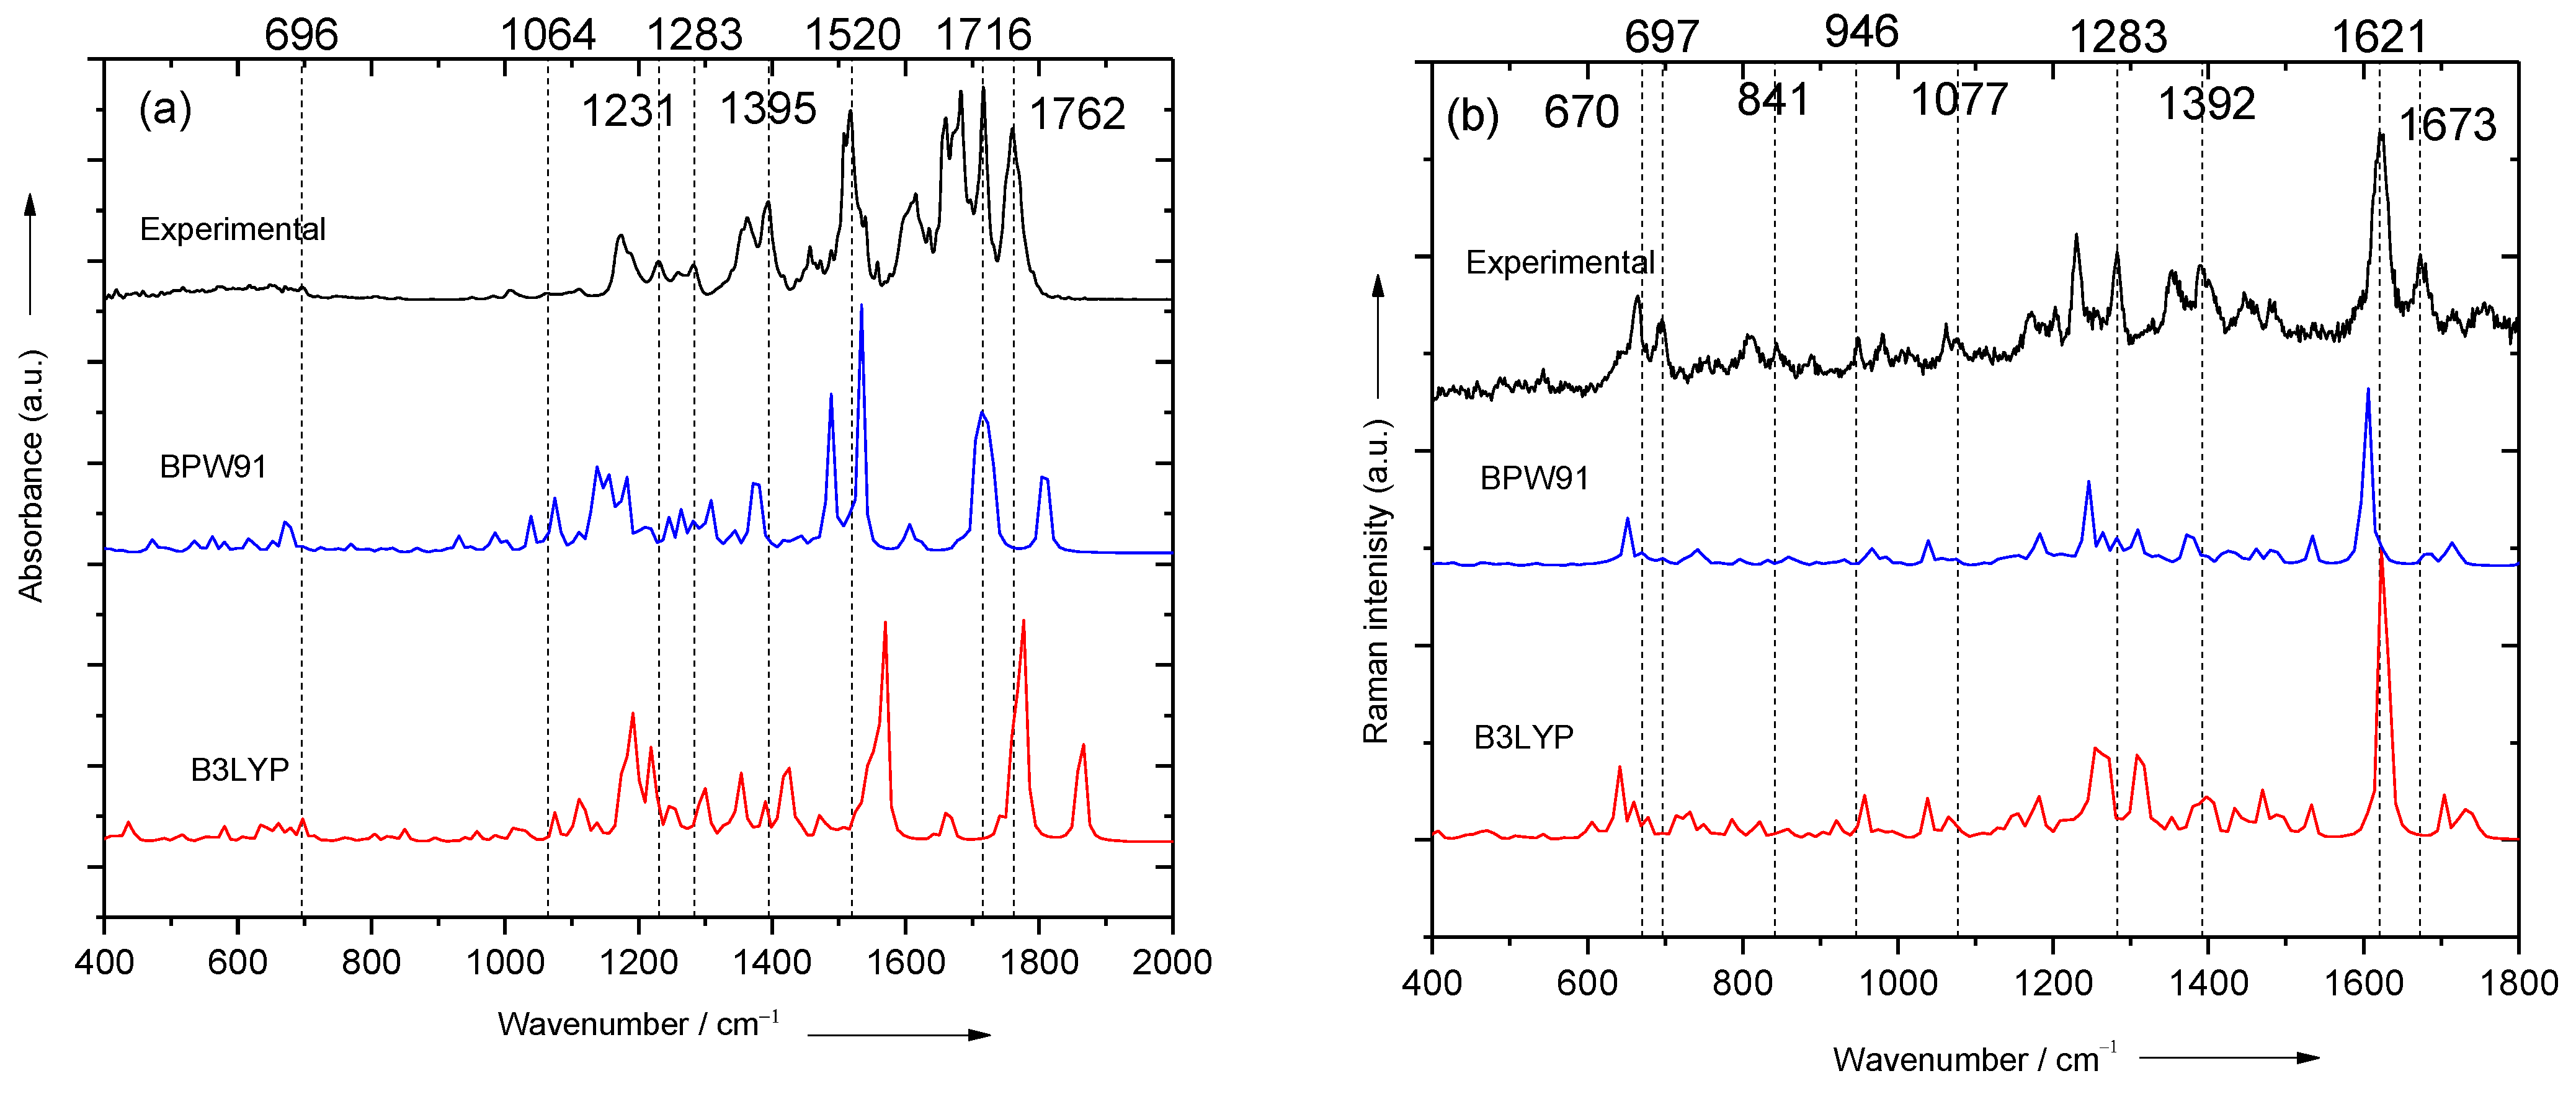
3.1. Vibrational Analysis
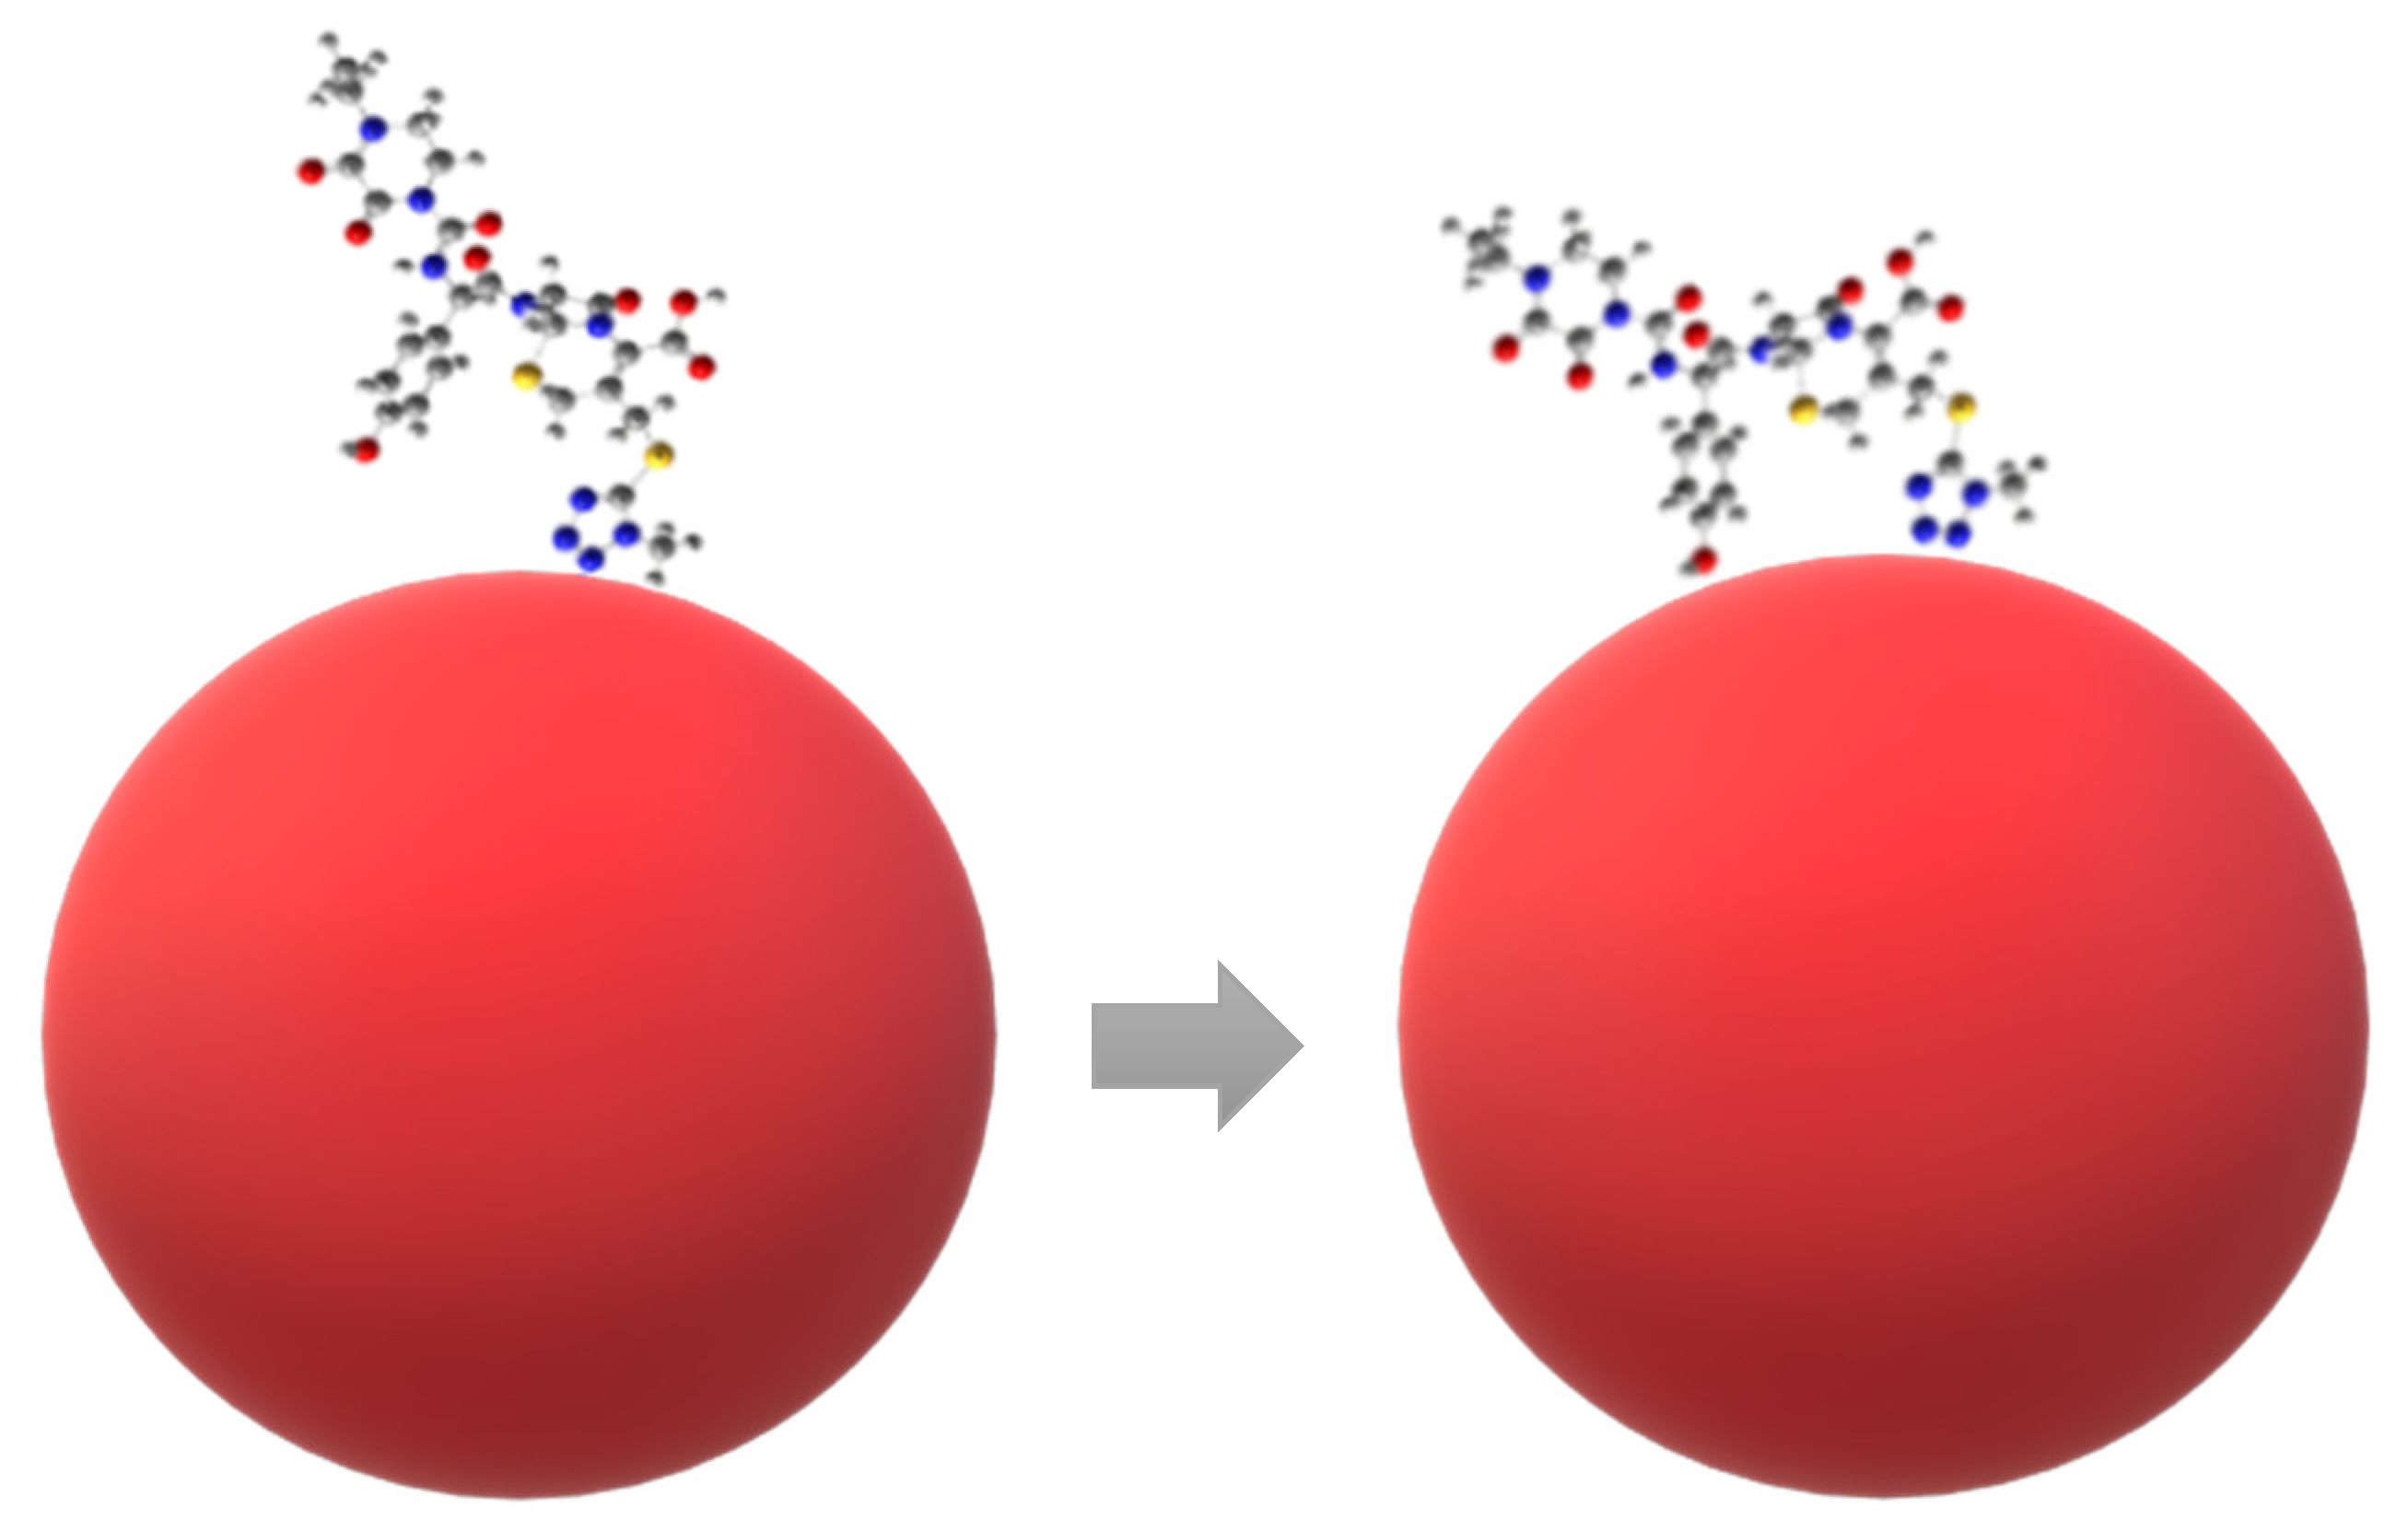
3.2. Adsorption of Cefoperazone on Gold and Silver Colloidal Nanoparticle Surfaces
4. Conclusions
Supplementary Materials
Author Contributions
Funding
Institutional Review Board Statement
Informed Consent Statement
Data Availability Statement
Conflicts of Interest
References
- Jones, R.N.; Barry, A.L. Cefoperazone: A Review of Its Antimicrobial Spectrum, fJ-Lactamase Stability, Enzyme Inhibition, and Other in Vitro Characteristics. Rev. Infect. Dis. 1983, 5 (Suppl. S1), S108–S126. [Google Scholar] [CrossRef]
- Sader, H.S.; Caravalhes, C.G.; Streit, J.M.; Castanheira, M.; Flamm, R.K. Antimicrobial activity of cefoperazone-sulbactam tested against Gram-Negative organisms from Europe, Asia-Pacific, and Latin America. Int. J. Infect. Dis. 2020, 91, 32–37. [Google Scholar] [CrossRef]
- Lan, S.H.; Chao, C.M.; Chang, S.P.; Lu, L.C.; Lai, C.C. Clinical Efficacy and Safety of Cefoperazone-Sulbactam in Treatment of Intra-Abdominal Infections: A Systematic Review and Meta-Analysis. Surg. Infect. 2021, 22, 763–770. [Google Scholar] [CrossRef]
- Abdullah, F.E.; Mushtaq, A.; Irshad, M.; Rauf, H.; Afzal, N.; Rasheed, A. Current efficacy of antibiotics against Klebsiella isolates from urine samples—A multi-centric experience in Karachi. Pak. J. Pharm. Sci. 2013, 26, 11–15. [Google Scholar]
- Naga, N.G.; El-Badan, D.E.; Rateb, H.S.; Ghanem, K.M.; Shaaban, M.I. Quorum Sensing Inhibiting Activity of Cefoperazone and Its Metallic Derivatives on Pseudomonas aeruginosa. Front. Cell. Infect. Microbiol. 2021, 11, 716–789. [Google Scholar] [CrossRef]
- Gordon, A.J.; Phyfferoen, M. Cefoperazone Sodium in the Treatment of Serious Bacterial Infections in 2100 Adults and Children: Multicentered Trials in Europe, Latin America, and Australasia. Clin. Infect. Dis. 1983, 5 (Suppl. S1), S188–S199. [Google Scholar] [CrossRef]
- Giguere, S.; Prescott, J.F.; Dowling, P.M. Antimicrobial Therapy in Veterinary Medicine, 5th ed.; Wiley-Blackwell: Hoboken, NJ, USA, 2013; p. 154. ISBN 9780470963029. [Google Scholar]
- Rusu, E.A.; Magyari, K.; Baia, L.; Baia, M. Vibrational analysis of α-lipoic acid and its adsorption behavior study by SERS. J. Mol. Struct. 2022, 1248, 131501. [Google Scholar] [CrossRef]
- Chiş, M.; Bonifacio, A.; Sergo, V.; Căinap, C.; Chiş, V.; Baia, M. Experimental and Theoretical Investigations of the Chemotherapeutic Drug Capecitabine. J. Mol. Struct. 2022, 1250, 131577. [Google Scholar] [CrossRef]
- Ivashchenko, O.; Jurga-Stopa, J.; Coy, E.; Peplinska, B.; Pietralik, Z.; Jurga, S. Fourier transform infrared and Raman spectroscopy studies on magnetite/Ag/antibiotic nanocomposites. Appl. Surf. Sci. 2016, 364, 400–409. [Google Scholar] [CrossRef]
- Filgueiras, A.L.; Paschoal, D.; Dos Santos, H.F.; Sant’Ana, A.C. Adsorption study of antibiotics on silver nanoparticle surfaces by surface-enhanced Raman scattering spectroscopy. Spectrochim. Acta Part A Mol. Biomol. Spectrosc. 2015, 136, 979–985. [Google Scholar] [CrossRef]
- Balan, C.; Pop, L.-C.; Baia, M. IR, Raman and SERS analysis of amikacin combined with DFT-based calculations. Spectrochim. Acta Part A Mol. Biomol. Spectrosc. 2019, 214, 79–85. [Google Scholar] [CrossRef] [PubMed]
- Baia, M.; Astilean, S.; Iliescu, T. Raman and SERS Investigations of Pharmaceuticals; Springer: Berlin/Heidelberg, Germany, 2008; p. 214. ISBN 978-3-540-78282-7. [Google Scholar] [CrossRef]
- Vetrivelan, V.; Sakthivel, S.; Muthu, S.; Al-Saadi, A.A. Non-covalent interaction, adsorption characteristics and solvent effect of procainamide anti-arrhythmias drug on silver and gold loaded silica surfaces: SERS spectroscopy, density functional theory and molecular docking investigations. RSC Adv. 2023, 13, 9539–9554. [Google Scholar] [CrossRef]
- Al-Otaibi, J.S.; Sheena Mary, Y.; Shyma Mary, Y.; Krátký, M.; Vinsova, J.; Gamberini, M.C. DFT, TD-DFT and SERS analysis of a bioactive benzohydrazide’s adsorption in silver hydrosols at various concentrations. J. Mol. Liq. 2023, 373, 121243. [Google Scholar] [CrossRef]
- Muniz-Miranda, M.; Muniz-Miranda, F.; Menziani, M.C.; Pedone, A. Can DFT Calculations Provide Useful Information for SERS Applications? Molecules 2023, 28, 573. [Google Scholar] [CrossRef]
- Fornasaro, S.; Cialla-May, D.; Sergo, V.; Bonifacio, A. The Role of Surface Enhanced Raman Scattering for Therapeutic Drug Monitoring of Antimicrobial Agents. Chemosensors 2022, 10, 128. [Google Scholar] [CrossRef]
- Liu, C.; Weber, S.; Peng, R.; Wu, L.; Zhang, W.S.; Luppa, P.B.; Popp, J.; Cialla-May, D. Toward SERS-based therapeutic drug monitoring in clinical settings: Recent developments and trends. TrAC Trends Anal. Chem. 2023, 164, 117094. [Google Scholar] [CrossRef]
- Villa, N.S.; Picarelli, C.; Iacoe, F.; Zanchi, C.G.; Ossi, P.M.; Lucotti, A.; Tommasini, M. Investigating Perampanel Antiepileptic Drug by DFT Calculations and SERS with Custom Spinning Cell. Molecules 2023, 28, 5968. [Google Scholar] [CrossRef]
- Brasil, M.L.; Filgueiras, A.L.; Barros-Pinkelnig, M.; Neves, M.L.; Eugenio, M.; Sena, L.A.; Sant’Anna, C.B.; Silva, V.; Diniz, C.G.; Sant’Ana, A.C. Synergism in the Antibacterial Action of Ternary Mixtures Involving Silver Nanoparticles, Chitosan and Antibiotics. J. Braz. Chem. Soc. 2019, 29, 2026–2033. [Google Scholar] [CrossRef]
- Vo, K.Q.; Tran, M.V.; Nguyen, T.A.; Cao, A.-T.T.; Vu, S.V.; Tran, K.N.; Si, N.T.; Pham, V.-N. Controlled synthesis of spinous gold nanoparticles and their use for surface-enhanced Raman scattering (SERS) detection of the antibiotic sulfathiazole. New J. Chem. 2023, 47, 6833–6843. [Google Scholar] [CrossRef]
- Kha, T.N.; Si, N.T.; Tran, V.M.; Vo, K.Q.; Nguyen, M.T.; Nhat, P.V. Binding Mechanism and Surface-Enhanced Raman Scattering of the Antimicrobial Sulfathiazole on Gold Nanoparticles. ACS Omega 2023, 8, 43442–43453. [Google Scholar] [CrossRef]
- Zhang, M.-A.; Zhou, Z.-M.; Xu, J.; Wang, W.-L.; Pu, S.-H.; Hu, W.-Y.; Luo, P.; Tian, Z.-Q.; Gong, Z.-B.; Liu, G.-K. Qualitative analysis of trace quinolone antibiotics by SERS with fine structure dependent sensitivity. Spectrochim. Acta Part A Mol. Biomol. Spectrosc. 2022, 278, 121365. [Google Scholar] [CrossRef] [PubMed]
- Liu, C.; Müller-Bötticher, L.; Liu, C.; Popp, J.; Fischer, D.; Cialla-May, D. Raman-based detection of ciprofloxacin and its degradation in pharmaceutical formulations. Talanta 2022, 250, 123719. [Google Scholar] [CrossRef] [PubMed]
- Miller, L.M.; Simmons, M.D.; Silver, C.D.; Krauss, T.F.; Thomas, G.H.; Johnson, S.D.; Duhme-Klair, A.-K. Antibiotic-functionalized gold nanoparticles for the detection of active β-lactamases. Nanoscale Adv. 2022, 4, 573–581. [Google Scholar] [CrossRef] [PubMed]
- Ali, H.R.H.; Ali, R.; Batakoushy, H.A.; Derayea, S.M. Solid-State FTIR Spectroscopic Study of Two Binary Mixtures: Cefepime-Metronidazole and Cefoperazone-Sulbactam. J. Spectrosc. 2017, 2017, 5673214. [Google Scholar] [CrossRef]
- Anacona, J.R.; Bravo, A.; Lopez, M.E. Cefoperazone metal complexes: Syn-thesis and characterization. J. Chil. Chem. Soc. 2013, 58, 1520–1523. [Google Scholar] [CrossRef][Green Version]
- Auda, S.H.; Mrestani, Y.; Fetouh, M.I.; Neubert, R.H.H. Characterization and activity of cephalosporin metal complexes. Die Pharm.-Int. J. Pharm. Sci. 2008, 63, 555–561. [Google Scholar]
- Markina, N.E.; Ustinov, S.N.; Zakharevich, A.M.; Markin, A.V. Copper nanoparticles for SERS-based determination of some cephalosporin antibiotics in spiked human urine. Anal. Chim. Acta 2020, 1138, 9–17. [Google Scholar] [CrossRef]
- Markina, N.E.; Markin, A.V. Application of Aluminum Hydroxide for Improvement of Label-Free SERS Detection of Some Cephalosporin Antibiotics in Urine. Biosensors 2019, 9, 91. [Google Scholar] [CrossRef]
- Han, Y.; Qian, J.; Zhang, J.; Hu, C.; Wang, C. Structure-toxicity relationship of cefoperazone and its impurities to developing zebrafish by transcriptome and Raman analysis. Toxicol. Appl. Pharmacol. 2017, 327, 39–51. [Google Scholar] [CrossRef]
- Lee, P.C.; Meisel, D. Adsorption and surface-enhanced Raman of dyes on silver and gold sols. J. Phys. Chem. 1982, 86, 3391–3395. [Google Scholar] [CrossRef]
- Turkevich, J.; Stevenson, P.C.; Hillier, J. The Formation of Colloidal Gold. J. Phys. Chem. 1953, 57, 670–673. [Google Scholar] [CrossRef]
- Frisch, M.J.; Trucks, G.W.; Schlegel, H.B.; Scuseria, G.E.; Robb, M.A.; Cheeseman, J.R.; Scalmani, G.; Barone, V.; Mennucci, B.; Petersson, G.A.; et al. “Gaussian 09”; Gaussian, Inc.: Wallingford, CT, USA, 2009. [Google Scholar]
- Dobson, J.F.; Vignale, G.; Das, M.P. (Eds.) Electronic Density Functional Theory; Springer: Boston, MA, USA, 1998; p. 81. [Google Scholar]
- Piela, L. Ideas of Quantum Chemistry, 3rd ed.; Elsevier: Berlin/Heidelberg, Germany, 2020; Volume 2, p. 220. [Google Scholar]
- Kim, S.Y.; Joo, T.H.; Suh, S.W.; Kim, M.Y.J. Surface-enhanced Raman scattering (SERS) of nucleic acid components in silver sol: Adenine series. Raman Spectrosc. 1986, 17, 381. [Google Scholar] [CrossRef]
- Chowdhury, J.; Ghosh, M.; Pal, M.; Misra, T.N. Concentration dependent surface enhanced resonance Raman scattering of a porphyrin derivative adsorbed on colloidal silver particles. J. Colloid Interface Sci. 2003, 263, 318–326. [Google Scholar] [CrossRef]
- Moskovits, M.; Suh, J.S. Surface geometry change in 2-naphthoic acid adsorbed on silver. J. Phys. Chem. 1988, 92, 6327–6329. [Google Scholar] [CrossRef]
- Pergolese, B.; Bigotto, A. Surface enhanced Raman spectroscopic studies of 1H- indazole on silver sols. Spectrochim. Acta 2001, 57, 1191–1197. [Google Scholar] [CrossRef]
- Sheena Mary, Y.; Shyma Mary, Y.; Krátký, M.; Vinsova, J.; Baraldi, C.; Gamberini, M.C. DFT, SERS-concentration and solvent dependent and docking studies of a bioactive benzenesulfonamide derivative. J. Mol. Struct. 2021, 1228, 129680. [Google Scholar] [CrossRef]
- Moskovits, M.; DiLella, D.P. Surface-enhanced Raman spectroscopy of benzene and benzene-d6 adsorbed on silver. J. Chem. Phys. 1980, 73, 6068–6075. [Google Scholar] [CrossRef]
- Gao, P.; Weaver, M.J. Surface-enhanced Raman spectroscopy as a probe of adsorbate surface bonding: Benzene and monosubstituted benzenes adsorbed at gold electrodes. J. Phys. Chem. 1985, 89, 5040–5046. [Google Scholar] [CrossRef]
- Creighton, J.A. Surface raman electromagnetic enhancement factors for molecules at the surface of small isolated metal spheres: The determination of adsorbate orientation from SERS relative intensities. Surf. Sci. 1983, 124, 209–219. [Google Scholar] [CrossRef]
- Chulhai, D.V.; Jensen, L. Determining Molecular Orientation with Surface-Enhanced Raman Scattering Using Inhomogenous Electric Fields. J. Phys. Chem. C 2013, 117, 19622–19631. [Google Scholar] [CrossRef]
- Moskovits, M. Surface selection rules. J. Chem. Phys. 1982, 77, 4408–4416. [Google Scholar] [CrossRef]
- Cialla, D.; März, A.; Böhme, R.; Theil, F.; Weber, K.; Schmitt, M.; Popp, J. Surface-enhanced Raman spectroscopy (SERS): Progress and trends. Anal. Bioanal. Chem. 2012, 403, 27–54. [Google Scholar] [CrossRef]
- Thomas, S.; Biswas, N.; Venkateswaran, S.; Kapoor, S.; Naumov, S.; Mukherjee, T. Studies on Adsorption of 5-Amino Tetrazole on Silver Nanoparticles by SERS and DFT Calculations. J. Phys. Chem. A 2005, 109, 9928–9934. [Google Scholar] [CrossRef] [PubMed]
- Saegmueller, B.; Freunscht, P.; Schneider, S. The assignment of the vibrations of substituted mercaptotetrazoles based on quantum chemical calculations. J. Mol. Struct. 1999, 482–483, 231–235. [Google Scholar] [CrossRef]
- Iliescu, T.; Baia, M.; Pavel, I. Raman and SERS investigations of potassium benzylpenicillin. J. Raman Spectrosc. 2006, 37, 318–325. [Google Scholar] [CrossRef]


| Concentration (M) | Acquisition Time (s) | Laser Power (mW) | |
|---|---|---|---|
| Cefoperazone + colloidal AgNPs 532 nm | 10−2 | 5 | 2 |
| 10−3 | 3 | 2 | |
| 10−4 | 3 | 2 | |
| 10−5 | 5 | 2 | |
| 10−6 | 5 | 2 | |
| Cefoperazone + colloidal AuNPs 633 nm | 10−2 | 15 | 0.17 |
| 10−3 | 15 | 0.17 | |
| 10−4 | 5 | 0.17 | |
| 10−5 | 15 | 0.17 | |
| 10−6 | 10 | 0.17 |
| Experimental | Theoretical | Assignment | ||
|---|---|---|---|---|
| IR | Raman | B3LYP | BPW91 | |
| 212 | 207 | 200 | Out-of-plane deformation of C38N17N19N18N16 ring | |
| 457 | 445 | 428 | In-plane deformation of C38N17N19 N18N16 ring | |
| 664 | 677 | 647 | N18N19C38 twist + N16N18N19 twist | |
| 670 | 675 | 677 | 652 | C27S2 stretch |
| 696 | 697 | 791 | 691 | N19N17C38 twist + N17N19N18 twist |
| 810 | 833 | 818 | Wagging of H atoms from the aromatic ring | |
| 841 | 856 | 833 | C40C42C40 + C34C30C35 bending (breathing-like vibration of aromatic ring) | |
| 851 | 882 | 855 | H50C27H51 rock + H48C25H49 rock | |
| 946 | 988 | 946 | N18N16 str + C38N17N19 sym str | |
| 1008 | 1013 | 1032 | 1002 | C40C42C40 + C34C30C35 bending + C40H+C41H bending |
| 1064 | 1077 | 1063 | 1073 | N17N19N18 asym str |
| 1109 | 1170 1188 | 1191 | 1108 | Twisting of H atoms from the aromatic ring |
| 1231 | 1230 | 1274 | 1232 | C33N15 str + C32N14 str |
| 1283 | 1283 | 1345 | 1280 | N18N19 str |
| 1362 | 1355 | 1390 | 1342 | H61C39H62 wag + H57C33H56 wag + H54C32H55 twist |
| 1388 | 1421 | 1379 | C23N11 str + C38N17 str + O5C29H58 scissoring | |
| 1395 | 1392 | 1395 | C38N16 str | |
| 1403 | 1471 | 1419 | C37N15 str + H56C32H57 wag | |
| 1447 | 1474 | 1435 | H50C27H51 scissoring + H48C25H49 scissoring | |
| 1456 | 1486 | 1480 | 1440 | Scissoring of H atoms of the benzene ring |
| 1485–1568 | 1446–1489 | Deformations of CN bonds | ||
| 1520 | 1547 | C26N12 str | ||
| 1540 | 1568 | 1533 | C31N13 str | |
| 1641 | 1595 | Asymmetric stretching of the aromatic ring | ||
| 1597 | 1663 | 1603 | C23=C24 str | |
| 1615 | 1621 | 1665 | 1619 | Symmetric stretching of the aromatic ring |
| 1683 | 1673 | 1726 | 1682 | C36O8 stretch |
| - | 1706 | C37O9 str | ||
| 1716 | 1712 | 1766 | 1712 | C26O4 str |
| 1719 | C29O6 str | |||
| 1727 | C31O7 str | |||
| 1762 | 1754 | 1863 | 1808 | C22O3 str |
| 3024–3215 | 2960–3150 | C-H str | ||
| 3317 | 3500 | 3336 | N13H53 str | |
| 3560 | 3605 | 3502 | N12H47 str | |
| 3588 | 3693 | 3582 | O5H58 str | |
| 3735 | 3750 | 3638 | O10H71 str | |
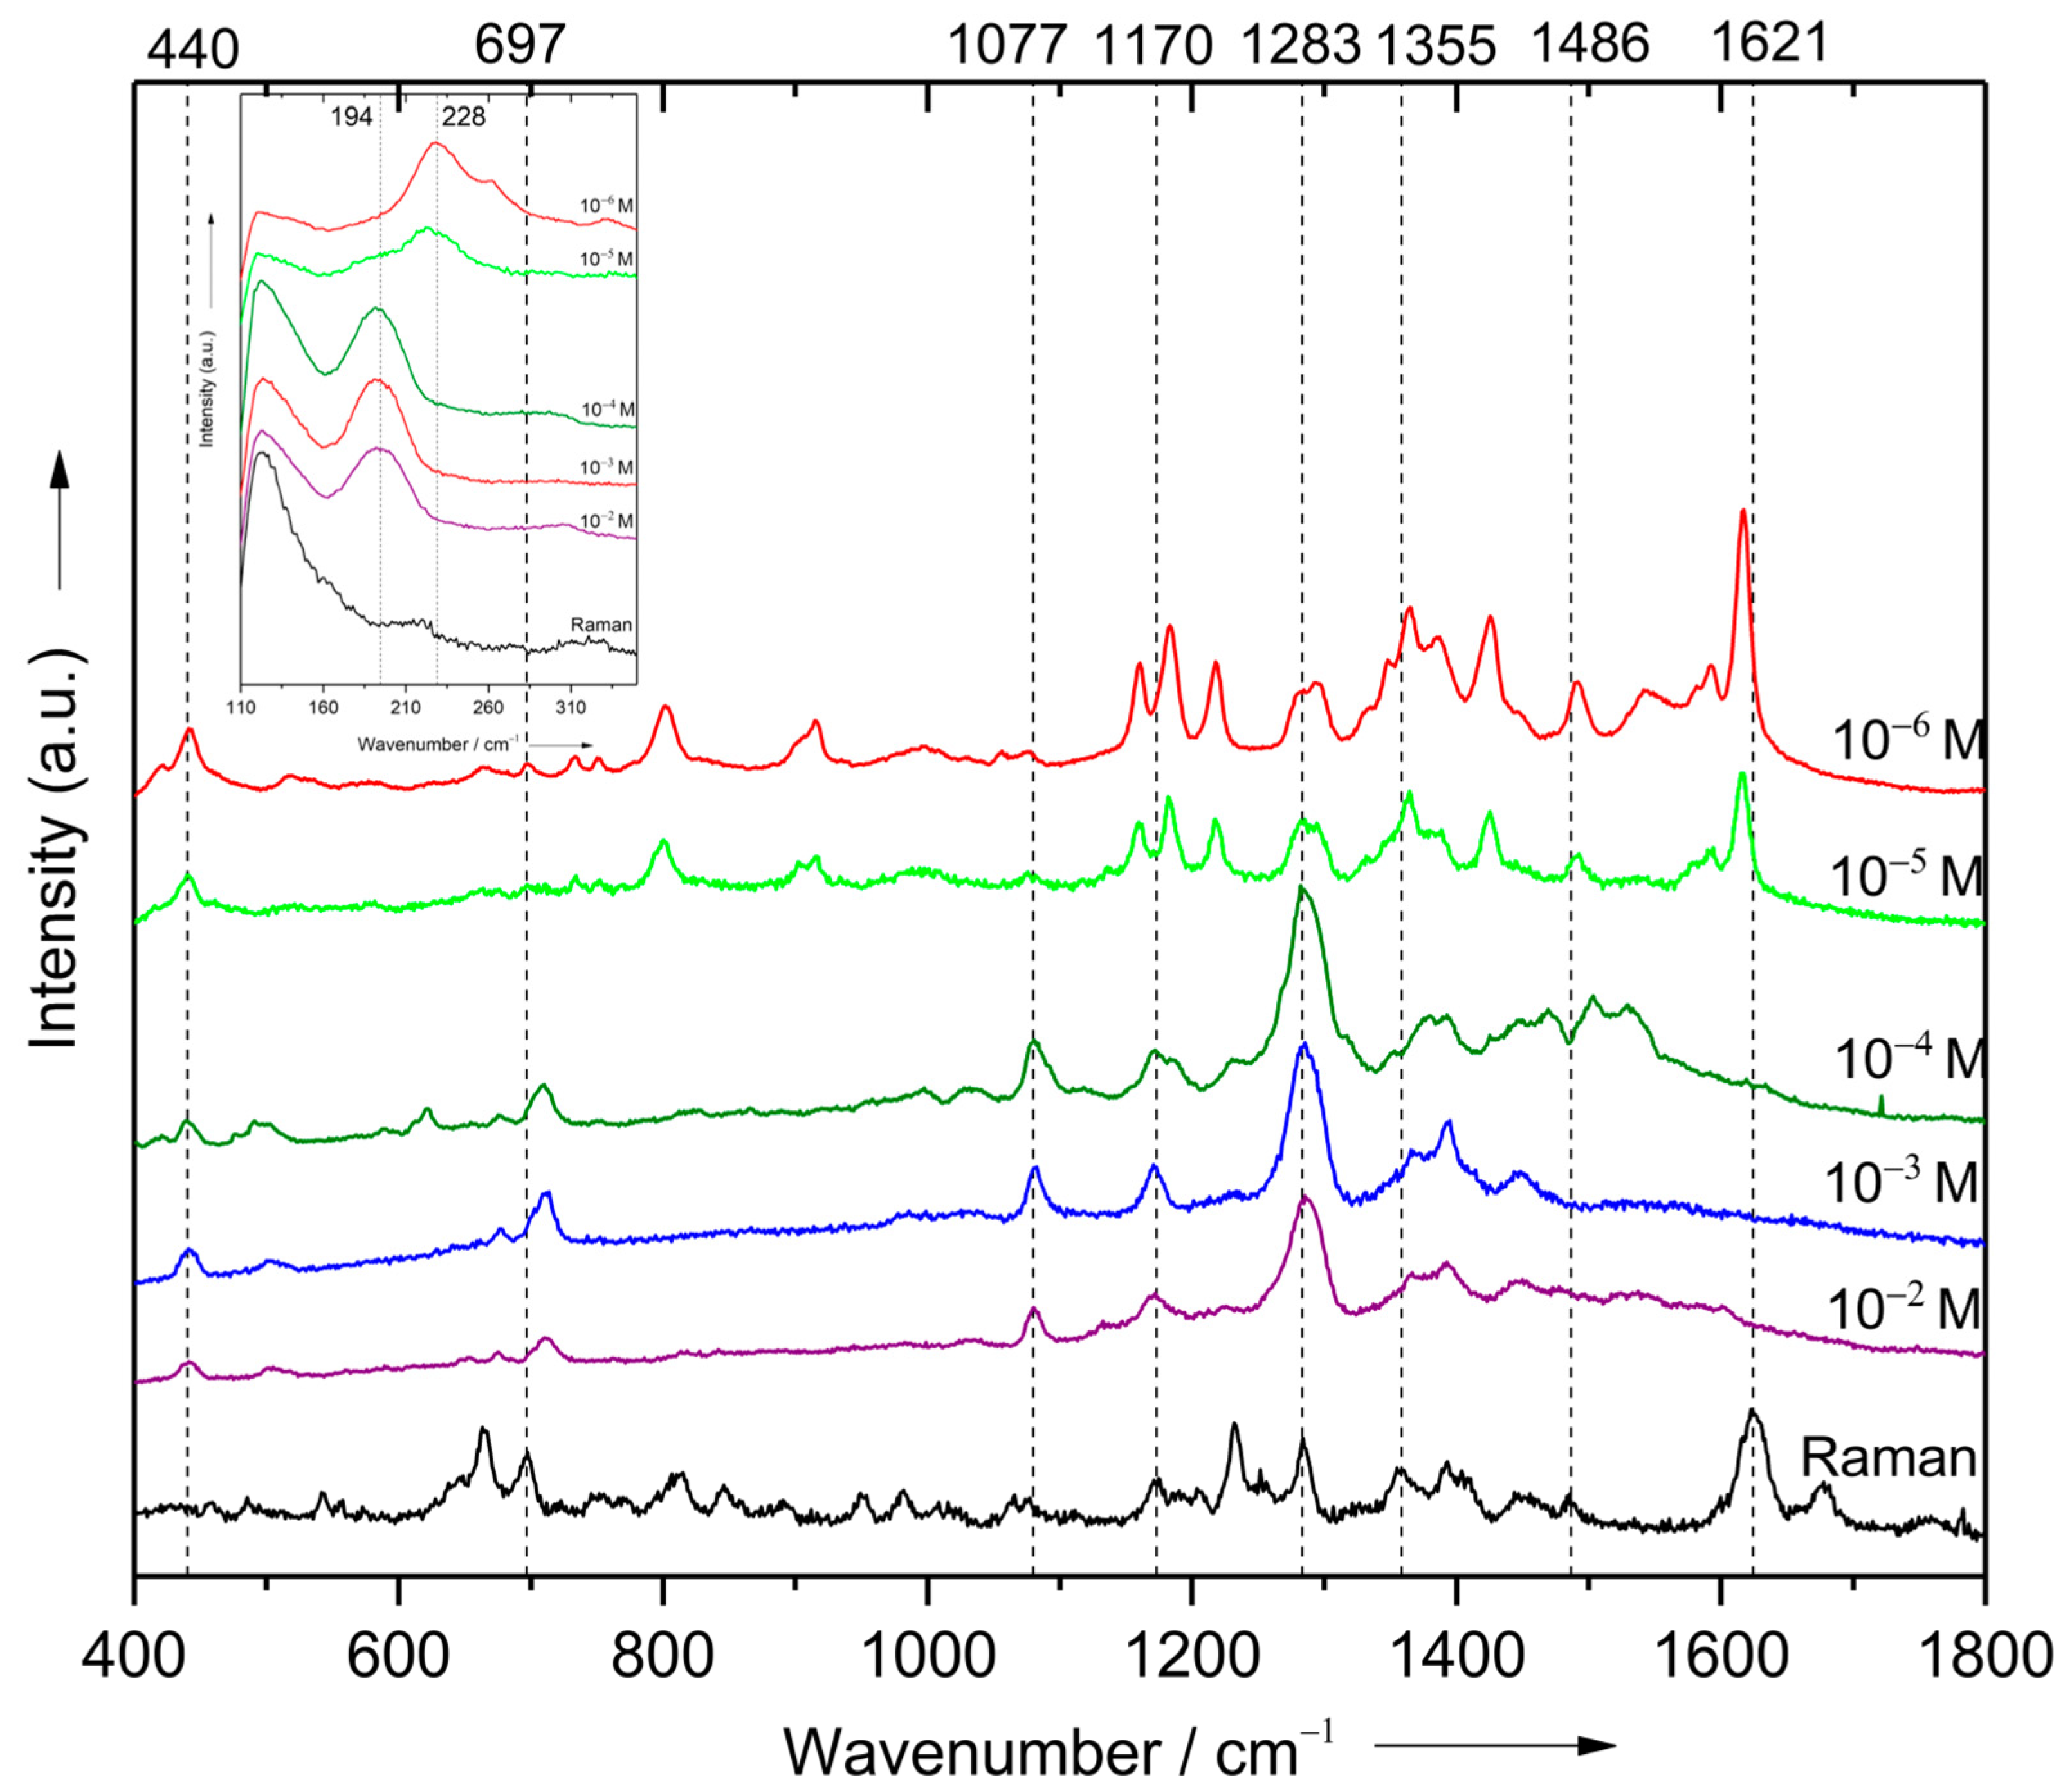
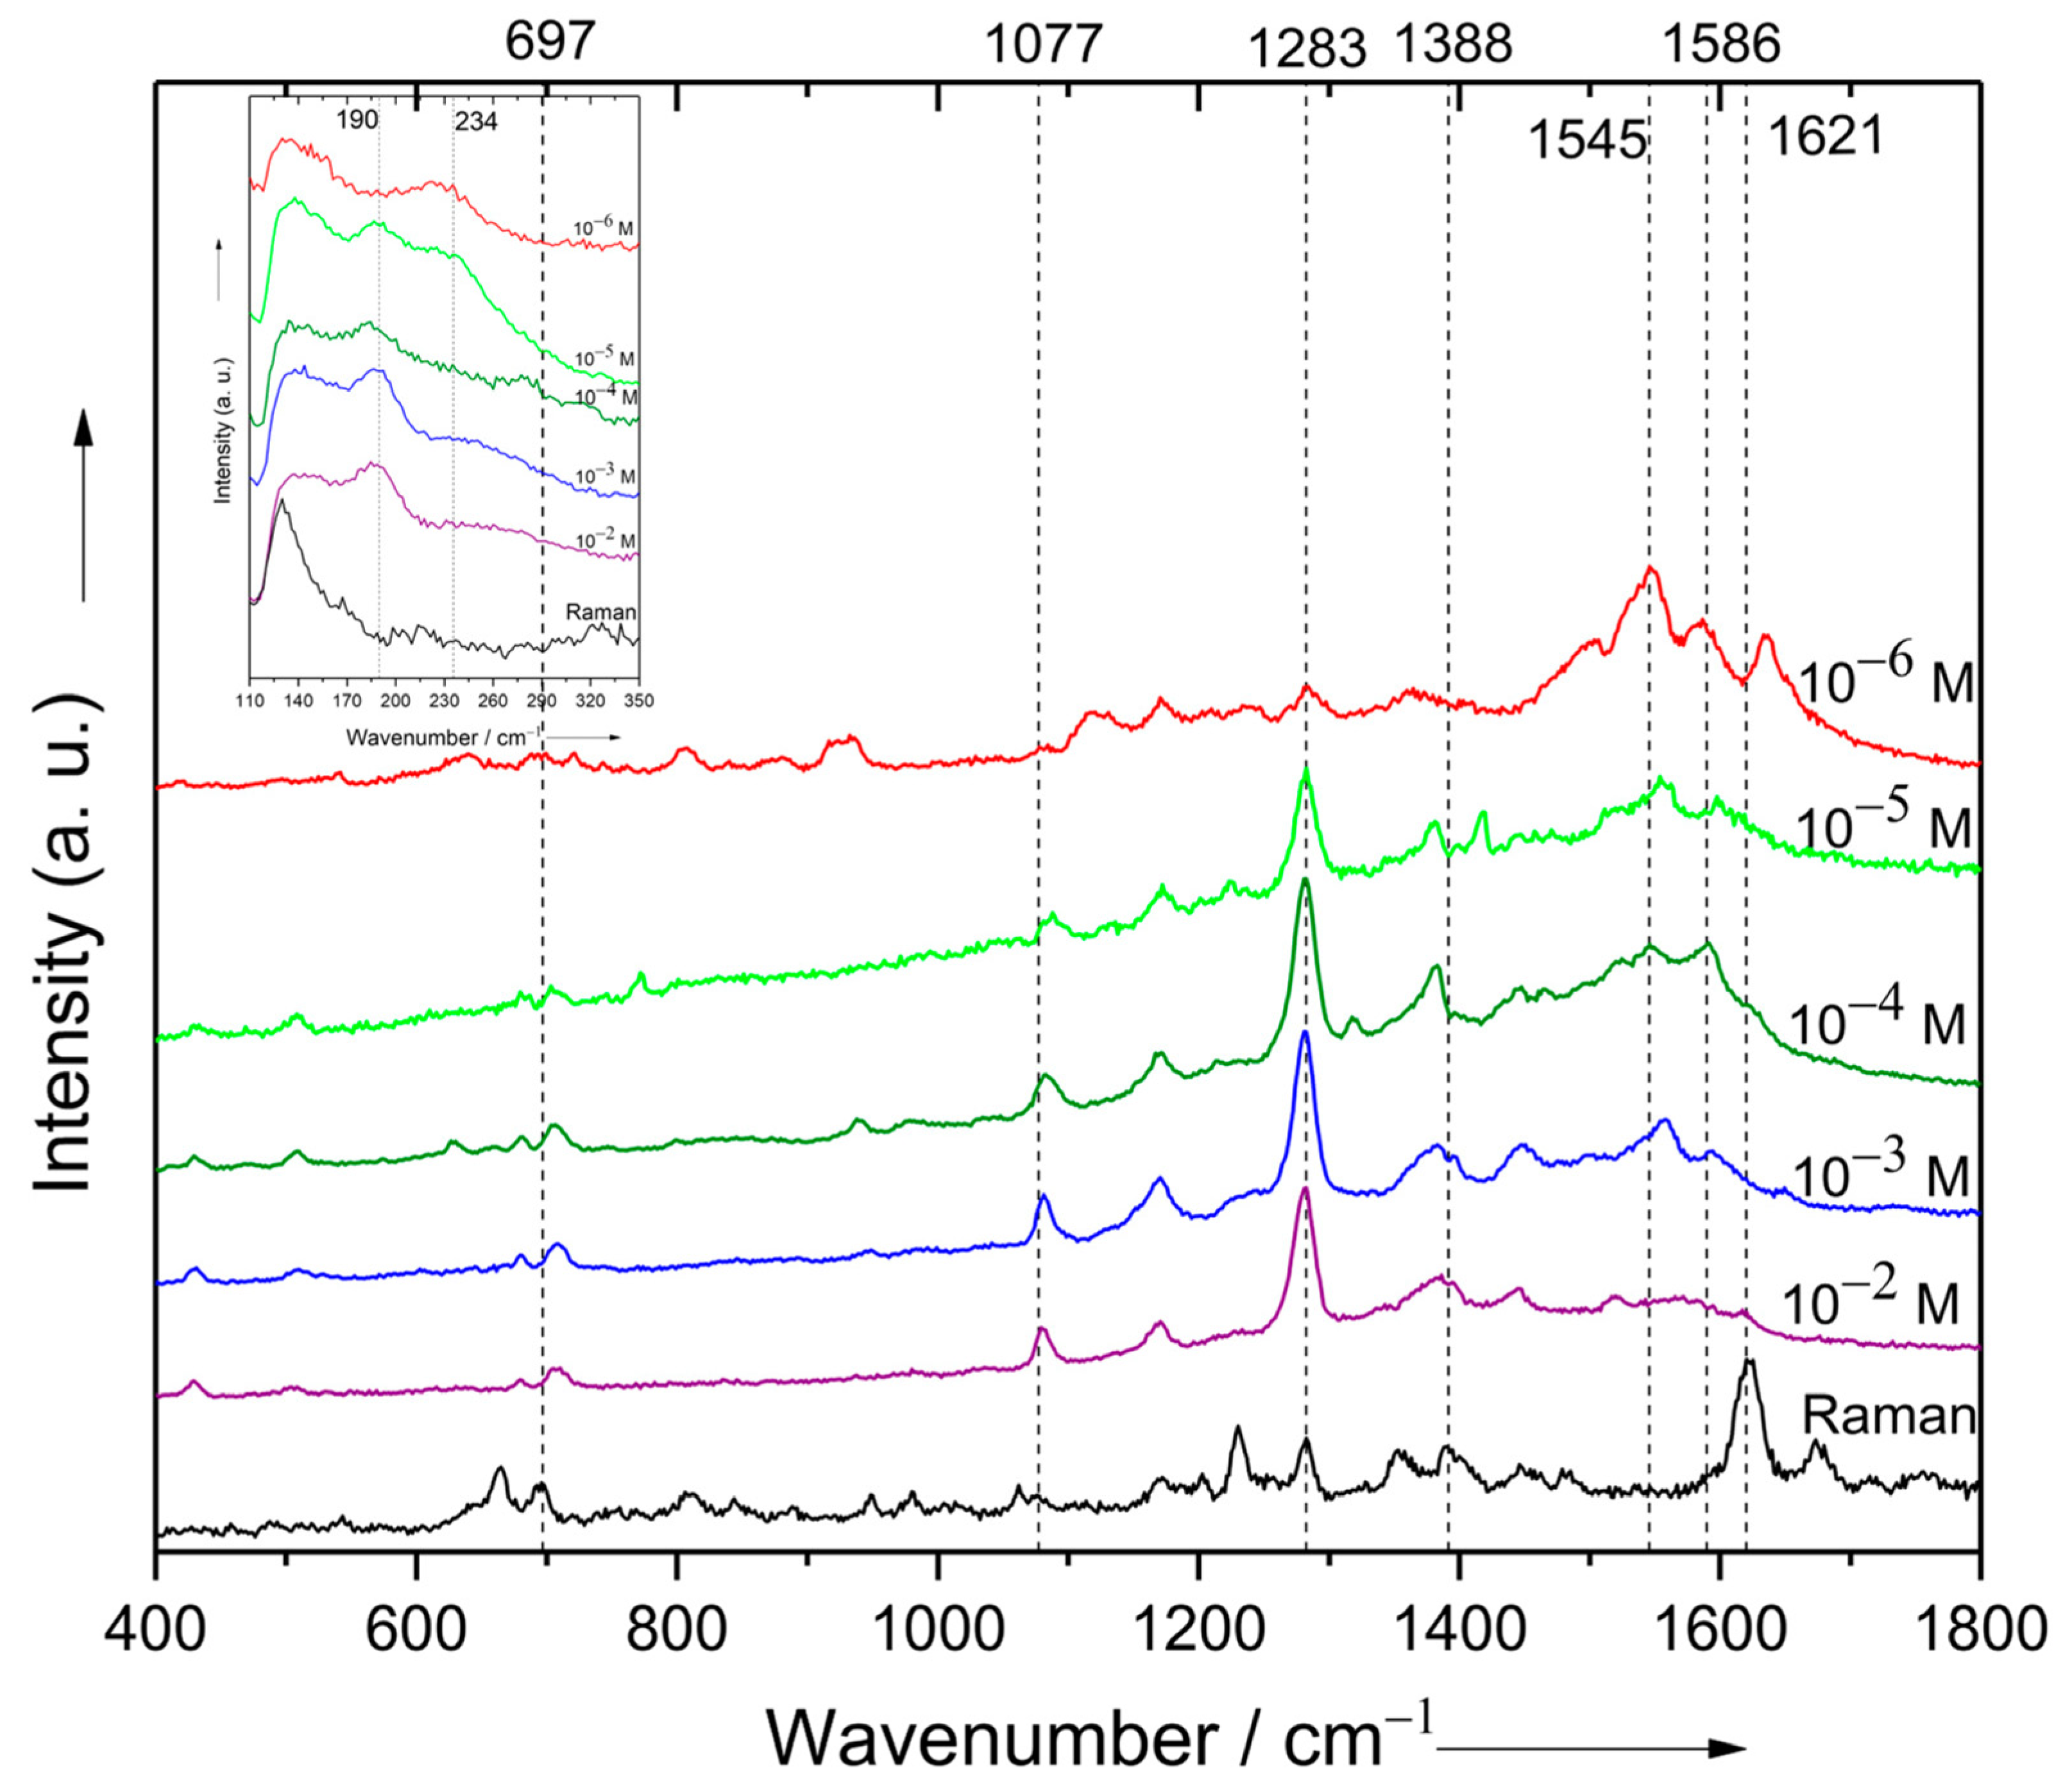
| Raman | SERS on AuNPs | SERS on AgNPs | |||
|---|---|---|---|---|---|
| Conc < 10−4 | Conc ≥ 10−4 | Conc < 10−5 | Conc ≥ 10−5 | ||
| 212 | 194 | 190 | Out-of-plane deformation of C38N17N19 N18N16 ring | ||
| 228 | 234 | Au/Ag-N vibration | |||
| 440 m | 440 w | 428 w | In-plane deformation of C38N17N19 N18N16 ring | ||
| 697 m | 706 m | 710 w | C38N19N18 twist + N17N19 N18 twist | ||
| 810 m | 803 m | 807 m | Wagging of H atoms from the aromatic ring | ||
| 946 w | 913 m | 916 m | N18N16 str + C38N17N19 sym str | ||
| 1077 w | 1080 m | 1082 m | N17N19N18 asym str | ||
| 1170 w 1188 w | 1160 s 1183 s | 1170 w | 1170 m | Twisting of H atoms from the aromatic ring | |
| 1283 s | 1283 m | 1283 s | 1284 w | 1284 s | N18N19 str |
| 1355 m | 1364 s | 1365 m | H61C39H62 wag + H57C33H56 wag + H54C32H55 twist | ||
| 1388 m | 1388 s | 1392 m | 1385 m | C23N11 str + C38N17 str + O5C29H58 scissoring | |
| 1447 w | 1425 s | 1448 m | 1447 m | C37N15 str + H56C32H57 wag | |
| 1486 w | 1491 m | Scissoring of H atoms of the benzene ring | |||
| 1541 m | 1545 s | C26N12 str | |||
| 1556 s | 1556 m | C31N13 str | |||
| 1593 m | 1586 s | Asymmetric stretching of the aromatic ring | |||
| 1621 s | 1619 s | 1633 s | Symmetric stretching of the aromatic ring | ||
Disclaimer/Publisher’s Note: The statements, opinions and data contained in all publications are solely those of the individual author(s) and contributor(s) and not of MDPI and/or the editor(s). MDPI and/or the editor(s) disclaim responsibility for any injury to people or property resulting from any ideas, methods, instructions or products referred to in the content. |
© 2024 by the authors. Licensee MDPI, Basel, Switzerland. This article is an open access article distributed under the terms and conditions of the Creative Commons Attribution (CC BY) license (https://creativecommons.org/licenses/by/4.0/).
Share and Cite
Faur, S.A.-M.; Tóth, Z.-R.; Magyari, K.; Baia, M. Vibrational Analysis and Concentration Dependent SERS Study of Cefoperazone. Chemosensors 2024, 12, 48. https://doi.org/10.3390/chemosensors12030048
Faur SA-M, Tóth Z-R, Magyari K, Baia M. Vibrational Analysis and Concentration Dependent SERS Study of Cefoperazone. Chemosensors. 2024; 12(3):48. https://doi.org/10.3390/chemosensors12030048
Chicago/Turabian StyleFaur, Stefana Ana-Maria, Zsejke-Réka Tóth, Klára Magyari, and Monica Baia. 2024. "Vibrational Analysis and Concentration Dependent SERS Study of Cefoperazone" Chemosensors 12, no. 3: 48. https://doi.org/10.3390/chemosensors12030048
APA StyleFaur, S. A.-M., Tóth, Z.-R., Magyari, K., & Baia, M. (2024). Vibrational Analysis and Concentration Dependent SERS Study of Cefoperazone. Chemosensors, 12(3), 48. https://doi.org/10.3390/chemosensors12030048