Article

Selective Colorimetric Detection of Pb(II) Ions by Using Green Synthesized Gold Nanoparticles with Orange Peel Extract

Chemistry Interdisciplinary Project (ChIP), School of Science and Technology, Chemistry Division, University of Camerino, 62032 Camerino, Italy
*
Authors to whom correspondence should be addressed.
Chemosensors 2024, 12(3), 33; https://doi.org/10.3390/chemosensors12030033
Submission received: 1 February 2024 / Revised: 20 February 2024 / Accepted: 22 February 2024 / Published: 24 February 2024
(This article belongs to the Section Analytical Methods, Instrumentation and Miniaturization)

Abstract

:
Gold nanoparticles (AuNPs) were prepared by using a green approach that employed orange (citrus sinensis) peel water extract (OPE) as a reducing agent. In this case, the organic compounds present in orange peel were able to reduce Au(III) to Au(0) and, at the same time, to act as a capping agent, functionalizing the surface of the AuNPs, stabilizing them in a water solution. This “green” approach valorizes orange peel waste as a resourceful material and makes the synthetic process of AuNPs more environmentally sustainable, safe, and economically feasible than the traditional methods. The obtained gold nanoparticles (AuNPs@OPE) were characterized by FT–IR, DLS, SEM analysis, and UV–Vis spectroscopy; the latter showed a characteristic surface plasmon resonance (SPR) band at 530 nm, typical of spherical gold nanoparticles. The AuNPs@OPE were then tested as colorimetric sensors for heavy metals in water, showing an affinity and selectivity toward Pb2+. In fact, in the presence of Pb2+, the added cation favors the aggregation process, and, in this case, nanoparticles form clusters due to the interactions between Pb2+ and the carboxyl/hydroxyl groups on the surface of the AuNPs@OPE, increasing the size of the nanostructure. This process is accompanied by a change in color of the AuNPs@OPE from pink to violet, with a formation of a second, new SPR band, at a higher wavelength, relative to the aggregate formation. The colorimetric assay was tested at different times with the addition of Pb2+ ions showing different LOD values of 13.31 µM and 0.05 µM after 15 min and 90 min, respectively. The proposed colorimetric assay was also tested for analyzing Pb2+ in drinking water samples demonstrating the reliability to use AuNPs@OPE with real samples.

1. Introduction

In recent years, considerable research has focused on the optimization of colorimetric sensors for the detection of pollutants, such as organic compounds and heavy metals [1]. Heavy metals are widely used in agriculture, industry, medicine, and other fields; because of this, they are dispersed into the atmosphere, water, and soil. They are among the most problematic water pollutants since they are difficult to remove, present non–biodegradability properties, and they have a tendency to bioaccumulate in living organisms, posing a threat to human health and the environment. Some of the most common heavy metals present in wastewater are copper (Cu), cadmium (Cd), zinc (Zn), lead (Pb), mercury (Hg), arsenic (As), chromium (Cr), and iron (Fe) [2]. Lead is a naturally occurring toxic metal as it composes 0.002% of the Earth’s crust, but its widespread use by humankind has resulted in extensive environmental pollution [3].
Lead is the second most toxic metal after mercury, and human exposure to Pb salts and oxides can cause severe health problems, such as high blood pressure, cardiovascular problems, kidney damage, and problems of brain development in children [4]. The detection and removal of lead from polluted water are important challenges to be faced to ensure human safety. Lead detection is usually performed by well–established techniques, such as atomic absorption/emission spectrometry (AAS/AES), inductive coupled plasma mass spectrometry (ICPMS), anodic sweep voltammetry (ASV), capillary electrophoresis (CE), and X-ray fluorescence spectroscopy (XFS), requiring expensive instruments and extensive sample preparation [5].
Nanoparticles are materials in the size range of 1–100, with special physical and chemical properties that make them useful for a wide range of applications, including chemical and biological sensing [6,7,8,9,10]; water purification [11]; environmental remediation [12,13]; drug delivery [14]; food processing, packaging, and preservation [15]; and more.
The use of metal nanoparticles (NPs), due to their easy synthesis, biocompatible nature, high specificity, surface functionalization, and optical characteristics for the sensing of hazardous heavy metals, has attracted a great deal of attention [16]. In particular, gold nanoparticles (AuNPs) attract considerable interest due to their unique properties and have been successfully applied to sensing in the fields of environmental monitoring, optics, catalysis, and imaging, as antimicrobial agents, and in biomedical devices [17,18]. AuNPs show low toxicity, good biocompatibility, and high stability and dispersibility, which make them applicable to many fields.
The traditional methods for the synthesis of AuNPs usually involve aggressive reducing agents, along with a capping agent and volatile organic solvents. These methods quickly generate well–defined and pure products, but they are also expensive and generate a lot of toxic waste. However, biological approaches that involve the use of plant extracts as the reducing and capping agent represent simple, rapid, eco–friendly, and cost–effective methods to obtain green and more sustainable AuNPs [19].
In this work, orange (citrus sinensis) peel extract was used as a reducing agent for the synthesis of AuNPs, and the method was optimized to find the most effective reagent ratio, temperature, and pH conditions.
Orange peel is one of the many waste products of the agri–food industry. The total global production of orange fruits is estimated to be 76.29 million tons per year, of which about 40–50% is the peel, discarded as waste [20]. Citrus peel is rich in organic acids (citric, ascorbic, and malic acids), phenolic acids (caffeic acid, ferulic acid, p–coumaric acid, gallic acid, and chlorogenic acid), and flavonoids (hesperidin, hesperidin, rutin, naringenin, narirutin, nobiletin, and tangeritin). These natural compounds can act as reducing agents and stabilizers in the synthesis of metal nanoparticles. Citrus peel extracts have been used to synthesize Au [18,21], Ag [22,23] CdO [24,25], ZnO [26,27], Fe [28], FeO [29], CuO [30], and TiO2 [31] nanoparticles.
The special properties of AuNPs arise from the resonant oscillation of free electrons in the presence of light, known as localized surface plasmon resonance (SPR). The plasmon resonance can either radiate light, a phenomenon that is very useful in the imaging field and production of sensors [32], or rapidly dissipate energy through heat, which can be used for other applications, such as cancer treatment or the destruction of viruses and bacteria [17,33]. In the case of AuNPs, the frequency of the surface plasmon resonance falls into the visible region, showing a well–defined SPR band in this region of the electromagnetic spectrum. The frequency of the SPR band is highly sensible to the chemical environments and depends on the shape of the nanostructure (spheres, rods, shells, etc.), size, functionalization on the surface of the nanoparticles, and, also, can change according to the state of aggregation of the nanoparticles. In the last case, the interparticle distance is reduced causing a shift in the SPR band with respect to monodispersed ones [34], and a shift in the SPR band, accompanied by a color change, can be effectively used for the colorimetric detection of a specific analyte in water solutions. Nanoparticle–based colorimetric sensors have become very popular and increasingly studied because of their low cost, simplicity of detection, on–site application, and because they do not require complicated sample treatment and complex analytical instrumentation [35].
In recent years, different functionalized AuNPs, exploiting the aggregation process, have been applied as colorimetric sensors for the detection of Pb2+ ions in solutions. Different chemical synthetic procedures were used for the formation and the functionalization of the AuNPs [16,35]. As an example, Chung et al. proposed a classic method, such as the Turkevic method, using sodium citrate as a reducing and stabilizing agent [36]; other protocols involved the use of strong, dangerous, and sometimes toxic reducing agents, such as gallic acid, 11–MUA, pyridine–formaldehyde, and TOAB [37,38,39,40,41]. Other procedures involved chemical reducing agents for the reduction in gold precursors, and, in addition, specific functionalizing compounds were selected to add to the as–produced AuNPs, such as amino–acids, oligonucleotide, and aptamers [42,43,44].
Recently, more and more frequently, AuNPs being produced by exploiting green and more eco–sustainable reducing agents, such as waste or extracts from plants, and applied as colorimetric sensors for Pb2+ detection [45,46,47].
In this study, gold nanoparticles (AuNPs@OPE) were obtained by a green approach using orange peel extract (OPE) as a reducing and stabilizing/capping agent. The AuNPs@OPE were fully characterized by UV–Vis, SEM, EDX, and DLS analyses, and then tested as colorimetric sensors for heavy metal ions in water, showing an affinity and selectivity towards Pb(II); the addition of this metal ion favored the aggregation of the nanoparticles and the process was accompanied by a change in the color of the AuNPs@OPE from pink to violet, evidenced by a second new surface plasmon band, relating to the aggregate’s formation, at a higher wavelength. The proposed colorimetric assay was also tested using natural waters demonstrating the reliability to use the AuNPs@OPE with real samples.

2. Materials and Methods

2.1. Materials

Gold (III) chloride hydrate (HAuCl4∙H2O), NiCl2, CoCl2, ZnCl2, CuCl2, MnCl2, CdCl2, HgCl2, and PbCl2 were purchased from Sigma–Aldrich (St. Louis, MO, USA). NaOH 2M and HCl 2M were purchased from Carlo Erba Reagents SAS (Chaussée du Vexin, Parc d’Affaires des Portes, Val de Reuil, France). Fresh orange fruit (Citrus sinensis) was bought in Eurospin, Camerino, Italia. All the solutions were prepared by using ultrapure water (18.2 µS/cm) produced by Milli–Q® Advantage A10, Merk.

2.2. Preparation of the Orange Peel Extract

The orange fruit was initially washed with deionized water; the peel was successively separated from the fruit and cut into small pieces. A total of 30 g of orange peel was mixed with 100 mL of UltraPure water, heated to 100 °C, and after the boiling point, the solution was left for 10 min. The OPE solution was then separated from the solid peel and collected after filtration using filter paper. Finally, the extract solution was centrifugated at 6000 rpm, and the liquid phase was recovered, divided into small portions, and then stored in a freezer at −25 °C, until its next use.

2.3. Synthesis of AuNPs @OPE

The synthesis of gold nanoparticles (AuNPs@OPE) was optimized in 40 mL of ultrapure water in a glass flask equipped with a refrigerant column, using a final concentration of 0.165 mM of HAuCl4. The solution was stirred and heated at 100 °C; once the boiling point was reached, the OPE solution was added as a reducing agent. Different pH conditions and different volumes of the OPE solution were tested for the optimization of the AuNPs@OPE. The reaction should be kept at reflux at a 1000 rpm stirring rate to allow the optimal formation of nanoparticles. High temperature and stirring produced a quick reaction and reduced the aggregation of nanoparticles. The status of the reaction and the formation of the nanoparticles were monitored by UV–Vis spectroscopy using an Agilent Cary 8454 Diode Array System spectrophotometer. The reaction was stopped after 1 h when the surface plasmon resonance (SPR) band was stable. The obtained nanoparticle suspension was dialyzed with a 3.5 kDa membrane (Spectra/Por Dialysis Membrane Standard RC Trial Kit bought from Spectrum Laboratories Inc., (Irving, TX, USA)to remove the reagents in excess, and stored at 4 °C.

2.4. Characterization of AuNPs@OPE

AuNPs@OPE morphologies were analyzed by field emission scanning electron microscopy (FE–SEM, Sigma 300, Zeiss, Gina, Germany) at 8 kV and with energy–dispersive X-ray spectroscopy (EDX, Quantax, EDS, Bruker). Specifically, several drops of the obtained AuNPs@OPE were deposited on silicon foil, which was then placed on aluminum stubs by using self–adhesive carbon tabs; the liquid phase of the sample was removed by drying at 30 °C in a vacuum oven (Vismara, 65). The distribution of the nanoparticles’ size was analyzed by using ImageJ 1.54 d software.
The functionalization of the AuNPs@OPE and the presence of the functional groups of the surface ligands were investigated by Fourier–transform infrared spectroscopy (FT–IR), using a Perkin–Elmer System 2000 FT–IR instrument (Waltham, MA, USA). In this case, the AuNPs@OPE were first lyophilized (FreeZone 1 Liter, Labconco, Kansas City, MO, USA), and the obtained nanoparticle pellets were analyzed by FT–IR spectroscopy.
The size distribution of the nanoparticles and the zeta potential were evaluated with dynamic light–scattering (DLS) measurements performed by using a Malvern Zetasizer nano–S device (Malvern Instruments, Worcestershire, UK) equipped with a back–scattered light detector operating at 173°.

2.5. AuNPs@OPE as Colorimetric Sensors for Heavy Metal Ions

Stock solutions of different metal cations (Ca2+, Cd2+, Co2+, Cu2+, Fe2+, Hg2+, K+, Mg2+, Zn2+, Na+, Ni2+, Mn2+, and Pb2+) with a final concentration of 1.01 mM were prepared by using the corresponding salts reported in the Materials and Methods Section 2.1.
The selectivity of the AuNPs@OPE was tested by adding a final concentration of 50 µM of the different metal cations and monitoring the UV–Vis spectral change after 15 min. For the case of Pb2+, spectral changes were monitored at regular intervals after different additions of the metal cation, from 2.5 to 50 µM, to the AuNPs@OPE. For all the analyses, the AuNPs@OPE were diluted at a 1:1 ratio in ultrapure water and the tests were conducted in a total volume of 2 mL. The colorimetric assay was repeated in the range of 0–9.90 µM, and the UV–Vis spectral change was monitored after 90 min following the Pb2+ additions. A colorimetric assay was also performed using different natural drinking water samples with spiked concentrations of Pb2+ of 15, 20, 28, and 33 µM. The ionic composition of the drinking water was analyzed by the ICP–MS 7500cx series (Agilent Technologies, Santa Clara, CA, USA) and ion chromatography (ICS–1000, Dionex– Thermo Fisher Scientific, Waltham, MA, USA).

3. Results

3.1. Synthesis of AuNPs@OPE

The AuNPs@OPE were synthesized starting from HAuCl4 as the precursor and orange peel extract (OPE) as the reducing and capping/stabilizing agent. To obtain the best condition for the formation of the AuNPs@OPE, different ratios of OPE/HAuCl4 and the pH conditions were evaluated. The spectra obtained at different pHs are reported in Figure 1a, showing that a neutral pH is the best condition for the synthesis of AuNPs@OPE using OPE as a reducing and stabilizing agent. During the reaction, the solution turned from colorless to red–purple, confirming the reduction of Au(III) to Au(0) with the consequent formation of AuNPs@OPE and the observation of the typical surface plasmon resonance (SPR) band, centered at 530 nm, characteristic of spherical gold nanoparticles.
The effect of different HAuCl4/OPE ratios, using different amounts of OPE solutions from 50 to 250 μL, can be observed in the UV–Vis spectra reported in Figure 1b. In this case, the SPR band ranges from 530 to 540 nm, and different color shades are detected depending on the quantity of the extract used in the reaction (Figure 1b).
The lowest amount of OPE equal to 50 μL, in a total volume of 40 mL, did not show a good reduction capacity towards Au(III); when increasing the amount of OPE to 100 μL, the typical SPR band of AuNPs at 530 nm was detected, but, in this case, a broadened peak indicated the partial aggregation of the AuNPs@OPE. By using 150 μL of OPE extract, a sharper and more narrow SPR band at 530 nm was obtained; in these conditions, the reduction of Au(III) and the formation of the nanoparticles were faster, showing a shorter reaction time. Continuing to increase the amount of OPE extract to 200 μL, the SPR band increased, showing a little red shift to 350 nm, probably due to an increase in the nanoparticles size; the addition of 250 μL of OPE did not show any improvements, while, on the contrary, the absorbance of the SPR band decreased. For these reasons, the optimal condition chosen for the preparation of AuNPs@OPE was a neutral pH using 150 μL of OPE that showed the narrowest SPR band.

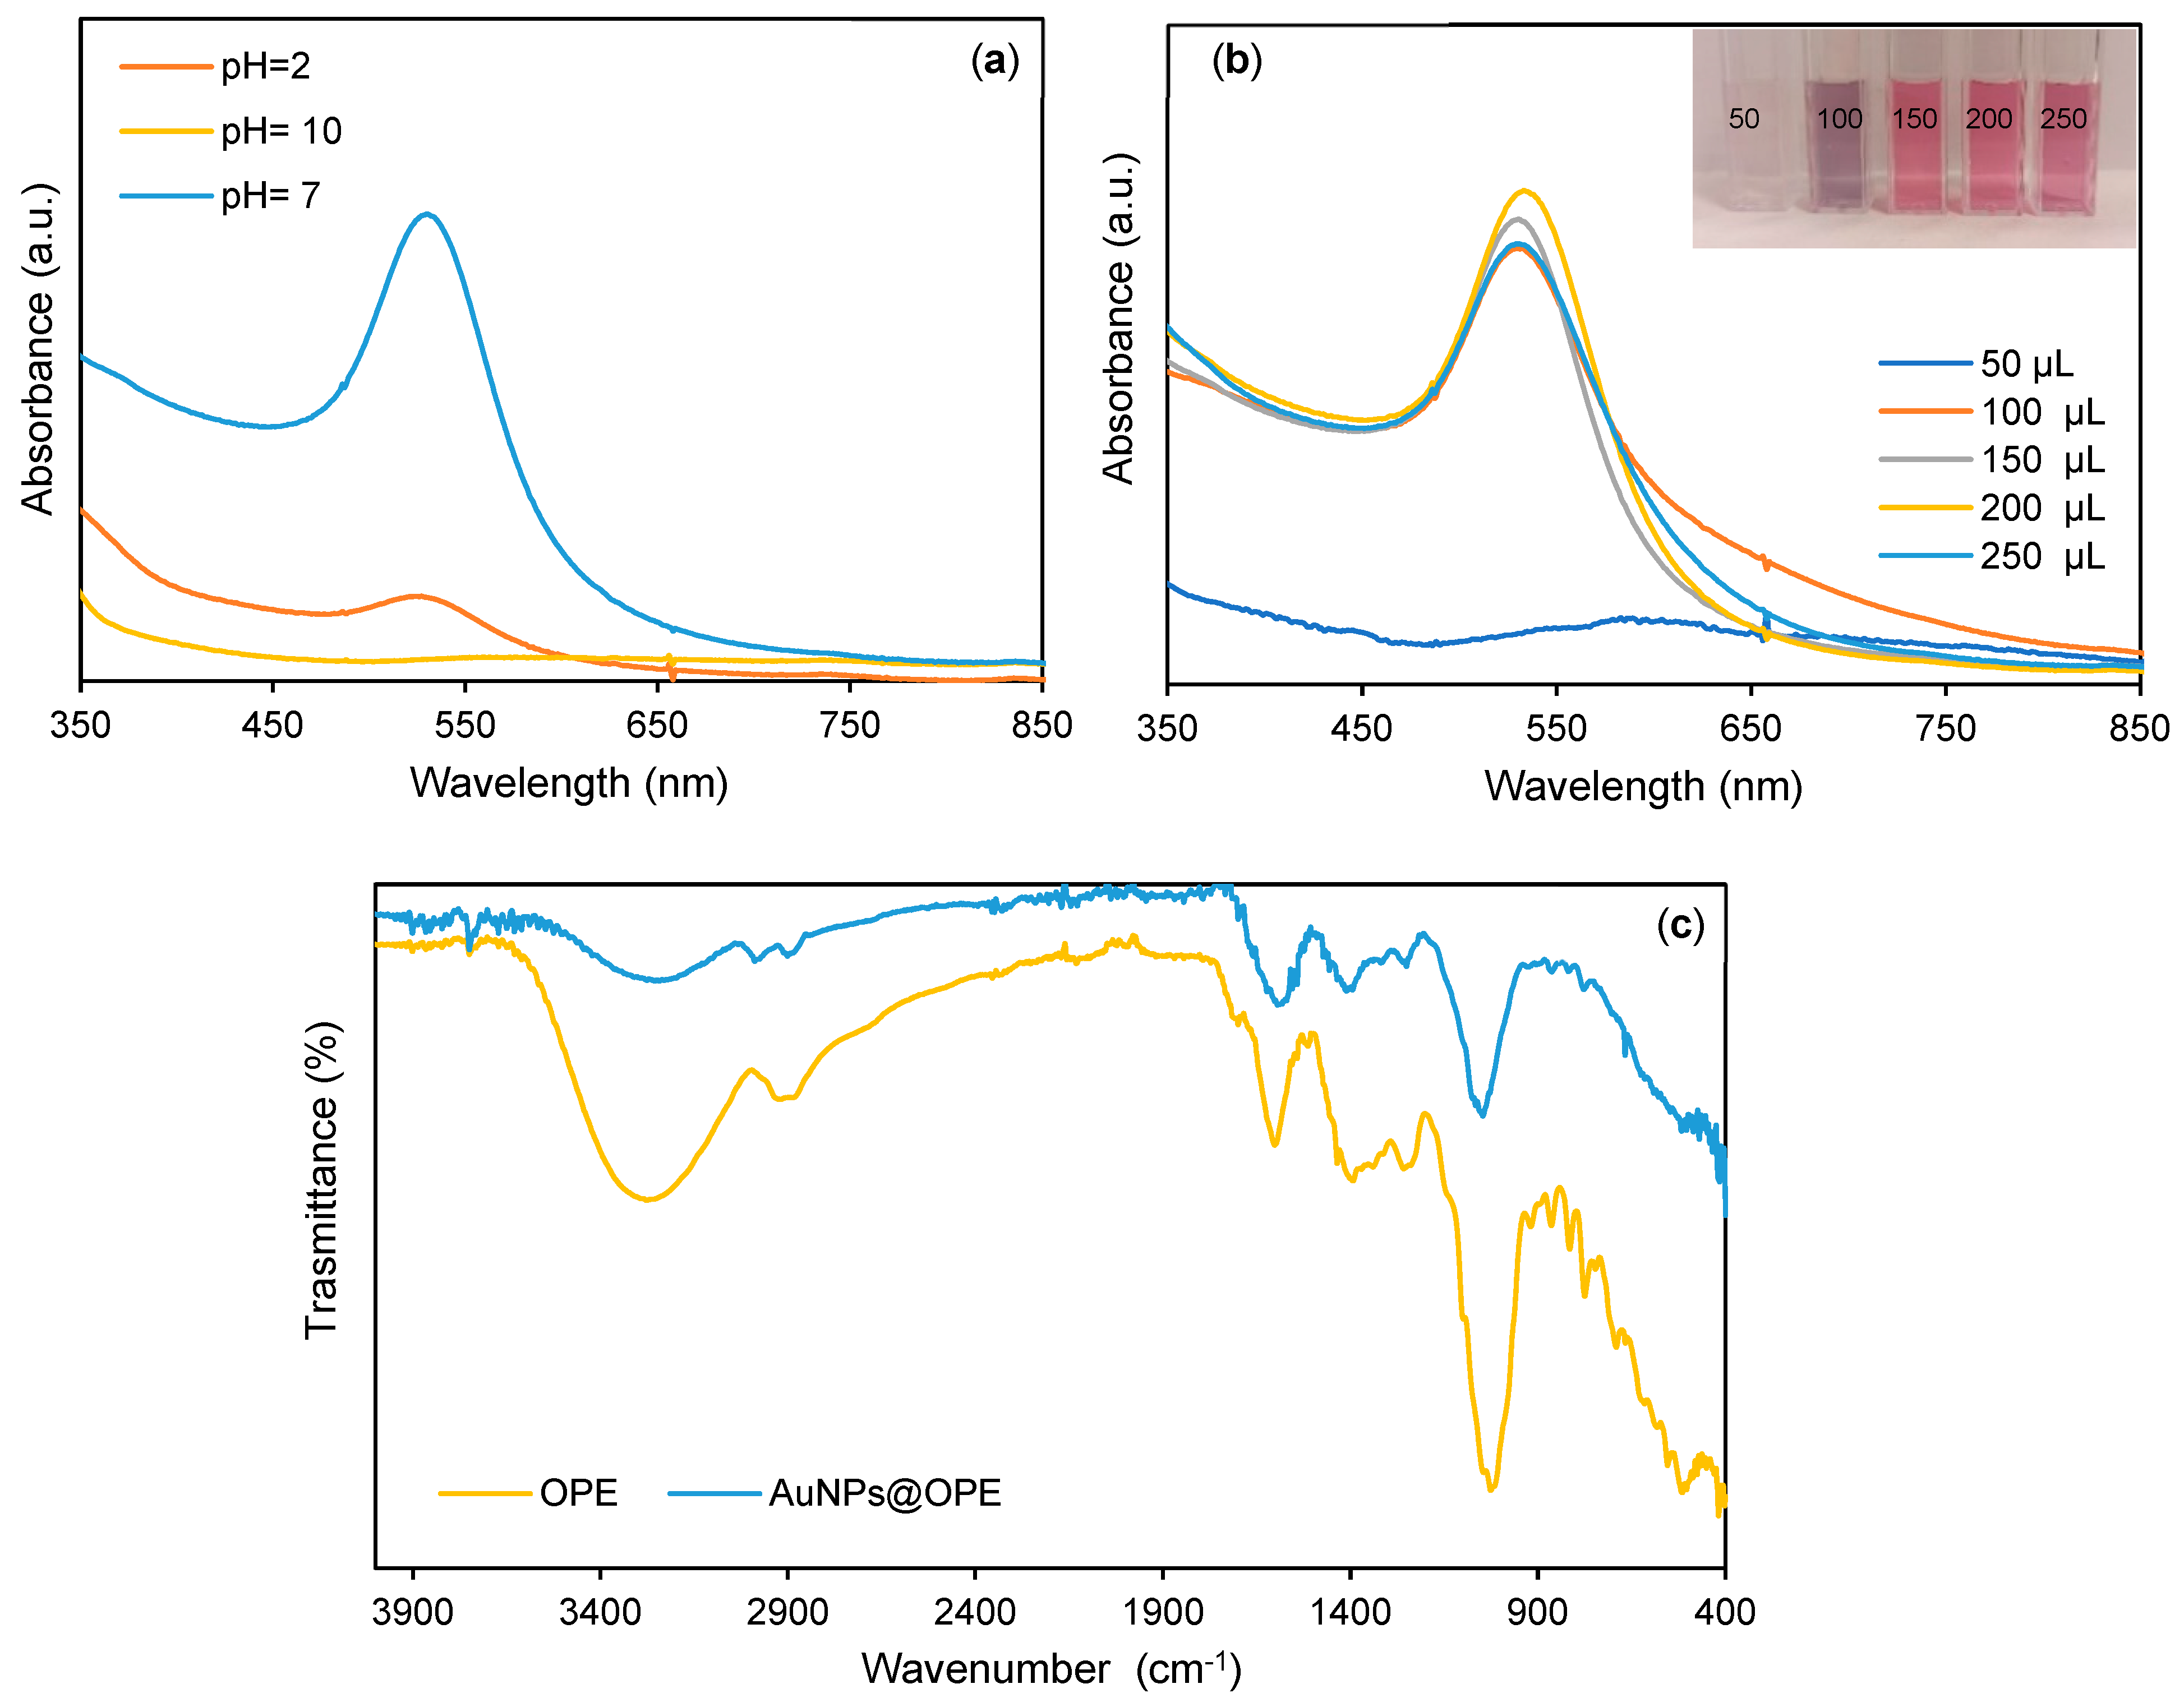
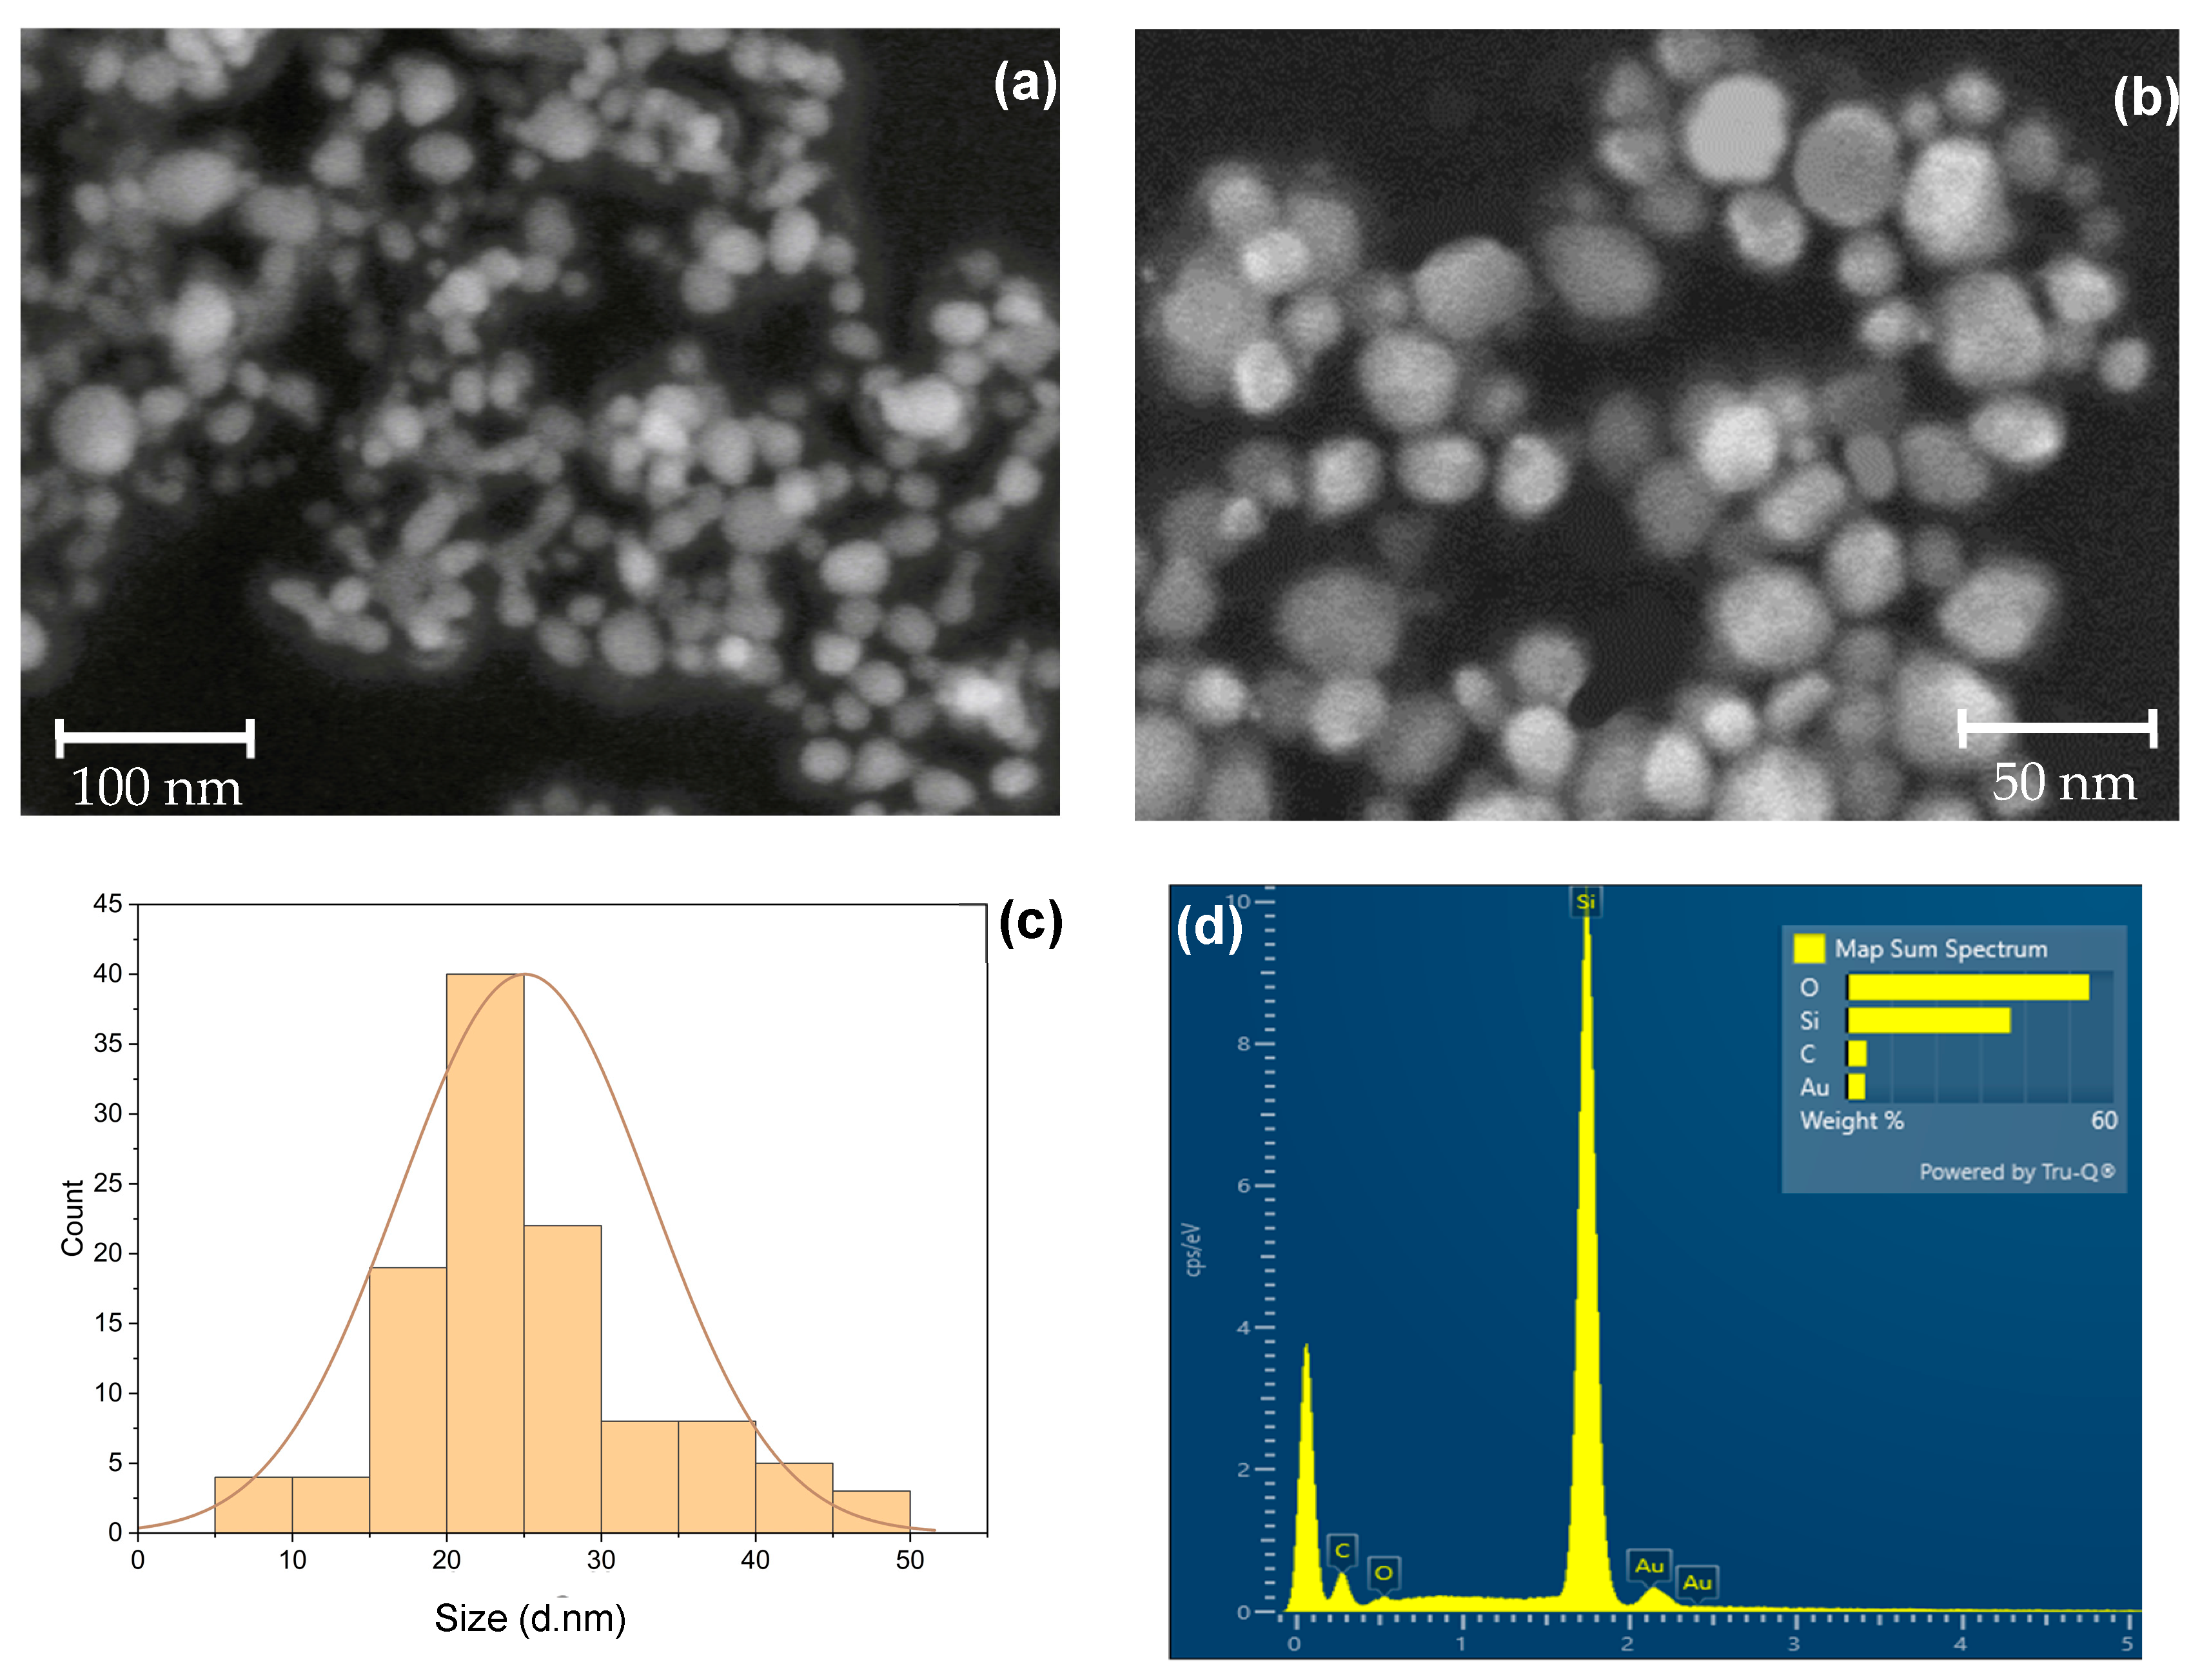
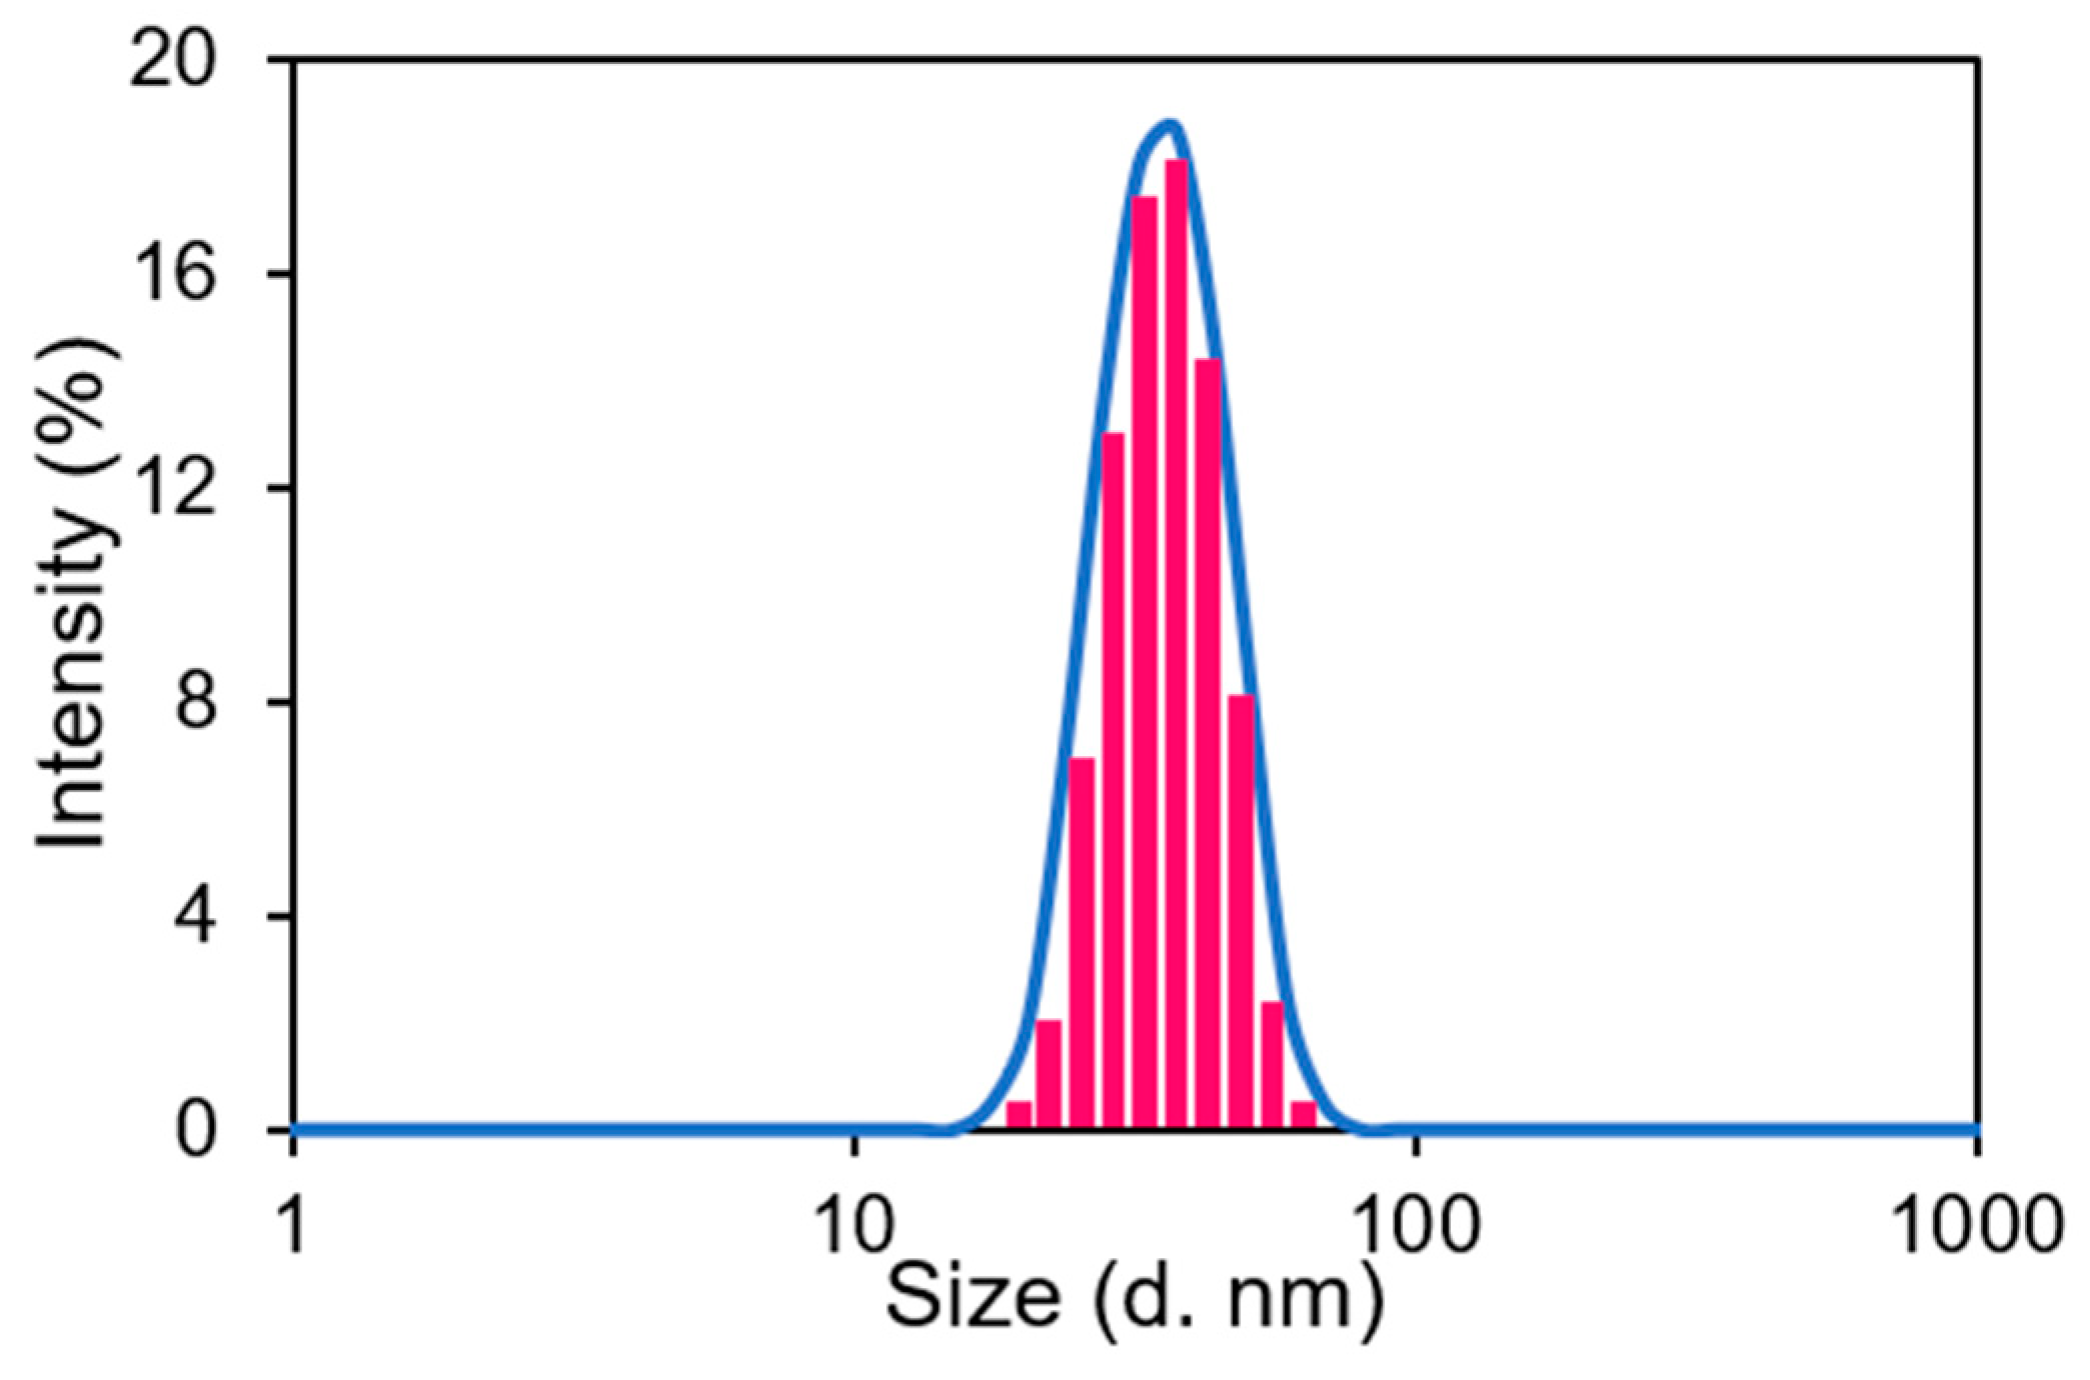
3.2. Characterization of AuNPs @OPE

The FT–IR spectra of the OPE extract and the lyophilized AuNPs@OPE prepared under optimal conditions are reported in Figure 1c. The OPE extract (yellow line) shows a small peak at 3750 cm−1 and a broad peak at 3400 cm–1 related to the stretching vibration of the –OH group of alcohols, phenols, flavonoids, and –COOH groups of free and inter–molecular bonding. The band at 2920 cm−1 is related to the –CH stretching of the aromatic compounds present in the extract; additionally, the intense band at 1610 cm−1 is attributed to the typical stretching vibration of the C=C aromatic bond of the phenolic groups, while the bands at 1730, 1415, and 1013 are related to the C=O, –COOH, and C–O functional groups, respectively [48]. The results, according to the literature, confirm the presence of polyphenol and flavonoid compounds inside the OPE extract; these interesting compounds, particularly the flavonoids, for their reducing ability, represent advantageous reducing agents for the formation of green AuNPs@OPE [49]. The FT–IR spectra of the lyophilized AuNPs@OPE confirm the functionalization of the nanoparticles by the OPE extract, due to similar profiles, suggesting that the surface of the nanoparticles is covered by organic water–soluble components obtained from the OPE extract.
The morphologies of AuNPs@OPE observed by this green procedure, in the best experimental conditions, were analyzed by SEM measurements (Figure 2). In Figure 2a, the SEM image shows the presence of spherical AuNPs; in the SEM image in Figure 2b with a greater magnification, it is also possible to observe that the nanoparticles are surrounded by halos, probably due to the functionalization of OPE compounds that cover the surface of the nanoparticles. The size analysis distribution of the obtained AgNPs@OPE was performed by using ImageJ software on more than 250 nanoparticles (Figure 2c), showing a normal distribution with an average size of 27.58± 1.08 nm. The EDX analysis (Figure 2d) of the SEM image confirms the presence of Au, while the other detected peaks are related to C and O, which can be attributed to the OPE organic compounds present in the sample as surface ligands; the Si signal is due to the sample support used for the deposition of the AuNPs@OPE.
In addition, a DLS analysis was performed on the AuNPs@OPE where the main size of the nanoparticles, as reported in Figure 3, was around 35.52 nm, thus in good agreement with the SEM analysis.
The as–proposed optimized protocol, in the preparation of AuNPs@OPE, demonstrated the production of stable and spherical functionalized AuNPs@OPE by using and valorizing a waste material, such as OPE extract; in addition, this procedure did not involve the use of toxic and harmful reagents for the human health and for the environment as applied in several chemical synthetic methods [16,35].

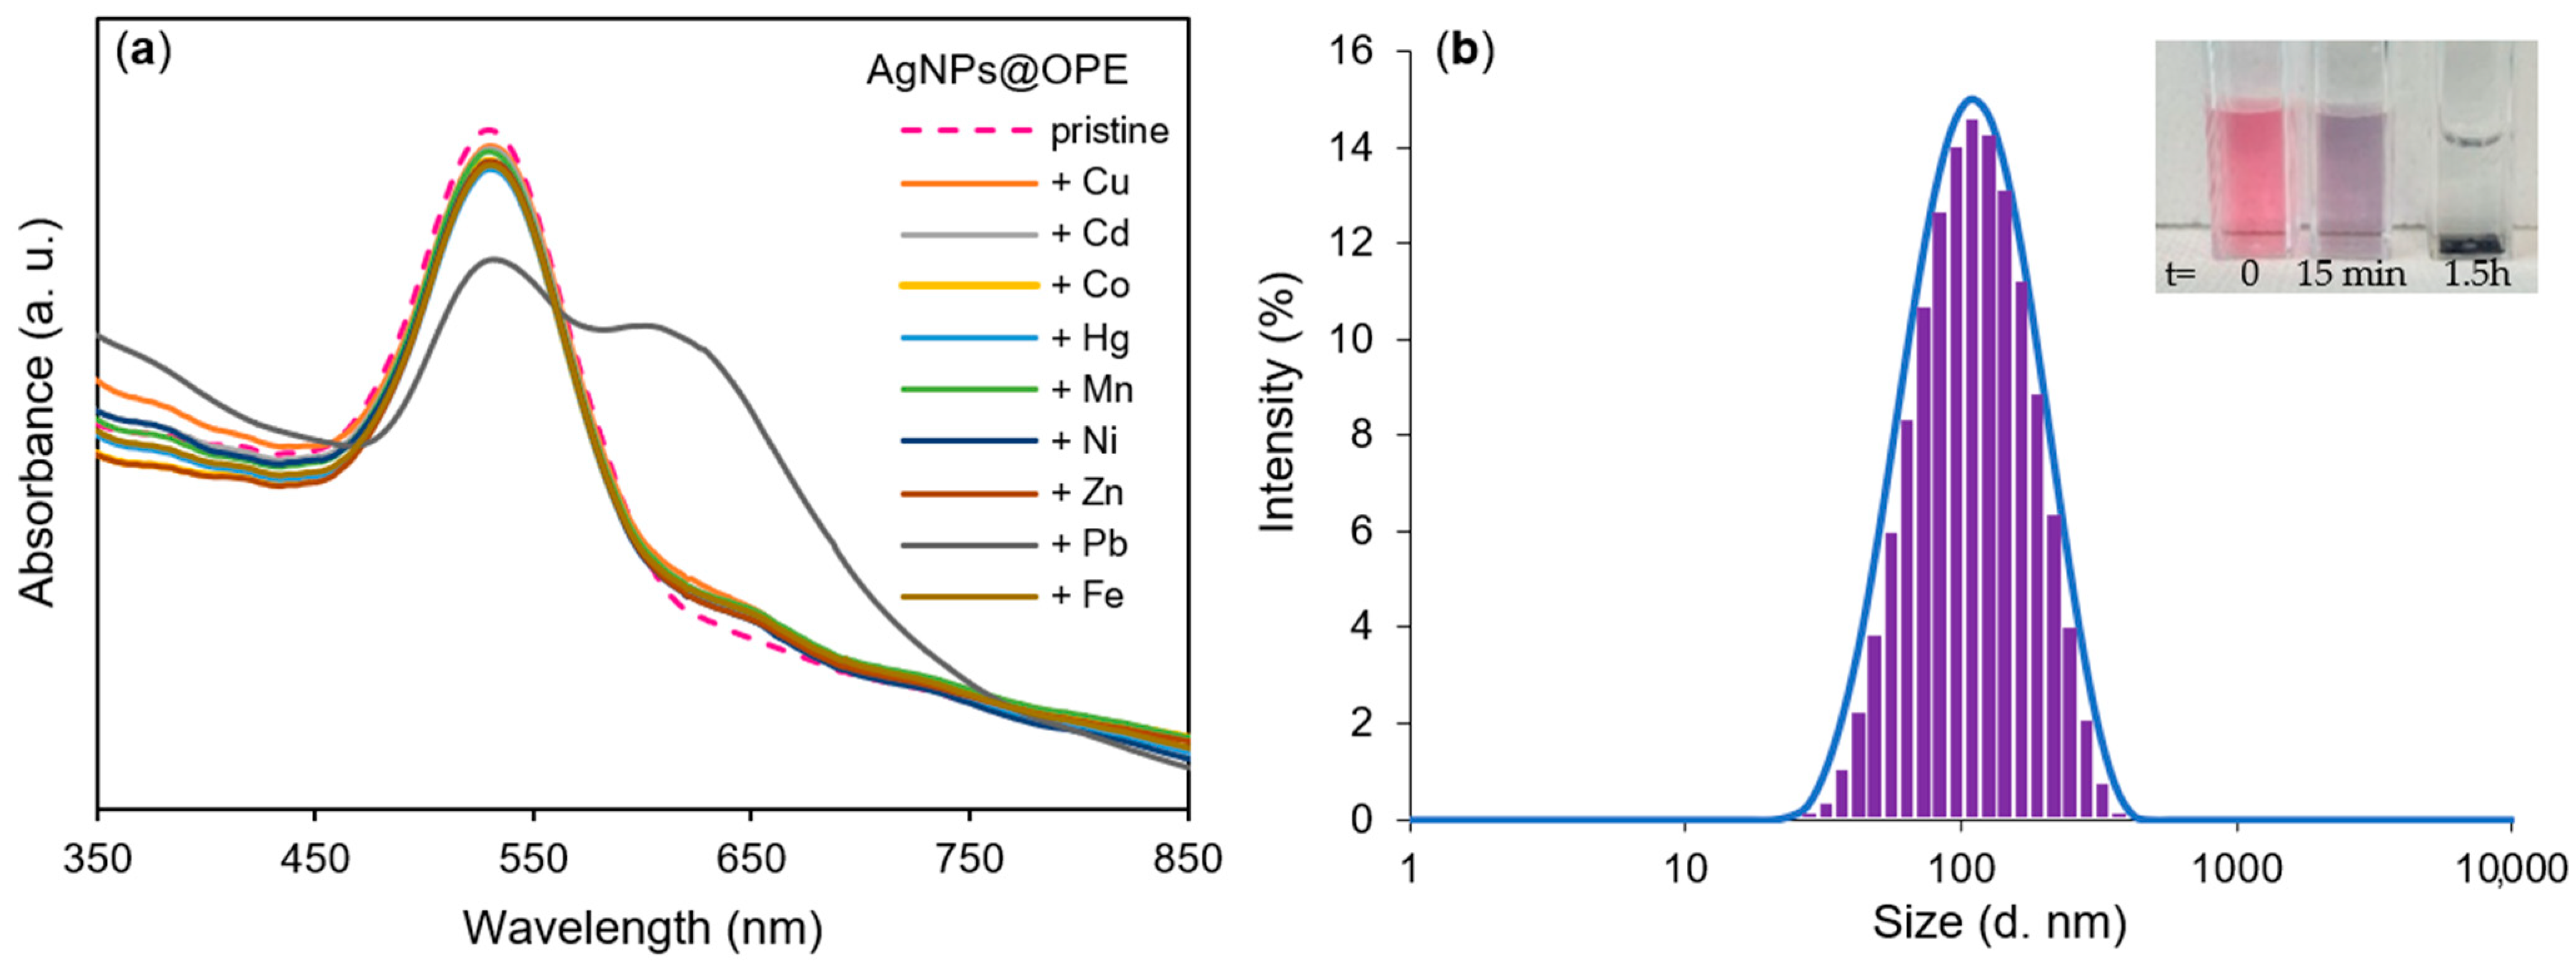
3.3. Sensing Mechanism and Selectivity of the Colorimetric Assay

The mechanism of this simple and rapid colorimetric assay for sensing Pb2+ ions is represented in Figure 4, which is based on the aggregation mechanism of AuNPs@OPE by the presence of Pb2+ ions. The AuNPs@OPE solution diluted at a 1:1 ratio with ultrapure water appears pink since the gold nanoparticles are capped by negatively charged organic anions (e.g., –OH, –COOH), such as organic acids, phenolic compounds, and flavonoids present in the orange peel extract [11]. This capping effect reduces the repulsive forces between gold nanoparticles, hinders agglomeration, and favors their stability [50].
The presence of negative functional groups on the surface of the nanoparticles was confirmed by a negative zeta potential value of −20.4 ± 1.29 mV. This value also indicates the moderate stability of the nanoparticles for aggregation. After the addition of cations, in this case Pb2+ ions to AuNPs@OPE, a chromatic variation in the colloidal suspension can be observed due to the interaction of the AuNPs@OPE nanoparticles with the analyte of interest, usually accompanied by the appearance of a second SPR band at a higher wavelength. Specifically, Pb2+ ions can strongly induce the aggregation of AuNPs@OPE by forming clusters between different gold nanoparticles because of the formation of coordination complexes between Pb2+ ions and the carboxyl/hydroxyl groups of the organic molecules that functionalize the AuNPs@OPE [51,52,53].
Therefore, the addition of Pb2+ ions to the AuNPs@OPE decreases the inter–particle distance of the nanoparticles [53], causing a change in the SPR bands (Figure 5); specifically, the main SPR band at 530 nm of the AuNPs@OPE decreases with the appearance of a second SPR band at 614 nm, as reported in Figure 5a, accompanied by a color change from pink to violet (Figure 5b). The color variation could be easily detected 15 min after the addition of the Pb2+ ions; after 1.5 h, the cluster that formed between the Pb2+ and AuNPs@OPE reached a critical mass and all the nanoparticles aggregated and precipitated to the bottom of the solution (Figure 5b).
The colorimetric assay was tested by using different metal ions at the same concentration of 50 µΜ; all the solutions, in this case, were analyzed by UV–Vis spectroscopy after 15 min, showing a strong selectivity towards Pb2+ ions, as can be observed in Figure 5a, where only Pb2+ shows the typical spectrum of aggregated gold nanoparticles. The DLS measurements of AuNPs@OPE in the presence of Pb2+ (50 µM), shown in Figure 5b, confirmed the aggregation and the formation of clusters between Pb2+ ions and the nanoparticles with a mean diameter of about 122.6 ± 0.99 nm.

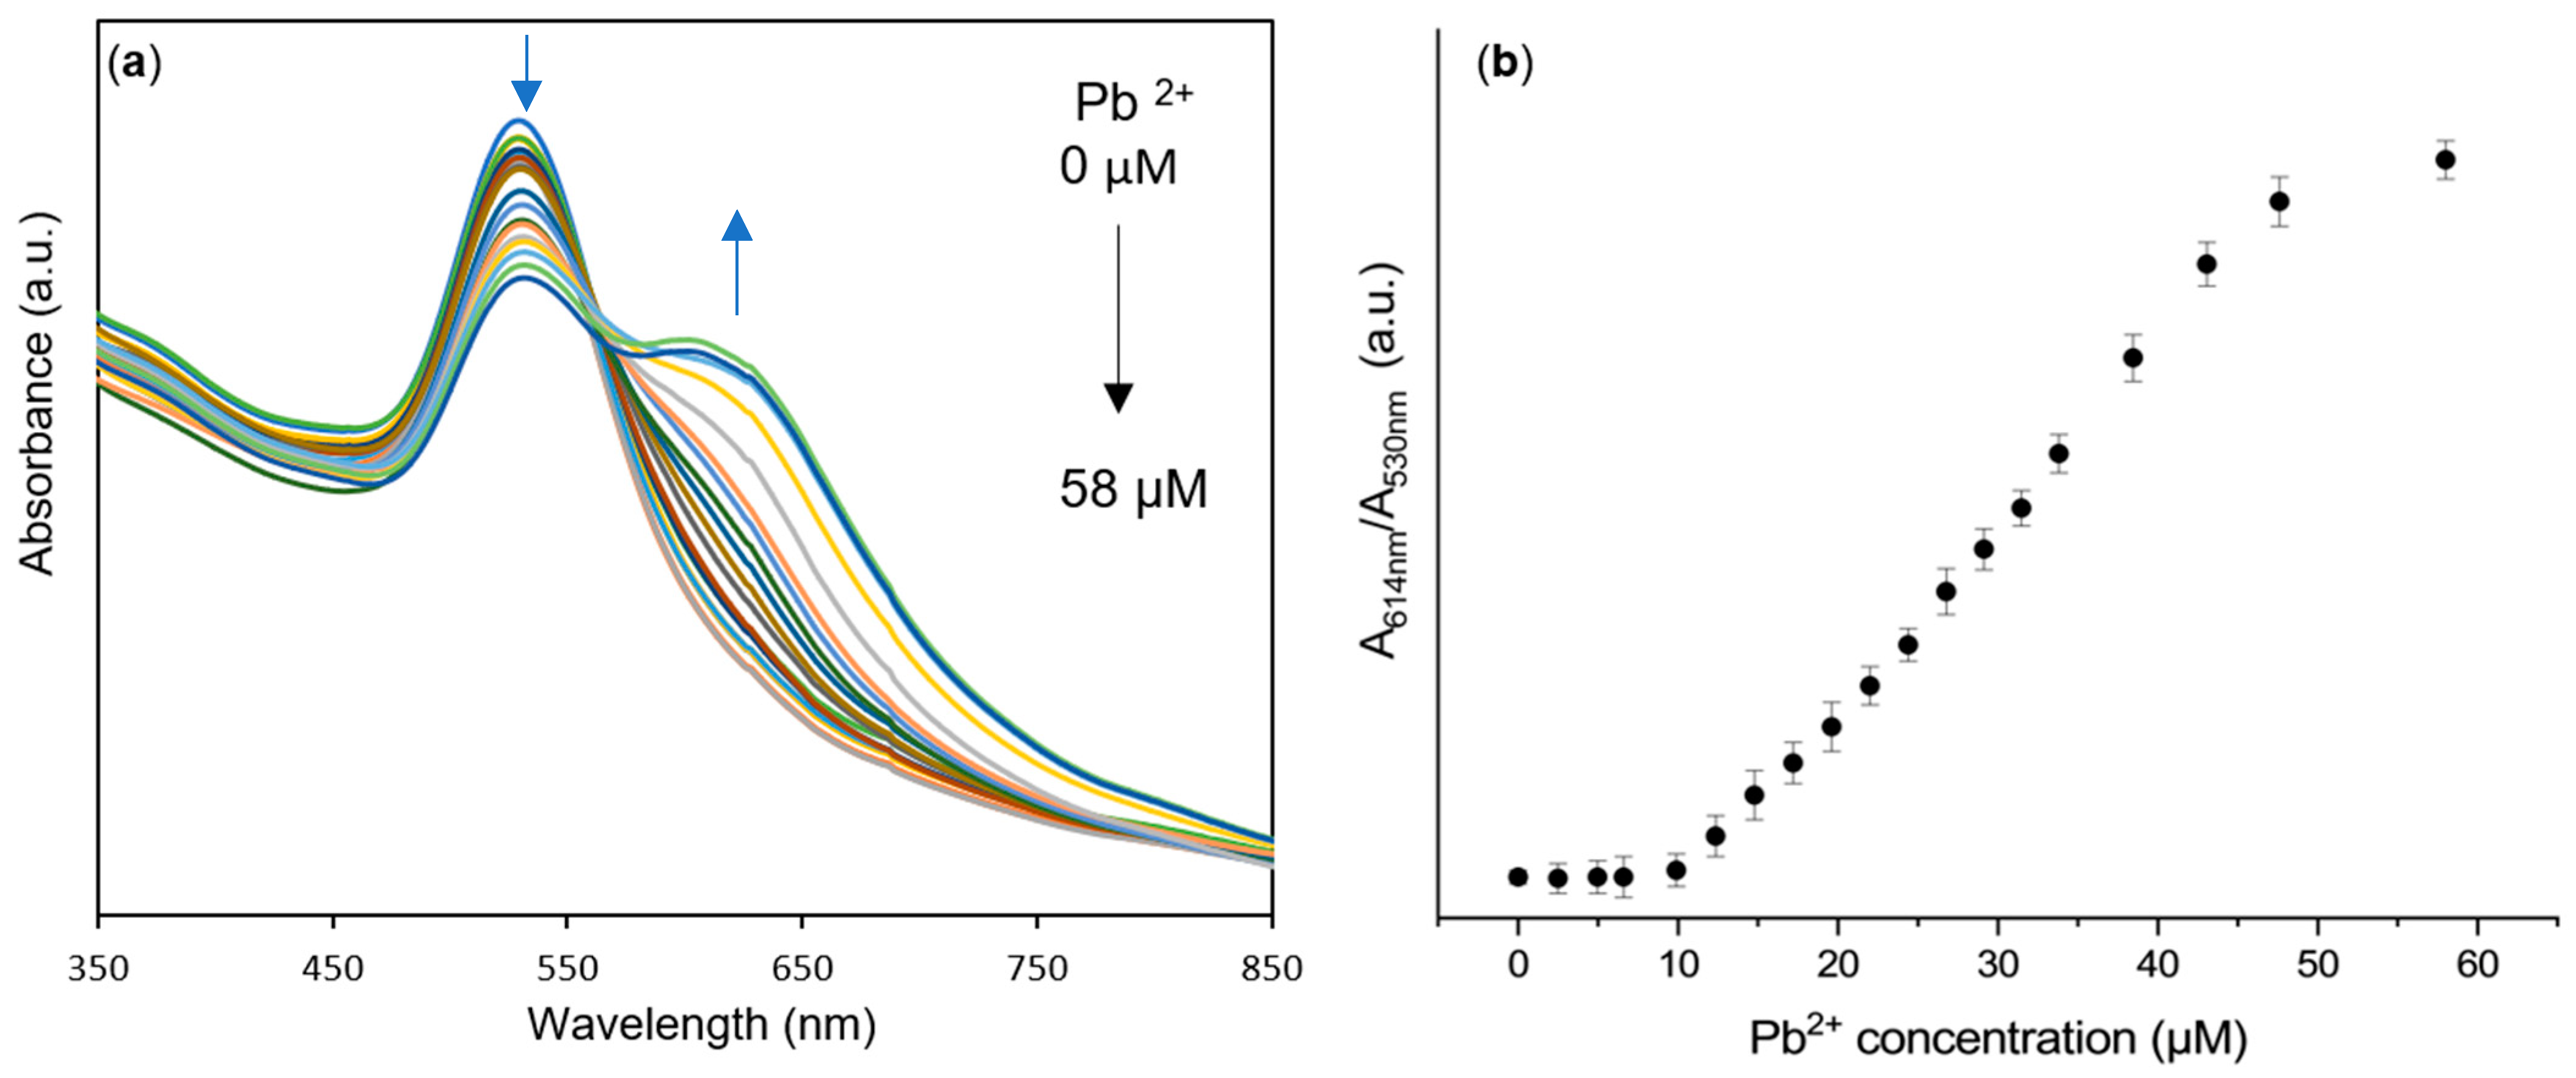
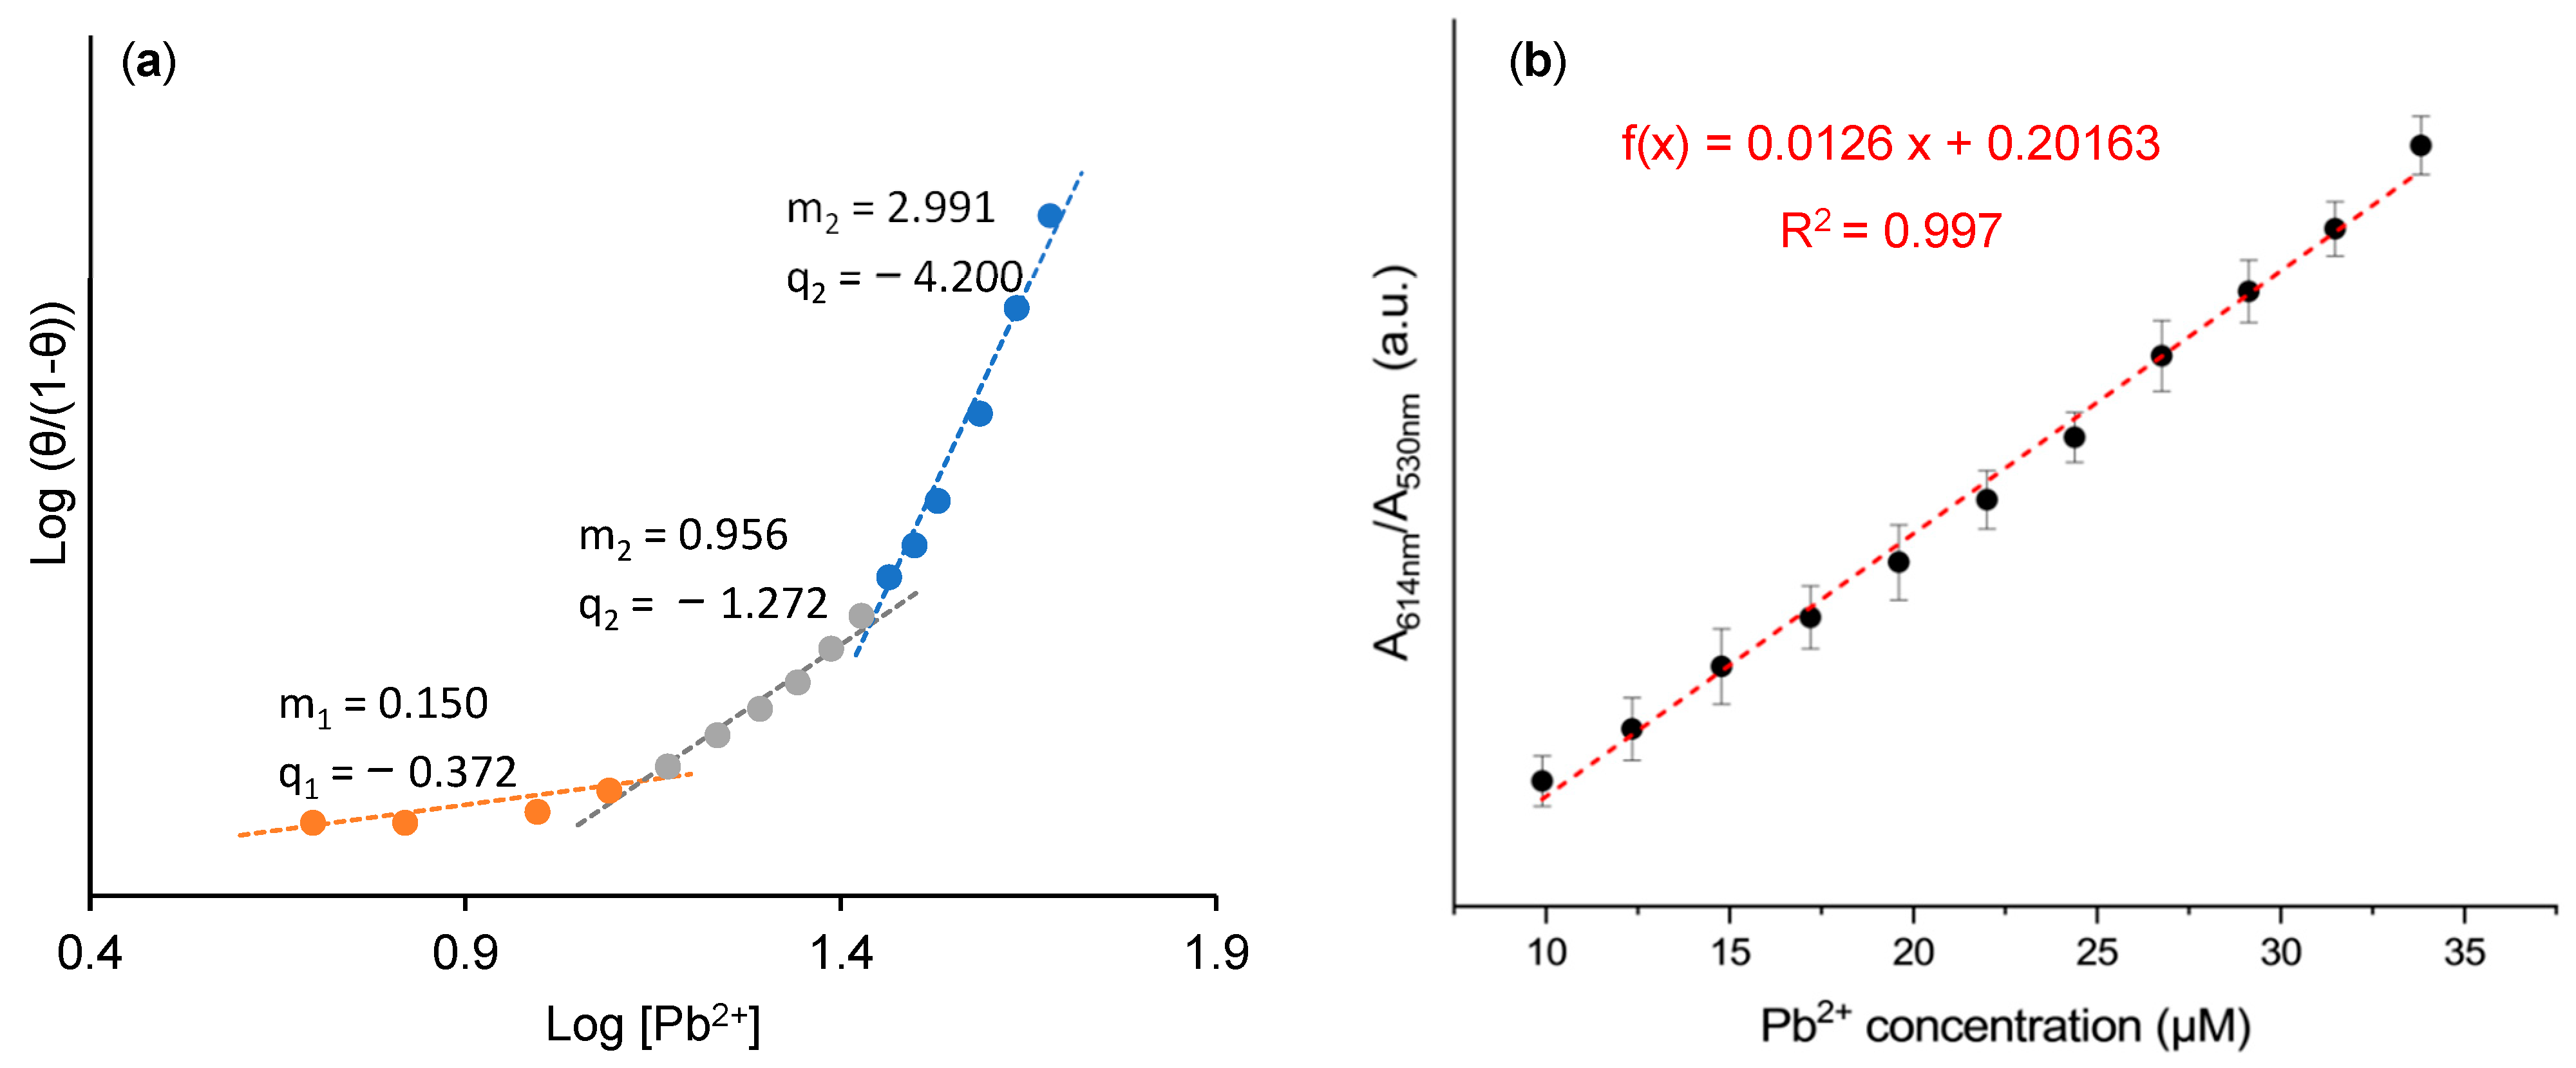
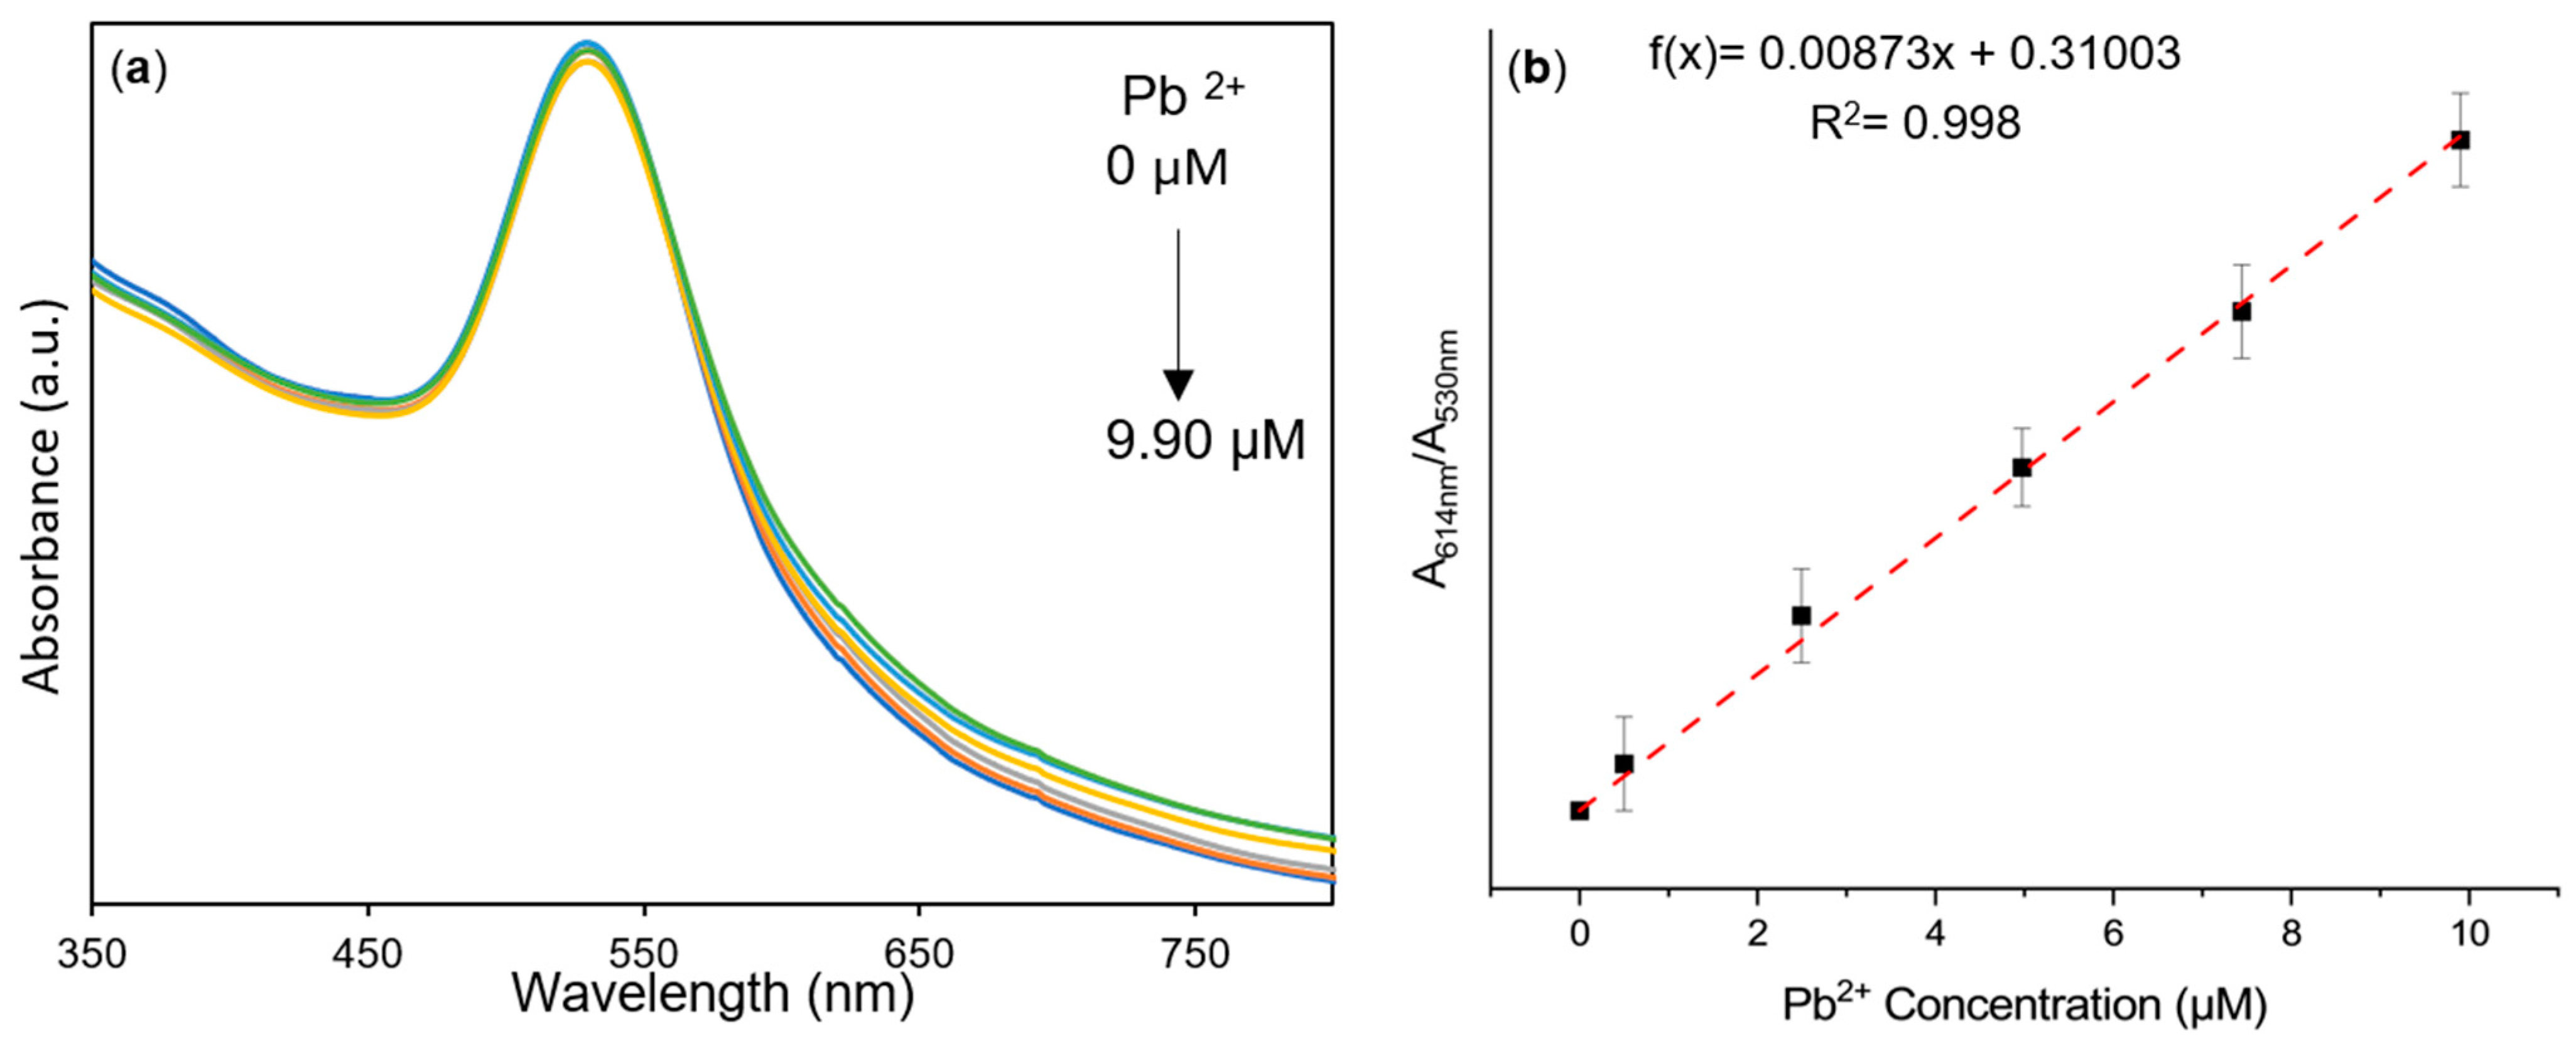
3.4. AuNPs@OPE as Sensors for Pb(II) in Water

Note that the AuNPs@OPE are selective for the Pb2+ ions. The experiment proceeded toward an appropriate calibration of the system for the quantification of the metal ion by using a spectrophotometric technique. A stock solution of Pb2+ (1 mM) was added in increasing volumes to different samples of AuNPs@OPE for a concentration that ranged from 2.49 to 58 µM of the metal ion; Figure 6a reports the UV–Vis spectra of AuNPs@OPE with increasing concentrations for Pb2+ ions measured at 15 min after each addition. Form the spectra, it is possible to observe that the AgNPs@OPE show a single SPR band at 530 nm; with the increasing concentration of Pb2+ ions, the principal SPR band decreases with the consequent increase in a second SPR band at 614 nm, showing a visible isosbestic point at 574 nm, due to the formation of AuNPs@OPE–Pb clusters. The change in the UV–Vis spectra is accompanied by a gradual change in color from pink to violet, as can be observed in Figure S1. In such a case, the absorbance ratio between the principal band at 530 nm and the second SPR band at 614 nm can be used for calibration purposes. The plot of the A614nm/A530nm ratio as a function of the concentration of the Pb2+ ions is presented in Figure 6b, which shows a sigmoidal shape typical of the aggregation process, and the curve can be divided into three different regions. In the first region, the lag phase, with low concentrations of Pb2+, from 2.48 to 6.6 µM, only a slow formation of a small lattice occurred, in which only a few clusters between Pb2+ ions and AuNPs@OPE were formed. In the second region, with higher sensitivity, where the concentration of Pb2+ ions ranged from 9.9 to around 38 µM, the increase in aggregation involved a higher number of nanoparticles, producing a larger lattice that was associated with a greater change in the absorbance spectrum with the formation of the second SPR band; this behavior corresponded to the consequent linear increase in the absorbance ratio.
The third region, called the pre–saturation zone, in the presence of the highest concentration of Pb2+ ions, resulted in the formation of a larger cluster between Pb2+ ions and AgNPS@OPE producing a superlattice that reached a critical mass favoring the collapse of the system; in this case, the solutions started to appear cloudy due to the formation of nanoparticle precipitate in the solution.
During the aggregation process, the increasing concentrations of Pb2+ ions was associated with a higher clustering rate, and the increasing intensity of the second SPR was associated with the aggregated forms of NPs. Using Hill’s equation [34] for the investigated system, it was possible to obtain quantitative information about the aggregation mechanism between AuNPs@OPE and Pb2+ ions. The proposed AuNPs@OPE nanoparticles can be considered as macromolecules with n–binding sites on their surfaces, where n corresponds to the number of COO/C–O sites. Hill’s equation refers to the saturation to unsaturation ratio (number of occupied/free sites ratio) to the concentration of the ligand that, in this case, is Pb2+. The saturation of the investigated system can be express as the following Equation (1):
θ = A b s r a t i o   i A b s r a t i o   M A X
where Absratioi is the value obtained for each concentration of Pb2+ evaluated, and AbsratioMAX is the value to which the sigmoidal curve asymptotically tends, which is obtained from the fitting reported in Figure S2; consequently, the unsaturation can be represented as 1 − θ. Hill’s equation can be expressed according to Equation (2):
l o g θ 1 θ = n log P b 2 + l o g K D
where n is the Hill’s coefficient and indicates the average number of bridging Pb2+ ions between two AuNPs@OPE, and KD is the equilibrium constant for the cluster formations between nanoparticles and the cation.
The Hill’s plot presented in Figure 7a shows three different linearity regions, where the slope indicates the average number of bridging Pb2+ ions. The created plot confirms that the aggregation process is very low at concentrations of Pb2+ ions lower than 12 µM; in the range between 12 µM and 28 µM, one cation of Pb2+ binds two AuNPs@OPE nanoparticles, while at a higher concentration of Pb2+ ions, the AgNPs@OPE cluster is linked by 3 –Pb2+ ions. A further increase in size causes the superlattice and the system to gradually collapse.
As discussed before, the linear change in the A614nm/A530nm ratio is associated with the second part of the sigmoidal curve; in this case, when fitting the results in the range from 9.9 to 33.8 µM of Pb2+ ions with a linear equation, f(x) = mx + q (Figure 6b), the best fitted values for the parameters to 95% confidence bounds were m = 0.0126 ± 0.0003 and q = 0.20163 ± 0.00701, with an R–square of 0.997. The limit of detection (LOD), calculated from the calibration curve as 3σ/m, was 13.31 µM of Pb2+ ions.
The aggregation process that involved the AuNPs@OPE and Pb2+ ions was time dependent and kinetically regulated; the increasing time after the addition of Pb2+ ions permitted us to detect a spectral change at a lower concentration.
In this case, the colorimetric assay was repeated and the UV–Vis spectral change was monitored after 90 min. As it is possible to observe in Figure 8, in the range from 0.5 to 9.90 µM of Pb2+, a linear increase in the A614nm/A530nm ratio is detected and the LOD is significantly reduced to 0.05 µM.
Under the optimized experimental conditions, the LOD values obtained in the two different linearity ranges are comparable with the recent results reported in the literature for the AuNPs’ application for the detection of Pb2+ ions (Table 1).

3.5. Analysis of Pb(II) in Water Samples

Two drinking water samples were collected from the Lazio and Marche regions, in the center of Italy, and the respective elemental analysis was performed by ICP–MS, and anion determinations by IC chromatography are reported in Table S1. The water samples were spiked with Pb2+ ions at different concentration levels and then analyzed with the proposed colorimetric assay based on AuNPs@OPE. The UV–Vis spectra are shown in Figure S3, and the determination of Pb2+ ions by using the calibration of the proposed colorimetric sensor are summarized in Table 2; the recovery rate of the spiked Pb2+ ions range from 97.64 to 114.33%, indicating the reliability of using the proposed sensor with real samples.

4. Conclusions

A very simple, cost–effective, highly selective, and rapid colorimetric method for the detection of Pb2+ ions using green AuNPs@OPE, synthesized with orange peel water extract as a reducing agent, was used in this work. The absence of harmful reagents in the synthesis of AuNPs and the selectivity of these AuNPs toward Pb2+ ions represent the practical advantages of the proposed colorimetric method.
The addition of Pb2+ ions strongly induced the aggregation of the as–prepared AuNPs@OPE with the formation of clusters between different AuNPs. This property is evidenced by a decrease in the principal SPR band of the AuNPs@OPE with the appearance of a second SPR band, accompanied by an evident color change from pink to violet.
Quantitative information about the aggregation mechanism between AuNPs@OPE and Pb2+ ions was clarified using Hill’s equation on the investigated system showing the different behavior of the aggregation process depending on the Pb2+ ion concentration.
The aggregation process that involved the AuNPs@OPE and Pb2+ ions was time dependent and kinetically regulated; the increasing time after the addition of Pb2+ ions permitted us to detect a spectral change at lower concentrations. The LOD values obtained at two different times by this colorimetric assay are comparable with those reported in other methods; in addition, the LOD value of 0.05 µM (10.36 ppb) is in accordance with the WHO guidelines on lead, with the permissible level of Pb2+ ions in potable water, that is, 10 ppb.
The application of this colorimetric sensor for the analysis of Pb2+ ions in water samples indicates the reliability of using the proposed method with real samples.

Supplementary Materials

The following supporting information can be downloaded at: https://www.mdpi.com/article/10.3390/chemosensors12030033/s1; Figure S1: sample image of AuNPs@OPE with the increasing concentration of Pb2+ ions up to 58 µM; Figure S2: fitting of the sigmoidal curve by the logistic equation; Figure S3: UV–Vis spectra of AuNPs@OPE with different spiked concentrations of Pb2+ using drinking water samples; Table S1: cations, anions, and pH of the drinking water used for the colorimetric assay of Pb2+ using AuNPs@OPE.

Author Contributions

M.Z.: conceptualization, supervision, methodology, data curation, writing—review and editing; S.P.: formal analysis, data curation, writing—original draft; L.R.: formal analysis and data curation; D.A.: data curation and methodology; R.G.: project administration, supervision, writing—review and editing. All authors have read and agreed to the published version of the manuscript.

Funding

Programma Operativo Nazionale Ricerca e Innovazione 2014–2020 (PON, CCI 2014IT16M2OP005, ESF REACT–EU resources, Action IV.4) to deliver research on “Material and methods for environmental applications”.

Institutional Review Board Statement

Not applicable.

Informed Consent Statement

Not applicable.

Data Availability Statement

Data are contained in the article.

Acknowledgments

The authors gratefully acknowledge MUR for the financial support by PON 2014–2020.

Conflicts of Interest

The authors declare no conflicts of interest.

References

  1. Chen, Z.; Zhang, Z.Y.; Qi, J.; You, J.M.; Ma, J.P.; Chen, L.X. Colorimetric detection of heavy metal ions with various chromogenic materials: Strategies and applications. J. Hazard. Mater. 2023, 441, 129889. [Google Scholar] [CrossRef] [PubMed]
  2. Zamora–Ledezma, C.; Negrete–Bolagay, D.; Figueroa, F.; Zamora–Ledezma, E.; Ni, M.; Alexis, F.; Guerrero, V.H. Heavy metal water pollution: A fresh look about hazards, novel and conventional remediation methods. Environ. Technol. Innov. 2021, 22, 101504. [Google Scholar] [CrossRef]
  3. Raj, K.; Das, A.P. Lead pollution: Impact on environment and human health and approach for a sustainable solution. Environ. Chem. Ecotoxicol. 2023, 5, 79–85. [Google Scholar] [CrossRef]
  4. World Health Organization. Lead Poisoning. Available online: https://www.who.int/news–room/fact–sheets/detail/lead–poisoning–and–health (accessed on 20 January 2024).
  5. Singh, H.; Bamrah, A.; Bhardwaj, S.K.; Deep, A.; Khatri, M.; Kim, K.H.; Bhardwaj, N. Nanomaterial–based fluorescent sensors for the detection of lead ions. J. Hazard. Mater. 2021, 407, 124379. [Google Scholar] [CrossRef] [PubMed]
  6. Willner, M.R.; Vikesland, P.J. Nanomaterial enabled sensors for environmental contaminants. J. Nanobiotechnol. 2018, 16, 95. [Google Scholar] [CrossRef] [PubMed]
  7. Arduini, F.; Cinti, S.; Scognamiglio, V.; Moscone, D. 13—Nanomaterial–based sensors. In Handbook of Nanomaterials in Analytical Chemistry; Mustansar Hussain, C., Ed.; Elsevier: Amsterdam, The Netherlands, 2020; pp. 329–359. [Google Scholar]
  8. Zannotti, M.; Vicomandi, V.; Rossi, A.; Minicucci, M.; Ferraro, S.; Petetta, L.; Giovannetti, R. Tuning of hydrogen peroxide etching during the synthesis of silver nanoparticles. An application of triangular nanoplates as plasmon sensors for Hg2+ in aqueous solution. J. Mol. Liq. 2020, 309, 113238. [Google Scholar] [CrossRef]
  9. Zannotti, M.; Rossi, A.; Giovannetti, R. SERS Activity of Silver Nanosphere, Triangular Nanoplates, Hexagonal Nanoplates and Quasi–Spherical Nanoparticles: Effect of Shape and Morphology. Coatings 2020, 10, 288. [Google Scholar] [CrossRef]
  10. Rossi, A.; Cuccioloni, M.; Magnaghi, L.R.; Biesuz, R.; Zannotti, M.; Petetta, L.; Angeletti, M.; Giovannetti, R. Optimizing the Heavy Metal Ion Sensing Properties of Functionalized Silver Nanoparticles: The Role of Surface Coating Density. Chemosensors 2022, 10, 483. [Google Scholar] [CrossRef]
  11. Gehrke, I.; Geiser, A.; Somborn–Schulz, A. Innovations in nanotechnology for water treatment. Nanotechnol. Sci. Appl. 2015, 8, 1–17. [Google Scholar] [CrossRef]
  12. Guerra, F.D.; Attia, M.F.; Whitehead, D.C.; Alexis, F. Nanotechnology for Environmental Remediation: Materials and Applications. Molecules 2018, 23, 1760. [Google Scholar] [CrossRef]
  13. D’Amato, C.A.; Giovannetti, R.; Zannotti, M.; Rommozzi, E.; Ferraro, S.; Seghetti, C.; Minicucci, M.; Gunnella, R.; Di Cicco, A. Enhancement of visible–light photoactivity by polypropylene coated plasmonic Au/TiO for dye degradation in water solution. Appl. Surf. Sci. 2018, 441, 575–587. [Google Scholar] [CrossRef]
  14. Mitchell, M.J.; Billingsley, M.M.; Haley, R.M.; Wechsler, M.E.; Peppas, N.A.; Langer, R. Engineering precision nanoparticles for drug delivery. Nat. Rev. Drug Discov. 2021, 20, 101–124. [Google Scholar] [CrossRef]
  15. Biswas, R.; Alam, M.; Sarkar, A.; Haque, M.I.; Hasan, M.M.; Hoque, M. Application of nanotechnology in food: Processing, preservation, packaging and safety assessment. Heliyon 2022, 8, e11795. [Google Scholar] [CrossRef]
  16. Kusuma, S.A.F.; Harmonis, J.A.; Pratiwi, R.; Hasanah, A.N. Gold Nanoparticle–Based Colorimetric Sensors: Properties and Application in Detection of Heavy Metals and Biological Molecules. Sensors 2023, 23, 8172. [Google Scholar] [CrossRef]
  17. Jain, P.K.; Huang, X.H.; El–Sayed, I.H.; El–Sayed, M.A. Noble Metals on the Nanoscale: Optical and Photothermal Properties and Some Applications in Imaging, Sensing, Biology, and Medicine. Acc. Chem. Res. 2008, 41, 1578–1586. [Google Scholar] [CrossRef]
  18. Gao, L.; Mei, S.H.; Ma, H.L.; Chen, X.M. Ultrasound–assisted green synthesis of gold nanoparticles using citrus peel extract and their enhanced anti–inflammatory activity. Ultrason. Sonochem. 2022, 83, 105940. [Google Scholar] [CrossRef] [PubMed]
  19. Akintelu, S.A.; Olugbeko, S.C.; Folorunso, A.S. A review on synthesis, optimization, characterization and antibacterial application of gold nanoparticles synthesized from plants. Internat. Nano Lett. 2020, 10, 237–248. [Google Scholar] [CrossRef]
  20. Food and Agriculture Organization. Citrus Fruit Statistical Compendium; FAO: Roma, Italy, 2020. [Google Scholar]
  21. Sivakavinesan, M.; Vanaja, M.; Lateef, R.; Alhadlaq, H.A.; Mohan, R.; Annadurai, G.; Ahamed, M. Risso peel mediated green synthesis of gold nanoparticles and its antioxidant and catalytic activity. J. King Saud. Univ. Sci. 2022, 34, 102235. [Google Scholar] [CrossRef]
  22. Ringwal, S.; Bartwal, A.S.; Sati, S.C. Photo–catalytic degradation of different toxic dyes using silver nanoparticles as photo–catalyst, mediated via peels extract. J. Indian Chem. Soc. 2021, 98, 100221. [Google Scholar] [CrossRef]
  23. Dutta, T.; Ghosh, N.N.; Das, M.; Adhikary, R.; Mandal, V.; Chattopadhyay, A.P. Green synthesis of antibacterial and antifungal silver nanoparticles using peel extract: Experimental and theoretical studies. J. Environm. Chem. Eng. 2020, 8, 104019. [Google Scholar] [CrossRef]
  24. Pagar, K.; Chavan, K.; Kasav, S.; Basnet, P.; Rahdar, A.; Kataria, N.; Oza, R.; Abhale, Y.; Ravindran, B.; Pardeshi, O.; et al. Bio–inspired synthesis of CdO nanoparticles using Citrus limetta peel extract and their diverse biomedical applications. J. Drug. Deliv. Sci. Technol. 2023, 82, 104373. [Google Scholar] [CrossRef]
  25. Fall, A.; Sackey, J.; Mayedwa, N.; Ngom, B.D. Investigation of structural and optical properties of CdO nanoparticles via peel of Citrus x sinensis. Mater. Today Proc. 2021, 36, 298–302. [Google Scholar] [CrossRef]
  26. Villegas–Fuentes, A.; Garrafa–Gálvez, H.E.; Quevedo–Robles, R.V.; Luque–Morales, M.; Vilchis–Nestor, A.R.; Luque, P.A. Synthesis of semiconductor ZnO nanoparticles using extract and the influence of concentration on their optical properties. J. Mol. Struct. 2023, 1281, 135067. [Google Scholar] [CrossRef]
  27. Gao, Y.L.; Xu, D.; Ren, D.; Zeng, K.F.; Wu, X.Y. Green synthesis of zinc oxide nanoparticles using peel extract and application to strawberry preservation: A comparison study. Food Sci. Techol. 2020, 126, 109297. [Google Scholar] [CrossRef]
  28. Wei, Y.F.; Fang, Z.Q.; Zheng, L.C.; Tan, L.; Tsang, E.P. Green synthesis of Fe nanoparticles using peels aqueous extracts. Mater. Lett. 2016, 185, 384–386. [Google Scholar] [CrossRef]
  29. Kumar, B.; Smita, K.; Galeas, S.; Sharma, V.; Guerrero, V.H.; Debut, A.; Cumbal, L. Characterization and application of biosynthesized iron oxide nanoparticles using peel: A sustainable approach. Inorg. Chem. Commun. 2020, 119, 108116. [Google Scholar] [CrossRef]
  30. Baglari, S.; Wary, R.R.; Kalita, P.; Baruah, M.B. Green synthesis of CuO nanoparticles using citrus maxima peel aqueous extract. Mater. Today Proc. 2023, in press. [Google Scholar] [CrossRef]
  31. Singh, S.; Maurya, I.C.; Tiwari, A.; Srivastava, P.; Bahadur, L. Green synthesis of TiO nanoparticles using juice extract as a bio–capping agent for enhanced performance of dye–sensitized solar cells. Surf. Interfaces 2022, 28, 101652. [Google Scholar] [CrossRef]
  32. Priyadarshini, E.; Pradhan, N. Gold nanoparticles as efficient sensors in colorimetric detection of toxic metal ions: A review. Sens. Actuators B Chem. 2017, 238, 888–902. [Google Scholar] [CrossRef]
  33. Kesharwani, P.; Ma, R.Y.; Sang, L.; Fatima, M.; Sheikh, A.; Abourehab, M.A.S.; Gupta, N.; Chen, Z.S.; Zhou, Y. Gold nanoparticles and gold nanorods in the landscape of cancer therapy. Mol. Cancer 2023, 22, 98. [Google Scholar] [CrossRef]
  34. Rossi, A.; Zannotti, M.; Cuccioloni, M.; Minicucci, M.; Petetta, L.; Angeletti, M.; Giovannetti, R. Silver Nanoparticle–Based Sensor for the Selective Detection of Nickel Ions. Nanomaterials 2021, 11, 1733. [Google Scholar] [CrossRef] [PubMed]
  35. Singh, H.; Bamrah, A.; Bhardwaj, S.K.; Deep, A.; Khatri, M.; Brown, R.J.C.; Bhardwaj, N.; Kim, K.H. Recent advances in the application of noble metal nanoparticles in colorimetric sensors for lead ions. Environ. Sci. Nano 2021, 8, 863–889. [Google Scholar] [CrossRef]
  36. Tripathi, R.M.; Park, S.H.; Kim, G.; Kim, D.H.; Ahn, D.; Kim, Y.M.; Kwon, S.J.; Yoon, S.Y.; Kang, H.J.; Chung, S.J. Metal–induced redshift of optical spectra of gold nanoparticles: An instant, sensitive, and selective visual detection of lead ions. Int. Biodeterior. Biodegrad. 2019, 144, 104740. [Google Scholar] [CrossRef]
  37. Ding, N.; Cao, Q.A.; Zhao, H.; Yang, Y.M.; Zeng, L.X.; He, Y.J.; Xiang, K.X.; Wang, G.W. Colorimetric Assay for Determination of Lead (II) Based on Its Incorporation into Gold Nanoparticles during Their Synthesis. Sensors 2010, 10, 11144–11155. [Google Scholar] [CrossRef] [PubMed]
  38. Sener, G.; Uzun, L.; Denizli, A. Colorimetric sensor array based on gold nanoparticles and amino acids for identification of toxic metal ions in water. ACS Appl. Mater. Interfaces 2014, 6, 18395–18400. [Google Scholar] [CrossRef] [PubMed]
  39. Qiu, J.Y.; Li, Z.H.; Miao, L.J.; Wang, H.S.; Zhang, Y.N.; Wu, S.S.; Zhang, Y.J.; Li, X.; Wu, A.G. Colorimetric detection of Ba, Cd and Pb based on a multifunctionalized Au NP sensor. Analyst 2019, 144, 5081–5089. [Google Scholar] [CrossRef]
  40. Lei, L.L.; Song, H.M.; Zhao, J.H.; Yang, Q.X.; Chen, Z.J. Preparation of gold nanoparticles using pyridine–formaldehyde as a reducing agent and its application in high sensitivity colorimetric detection of Pb. Anal. Methods 2019, 11, 4362–4369. [Google Scholar] [CrossRef]
  41. Yang, J.; Zhou, C.J.; Liu, C.; Li, Y.L.; Liu, H.B.; Li, Y.J.; Zhu, D.B. A dual sensor of fluorescent and colorimetric for the rapid detection of lead. Analyst 2012, 137, 1446–1450. [Google Scholar] [CrossRef]
  42. Chai, F.; Wang, C.A.; Wang, T.T.; Li, L.; Su, Z.M. Colorimetric Detection of Pb Using Glutathione Functionalized Gold Nanoparticles. Acs Appl. Mater. Inter. 2010, 2, 1466–1470. [Google Scholar] [CrossRef]
  43. Priyadarshini, E.; Pradhan, N. Metal–induced aggregation of valine capped gold nanoparticles: An efficient and rapid approach for colorimetric detection of Pb ions. Sci. Rep. 2017, 7, 9278. [Google Scholar] [CrossRef]
  44. Fakhri, N.; Hosseini, M.; Tavakoli, O. Aptamer–based colorimetric determination of Pb using a paper–based microfluidic platform. Anal. Methods 2018, 10, 4438–4444. [Google Scholar] [CrossRef]
  45. Nguyen, T.H.A.; Le, T.T.V.; Huynh, B.A.; Nguyen, N.V.; Le, V.T.; Doan, V.; Tran, V.A.; Nguyen, A.T.; Cao, X.T.; Vasseghian, Y. Novel biogenic gold nanoparticles stabilized on poly(styrene–co–maleic anhydride) as an effective material for reduction of nitrophenols and colorimetric detection of Pb(II). Environ. Res. 2022, 212, 113281. [Google Scholar] [CrossRef]
  46. Rizvi, A.H.; Aziz, M.A.; Naqvi, A.H.; Ahmad, A. Towards sustainable and selective detection of lead Ions: Assisted green synthesis of gold nanoparticles with tunable properties. J. Environ. Chem. Eng. 2023, 11, 110757. [Google Scholar] [CrossRef]
  47. Do Dat, T.; Cong, C.Q.; Nhi, T.L.; Khang, P.T.; Nam, N.T.H.; Tinh, N.T.; Hue, D.; Hieu, N.H. Green synthesis of gold nanoparticles using leave extract for lead ion detection, degradation of dyes, and bioactivities. Biochem. Eng. J. 2023, 200, 109103. [Google Scholar] [CrossRef]
  48. Krysa, M.; Szymanska–Chargot, M.; Zdunek, A. FT–IR and FT–Raman fingerprints of flavonoids—A review. Food Chem. 2022, 393, 133430. [Google Scholar] [CrossRef] [PubMed]
  49. Terenteva, E.A.; Apyari, V.V.; Dmitrienko, S.G.; Zolotov, Y.A. Formation of plasmonic silver nanoparticles by flavonoid reduction: A comparative study and application for determination of these substances. Spectrochim. Acta A 2015, 151, 89–95. [Google Scholar] [CrossRef]
  50. Ferreira, A.M.; Vikulina, A.; Loughlin, M.; Volodkin, D. How similar is the antibacterial activity of silver nanoparticles coated with different capping agents? RSC Adv. 2023, 13, 10542–10555. [Google Scholar] [CrossRef]
  51. Zhong, G.W.; Liu, J.X.; Liu, X.Y. A Fast Colourimetric Assay for Lead Detection Using Label–Free Gold Nanoparticles (AuNPs). Micromachines 2015, 6, 462–472. [Google Scholar] [CrossRef]
  52. Mao, X.; Li, Z.P.; Tang, Z.Y. One pot synthesis of monodispersed L–glutathione stabilized gold nanoparticles for the detection of Pb2+ions. Front. Mater. Sci. 2011, 5, 322–328. [Google Scholar] [CrossRef]
  53. Beqa, L.; Singh, A.K.; Khan, S.A.; Senapati, D.; Arumugam, S.R.; Ray, P.C. Gold Nanoparticle–Based Simple Colorimetric and Ultrasensitive Dynamic Light Scattering Assay for the Selective Detection of Pb(II) from Paints, Plastics, and Water Samples. ACS Appl. Mater. Interfaces 2011, 3, 668–673. [Google Scholar] [CrossRef]
  54. Sengan, M.; Kamlekar, R.K.; Veerappan, A. Highly selective rapid colorimetric sensing of Pb2+ ion in water samples and paint based on metal induced aggregation of N–decanoyltromethamine capped gold nanoparticles. Spectrochim. Acta A Mol. Biomol. Spectrosc. 2020, 239, 118485. [Google Scholar] [CrossRef] [PubMed]
Figure 1. UV–Vis spectra of AuNPs@OPE prepared (a) at different pHs, (b) with different quantities of OPE (50–250 µL), with the inset showing the change in color of the prepared nanoparticles and (c) FT–IR spectra of the OPE extract (yellow) and lyophilized AgNPs@OPE nanoparticles (blue).
Chemosensors 12 00033 g001
Figure 2. (a,b) SEM images at different magnifications, (c) size distribution analysis, and (d) EDX spectrum of AuNPs@OPE.
Chemosensors 12 00033 g002
Figure 3. DLS analysis of AuNPs@OPE.
Chemosensors 12 00033 g003
Figure 4. Schematic presentation of the AuNPs@OPE colorimetric mechanism for the detection of Pb2+.
Chemosensors 12 00033 g004
Figure 5. (a) UV–Vis spectra of AuNPs@OPE with different cations at the same concentration (50 μM); (b) DLS analysis of AuNPs@OPE with Pb2+ ions (50 μM) with inset showing the color changes in AuNPs@OPE colloidal solutions before and after the addition of Pb2+ ions (50 μM) at different times.
Chemosensors 12 00033 g005
Figure 6. (a) UV–Vis spectra and (b) absorbance ratio with the increasing concentration of Pb2+ ions up to 58 µM.
Chemosensors 12 00033 g006
Figure 7. (a) Hill’s plot for AuNPs@OPE with increasing concentrations of Pb2+; (b) calibration line of Pb2+ sensor based on AuNPs@OPE in the range from 9.9 to 33.8 µM of Pb2+ ions.
Chemosensors 12 00033 g007
Figure 8. (a) UV–Vis spectra and (b) absorbance ratio with the increasing concentration of Pb2+ ions from 0 to 9.90 µM.
Chemosensors 12 00033 g008
Table 1. Comparison of LOD values of the proposed method with other published papers for the determination of Pb2+ in water samples.
Capping/Functionalization AgentLinear RangeLODRef.
Sodium citrate10–100 µM18 µM[36]
Gallic acid50 nM–1 µM25 nM[37]
11–Mercaptoundecanoic acid2–50 µM2 µM[38]
3–Mercaptonicotinic acid 4–aminobenzo–18crown–6--50 nM[39]
Pyridine–formaldehyde1–6 µM1 µM[40]
Tetra–n–octylammonium bromide--0.5 µM[41]
GSH0.1–10 µM100 nM[42]
Valine--96.5 µM[43]
T– and G–rich aptamers--0.57 µM[44]
N–decanoyl–tromethamine--350 nM[54]
Poly(styrene–co–maleic anhydride)--30 nM[45]
Selaginella bryopteris plant extract10–60 µM0.24 µM[46]
Andrographis paniculata leave extract0–10012.66 µM[47]
OPE extract9.9–33.8 µM (15 min)
0.8–9.9 µM (90 min)
13.31 µM
0.05 µM
This work
Table 2. Determination of Pb2+ in water samples by the proposed method.
SamplesPb2+ Added (µM)A614nm/A530nmRecovery (µM)Recovery
%
Water 1 (15 min)150.38514.56697.11
Water 2 (15 min)200.45720.257101.29
Water 1 (15 min)280.54627.33897.64
Water 2 (15 min)330.60832.19897.75
Water 1 (90 min)90.3899.160101.78
Water 2 (90 min)30.3413.433114.33
Disclaimer/Publisher’s Note: The statements, opinions and data contained in all publications are solely those of the individual author(s) and contributor(s) and not of MDPI and/or the editor(s). MDPI and/or the editor(s) disclaim responsibility for any injury to people or property resulting from any ideas, methods, instructions or products referred to in the content.

