Article

Hydrogen Sensing Properties of FET-Type Sensors with Pt-In2O3 at Room Temperature

1
School of Information Science and Engineering, Shenyang University of Technology, Shenyang 110870, China
2
School of Electrical Engineering, Nanjing Vocational University of Industry Technology, Nanjing 210023, China
3
Department of Electrical and Computer Engineering and Inter-University Semiconductor Research Center (ISRC), Seoul National University, Seoul 08826, Republic of Korea
*
Author to whom correspondence should be addressed.
Chemosensors 2024, 12(3), 32; https://doi.org/10.3390/chemosensors12030032
Submission received: 2 February 2024 / Revised: 17 February 2024 / Accepted: 22 February 2024 / Published: 24 February 2024

Abstract

:
In this paper, a field effect transistor (FET)-type sensor with Pt-decorated In2O3 (Pt-In2O3) nanoparticles is fabricated for detecting H2 gas at room temperature. A pulsed measurement method is adopted to continuously alternate between pre-biasing the gate and reading the drain current of the FET-type sensor. This method effectively reduces the drift in the sensing signal. It is also found that negative pre-bias voltages can dramatically shorten the recovery time of the sensor after sensing H2, while positive pre-bias voltages have the opposite effect. The H2 sensing performance of the sensor is characterized under the enhancement of a pulsed negative pre-bias. By calculating and comparing the root mean square, signal-to-noise ratio, and detection limit of the sensor under different operating regions, it is found that the sensor has the best sensing performance in the subthreshold region, which is suggested to be the optimum operating region for FET-type sensors. In addition, the presence of oxygen significantly consumes the hydrogen molecules and reduces the room-temperature H2 sensitivity of the sensor. The proposed sensor presents promising H2 sensing properties, and this research could be a guide for the use of FET-type sensors in more gas detection applications.

1. Introduction

Hydrogen is a promising energy carrier because it has a high calorific value and nonpolluting combustion products (water) [1,2,3]. It has been widely developed for the applications in vehicle energy and aviation fuel [4,5]. However, H2 is also one of the most dangerous inflammable and explosive gases under normal temperature and pressure, and requires strict monitoring for its safe use and storage. Therefore, the manufacture of reliable hydrogen detectors and controllers that operate at room temperature is required, while ensuring safety and a low power consumption.
Up to now, a lot of effort has been put into developing novel nanoscale metal oxide semiconductors for H2 detection at low temperature, as nanostructures have an ultrahigh surface-to-volume ratio that provides more active centers for surface reactions [6]. In addition, noble metals, such as Pt, Pd, and Au, have been utilized to decorate the nano metal oxides, since their catalytic effect can promote the dissociation of gas molecules and further enhance the gas-sensitive properties at room temperature [7]. Jieting Zhao et al. reported that Pt-SnO2 prepared using a solution reduction method exhibited a response of up to 9700 (resistance ratio) for 1% H2 at room temperature [8]. Riya Wadhwa et al. used Pt-modified MoS2 flacks to achieve a significant resistivity change (23% at 50 ppm H2) at low hydrogen concentrations (0.5–50 ppm) at room temperature, which the authors attributed to the Pt NP-induced H2 spillover effect [9]. Among the metal oxide semiconductors, In2O3 has attracted attention because of its high electrical conductivity, large band gap, and easy synthesis [10,11,12]. Sensors based on nanostructured In2O3 with different morphologies have been reported for H2 detection at relatively low temperatures [13,14]. These sensors are based on changes in the resistance of In2O3 with a variation in H2 concentration, which might be limited by problems such as large sensing areas and a high energy consumption. Recently, there has been an increasing interest in field effect transistor (FET)-type sensors because they are compatible with standard CMOS technology [15,16]. They can be integrated with other functional circuits on the same chip for complex, high-precision gas species identification and concentration detection. Consequently, it is possible to scale down the size of the sensors, reduce the power consumption, and fabricate sensors in a reproducible way, meeting the requirements for miniaturized, integrated, and intelligent sensors [17,18].
In an FET-type gas sensor, the sensing material can be used as a channel or a gate. When the sensing material serves as the channel of the FET, which is known as a TFT sensor, the sensing mechanism is similar to that of a resistive device, but the gas adsorption and desorption generates significant noise [19]. When the sensing material is used as the gate of the FET, the change in gas concentration will regulate the work function of the sensing material and thus indirectly control the electron concentration in the channel, producing a sensing current signal. This sensing principle and sensor structure can effectively suppress noise and prevent contamination during the production of sensing materials [20]. In this case, the importance of the resistivity of the sensing material comes to the fore. This is because a high resistance means significant delays and energy consumption, which can be fatal for large sensing systems. As a result, semiconductor materials with a high conductivity, such as In2O3, are more suitable for the application of FET sensors. Although FET sensors offer so many advantages, there is still a need for more in-depth exploration of how to solve the signal drift that FETs are prone to, further reduce the temperature of H2 sensing and efficiently improve the H2 sensing characteristics of FET-type sensors.
In this work, nanoscale In2O3 decorated by Pt (Pt-In2O3) is used to serve as the sensitive gate. The sensing material is deposited on the FET platform in the final step of sensor fabrication by using an inkjet printing process that is highly compatible with CMOS processes. The operating temperature is reduced to room temperature by the Pt decoration. A pulse measurement method is proposed for the sensor to suppress common signal drift problem in FETs and improve the recovery rate of the sensor. Moreover, the effect of oxygen in room-temperature H2 sensing is also discussed.

2. Materials and Methods
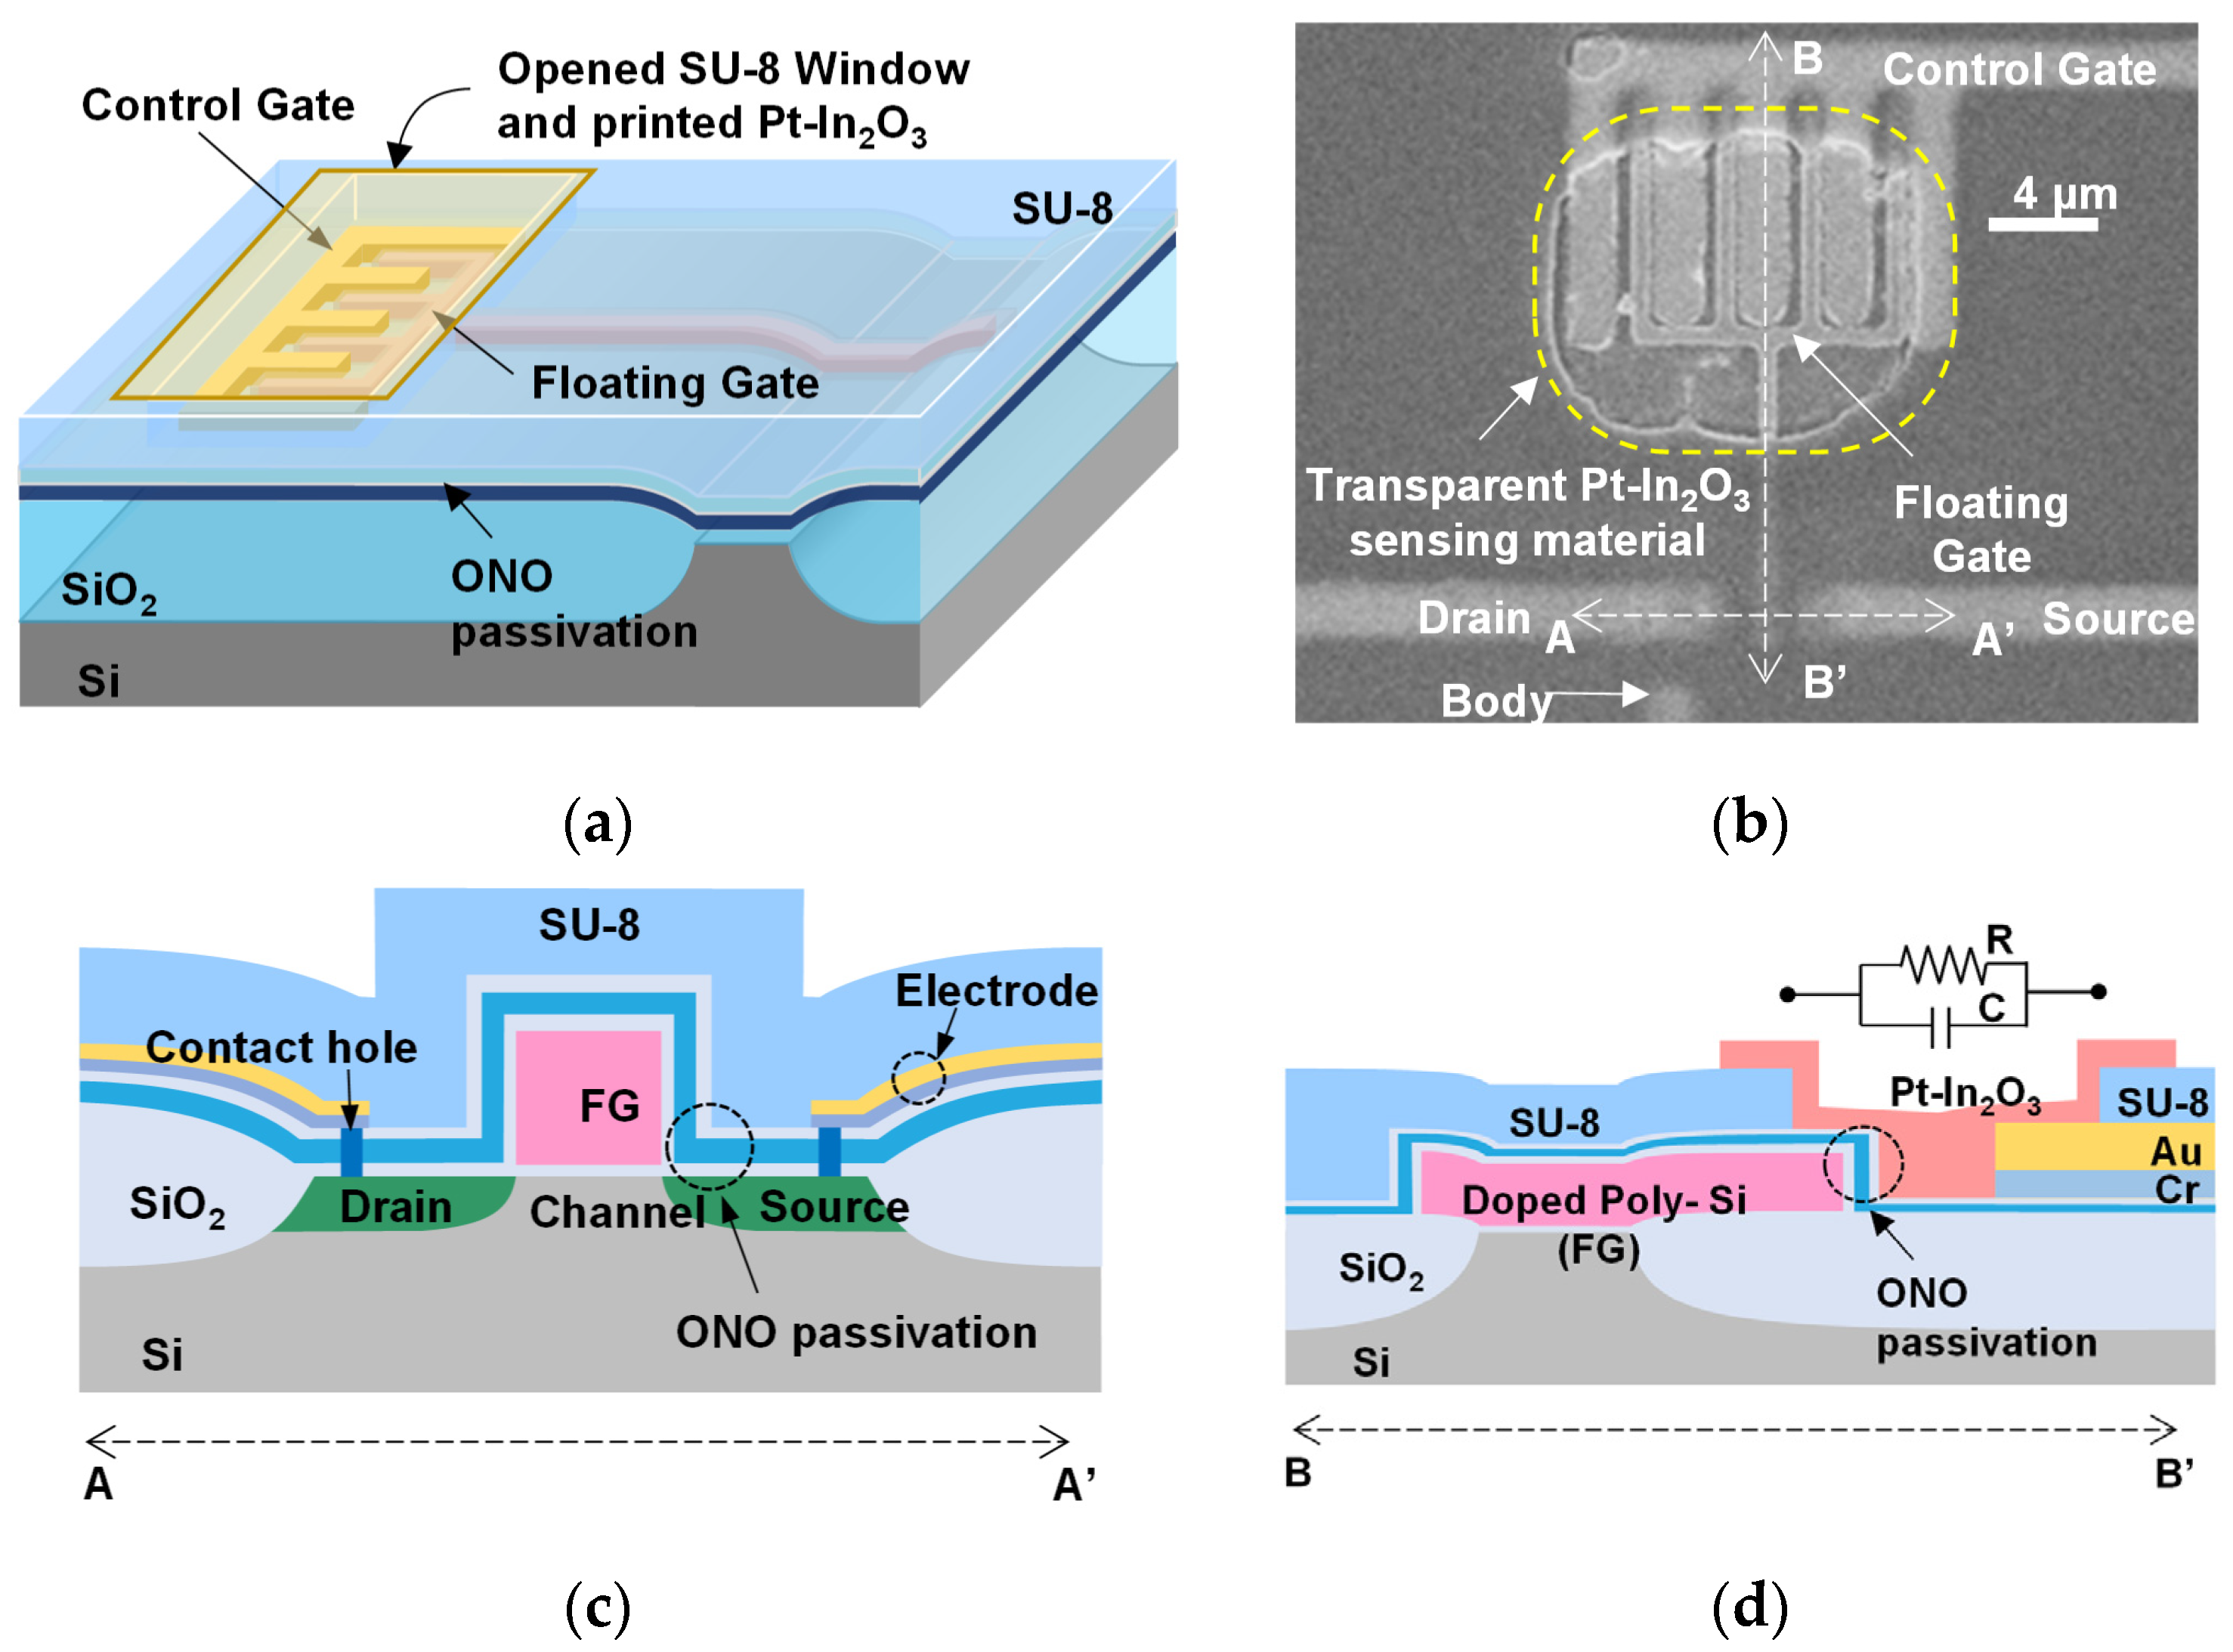
2.1. FET Platforms

Figure 1 shows the SEM images and the schematic diagrams of the FET-type sensor. The sensor has four electrodes, including a drain, body, source, and control gate (CG), and an n+ polysilicon floating gate (FG) passivated by a SiO2/Si3N4/SiO2 (ONO) insulator stack. One end of the FG is located above the channel for controlling the concentration of carriers in the channel, and the other end extends 10 μm away from the channel to be capacitively coupled with the interdigitated CG. The sensing material is deposited on top of the coupling region of the two gates, which is enclosed by the dashed line in Figure 1b. The channel length and width of the FET platform are 2 μm and 2.4 μm, respectively. Figure 1c,d present the schematic diagram of the cross-section along A-A′ and B-B′ in Figure 1b. Due to the unique FG structure, the channels and oxides are effectively insulated from contaminants and molecules from the deposition of sensing materials as well as from the air.
In this paper, a pMOSFET platform is adopted because it has lower 1/f noise than the nMOSFET [21]. The fabrication of FET substrates began with 6-inch n-type single-crystal silicon wafers. The active regions of the FET platforms were defined and separated by field oxides using the local oxidation of silicon process. Buried channels were formed using the ion implantation process to reduce the carrier scattering at the interface between the channel and the gate oxide, thereby reducing the noise of the FET. A gate oxide of 10 nm was grown via dry oxidation, followed by the deposition and patterning of 350 nm-thick in situ n+-doped polysilicon as the CG. After forming the source and drain regions using ion implantation, layers of SiO2 of 10 nm, Si3N4 of 20 nm, and SiO2 of 10 nm were sequentially deposited on the wafer, i.e., ONO passivation, as shown in Figure 1. The ONO passivation layer protects the active region and the FG of the FET, which further reduces noise and increases the lifetime of the sensor. After defining the contact holes via photolithography, metal stacks consisting of 30 nm-thick Cr and 50 nm-thick Au were deposited and patterned through the lift-off process to form the CG, drain, source, and body electrodes. At this point, the structure of the FET was essentially complete. However, to further protect the FET from contamination during the fabrication of sensing materials, a final SU-8 passivation layer was spin-coated on the wafer and patterned via the photolithographic process, exposing only the coupled FG-CG region, i.e., the opened SU-8 window in Figure 1a, as well as all contact pads.

2.2. Sensing Materials

The Pt-In2O3 sensing material was deposited on top of the SU-8 window via an inkjet printing process. The ink was formulated using In2O3 nanopowders (≤100 nm diameter) and 8 wt% H2PtCl6 (in H2O), all of which were purchased from Sigma-Aldrich (USA). Firstly, In2O3 nanopowders were ultrasonically dispersed in ethanol (99%) at room temperature. The original H2PtCl6 solution was further diluted to the desired concentration with deionized water and then mixed with the prepared In2O3 suspension to serve as the ink. After printing (Omni Jet 100), a two-hour annealing process at 300 °C in air was conducted to fully evaporate the solvent from the Pt-In2O3 sensing layer. The weight concentration (wt.%) of Pt was set to be 2%, 5% and 10%.

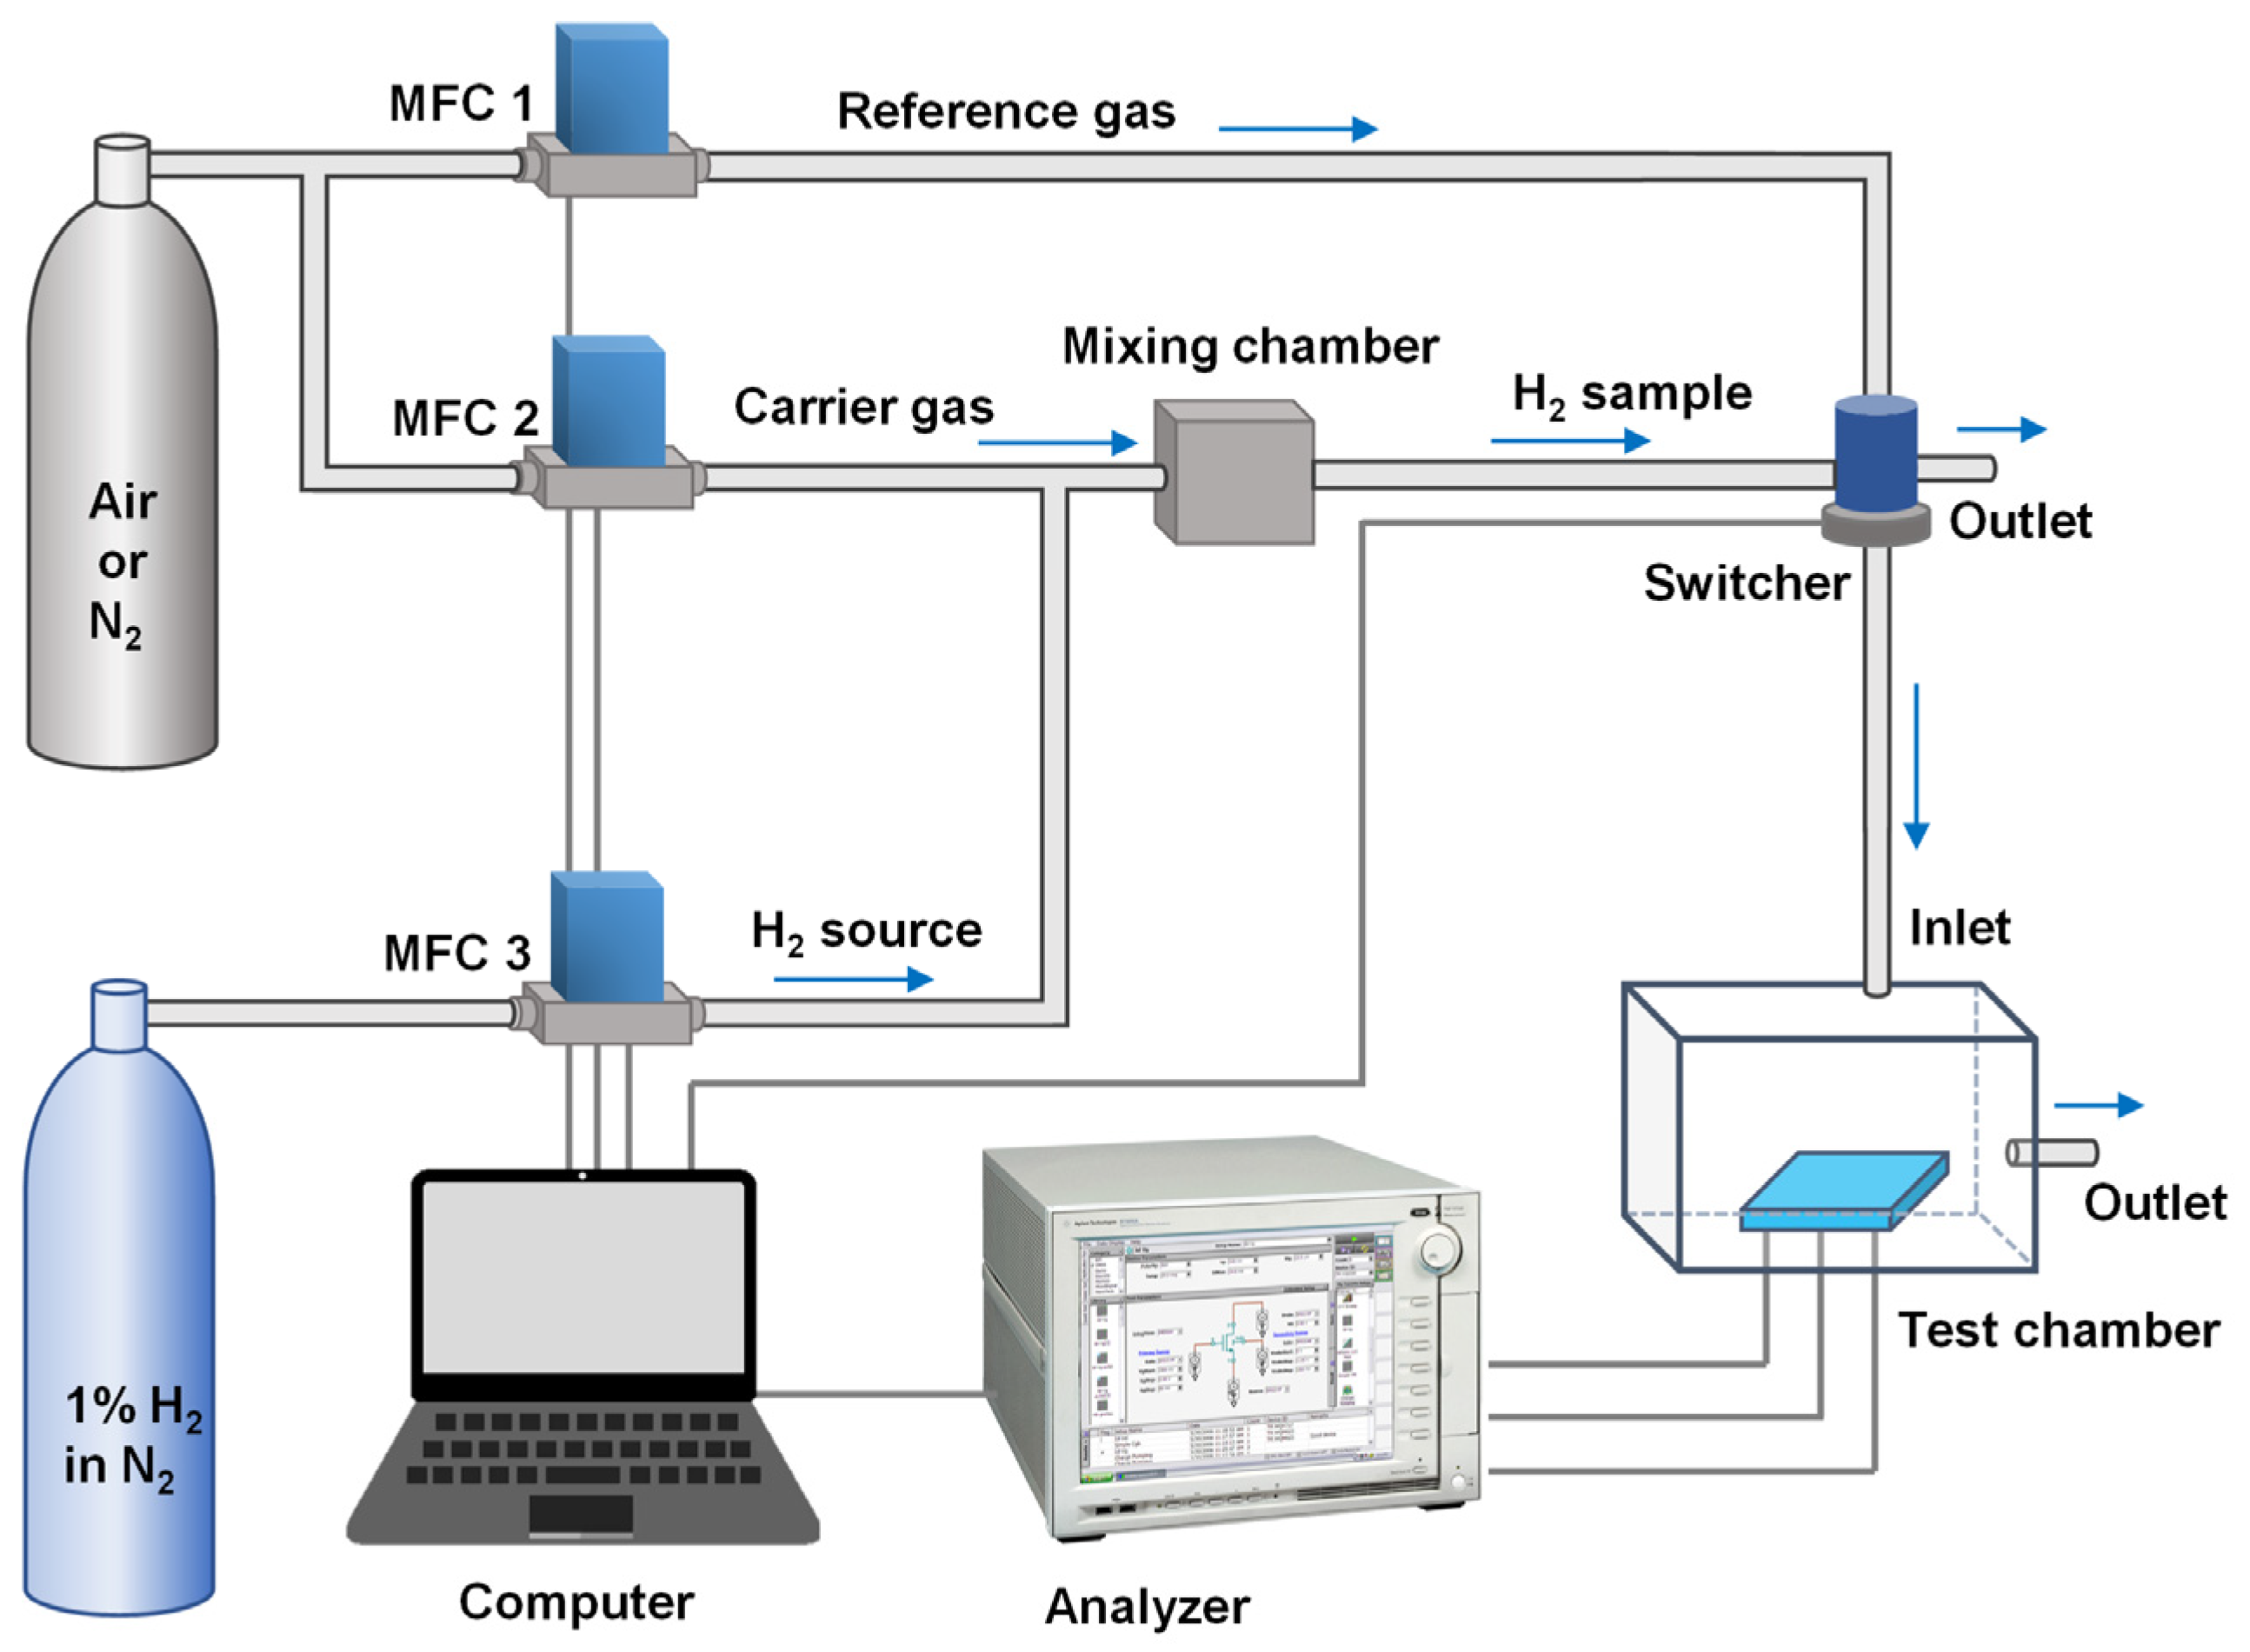
2.3. Measurement Setups

Figure 2 presents the experimental setup. During characterization of the hydrogen sensing performance of the sensor, dry synthetic air (20 vol.% of O2 and 80 vol.% of N2) was used as the reference and carrier gas to simulate the detection of H2 leaks in air environments. Hydrogen samples of various concentrations were prepared by mixing 1% H2 diluted in N2 (with an uncertainty of 2%) with synthetic air with MFC 3 and MFC 2; at the beginning, a reference gas of 400 sccm controlled by MFC 1 was blown onto the sensor, and when the tests of the gas concentration response were initiated, the reference gas was switched to a hydrogen sample of a certain concentration at 400 sccm. In addition, the effect of O2 on the H2 detection characteristics was also investigated in this paper. During this test, the reference and carrier gases were all replaced with N2, and the H2 sensing characteristic tests were repeated. All tests were conducted using an Agilent B1500A at room temperature.

3. Results and Discussion

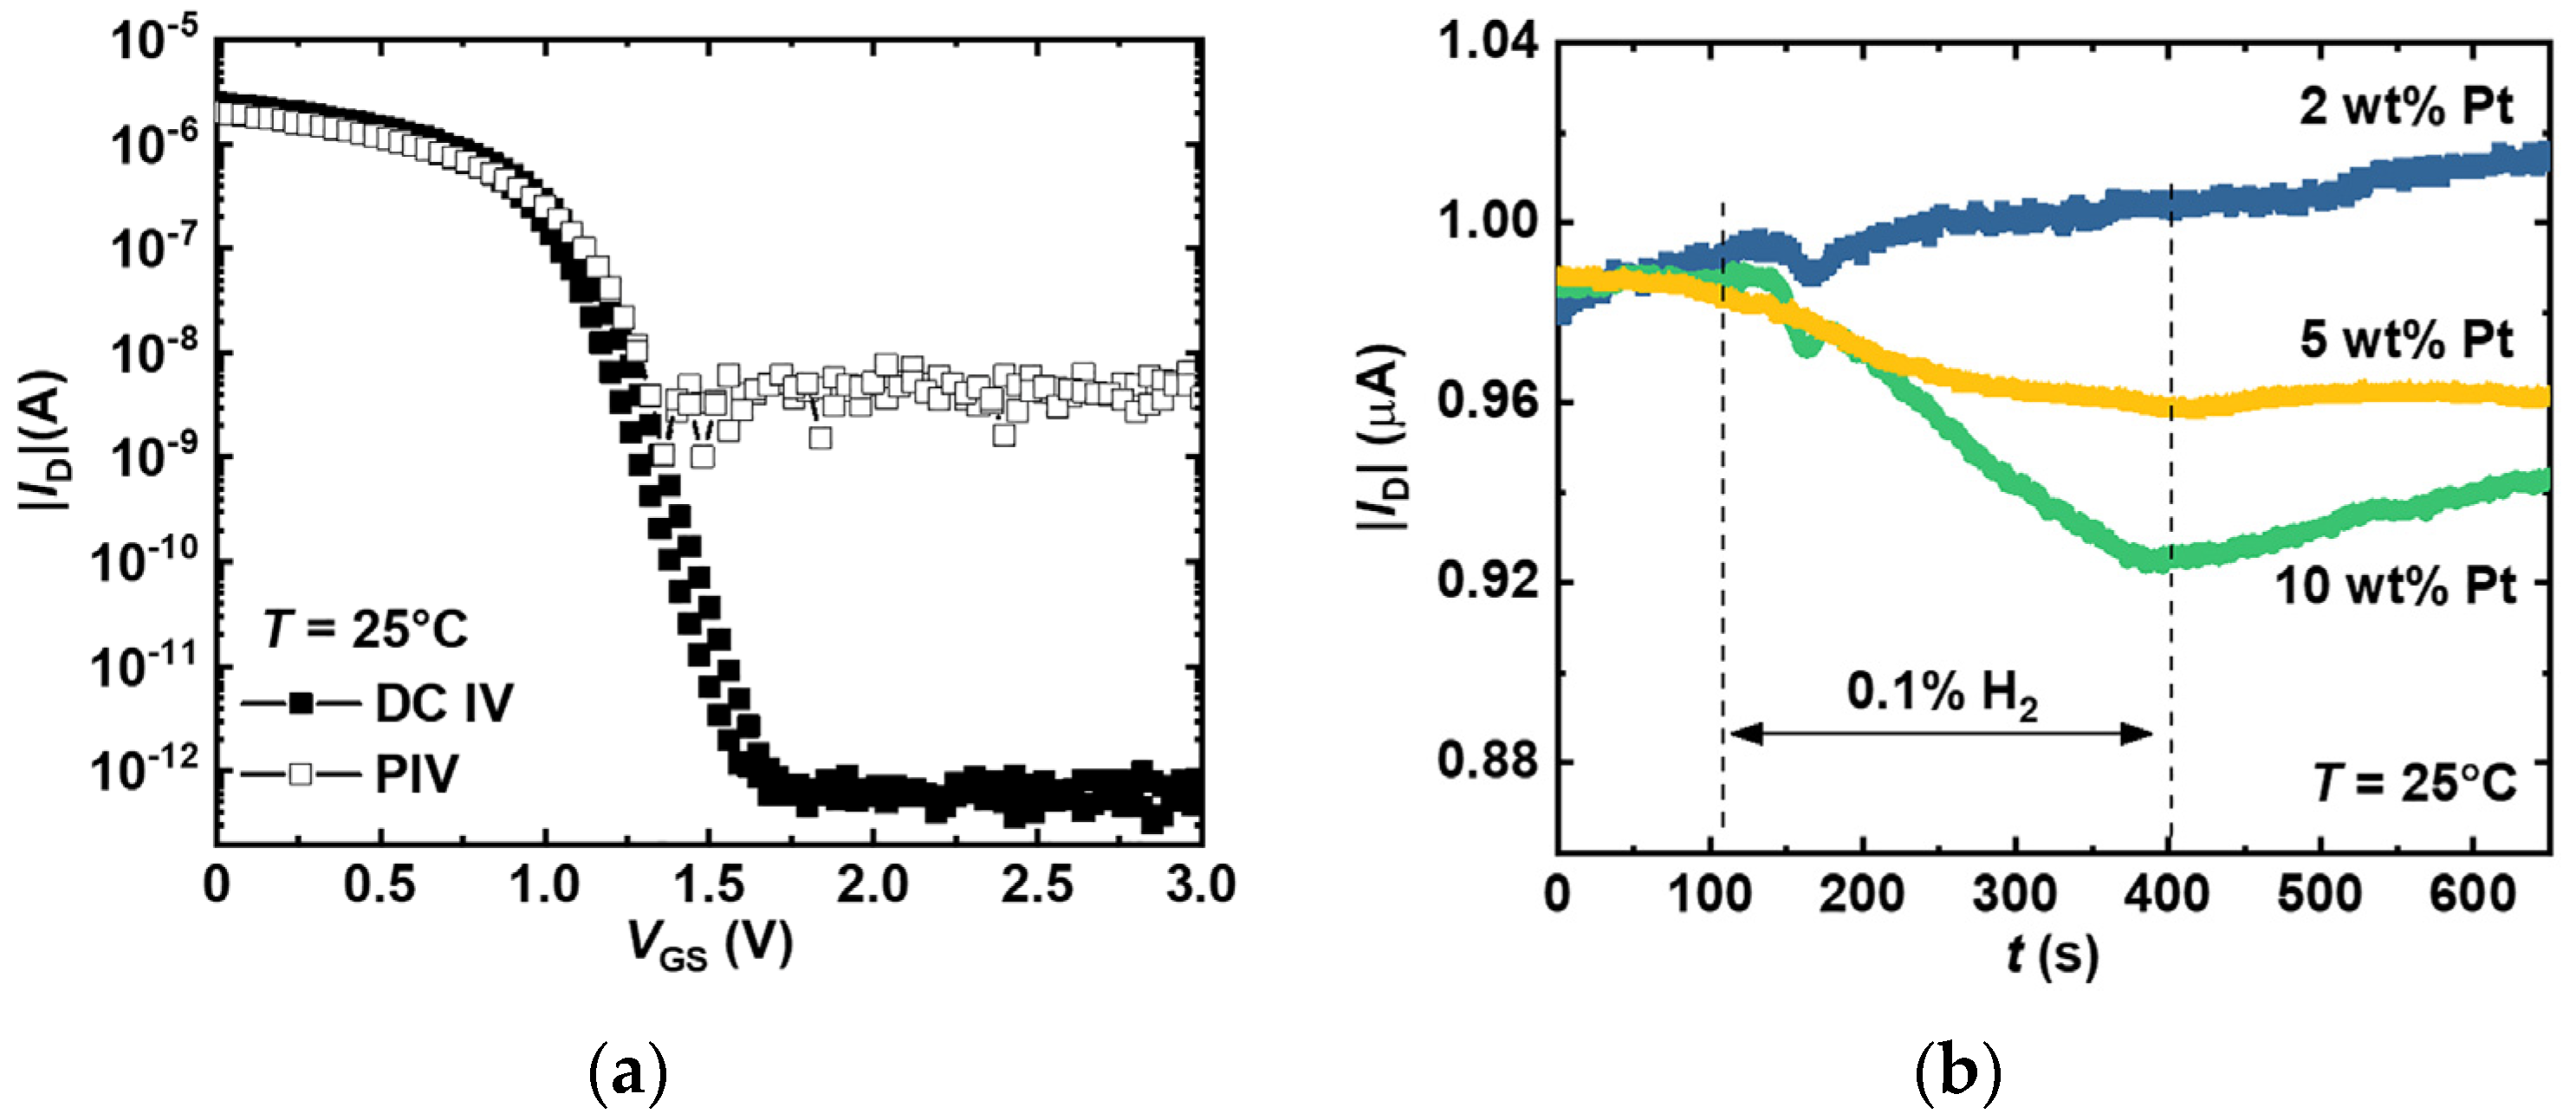
3.1. Pt Concentration Impact

The basic electrical and sensing properties of the FET-type sensor are shown in Figure 3. Figure 3a shows the double-sweep pulsed IV (PIV) and DC IV curves measured at room temperature. Figure 3b illustrates the response of the sensor with different Pt concentrations (2 wt.%, 5 wt.% and 10 wt.%) to 0.1% H2 when a DC bias was applied to the electrodes. The response (R) of the sensor is defined as the following (Equation (1)):
R e s p o n s e = I D _ B I D _ G I D _ B × 100 %
where ID_B and ID_G denote the drain currents of the sensors when exposed to the reference gas and to the H2 target gas mixture, respectively. It can be visualized from Figure 3b that the response of the sensor to the H2 gas increases with an increasing Pt concentration in the sensing layer, and the response becomes negligible when the Pt concentration is set to 2 wt.%.
Moreover, all three sensors with different Pt concentrations presented current drift, which affected the H2 sensing accuracy. This phenomenon can be attributed to charge traps in the In2O3 nanoparticles and their interfaces, corresponding to the hysteresis in the DC IV in Figure 3a.

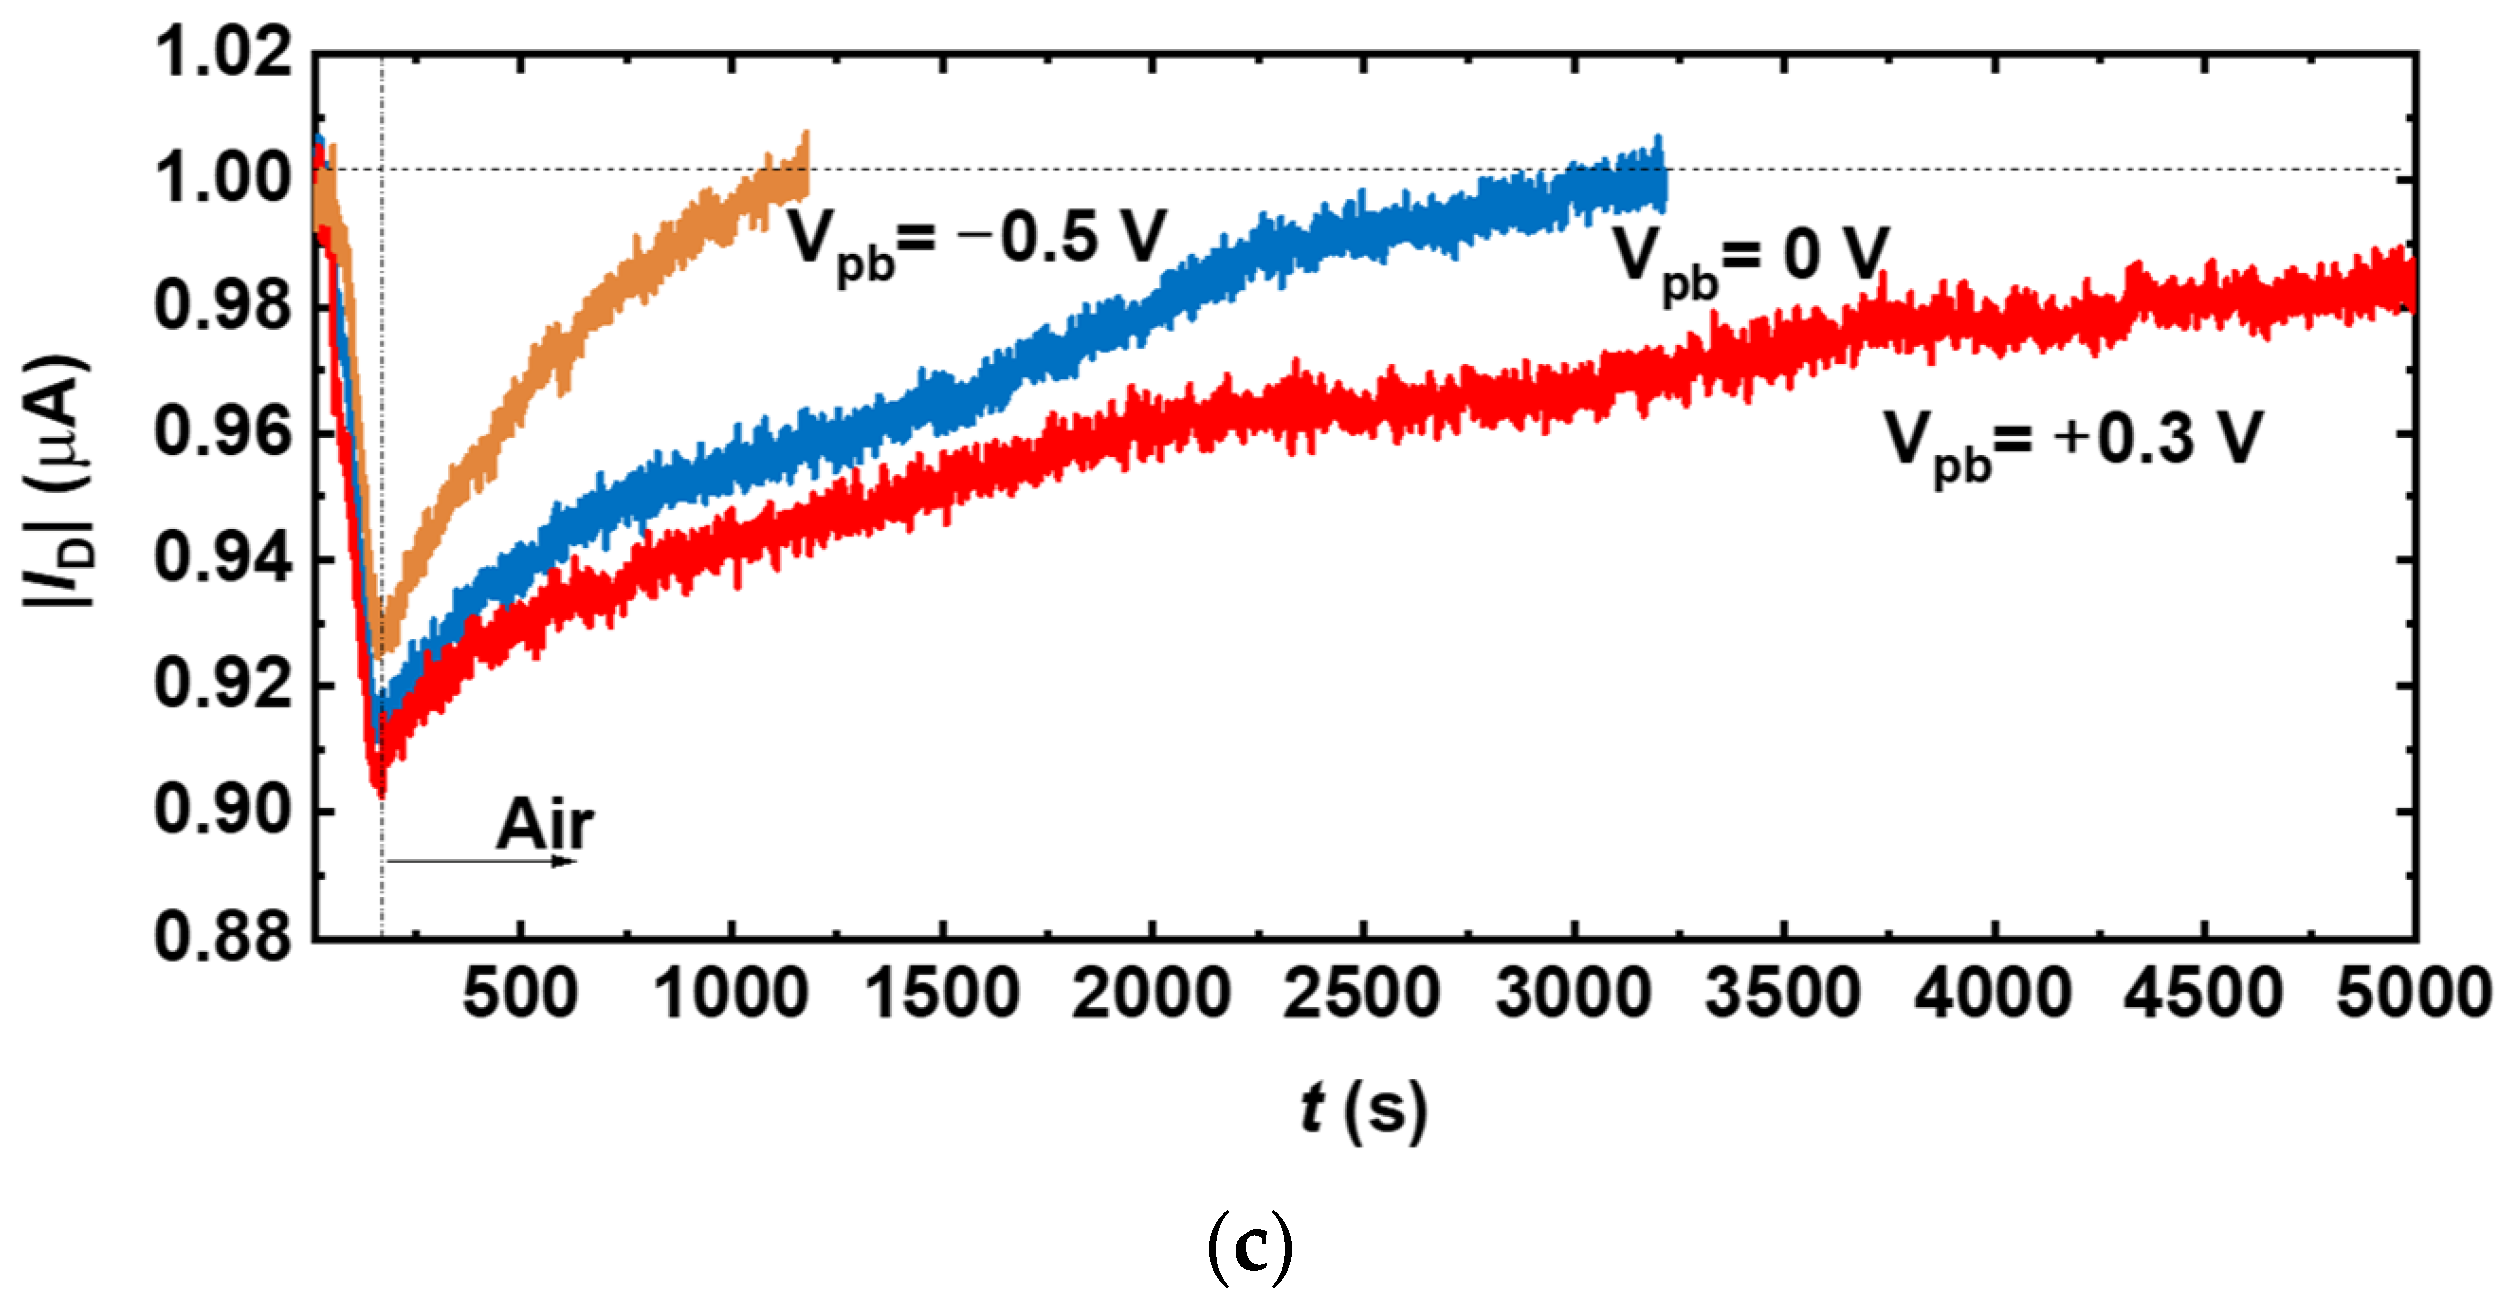
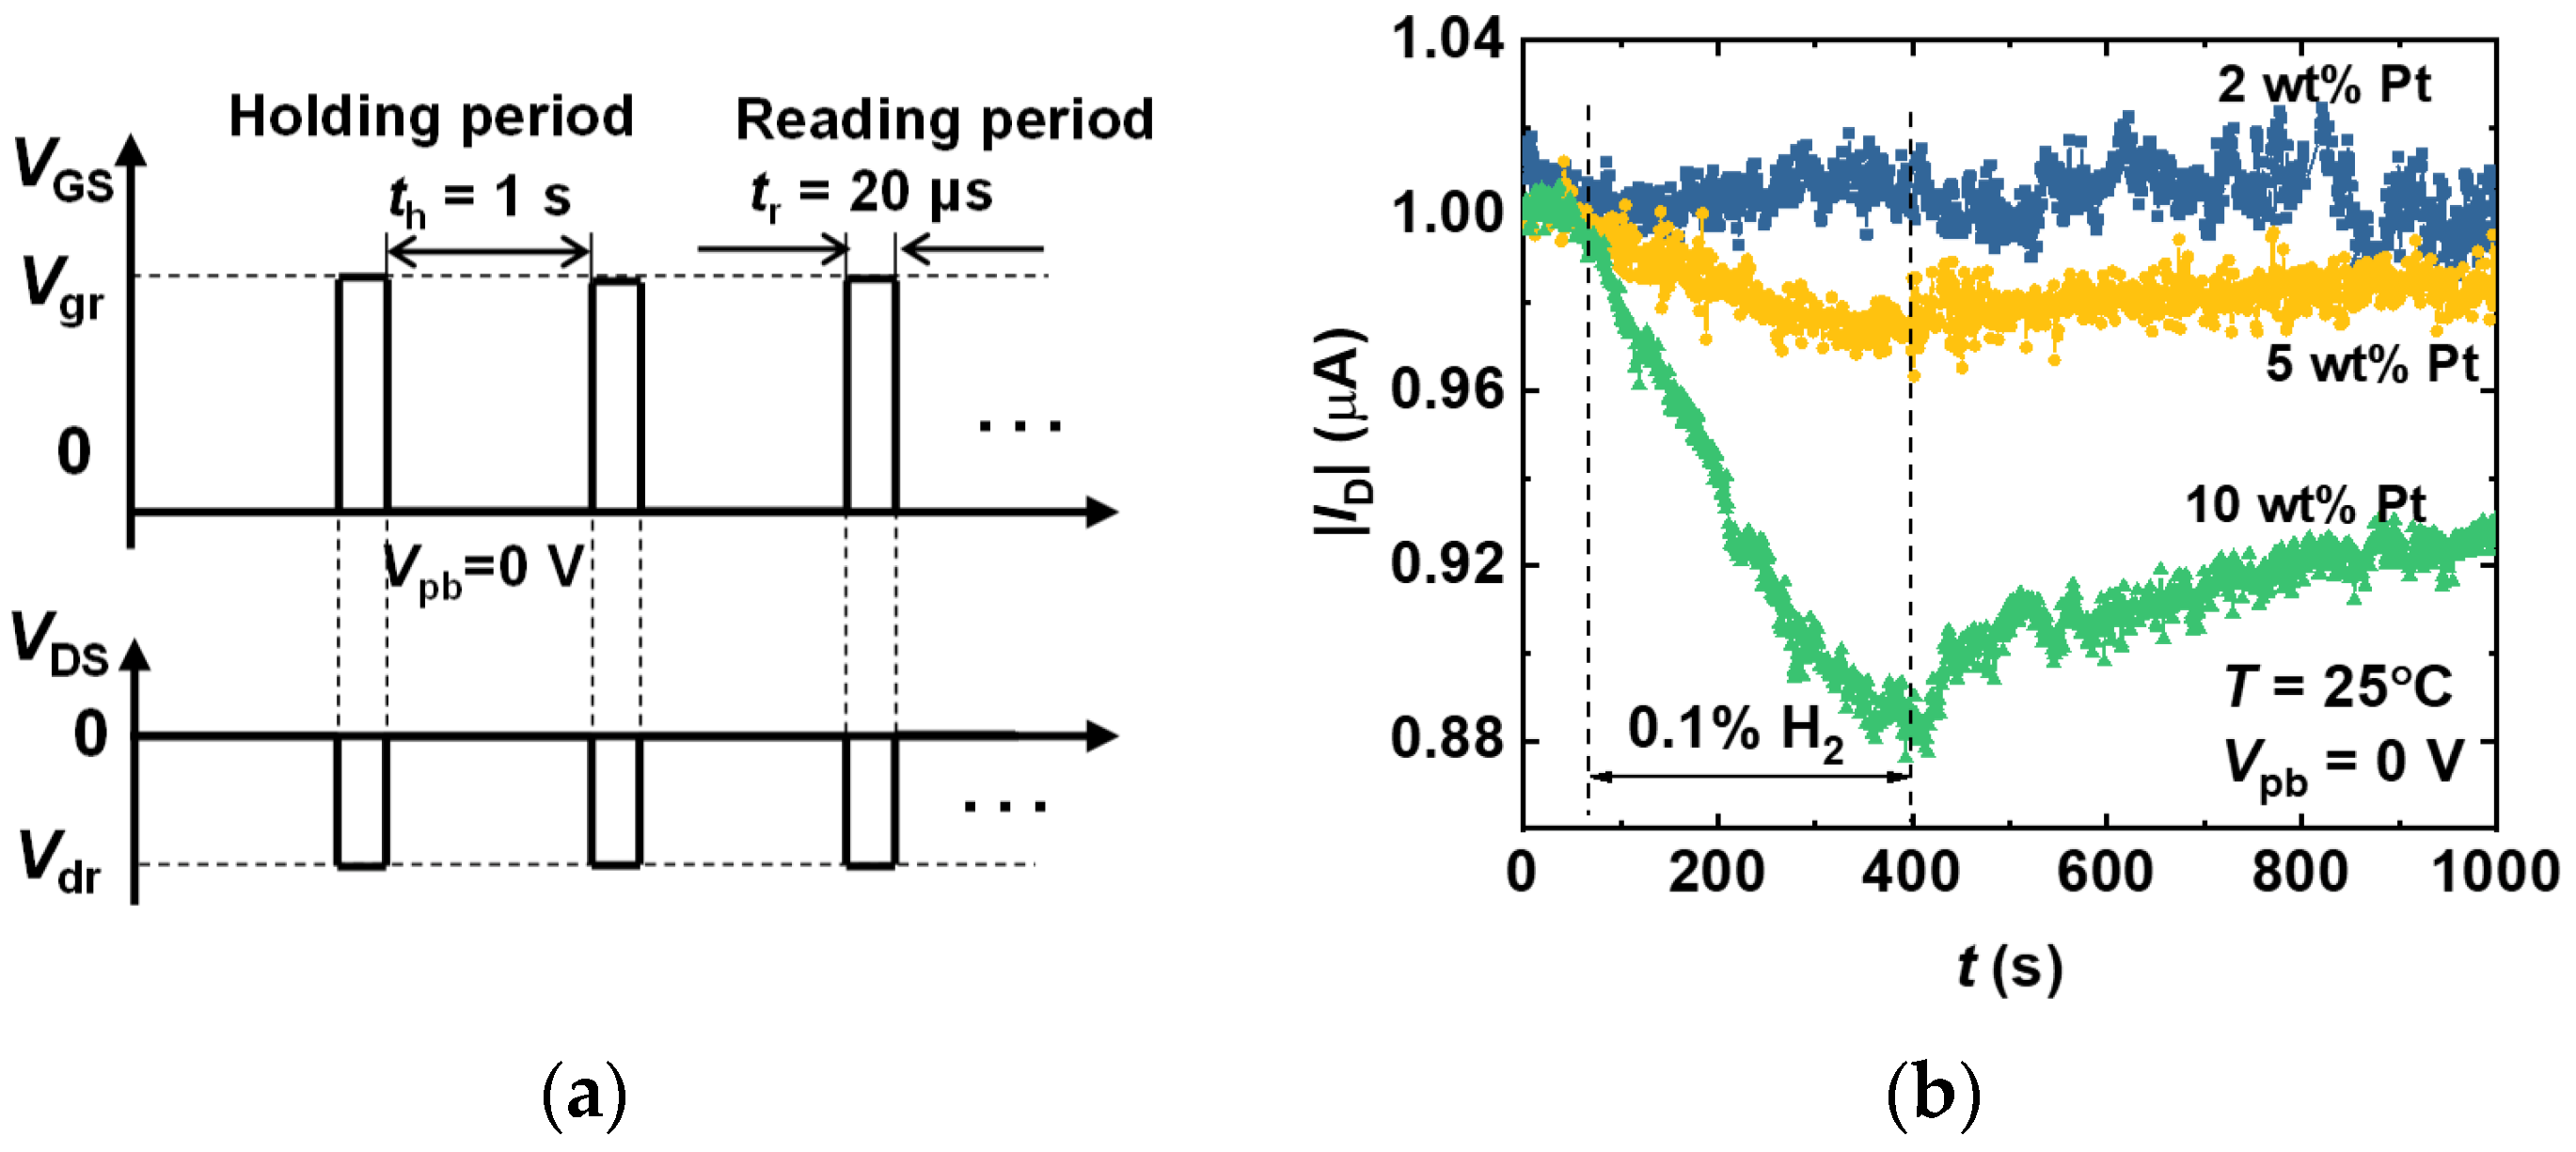
3.2. Pulse Measurement

To suppress the current drift, a pulse biasing scheme that continuously alternated between pre-biasing the gate and reading the drain current of the FET-type sensor was designed, as shown in Figure 4. Figure 4a shows the pulse schemes applied to CG (upper) and D (lower) electrodes. The pulse cycle of the scheme was divided into a holding phase (th) and a reading phase (tr). During th, a prebias voltage (Vpb) was applied to the CG, which equals zero in Figure 4 (VCG = Vpb = 0 V), and the D was grounded (VDS = 0 V). In this period, the drain current was not recorded, so unwanted power consumption was removed. During the tr phase, the VCG and VD values were simultaneously set to Vgr and Vdr, respectively, and the drain current values were recorded to form a discontinuous sensing signal. Here, th and tr were set to 1 s and 20 µs, respectively. In Figure 4b, transient responses of the FET-type sensors are plotted as a parameter of Pt wt.% at room temperature. The drift caused by charge trapping is eliminated, since tr is applied for a shorter duration than the charge trapping time. The results illustrate that the sensor based on a 10 wt% Pt sensing layer has the highest hydrogen response.
Figure 4c demonstrates the effect of the polarity of Vpbs on the H2 sensitivity characteristics of the sensor with 10 wt% Pt. The dynamic response of the sensor to 0.1% H2 was tested at a Vpbs of −0.5 V and +0.3 V, separately, and compared with the result at a Vpb of 0 V. The response time is defined as |ID|, reaching 90% of the maximum change under H2 gas exposure, and the recovery time is defined as |ID|, falling to 90% of the difference between the maximum current and the baseline. The recovery times of the sensor after 0.1% H2 exposure at a Vpbs of −0.5 V, 0 V and +0.3 V are about 700 s, 2000 s and 5000 s, respectively. That is, a Vpb of −0.5 V significantly speeds up sensor recovery. Meanwhile, the response at a Vpb of −0.5 V decreases by 14% compared to that at a 0 V pre-bias, and the response at a Vpb of +0.3 V increased by 9.3% compared to that at a 0 V pre-bias. This suggests that the effect of pre-bias on the response is relatively small compared to the recovery time. The response time and recovery time of the sensor at a Vpbs of −0.5 V (results in Figure 4c) were also compared to those of some typical FET-type sensors reported recently [22,23,24,25], which are shown in Table S1 of the Supplementary Material. In consideration, negative pre-biases were chosen to enhance the sensing characteristics in the later tests.
It is worth mentioning that in our previous study, the negative bias voltage had a similar effect on SnOx, which accelerated the recovery of SnOx after sensing the reducing gas H2S [16]. We attributed this to the fact that the negative bias modulates the energy band bending of the SnOx surface, allowing oxygen molecules to chemisorb more quickly on the surface of the sensing material during the recovery process. However, unlike previous studies, the sensing material in this paper is In2O3 modified with Pt. Although both In2O3 and SnOx are n-type semiconductor materials, the sensing process of the sensor in this paper involves complex catalysis under the modification of Pt. Therefore, the mechanism for the effect of the pre-bias voltage in this study needs to be studied further in continued research.

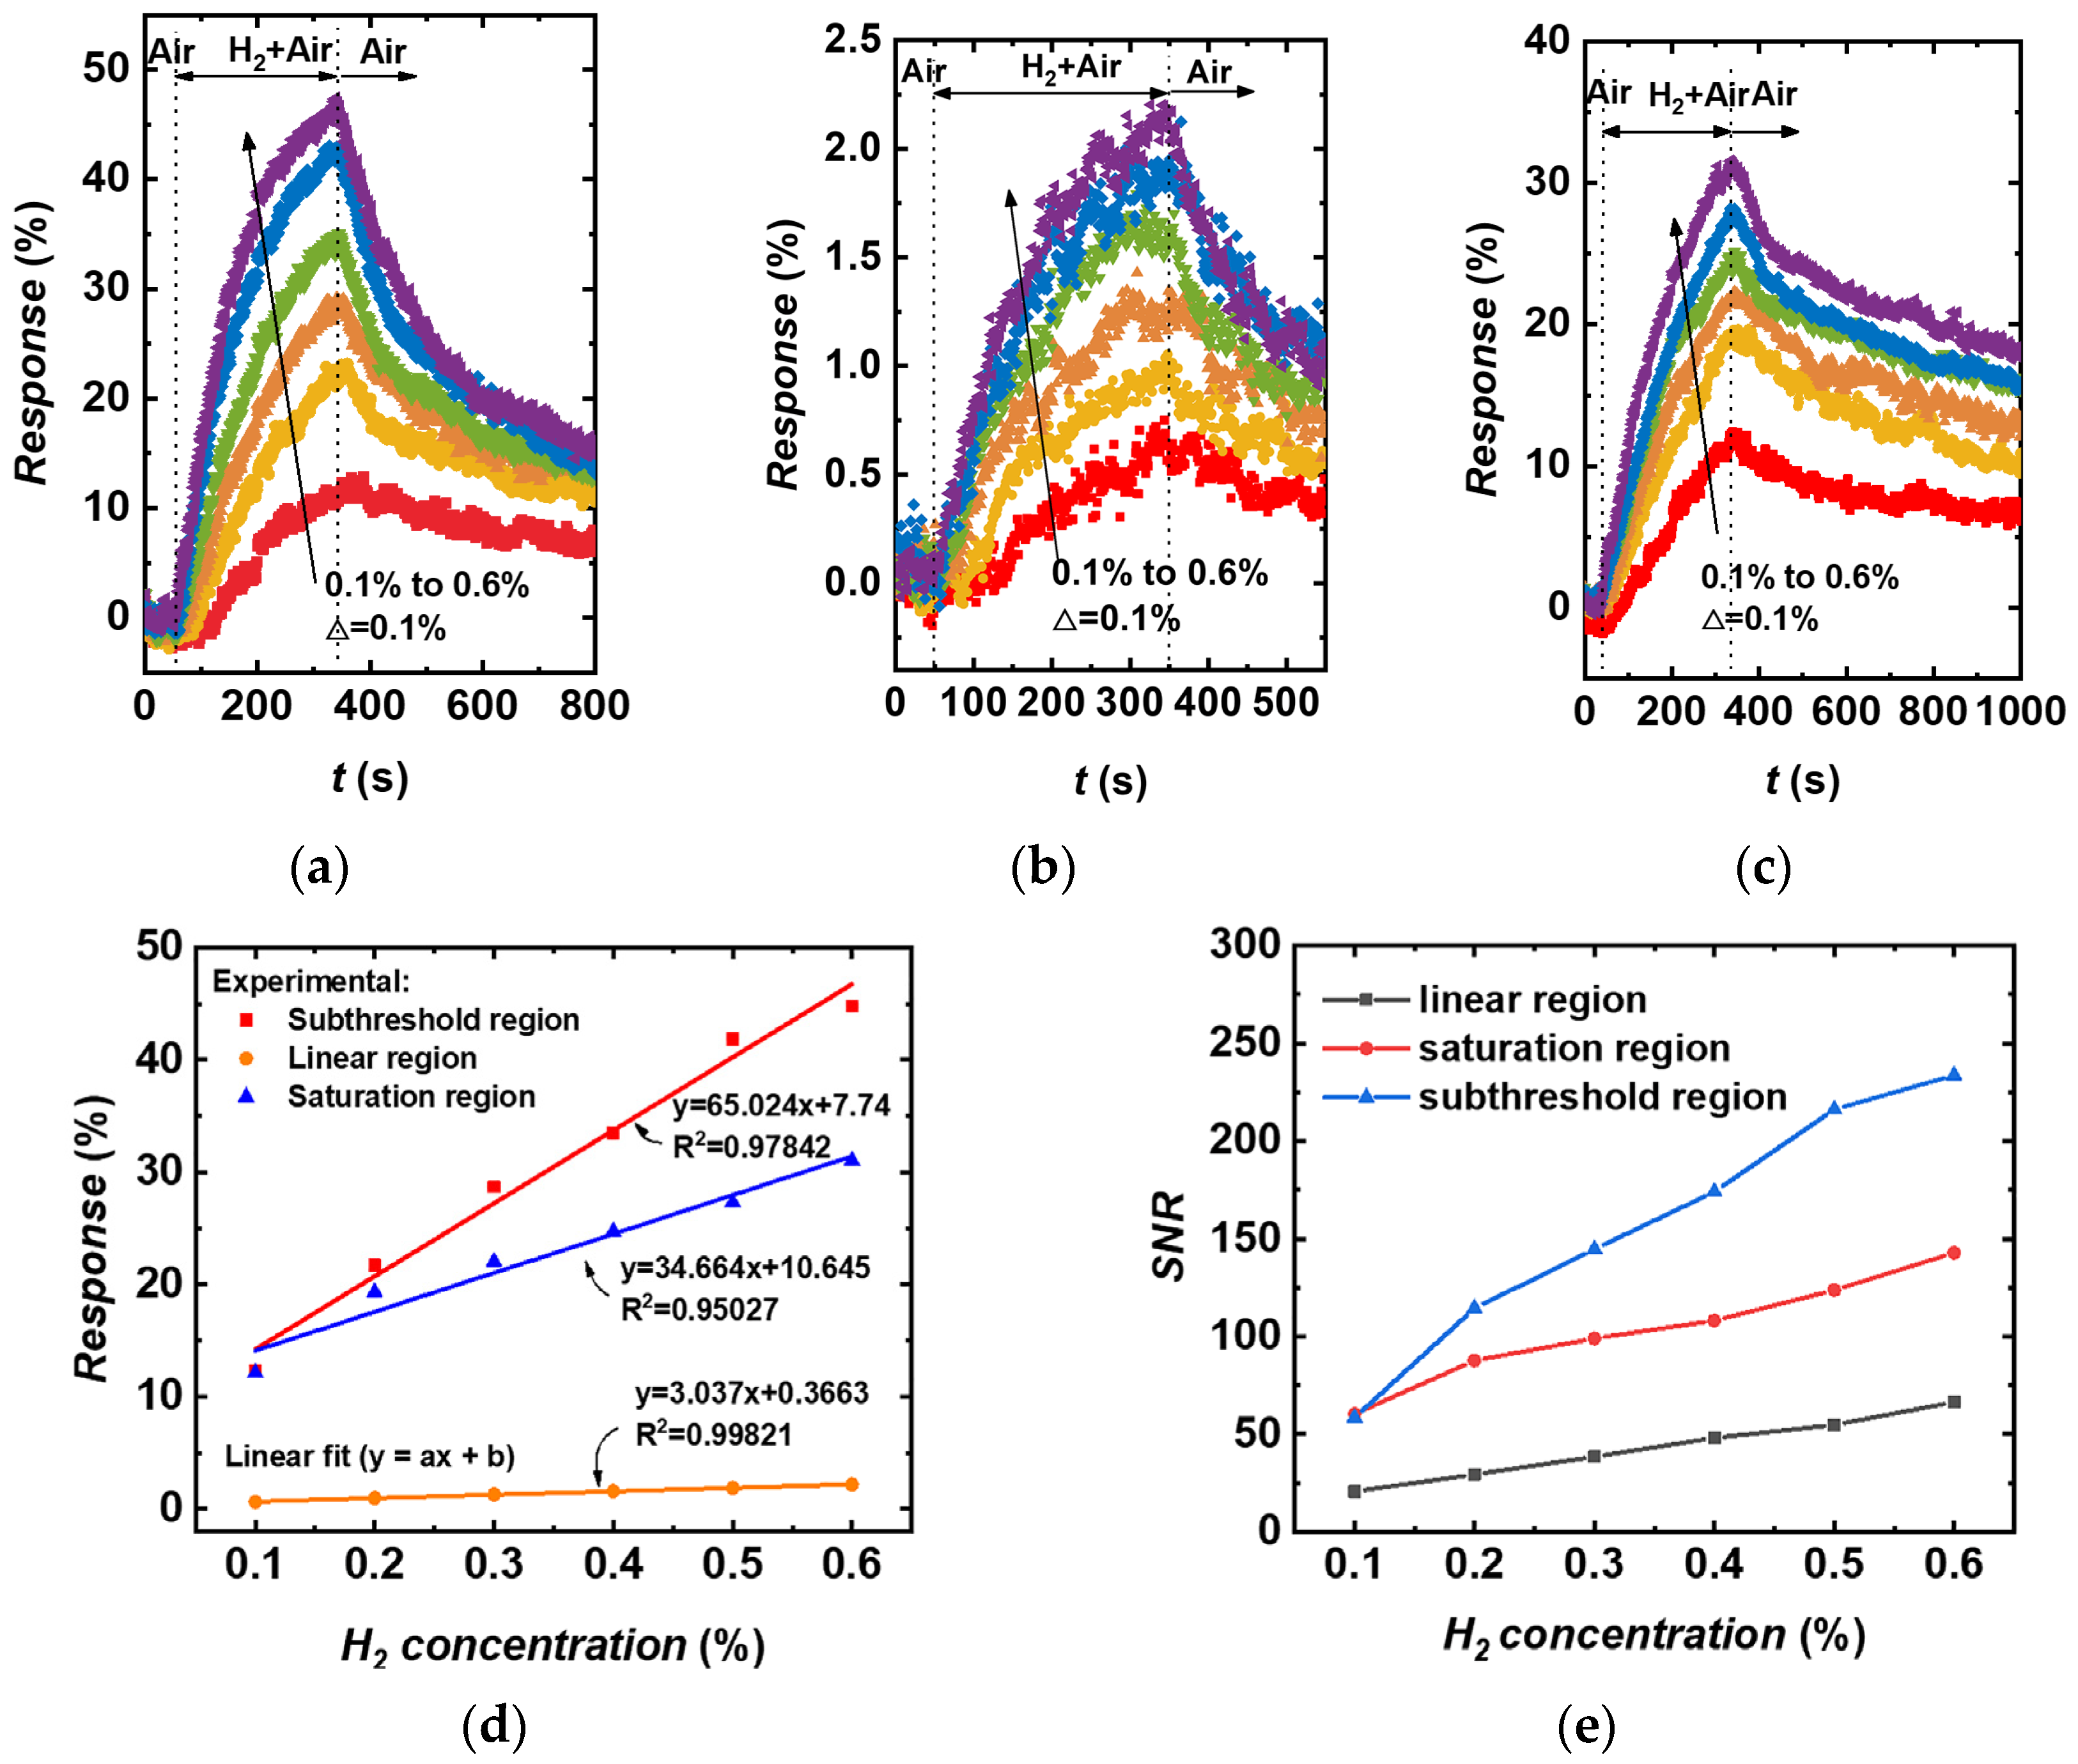
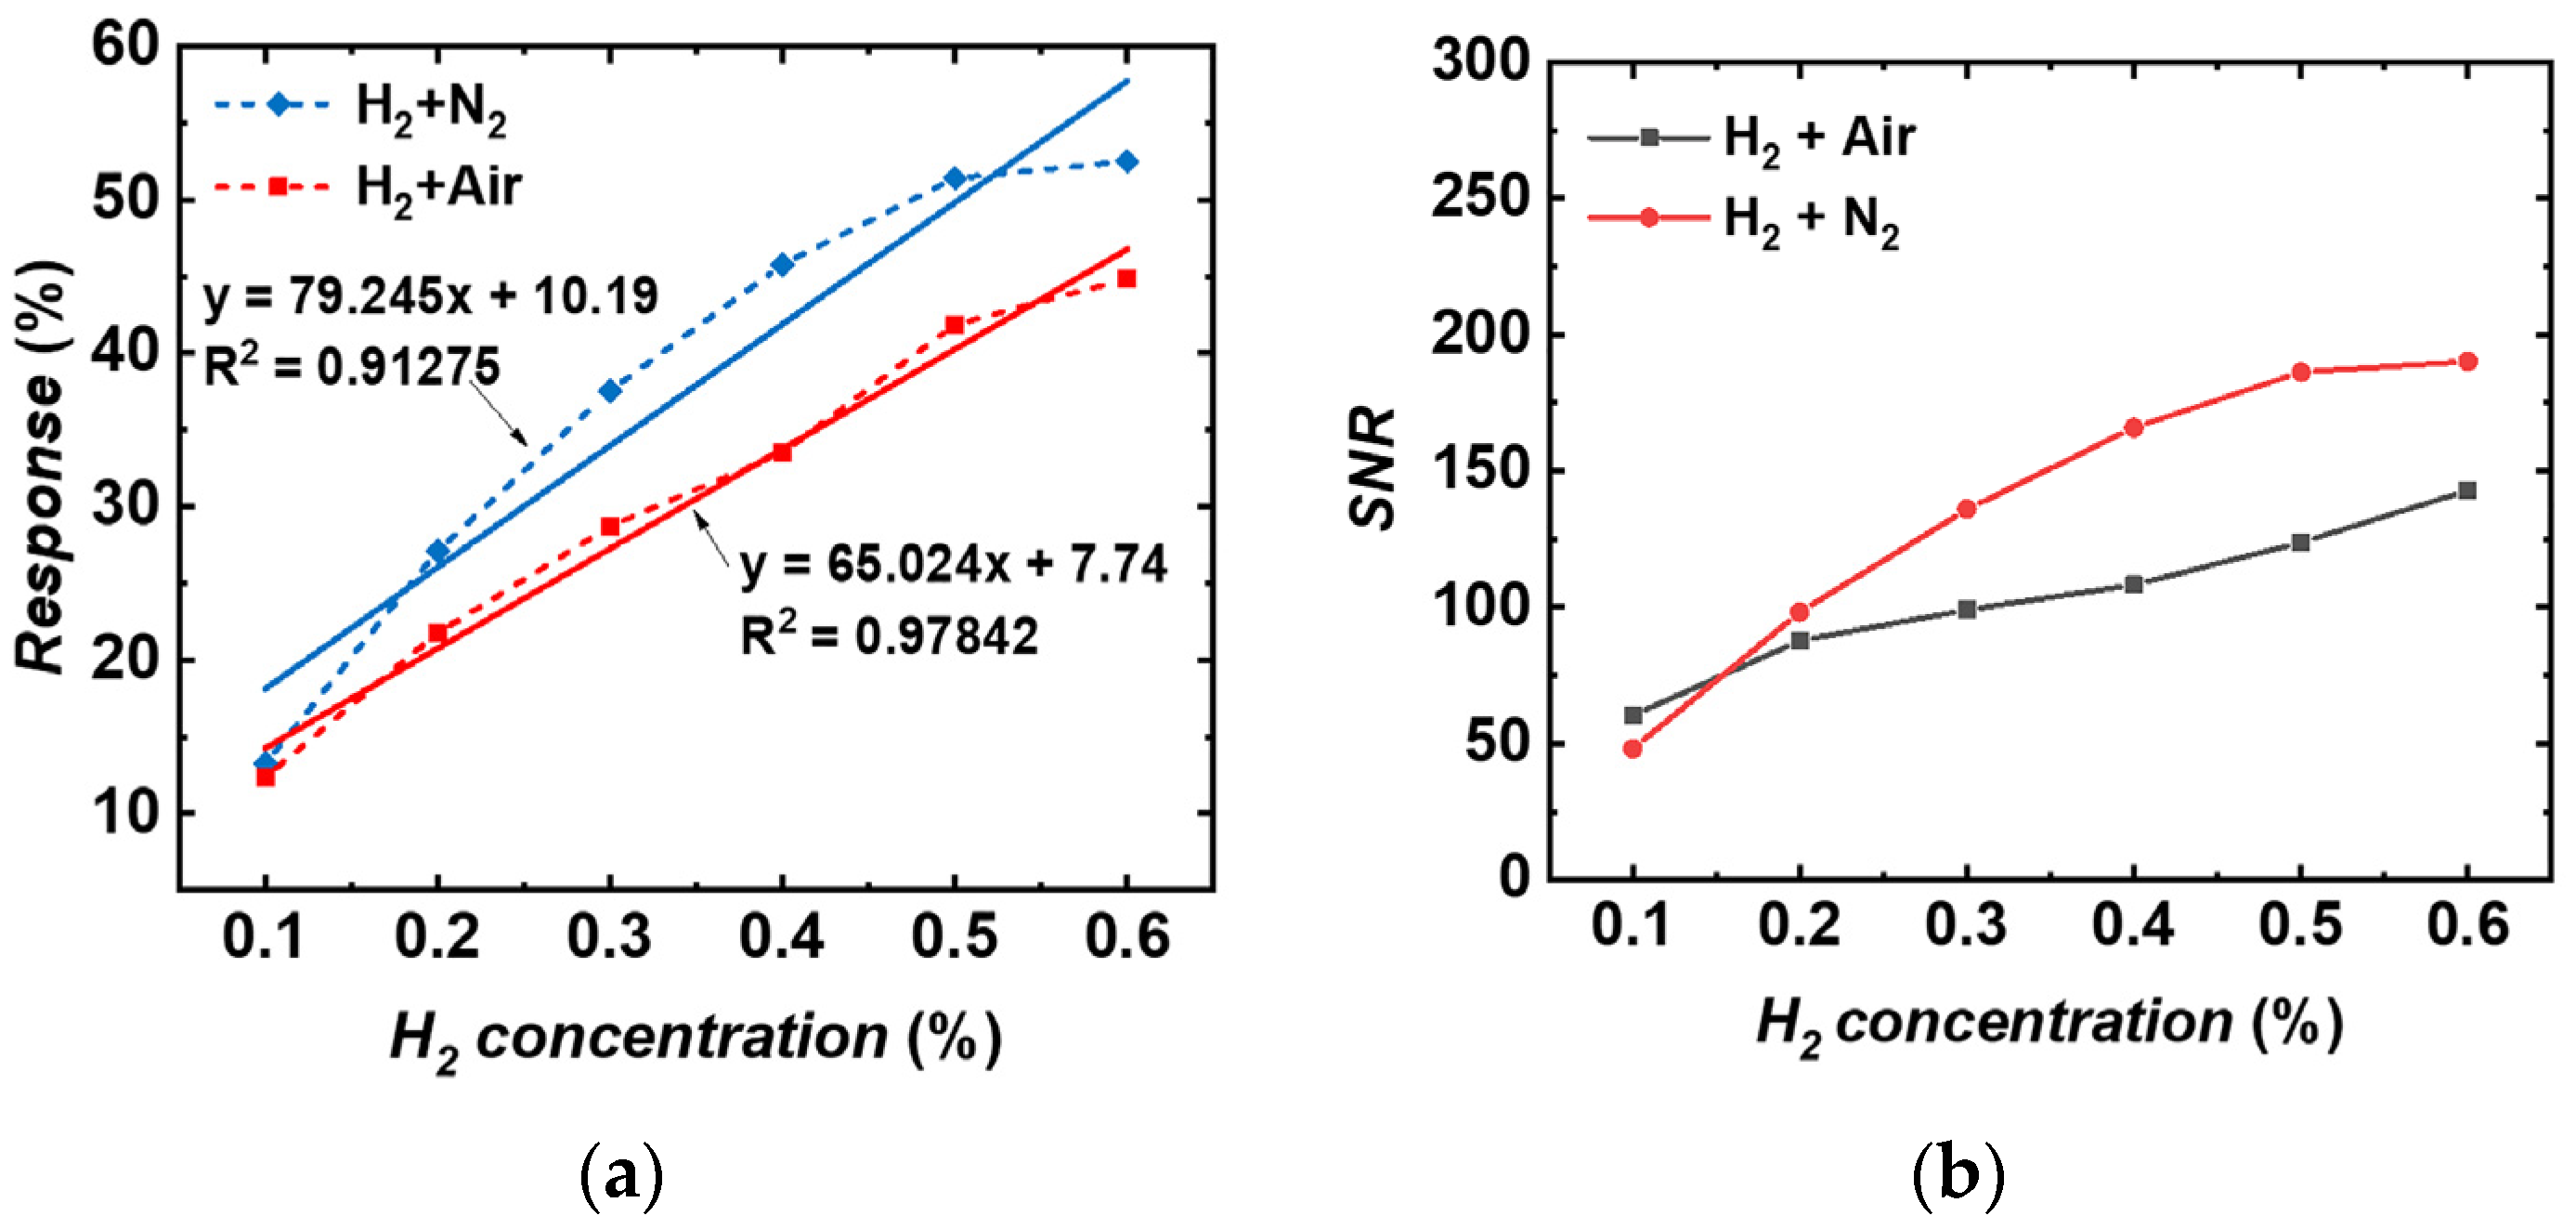
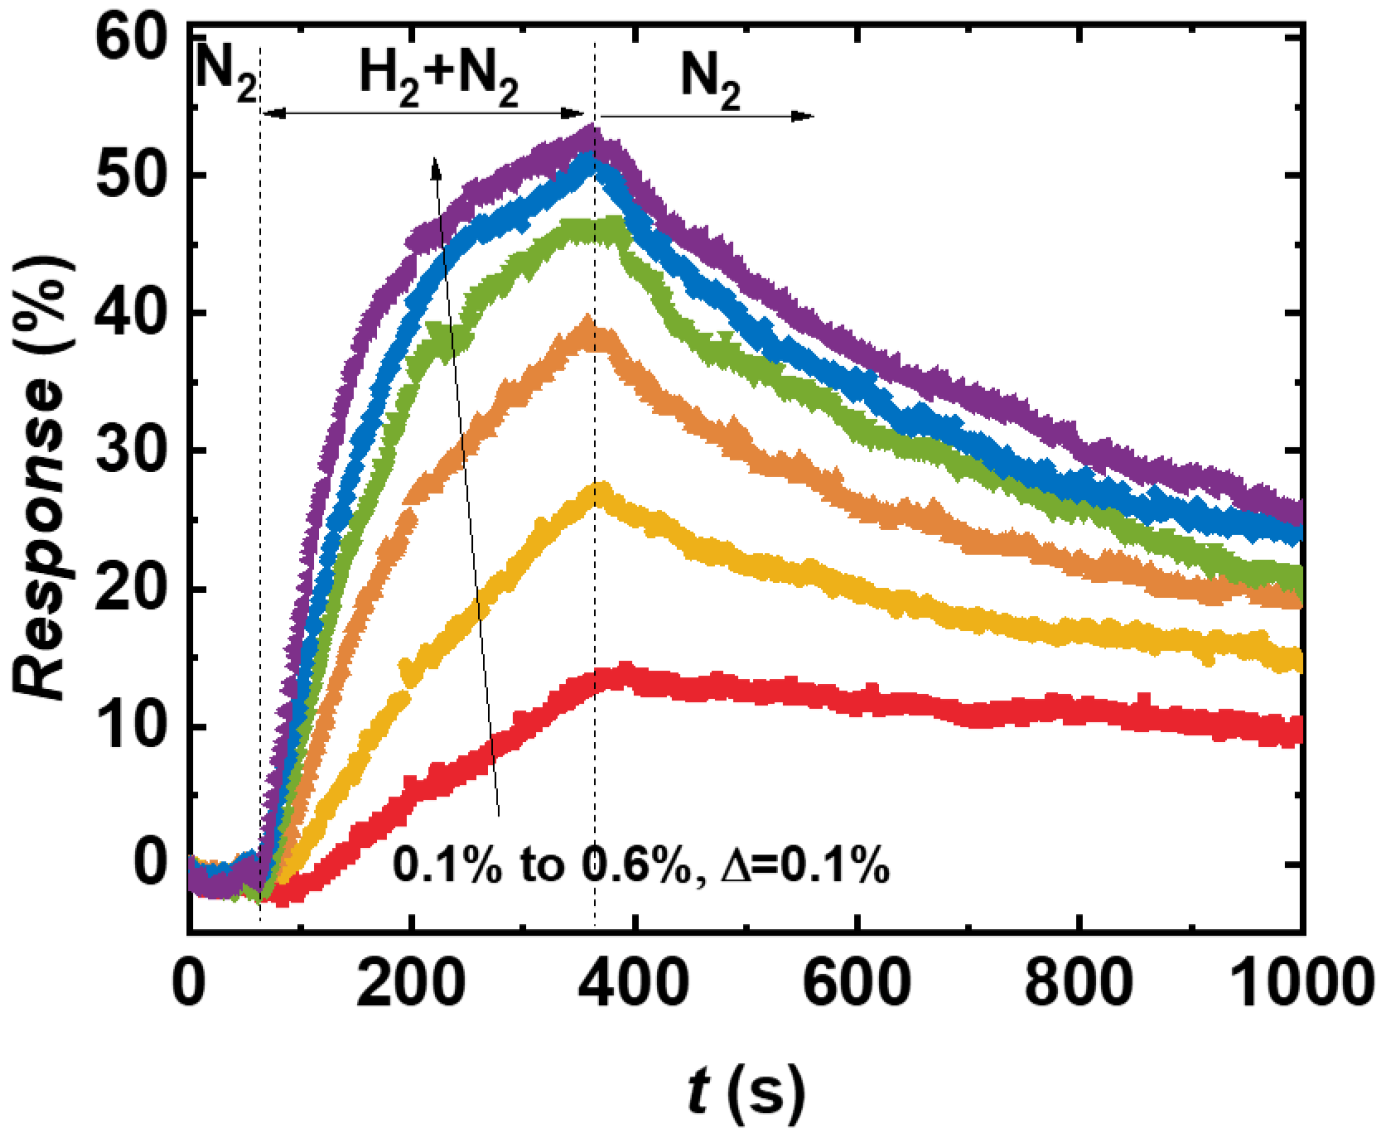
3.3. H2 Concentration Sensing

Next, the H2 sensing performance of the sensor was measured under the enhancement of pulsed negative pre-biases, which is shown in Figure 5. According to the characteristics of FETs, the FET-type sensors in this paper can operate in three different states when different bias voltages are applied to the control gate and drain, i.e., subthreshold, linear, and saturation regions. To find the most suitable working region for H2 detection, controlled experiments were conducted for the three different working regions. The other conditions of the test were kept constant, and a pre-bias voltage of −0.5 V was applied during the measurement with th = 1 s and tr = 20 µs.
Figure 5a–c show the transient response of the sensor to H2 samples of various concentrations in the subthreshold, linear and saturation regions, respectively. In the initial stage of all the tests, 400 sccm of dry air was blown onto the sensor. From 50 s in Figure 5a–c, the air was replaced by a H2 sample of a certain concentration and maintained for 300 s for the sensor to respond. After that, the gas flowing into the chamber was changed back to the reference gas, and the sensor entered the recovery period. The hydrogen concentration was set from 0.1% to 0.6% with a step of 0.1%. All responses to H2 under the three working regions increase with an increase in H2 concentration. Figure 5d shows the responses calculated using Equation (1) and the linear fittings of the relationship between the responses and the H2 concentrations for the three operating conditions of the sensor. According to the results, in the subthreshold region, the sensor has the largest response–concentration curve slope, and the sensor recovered to about 85% within 500 s for all the H2 concentrations. Meanwhile, the sensor in the linear region exhibits the lowest response values, as well as the flattest slope, which are even negligible compared to those of the other two regions.
Next, the sensor noise, signal-to-noise ratio (SNR) and detection limit (DL) of the sensor at different operating regions were calculated. The sensor noise was determined by the root-mean-square deviation (RMS) of the baseline, which was calculated from the fifth-order polynomial fit of 10 data points on the baseline before gas sensing using Equation (2) [26].
R M S = Σ x i x 2 N
where xi is the measured data, x is the corresponding fitted value and N is the number of data points (N is 10 in the present case). The SNR is calculated by Equation (3) [27].
S N R = R R M S
The calculated SNR versus H2 concentration was plotted and is shown in Figure 5e. As the H2 concentration increased, the SNR of the sensor increased in all three operating regions, but all SNRs for the subthreshold region were higher than those for the other two regions. The DL of the sensor is calculated using Equation (4) [26].
D L = 3 R M S a
where a is the slope of the linear calibration curve of response R vs. H2 concentration in Figure 5d. The DL values of the sensor in linear, saturation and subthreshold regions are 308 ppm, 189 ppm and 91 ppm, respectively. Combining the above measurements and calculations, the sensor has the highest response and SNR and the lowest DL when it is in the subthreshold region. Therefore, the FET-type sensor in different operating regions can exhibit different hydrogen sensing characteristics, and the subthreshold region is suggested to be a relatively suitable choice.

3.4. Impact of O2 on H2 Sensing

In previous sections, all the results were measured with dry synthetic air as the carrier gas to obtain a certain concentration of H2 in the target gas. Pt is a kind of powerful catalyst that can promote the reaction between H2 and O2 even at room temperature [28]. Owing to the air carrier gas, O2 also exists in the target gas samples during the gas sensing measurements, so that H2 is consumed by O2 on the surface of Pt [28]. The catalytic effect of Pt may promote the dissociation of O2 and reactions between oxygen and hydrogen species to produce water [9], [29,30]. Therefore, in the above measurements, the exact amount of H2 molecules that results in a change in sensing signal is limited. In other words, ambient O2 plays a non-negligible role in real H2 detection.
In this section, the effect of O2 on H2 sensing was investigated by replacing the synthetic air with pure N2 to serve as carrier and reference gases. The gas sensing experiments in Figure 5c were repeated with the difference that O2 was removed from all gas samples this time. The dynamic response curve is shown in Figure 6.
Based on Equations (1) and (4), the R and SNR values were also calculated for the N2 case and plotted together with the results of synthetic air case, as shown in Figure 7a,b for comparison. The R and SNR of the sensor in the H2 concentration variation range of 0.1% to 0.4% were significantly improved when N2 served as the carrier and reference gas, but the R of the sensor appeared to be saturated when the H2 concentration reached 0.5%. This phenomenon can be explained by the fact that the number of hydrogen molecules is retained without the consumption of O2, but at the same time, the presence of large quantities of hydrogen molecules causes the sensing material to become saturated very quickly. In other words, the number of oxygen ion species adsorbed on the surface of the sensing material in advance is not sufficient to detect more H2. The DL of the sensor tested in this section was also calculated according to Equation 4. If the relationship between the response and concentration is fitted linearly over a range of hydrogen concentrations from 0.1 to 0.6%, the slope is 79 in Figure 7a and the DL is 104 ppm. However, if the response–gas concentration relationship is fitted linearly over the 0.1–0.4% concentration range, the slope is 108 and the DL is 77 ppm, considering that the response of the sensor saturates when the hydrogen concentration reaches 0.5%. It is suggested that the H2 sensing performance of the sensor in N2 will be enhanced if more oxygen ion species can be introduced onto the surface of the sensing material during device preparation.

4. Conclusions

In summary, FET-type H2 sensors with Pt-In2O3 nanoparticles were prepared and investigated in this study. An increase in the Pt concentration in the sensing material can improve the H2 sensitivity of the sensor at room temperature, which can be attributed to the catalytic effect of Pt on the dissociation of H2 molecules into H atoms. The current drift of the FET-type sensor was significantly suppressed by using the pulse measurement method, which alternately pre-biases the gate and reads the drain current of the sensor. Furthermore, applying negative voltages during the pre-bias phase of the pulse test can accelerate the sensor’s recovery, while applying positive voltages achieves the opposite. The FET sensor exhibits different H2 sensing characteristics when it is operated in the linear, subthreshold and saturation regions. Among them, the sensor in the subthreshold region has the highest H2 sensitivity, signal-to-noise ratio and the lowest detection limit, so it can be used as the best operating state for FET sensors. In addition, the presence of O2 severely weakens the sensitivity of the sensor. This is suggested to be due to the catalytic effect of Pt, which promotes reactions between O2 and H2. As a result, the amount of H2 that is required to change the work function of the sensing material is reduced. Further studies on the influence of O2 will be detailed in the future work.

Supplementary Materials

The following supporting information can be downloaded at: https://www.mdpi.com/article/10.3390/chemosensors12030032/s1, Table S1: Comparison of the sensing performance towards hydrogen gas of recently reported FET-type sensors [22,23,24,25].

Author Contributions

Conceptualization, M.W., X.J. and J.-H.L.; methodology, M.W., S.H., Z.W. (Zebin Wang) and J.-H.L.; software, M.W., Z.W. (Zebin Wang), X.L. and S.H.; validation, M.W., Z.W. (Zhanyu Wu), M.L., X.L. and X.J.; formal analysis, M.W.; investigation, M.W. and S.H.; resources, M.W. and J.-H.L.; data curation, M.W., M.L., X.J. and X.L; writing—original draft preparation, M.W. and S.H.; writing—review and editing, M.W. and Z.W. (Zhanyu Wu); visualization, M.W., S.H. and Z.W. (Zhanyu Wu); supervision, M.W.; project administration, M.W. All authors have read and agreed to the published version of the manuscript.

Funding

This work was supported by the National Natural Science Foundation of China grant numbers 62204163 and 62103288, and the Basic Research Projects of Educational Department of Liaoning Province grant numbers LJKQZ20222311 and JYTMS20231212.

Institutional Review Board Statement

Not applicable.

Informed Consent Statement

Not applicable.

Data Availability Statement

The datasets used and/or analyzed during the current study are available from the corresponding author on reasonable request.

Conflicts of Interest

The authors declare no conflicts of interest.

References

  1. Kuczyński, S.; Łaciak, M.; Olijnyk, A.; Szurlej, A.; Włodek, T. Thermodynamic and Technical Issues of Hydrogen and Methane-Hydrogen Mixtures Pipeline Transmission. Energies 2019, 12, 569. [Google Scholar] [CrossRef]
  2. Singh, G.; Ramadass, K.; DasiReddy, V.D.B.C.; Yuan, X.; Ok, Y.S.; Bolan, N.; Xiao, X.; Ma, T.; Karakoti, A.; Yi, J.; et al. Material-based generation, storage, and utilisation of hydrogen. Prog. Mater. Sci. 2023, 135, 101104. [Google Scholar] [CrossRef]
  3. Mirzaei, A.; Yousefi, H.R.; Falsafi, F.; Bonyani, M.; Lee, J.-H.; Kim, J.-H.; Kim, H.W.; Kim, S.S. An overview on how Pd on resistive-based nanomaterial gas sensors can enhance response toward hydrogen gas. Int. J. Hydrogen Energy 2019, 44, 20552–20571. [Google Scholar] [CrossRef]
  4. Handwerker, M.; Wellnitz, J.; Marzbani, H. Comparison of Hydrogen Powertrains with the Battery Powered Electric Vehicle and Investigation of Small-Scale Local Hydrogen Production Using Renewable Energy. Hydrogen 2021, 2, 76–100. [Google Scholar] [CrossRef]
  5. Yusaf, T.; Mahamude, A.S.F.; Kadirgama, K.; Ramasamy, D.; Farhana, K.; Dhahad, H.A.; Talib, A.R.A.D. Sustainable hydrogen energy in aviation—A narrative review. Int. J. Hydrogen Energy 2024, 52, 1026–1045. [Google Scholar] [CrossRef]
  6. Li, Z.; Li, H.; Wu, Z.; Wang, M.; Luo, J.; Torun, H.; Hu, P.-A.; Yang, C.; Grundmann, M.; Liu, X.; et al. Advances in designs and mechanisms of semiconducting metal oxide nanostructures for high-precision gas sensors operated at room temperature. Mater. Horiz. 2019, 6, 470–506. [Google Scholar] [CrossRef]
  7. Kim, J.-H.; Mirzaei, A.; Kim, H.W.; Kim, S.S. Improving the hydrogen sensing properties of SnO2 nanowire-based conductometric sensors by Pd-decoration. Sens. Actuators B Chem. 2019, 285, 358–367. [Google Scholar] [CrossRef]
  8. Zhao, J.; Song, J.; Lu, X.; Wu, M.; Yan, Z.; Chen, F.; Chen, W. Room-Temperature Hydrogen-Sensitive Pt-SnO2 Composite Nanoceramics: Contrasting Roles of Pt Nano-Catalysts Loaded via Two Different Methods. Inorganics 2023, 11, 366. [Google Scholar] [CrossRef]
  9. Wadhwa, R.; Kumar, A.; Sarkar, R.; Mohanty, P.P.; Kumar, D.; Deswal, S.; Kumar, P.; Ahuja, R.; Chakraborty, S.; Kumar, M.; et al. Pt Nanoparticles on Vertically Aligned Large-Area MoS2 Flakes for Selective H2 Sensing at Room Temperature. ACS Appl. Nano Mater. 2023, 6, 2527–2537. [Google Scholar] [CrossRef]
  10. Dasari, S.G.; Nagaraju, P.; Yelsani, V.; Tirumala, S.; Reddy, M.V.R. Nanostructured Indium Oxide Thin Films as a Room Temperature Toluene Sensor. ACS Omega 2021, 6, 17442–17454. [Google Scholar] [CrossRef]
  11. Pawar, K.K.; Mali, S.S.; Navale, Y.H.; Patil, V.B.; Sharma, K.K.; Hong, C.K.; Patil, P.S. Fabrication of enhanced sensitive and selective porous indium oxide nanocube sensor for NO2 detection. Ceram. Int. 2021, 47, 2430–2440. [Google Scholar] [CrossRef]
  12. Tian, J.; Chen, X.; Wang, T.; Pei, W.; Li, F.; Li, D.; Yang, Y.; Dong, X. Modification of indium oxide nanofibers by polyoxometalate electron acceptor doping for enhancement of gas sensing at room temperature. Sens. Actuators B Chem. 2021, 344, 130227. [Google Scholar] [CrossRef]
  13. Inyawilert, K.; Wisitsoraat, A.; Liewhiran, C.; Tuantranont, A.; Phanichphant, S. H2 gas sensor based on PdOx-doped In2O3 nanoparticles synthesized by flame spray pyrolysis. Appl. Surf. Sci. 2019, 475, 191–203. [Google Scholar] [CrossRef]
  14. Luo, Y.; An, B.; Bai, J.; Wang, Y.; Cheng, X.; Wang, Q.; Li, J.; Yang, Y.; Wu, Z.; Xie, E. Ultrahigh-response hydrogen sensor based on PdO/NiO co-doped In2O3 nanotubes. J. Colloid Interface Sci. 2021, 599, 533–542. [Google Scholar] [CrossRef] [PubMed]
  15. Hong, S.; Wu, M.; Hong, Y.; Jeong, Y.; Jung, G.; Shin, W.; Park, J.; Kim, D.; Jang, D.; Lee, J.-H. FET-type gas sensors: A review. Sens. Actuators B Chem. 2021, 330, 129240. [Google Scholar] [CrossRef]
  16. Zhang, P.; Xiao, Y.; Zhang, J.; Liu, B.; Ma, X.; Wang, Y. Highly sensitive gas sensing platforms based on field effect Transistor—A review. Anal. Chim. Acta 2021, 1172, 338575. [Google Scholar] [CrossRef]
  17. Mukherjee, A.; Rosenwaks, Y. Recent Advances in Silicon FET Devices for Gas and Volatile Organic Compound Sensing. Chemosensors 2021, 9, 260. [Google Scholar] [CrossRef]
  18. Kim, E.-B.; Imran, M.; Lee, E.-H.; Akhtar, M.S.; Ameen, S. Multiple ions detection by field-effect transistor sensors based on ZnO@GO and ZnO@rGO nanomaterials: Application to trace detection of Cr (III) and Cu (II). Chemosphere 2022, 286, 131695. [Google Scholar] [CrossRef]
  19. Morati, N.; Contaret, T.; Gomri, S.; Fiorido, T.; Seguin, J.-L.; Bendahan, M. Noise spectroscopy data analysis-based gas identification with a single MOX sensor. Sens. Actuators B Chem. 2021, 334, 129654. [Google Scholar] [CrossRef]
  20. Shin, W.; Jung, G.; Hong, S.; Jeong, Y.; Park, J.; Jang, D.; Park, B.-G.; Lee, J.-H. Low frequency noise characteristics of resistor- and Si MOSFET-type gas sensors fabricated on the same Si wafer with In2O3 sensing layer. Sens. Actuators B Chem. 2020, 318, 128087. [Google Scholar] [CrossRef]
  21. Hassanalieragh, M.; Ignjatovic, Z.; Newman, J.D.; Fourspring, K. Design and Characterization of a 10 × 10 Pixel Array THz Camera in 350 nm CMOS Technology. IEEE Sens. J. 2020, 20, 9834–9848. [Google Scholar] [CrossRef]
  22. Rezende, N.P.; Cadore, A.R.; Gadelha, A.C.; Pereira, C.L.; Ornelas, V.; Watanabe, K.; Taniguchi, T.; Ferlauto, A.S.; Malachias, A.; Campos, L.C.; et al. Probing the Electronic Properties of Monolayer MoS2 via Interaction with Molecular Hydrogen. Adv. Electron. Mater. 2019, 5, 1800591. [Google Scholar] [CrossRef]
  23. Sokolovskij, R.; Zhang, J.; Zheng, H.; Li, W.; Jiang, Y.; Yang, G.; Yu, H.; Sarro, P.M.; Zhang, G. The Impact of Gate Recess on the H Detection Properties of Pt-AlGaN/GaN HEMT Sensors. IEEE Sens. J. 2020, 20, 8947–8955. [Google Scholar] [CrossRef]
  24. Ghosh, S.; Rajan, L. Zinc Oxide Thin-Film Transistor with Catalytic Electrodes for Hydrogen Sensing at Room Temperature. IEEE Trans. Nanotechnol. 2021, 20, 303–310. [Google Scholar] [CrossRef]
  25. Ahn, J.; Kim, D.; Park, K.H.; Yoo, G.; Heo, J. Pt-Decorated Graphene Gate AlGaN/GaN MIS-HEMT for Ultrahigh Sensitive Hydrogen Gas Detection. IEEE Trans. Electron Devices 2021, 68, 1255–1261. [Google Scholar] [CrossRef]
  26. Chen, Y.-Z.; Lee, S.-H.; Su, T.-Y.; Wu, S.-C.; Chen, P.-J.; Chueh, Y.-L. Phase-modulated 3D-hierarchical 1T/2H WSe2 nanoscrews by a plasma-assisted selenization process as high performance NO gas sensors with a ppb-level detection limit. J. Mater. Chem. A 2019, 7, 22314–22322. [Google Scholar] [CrossRef]
  27. Wang, C.; Lei, S.; Li, X.; Guo, S.; Cui, P.; Wei, X.; Liu, W.; Liu, H. A Reduced GO-Graphene Hybrid Gas Sensor for Ultra-Low Concentration Ammonia Detection. Sensors 2018, 18, 3147. [Google Scholar] [CrossRef] [PubMed]
  28. Hellsing, B.; Kasemo, B.; Zhdanov, V.P. Kinetics of the hydrogen-oxygen reaction on platinum. J. Catal. 1991, 132, 210–228. [Google Scholar] [CrossRef]
  29. Mansour, H.; Iglesia, E. Theoretical and Experimental Assessments of Elementary Steps and Bound Intermediates in Catalytic H2–O2 Reactions on Dispersed Pt Nanoparticles. J. Phys. Chem. C 2023, 127, 4553–4569. [Google Scholar] [CrossRef]
  30. Wang, X.; Liu, W.; Wang, C.; Zhang, S.; Ding, M.; Xu, X. Enhanced formaldehyde gas sensing performance of ternary CuB2O4 oxides through oxygen vacancy manipulation and surface platinum decoration. Sens. Actuators B Chem. 2021, 344, 130190. [Google Scholar] [CrossRef]
Figure 1. SEM image and schematic views of FET-type sensors. (a) Schematic diagram of the 3D structure of the sensor. (b) SEM top view of the sensor. The transparent Pt-In2O3 sensing material is deposited on top of the coupling region of the CG and the FG, which is enclosed by the yellow frame. (c,d) Schematic cross-sectional views of the sensor along A-A′ and B-B′ in (b), respectively.
Chemosensors 12 00032 g001
Figure 2. The experimental setup.
Chemosensors 12 00032 g002
Figure 3. Basic electrical and sensing properties of the FET-type sensor. (a) Double-sweep PIV and DC IV curves measured at room temperature. (b) Response of the sensor with different Pt concentrations (2 wt.%, 5 wt.% and 10 wt.%) to 0.1% H2 target gas mixture under DC read bias.
Chemosensors 12 00032 g003
Figure 4. Sensing characterization of the FET sensor obtained using the pulse method. (a) Devised pulse bias scheme. (b) Response of the FET-type sensor with different Pt concentrations (2 wt.%, 5 wt.% and 10 wt.%) to a 0.1% H2 target gas mixture measured using pulse scheme in (a) at room temperature. Note the magnitude of the pre-bias (Vpb) is 0 V in this measurement. (c) The effect of the polarity of Vpbs on the H2 response of the sensor with 10 wt% Pt. The vertical dotted lines in (b,c) indicate the moment when the gas blown onto the sensor was switched. The horizontal dotted line in (c) indicates the current baseline.
Chemosensors 12 00032 g004aChemosensors 12 00032 g004b
Figure 5. Response of the FET-type sensor to H2 in different operating regions. (a) Subthreshold region. (b) Linear region. (c) Saturation region. (d) Responses and the linear fittings of the relationship between the responses and the hydrogen concentrations for the three operating conditions of the sensor. (e) Signal-to-noise ratio variations of the FET-type sensor in linear, saturation and subthreshold regions. The dotted lines indicate the moment when the gas blown onto the sensor was switched. The red, yellow, orange, green, blue, and violet curves in (ac) correspond sequentially to hydrogen concentrations of 0.1% to 0.6% in steps of 0.1%.
Chemosensors 12 00032 g005
Figure 6. Transient response of the sensor when N2 served as the reference and carrier gases. The dotted lines indicate the moment when the gas blown onto the sensor was switched. The red, yellow, orange, green, blue, and violet curves correspond sequentially to hydrogen concentrations of 0.1% to 0.6% in steps of 0.1%.
Chemosensors 12 00032 g006
Figure 7. Comparisons of H2 sensing performance of the sensor in different gas mixtures. (a) Comparison of R values. (b) Comparison of SNR values.
Chemosensors 12 00032 g007
Disclaimer/Publisher’s Note: The statements, opinions and data contained in all publications are solely those of the individual author(s) and contributor(s) and not of MDPI and/or the editor(s). MDPI and/or the editor(s) disclaim responsibility for any injury to people or property resulting from any ideas, methods, instructions or products referred to in the content.

