Article

AuNPs/Ti3C2 Signal-Enhanced Surface Plasmon Resonance Imaging Biosensor for Ultrasensitive Detection of miRNA

College of Optical and Electronic Technology, China Jiliang University, Hangzhou 310018, China
*
Author to whom correspondence should be addressed.
Chemosensors 2024, 12(4), 66; https://doi.org/10.3390/chemosensors12040066
Submission received: 23 February 2024 / Revised: 22 March 2024 / Accepted: 26 March 2024 / Published: 17 April 2024
(This article belongs to the Special Issue Advanced Surface Plasmon Resonance Sensors)

Abstract

:
MicroRNA-21 is a potential cancer biomarker that is highly expressed in many cancer cells. Therefore, it is important to perform highly sensitive detection of miRNA-21. In this study, we designed a surface plasmon resonance imaging (SPRi) sensor based on an AuNPs/Ti3C2 composite for real-time and highly sensitive detection of miRNA-21. The fixation of the capture polyA-DNA probes was completed by the freezing method, which improved the detection efficiency. DNA−AuNPs/Ti3C2 conjugates were added to amplify the SPRi signal. The signal amplification combines the large specific surface area of Ti3C2 and the electronic coupling between the local surface plasmon resonance (LSPR) of AuNPs and the plasmon wave on the surface of the Au chip, thereby enhancing the SPRi response signal. Using this sensing strategy, the detection limit for miRNA-21 can reach 6.13 fM, with a wide dynamic range between 10 fM and 10 nM. In addition, the sensor has excellent selectivity for miRNA-21 and miRNAs with similar sequences, and receives minimal interference when applied to complex matrices. Based on these results, we believe that this study provides a simple and highly sensitive method for miRNA detection, which has great potential for the quantitative detection of miRNA in biomedical research and early clinical diagnosis.

1. Introduction

MicroRNA (miRNA) is a class of endogenous, tiny (about 20–24 nt in length) en-dogenous non-coding RNA that are involved in the life processes such as cell growth and development, proliferation, apoptosis and even tumor development [1,2]. The expression levels of miRNA are closely associated with the occurrence and development of different types of cancers in human beings, and the typical expression patterns of miRNA have been identified [3]. Among miRNA, miRNA-21 is a well-recognized potential cancer biomarker that shows up-regulated expression in a variety of tumor cells [4,5,6,7,8]. Therefore, the ultrasensitive detection of miRNA-21 is crucial for early cancer diagnosis and the development of targeted drugs [9]. However, miRNA-21 has inherent characteristics of low abundance, short length, and sequence homology, so the rapid and sensitive detection of miRNA-21 is challenging.
In recent years, various analytical strategies have been developed for miRNA-21 detection [10], including fluorescence assay [11], electrochemical immunoassay [12], and surface-enhanced Raman spectroscopy (SERS) [13]. Although all of these methods can be applied in complex backgrounds, they still have the shortcomings of time-consuming detection, cumbersome process, and inability to perform real-time detection when operating. In contrast, surface plasmon resonance (SPR) technology has received special attention due to its advantages of real-time dynamic monitoring, high detection sensitivity, label-free detection, minimal sample volume required, simple and convenient operation of the detection process, and high-throughput detection [14]. However, for low molecular weight or very low concentration analytes, the sensitivity still needs to be improved. To overcome this challenge, gold nanoparticles (AuNPs) are usually introduced as signal amplification elements to enhance the SPR signal [15]. Liu et al. [16] proposed an enzyme-free sensing strategy for highly sensitive detection of miRNA, as well as cancer cells, by DNA conjugated AuNPs with two reporter DNA forming a super-sandwich structure on the sensing surface. Wang et al. [17] established a detection system using dual AuNPs for assisted signal amplification, enabling the detection of low concentrations of exosomes. Hong et al. [18] developed an amplification-free sensing scheme in which miRNA competed with AuNPs for binding to capture probes. With the development of nanomaterials, many emerging two-dimensional (2D) materials, such as graphene, molybdenum disulfide (MoS2), and black scale (BP), have been used for SPR analysis of biomolecules [19]. For example, Wang et al. [20] utilized GO-AuNP complexes as signal labels to form sandwich complexes on the surface of SPR sensors for the highly sensitive detection of miRNA-141. Later, Li et al. [21] extended their work on the GO−AuNPs complex as a signal amplifying element by immobilizing the material on the surface of a biochip as a label for recognizing molecules, forming a bilayered sandwich structure, which further amplified the SPR signal. Nie et al. [22] used AuNPs/MoS2 signal amplifying material for miRNA detection. These studies confirmed that 2D materials embedded with AuNPs can improve the performance of SPR biosensors with good signal amplification. MXene, as a 2D transition metal material different from graphene, has a regular layered structure, excellent electrical conductivity, and large specific surface area, and has variable elemental composition [23]. These excellent properties have led to the application of MXene in energy storage, lithium batteries, environmental remediation and chemical sensing [24,25]. There are also studies on the application of MXene materials in SPR sensing. For example, Wu et al. [26] used functionalized Ti3C2 nanosheets as a sensing platform and multi-walled carbon nanotube (MWCNTs) −AgNPs as signal enhancers for the detection of carcinoembryonic antigen (CEA), which achieved an ultra-low detection limit. Afterwards, the group used the same sensing platform to identify CEA [27], and the hollow gold nanoparticle (HGNPs)/Ti3C2 hybrids were used as signal amplification tags, and this sensing strategy had high sensitivity as well as a wide linear detection range, which still reached the ultra-low detection limit. Wang and colleagues designed an MXene-on-Au sensing substrate, which performs the ultrasensitive detection of miRNA based on lateral displacement [28]. In previous studies, Ti3C2 nanomaterials have been used as protein detection or as a substrate for the immobilization of recognition molecules. Yet, few articles have reported the use of AuNPs/Ti3C2 composites as labels for signal amplification in miRNA detection.
In this work, we designed a novel AuNPs/Ti3C2 based surface plasmonic resonance imaging (SPRi) biosensor for the highly sensitive detection of the cancer biomarker miRNA-21. DNAlinked AuNPs/Ti3C2 composite formed a sandwich structure on the biochip surface to amplify the SPRi signal. Since the Ti3C2 nanosheet has a large surface area, it provides more space for AuNPs to be fixed, increases the quality when connected to the chip surface, and enhances the SPRi signal. In addition, the SPRi signal is further enhanced by the electromagnetic coupling between the local plasmon resonance of AuNPs and the plasmon wave on the Au surface. Based on this sensing strategy, highly sensitive detection of miRNA-21 was achieved. This method has good analytical performance for miRNA detection and has potential application value in the clinical diagnosis of cancer.

2. Experimental Section

2.1. Chemicals and Materials

Anhydrous calcium chloride and Tris-EDTA (1 × TE, pH 7.0) were purchased from Fdbio science (Hangzhou, China). Phosphate buffer solution (PBS) was purchased from Sangon Inc. (Shanghai, China). Sodium hydroxide was purchased from Macklin (Shanghai, China). Chloroauric acid (HAuCl4·4H2O) and trisodium citrate were purchased from Shanghai Reagent (Shanghai, China). All DNA and RNA sequences were synthesized by Sangon Inc. (Shanghai, China) and purified by high-performance liquid chromatography, and the base sequences are shown in Table S1. Ultrapure water (18.2 MΩ cm) was used throughout the experiments. Oligonucleotides used as probes were dissolved in TE buffer containing CaCl2 (5 M CaCl2, 1 × TE (10 mM Tris-HCl, 1 mM EDTA) pH 7), auxiliary probes were dissolved in ultrapure water, and miRNA-21 was dissolved in PBS buffer ([-] CaCl2, [-] MgCl2, pH 7.2–7.4). To prevent RNase degradation, treatment with diethylpyrocarbonate (DEPC) was performed.

2.2. Preparation of Ti3C2 Nanosheets and AuNPs/Ti3C2

Ti3C2 nanosheets were prepared according to the method described earlier [29], in which bulk Ti3AlC2 was etched and then modified with APTES to obtain ultrathin Ti3C2 nanosheets with amino terminations and a solubility of 3.2 mg/mL. In this experiment, 16 nm AuNPs were prepared at a concentration of 1.12 nM to be synthesized according to the previously described citrate reduction method [30]. The prepared solutions were all stored at 4 °C for backup. Next, the AuNPs were immobilized on a Ti3C2 nanosheet. Briefly, 200 μL of Ti3C2 solution was added drop by drop into 12 mL of AuNPs, stirred at 560 rps for 2 h at room temperature, and then sonicated at 40 W for 30 min. Subsequently, the mixed solution was centrifuged at 12,500 rpm for 20 min to remove free AuNPs, and resuspended with the addition of 1 mL of deionized water, and then sonicated and mixed homogeneously and placed at 4 °C for further use.

2.3. Preparation of DNA−AuNPs and DNA−AuNPs/Ti3C2

SH-DNA probes were coupled to AuNPs and AuNPs/Ti3C2 using the freezing method [31,32]. The first step was the synthesis of DNA−AuNPs. The previously synthesized AuNP solution was concentrated 3-fold, added 15 μL of 100 μM DNA to 350 μL of AuNPs and mixed well, and let stand at −80 °C for 30 min. Subsequently, it was thawed at room temperature. The mixed solution was centrifuged at 12,000 rpm for 10 min to remove free DNA and then resuspended, adding 400 μL of deionized water. After centrifuging again under the same conditions, 800 μL of PBS buffer was added for resuspension, and the mixture was ultrasonically mixed well and placed at 4 °C for the next step. The synthesis procedure of DNA−AuNPs/Ti3C2 was similar. A total of 20 μL of 100 μM DNA was added to the 350 μL composite solution, and the mixed solution was frozen at −80 °C for 30 min and thawed at room temperature. The DNA−AuNPs/Ti3C2 coupling was centrifuged at 11,000 rpm for 10 min and repeated twice. The first time, the precipitate was dispersed in deionized water and the second time it was dispersed in PBS buffer and stored at 4 °C for the next experiment.

2.4. Au Chip Functionalization

The biochip used in the laboratory is a prism covered with a thin film of gold, purchased from HORIBA (Paraiso, France). Prior to the start of the experiment, the gold chips were washed by immersing them in fresh piranha solution (H2SO4: 700 μL, H2O2: 300 μL), and then the chips were rinsed repeatedly with ethanol and ultrapure water. The capture probes were dissolved and diluted to 30 μM with TE buffer (5 M CaCl2, 1 × TE) and then placed on the surface of the gold chip in a volume of 0.25 μL per point, each droplet is about 1 mm in diameter. The capture probes were fixed in two ways. The freezing method is to place the chip at −20 °C for 2 h and thaw it at room temperature. The incubation method is to place the chip in an environment sheltered from light, at room temperature and 80% humidity for 24 h. After fixing the probe, the chip surface was briefly washed with deionized water and dried with nitrogen before use.

2.5. SPRi Detection

The SPRi assay for this experiment was performed on an Open PleX (HORIBA Scientific SAS, Paraiso, France) based on a conventional Kretchmann structure. Prior to the start of the experiment, running PBS buffer at a low flow rate for 2 h ensured that the instrument was in a stable state. The chip with the capture probes attached to it is connected to the instrument for detection. Next, 400 μL of target sample was injected to flow over the chip surface at a flow rate of 50 μL/min to specifically bind to the immobilized capture probe, and the response curve was stabilized in about 5 min to obtain the SPRi signal. In order to detect lower concentrations of the target material, signal amplification material was introduced into the system, and the auxiliary DNA attached on top specifically binds to the rest of the target sequence to form a sandwich structure, and the response curve reached stability after 8 min. The double-stranded structure formed can be dissociated by introducing 50 mM NaOH, and then the surface of the biochip was rinsed with running buffer. After the curves return to baseline and remain stable, follow-up experiments are performed. During the experiment, the differential plots of SPRi and the corresponding SPRi response curve can be observed in real time by outputting SPRi through the CCD terminal. A brightening of the spot can prove that the probe is effectively bound to the target DNA sample, while darkening indicates the dissociation of the target sample.

3. Results and Discussion

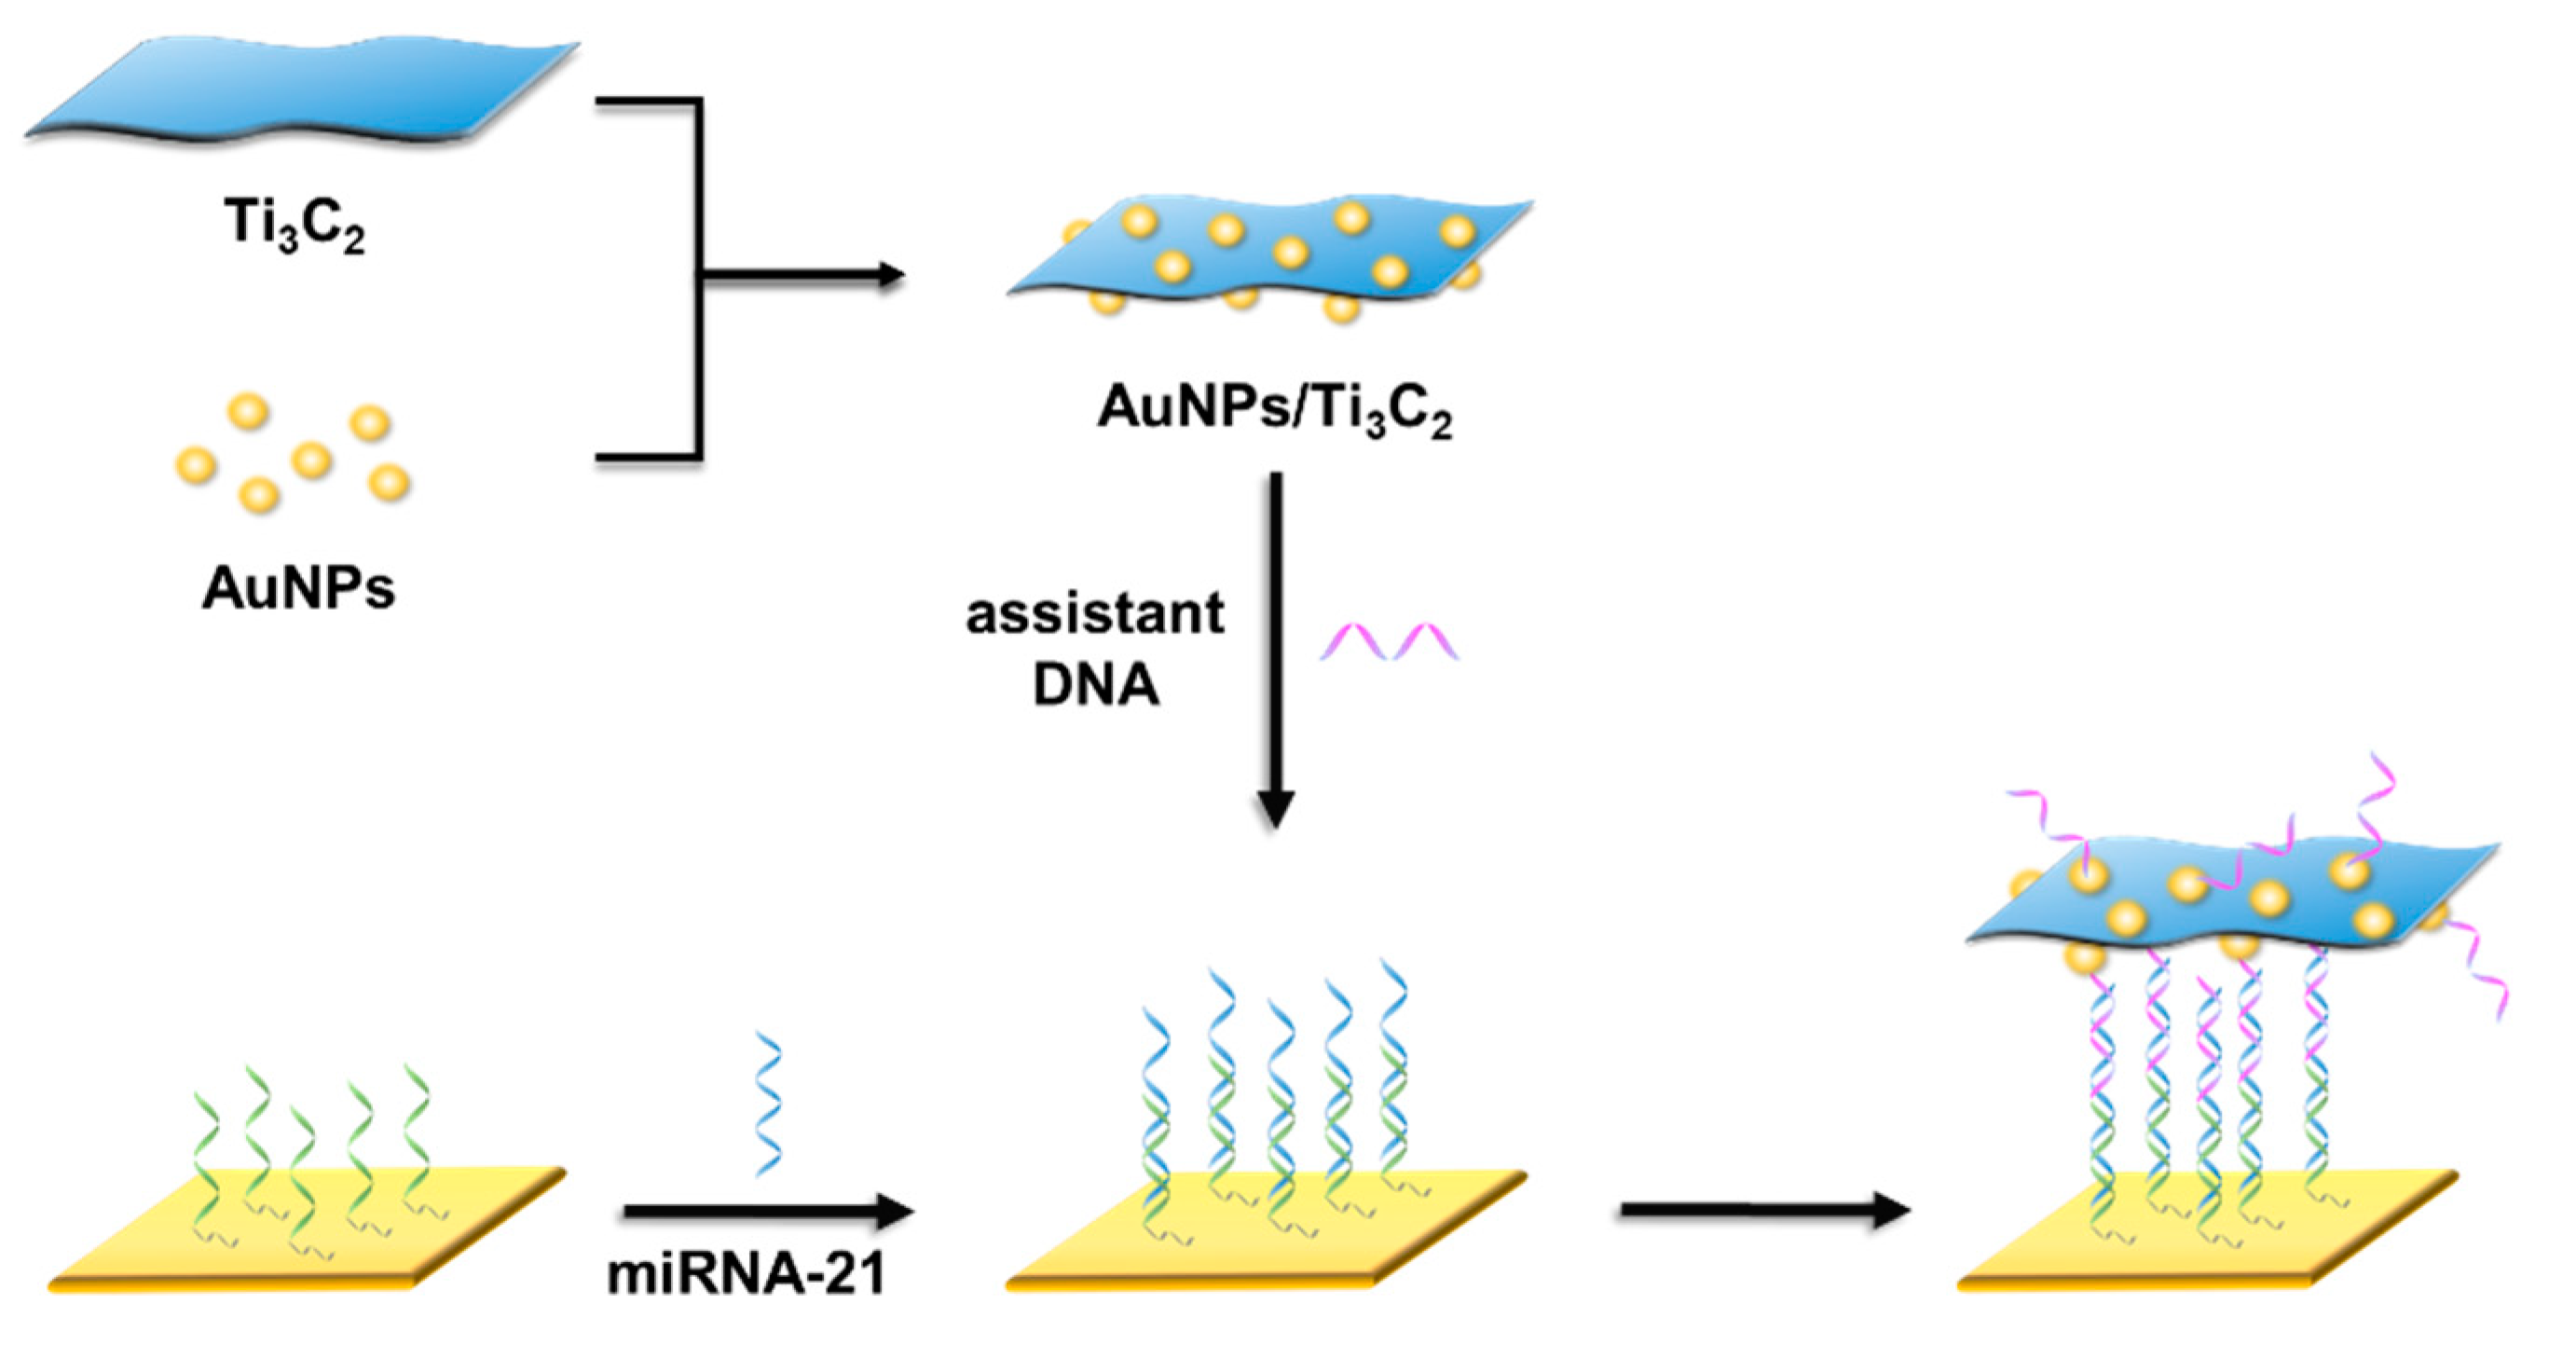
3.1. SPRi Detection Principle

The detection principle of the AuNPs/Ti3C2-SPRi biosensor is shown in Scheme 1. There are two steps. First, the capture probe with polyadenine (polyA) block is quickly immobilized on the surface of the gold chip by freezing method in on step, and specifically binds to the miRNA fragment. In the second step, the accessory DNA attached to the AuNPs/Ti3C2 composite can recognize the remainder of the target miRNA and form a sandwich structure, thereby enabling the amplification of the SPRi signal. The Ti3C2 nanosheet with large specific surface area was loaded with a large number of AuNPs, and the LSPR of AuNPs was electromagnetically coupled to the gold membrane.

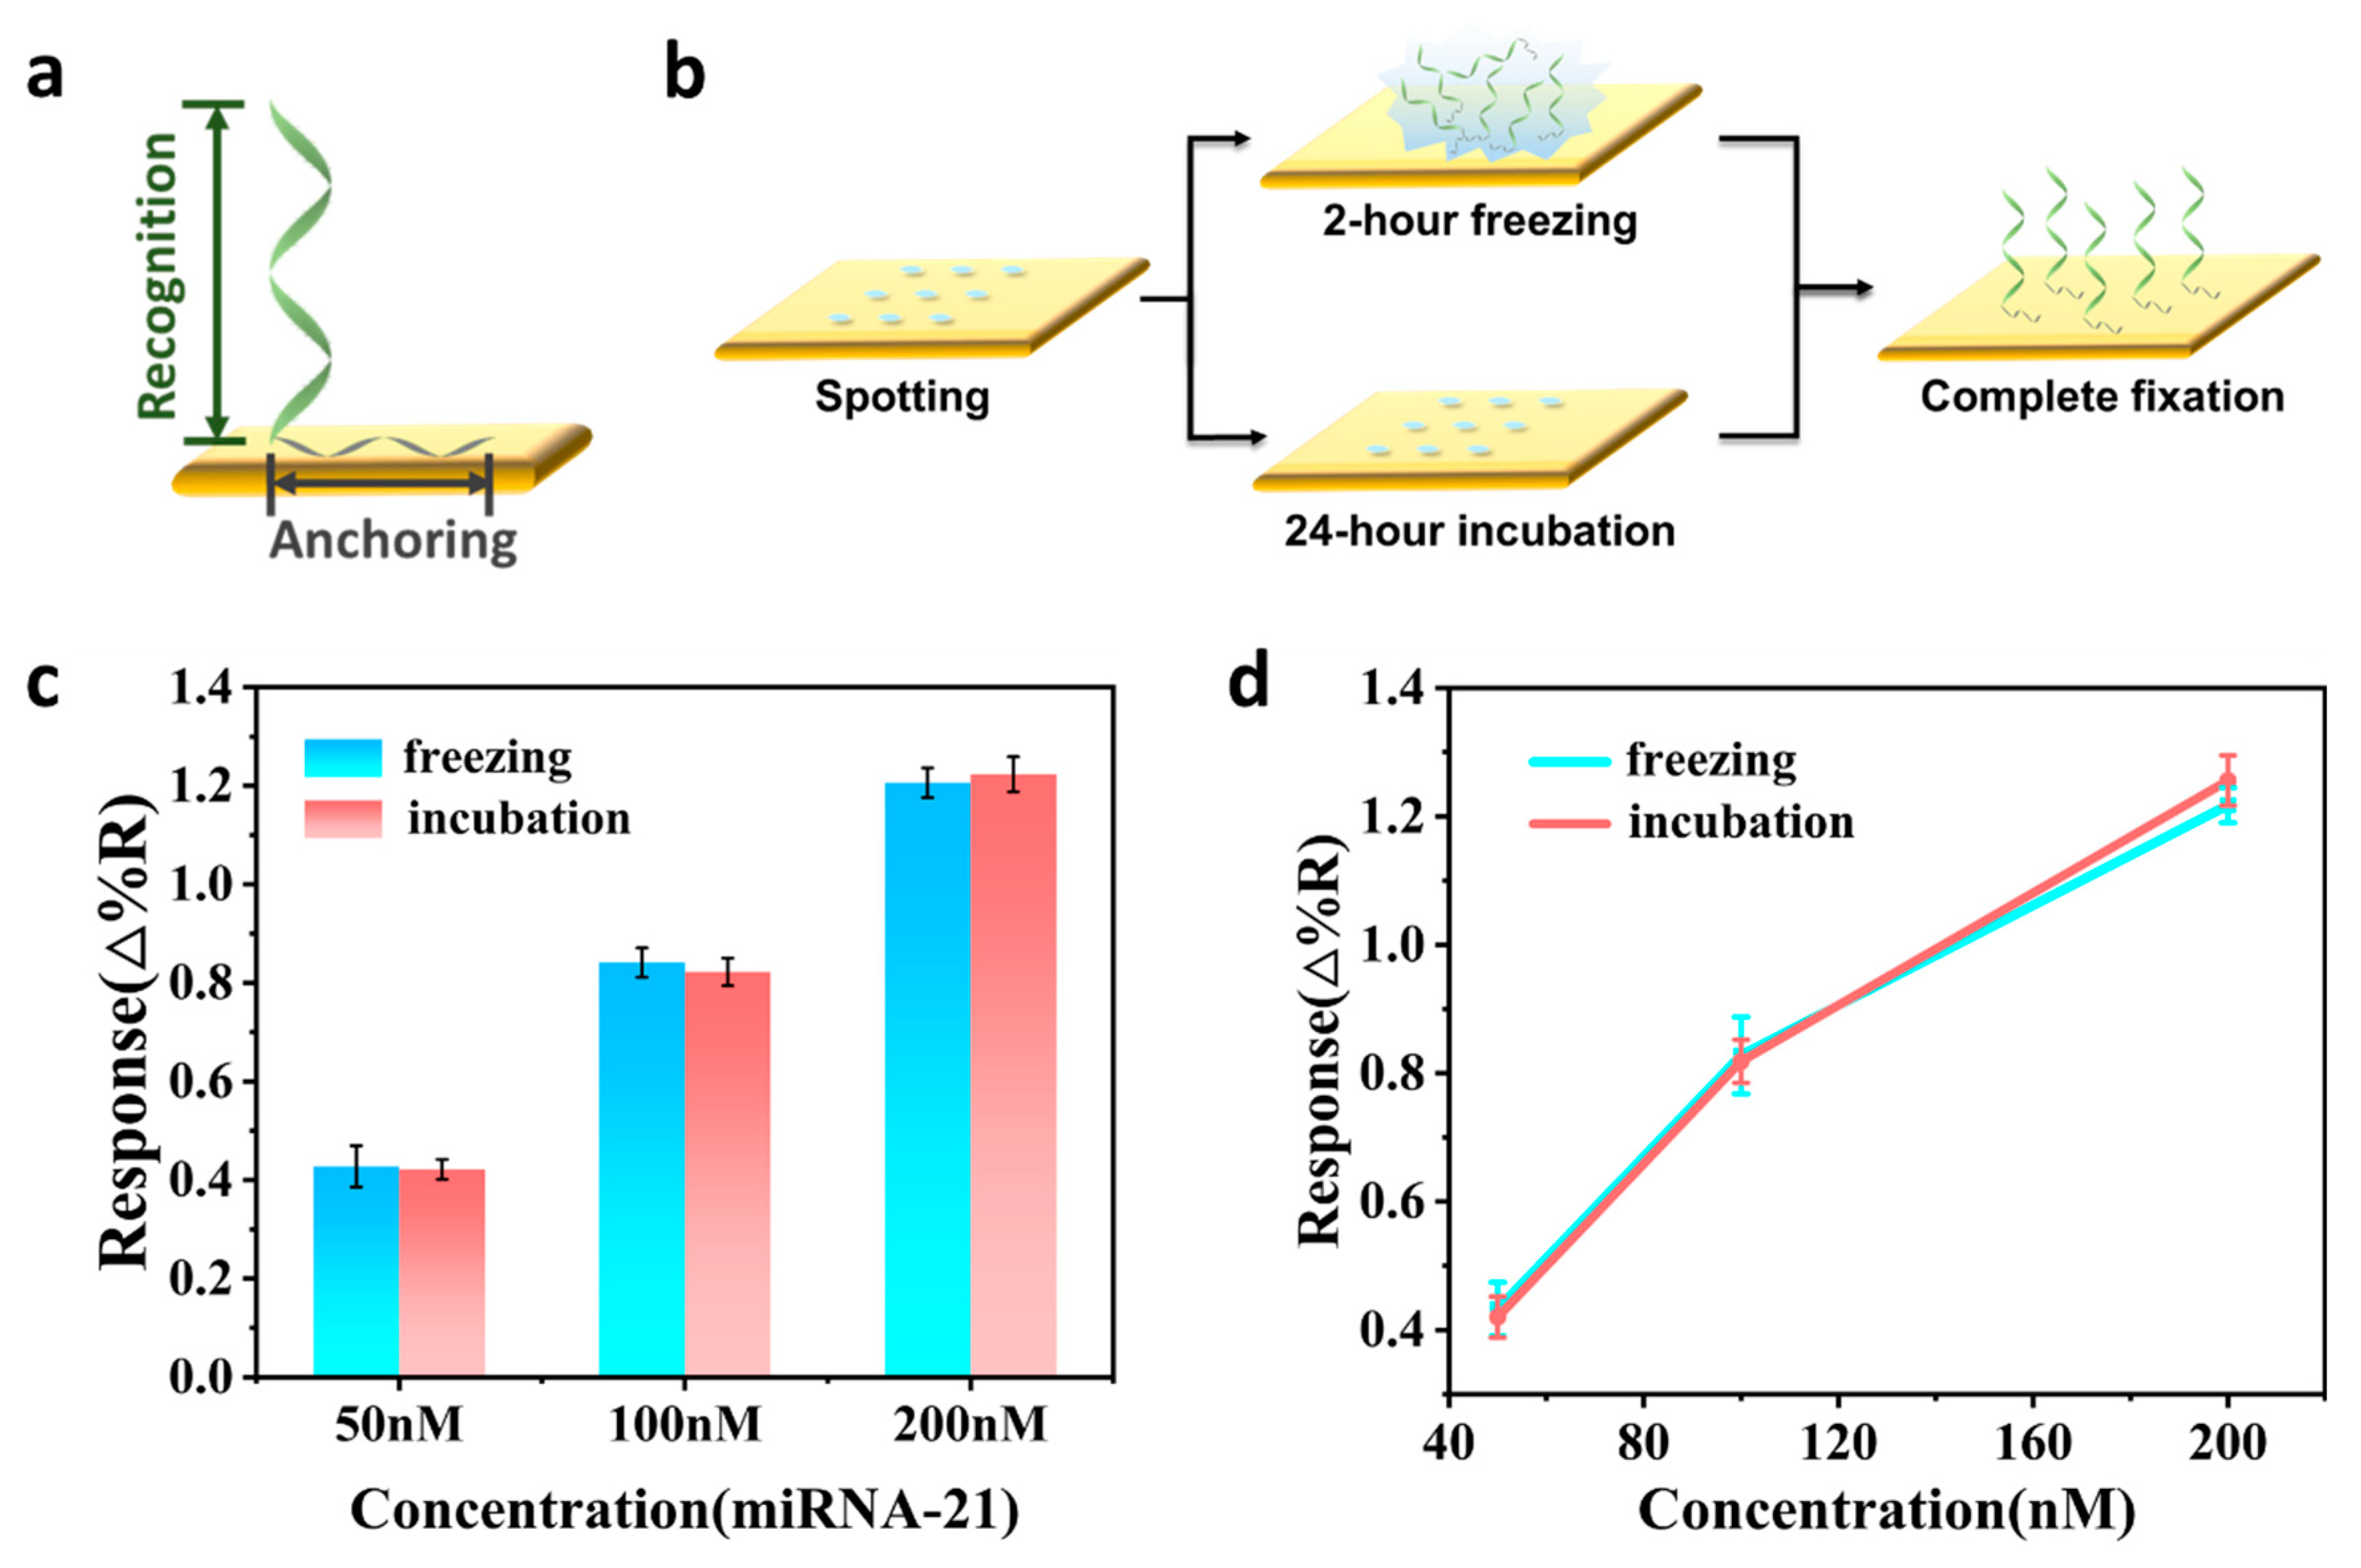
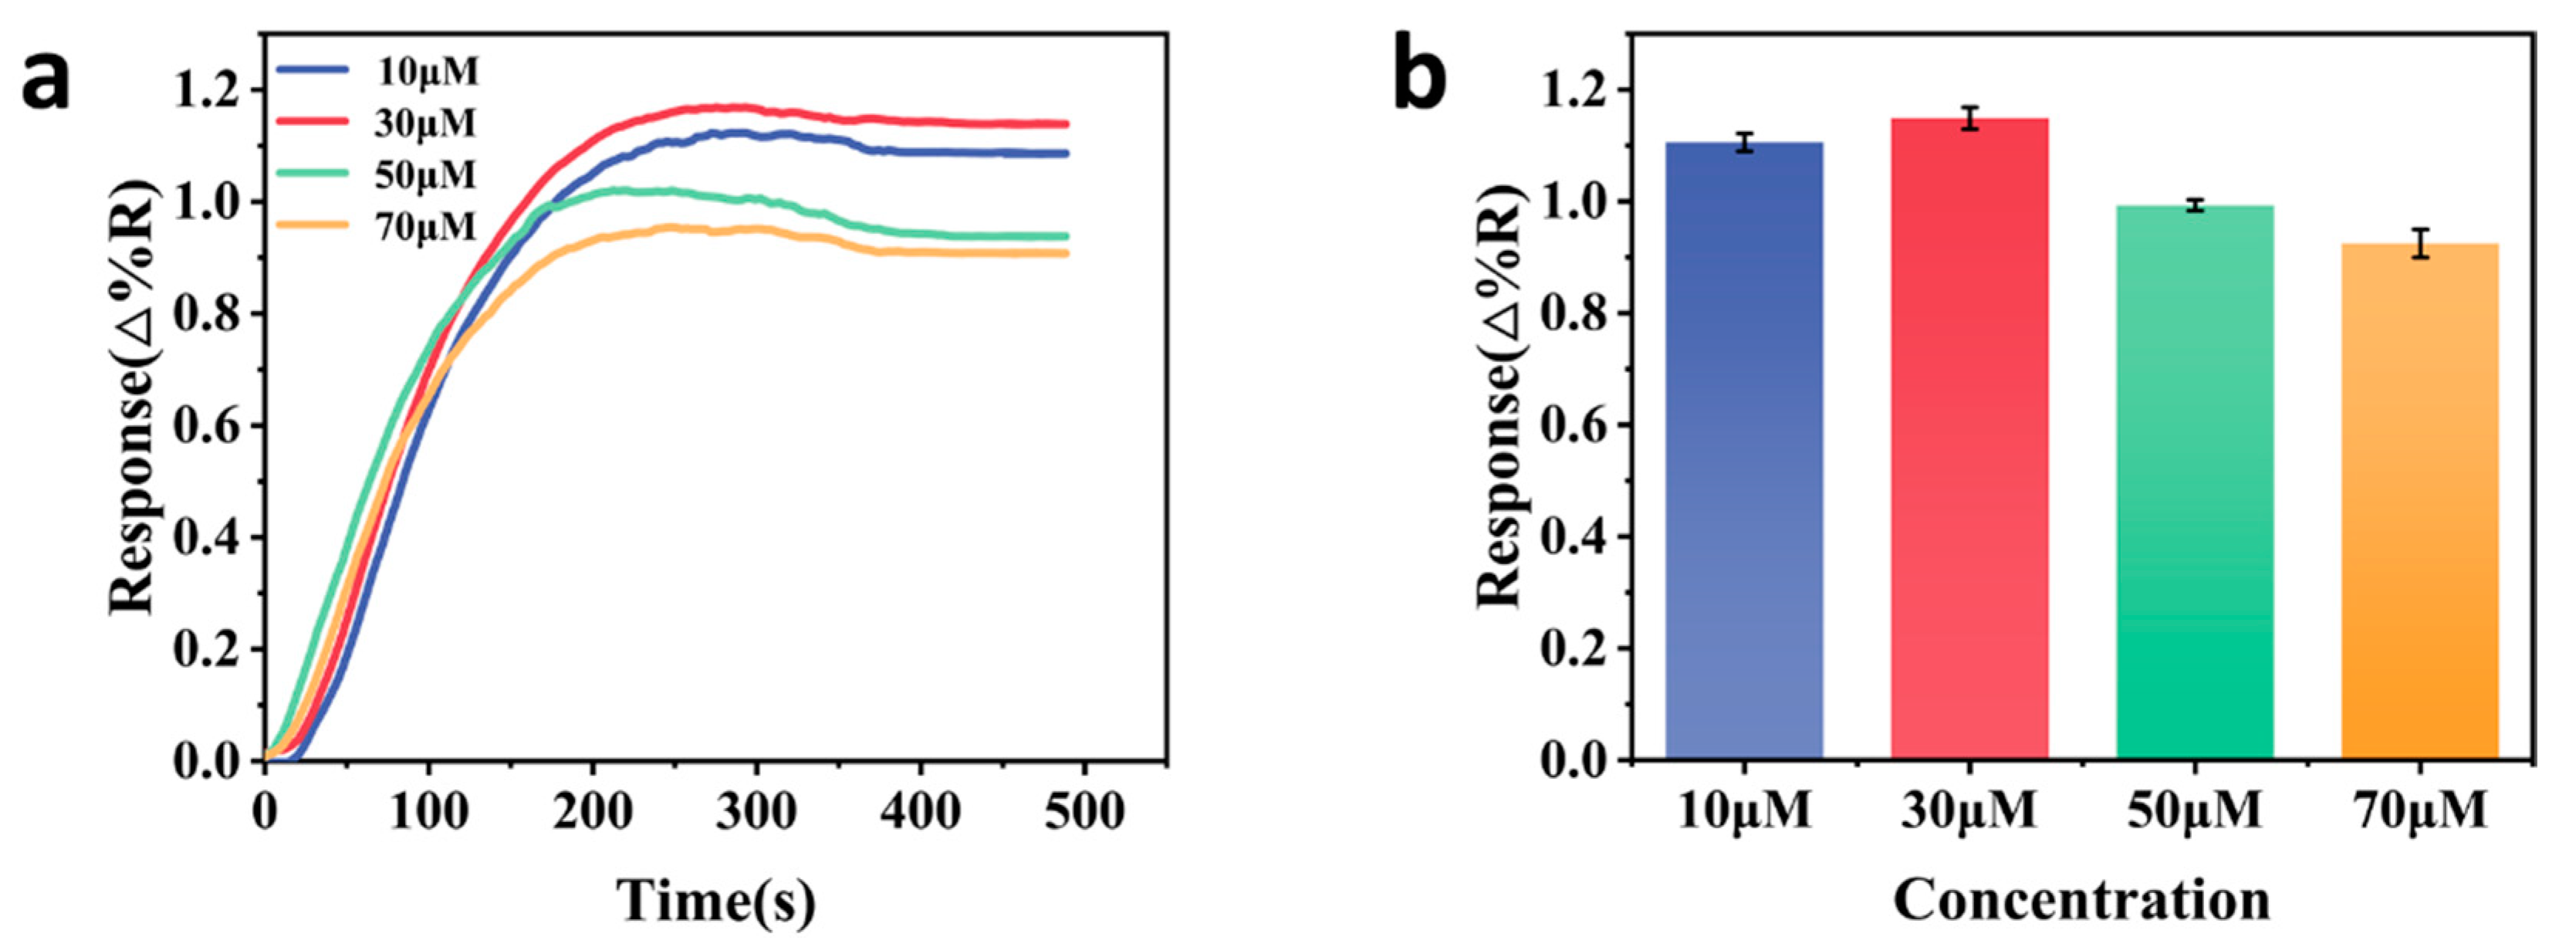
3.2. Optimization of Experimental Conditions

It has been experimentally demonstrated that the adenine (A) bases in polyA−DNA probes have an intrinsic affinity with the gold surface and can be used as effective anchoring inserts for self-assembly on the surface of the gold chip [33,34]. As shown in Figure 1a, the polyA fragment fits tightly on the chip surface, and the rest of it is vertical, which can specifically bind to the target miRNA. And since the polyA block has a certain length, it can spontaneously control the density of the capture probes. In addition, the use of polyA−DNA as a probe for recognizing target substances eliminates the step of using MCH to block the spatial site, therefore, the probe is also cost-effective and environmentally friendly. Based on these conclusions, polyA−DNA was chosen as the capture probe in this study. The immobilization and density of the capture probe are essential for the detection of the target substance and are key factors to ensure that the biosensor produces the strongest SPRi signal. In SPRi detection, the conventional method for functionalizing a biochip is to spot sample the capture probe on the chip surface and immobilize it by incubating it overnight at room temperature. Such a fixation method is time-consuming. Therefore, there is a need for a time-saving, faster method of probe immobilization. Our previous work has demonstrated that capture probes can be immobilized on the surface of a biochip by taking advantage of the unique physical process that occurs during freezing due to the unique concentration effect and stability of biopolymers during the freezing process [31]. As shown in Fig 1b, in this experiment, the capture probes were immobilized on the surface of the biochip by the room temperature incubation method and the freezing method, and then different concentrations of miRNA-21 were added, and the signal response values generated by the capture probes immobilized with different methods were recorded. The experimental results are shown in Figure 1c,d. For the same concentration of miRNA-21, the response signal values produced by the probe capture probe are similar in both methods. Three different concentrations of miRNA-21 (200 nM, 100 nM, and 50 nM) were detected to obtain a corresponding response signal (n = 3). Thus, it was confirmed that the capture probe could be firmly immobilized on the surface of the gold microarray by the freezing method. This result could be attributed to the fact that the salt in the spotting buffer and the continuous growth of ice crystals during the freezing process (−20 °C) caused the salt and the DNA probe to adhere to the surface of the gold microarray, thus immobilizing the capture probe on the surface of the biochip. This immobilization method shortens the experimental time and the response signal obtained is not degraded, which is a faster, more efficient, and simpler method.
In order to obtain a better response signal, we optimized the concentration of the capture probe. Different concentrations of capture probes were set up for experiments to determine the optimal concentration of capture probes for subsequent experiments by comparing different SPRi signals generated at the same concentration of target miRNA. The concentration gradient of the capture probes were set to 10 μM, 30 μM, 50 μM, and 70 μM, and these four concentrations of capture probes were deposited on the chip surface in an array of 4 × 4, and the capture probes were fixed to the biochip by freezing at −20 °C for 2 h. With multiple injections of 50 nM miRNA-21, the target miRNA specifically bound to the capture probes, and the corresponding SPRi signals were observed to be generated at the spot sampling points of different concentrations of capture probes. As shown in Figure 2a,b, response signals were obtained using different concentrations of capture probes by detecting miRNA-21 at a concentration of 50 nM (n = 3). An analysis of the response signal values generated by the four concentrations of the capture probe yielded high signal values at 10 μM and 30 μM, while probes above 30 μM showed a general SPRi response. The 30 μM probes produced a signal slightly higher than that of 10 μM. Next, a one-way ANOVA was performed on the two sets of data, and the comparison of the population variance and the means showed that there were significant differences between the two sets of data. Therefore, it can be concluded that the optimal concentration of the capture probe was 30 μM. Such a result may be obtained because the capture probe was modified with 15 A bases at one end, and when immobilized on the gold chip there is a certain gap between the probe and the probe, and the DNA is negatively charged, which results in electrostatic repulsion. Therefore, high concentration of capture probe is overcrowded and has a large spatial site resistance, preventing the hybridization of a large number of target miRNA. The low concentration of the capture probe has small spatial site resistance, but the number is too small, which is unfavorable for the immobilization of the probe, and can only capture a small number of target miRNA. Therefore, the concentrations of the capture probes were set to 30 μM for further experiments.

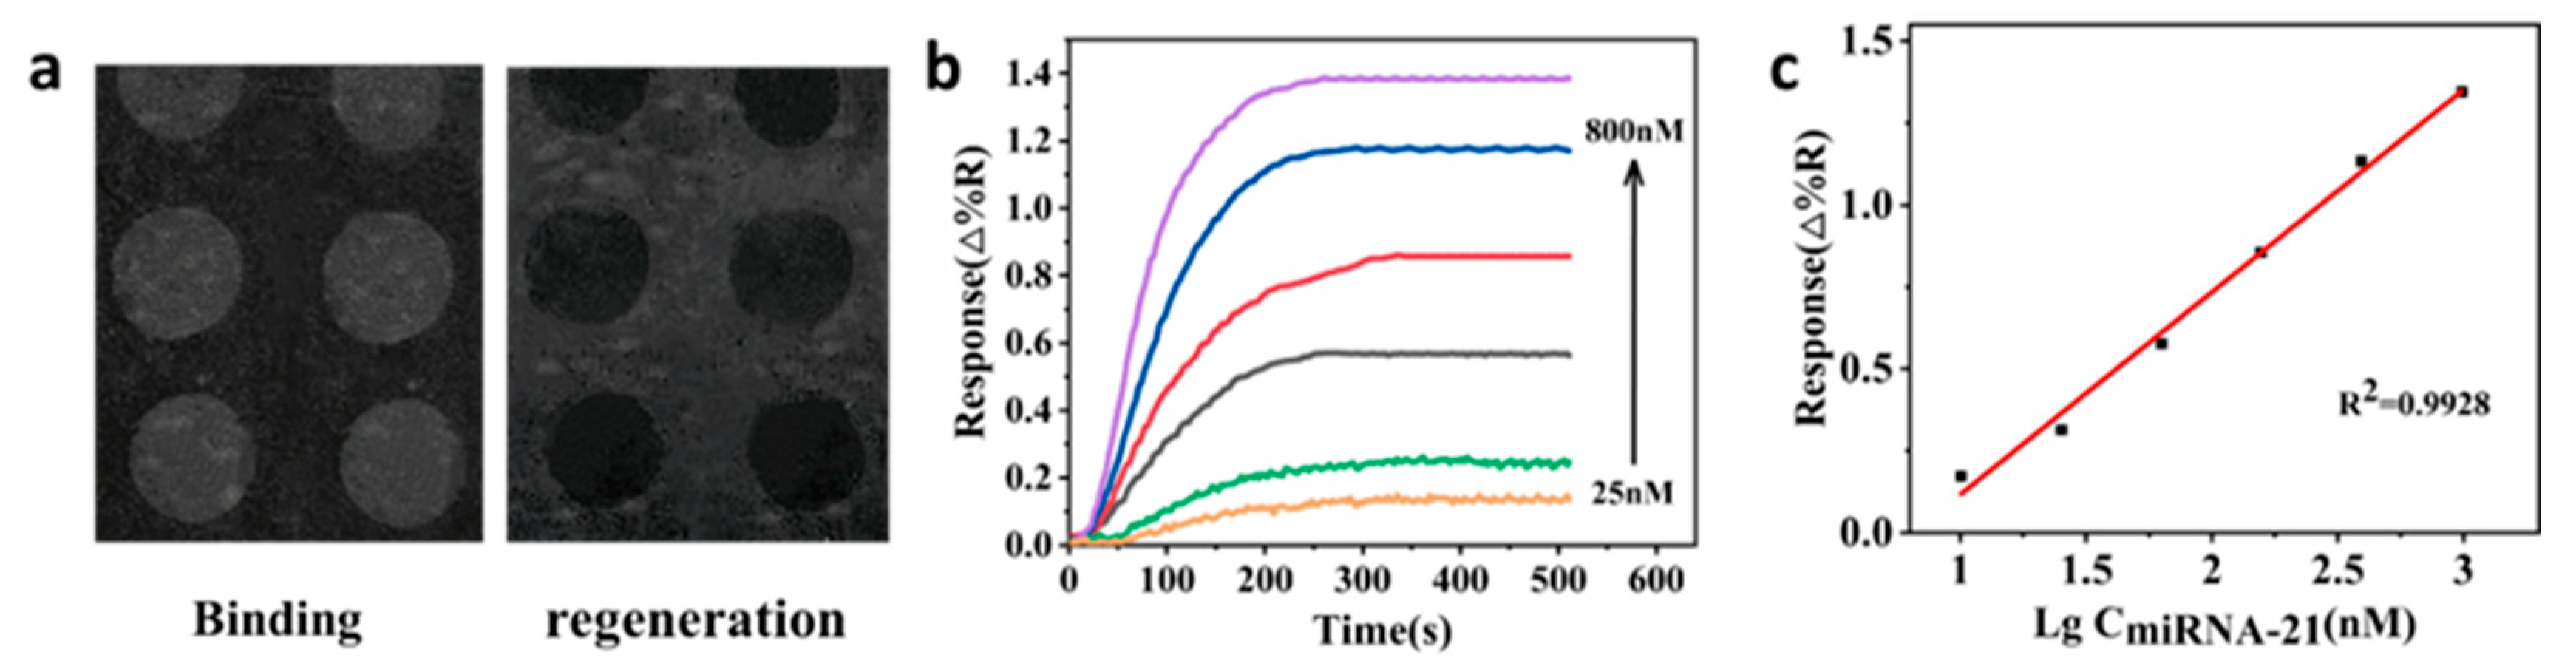
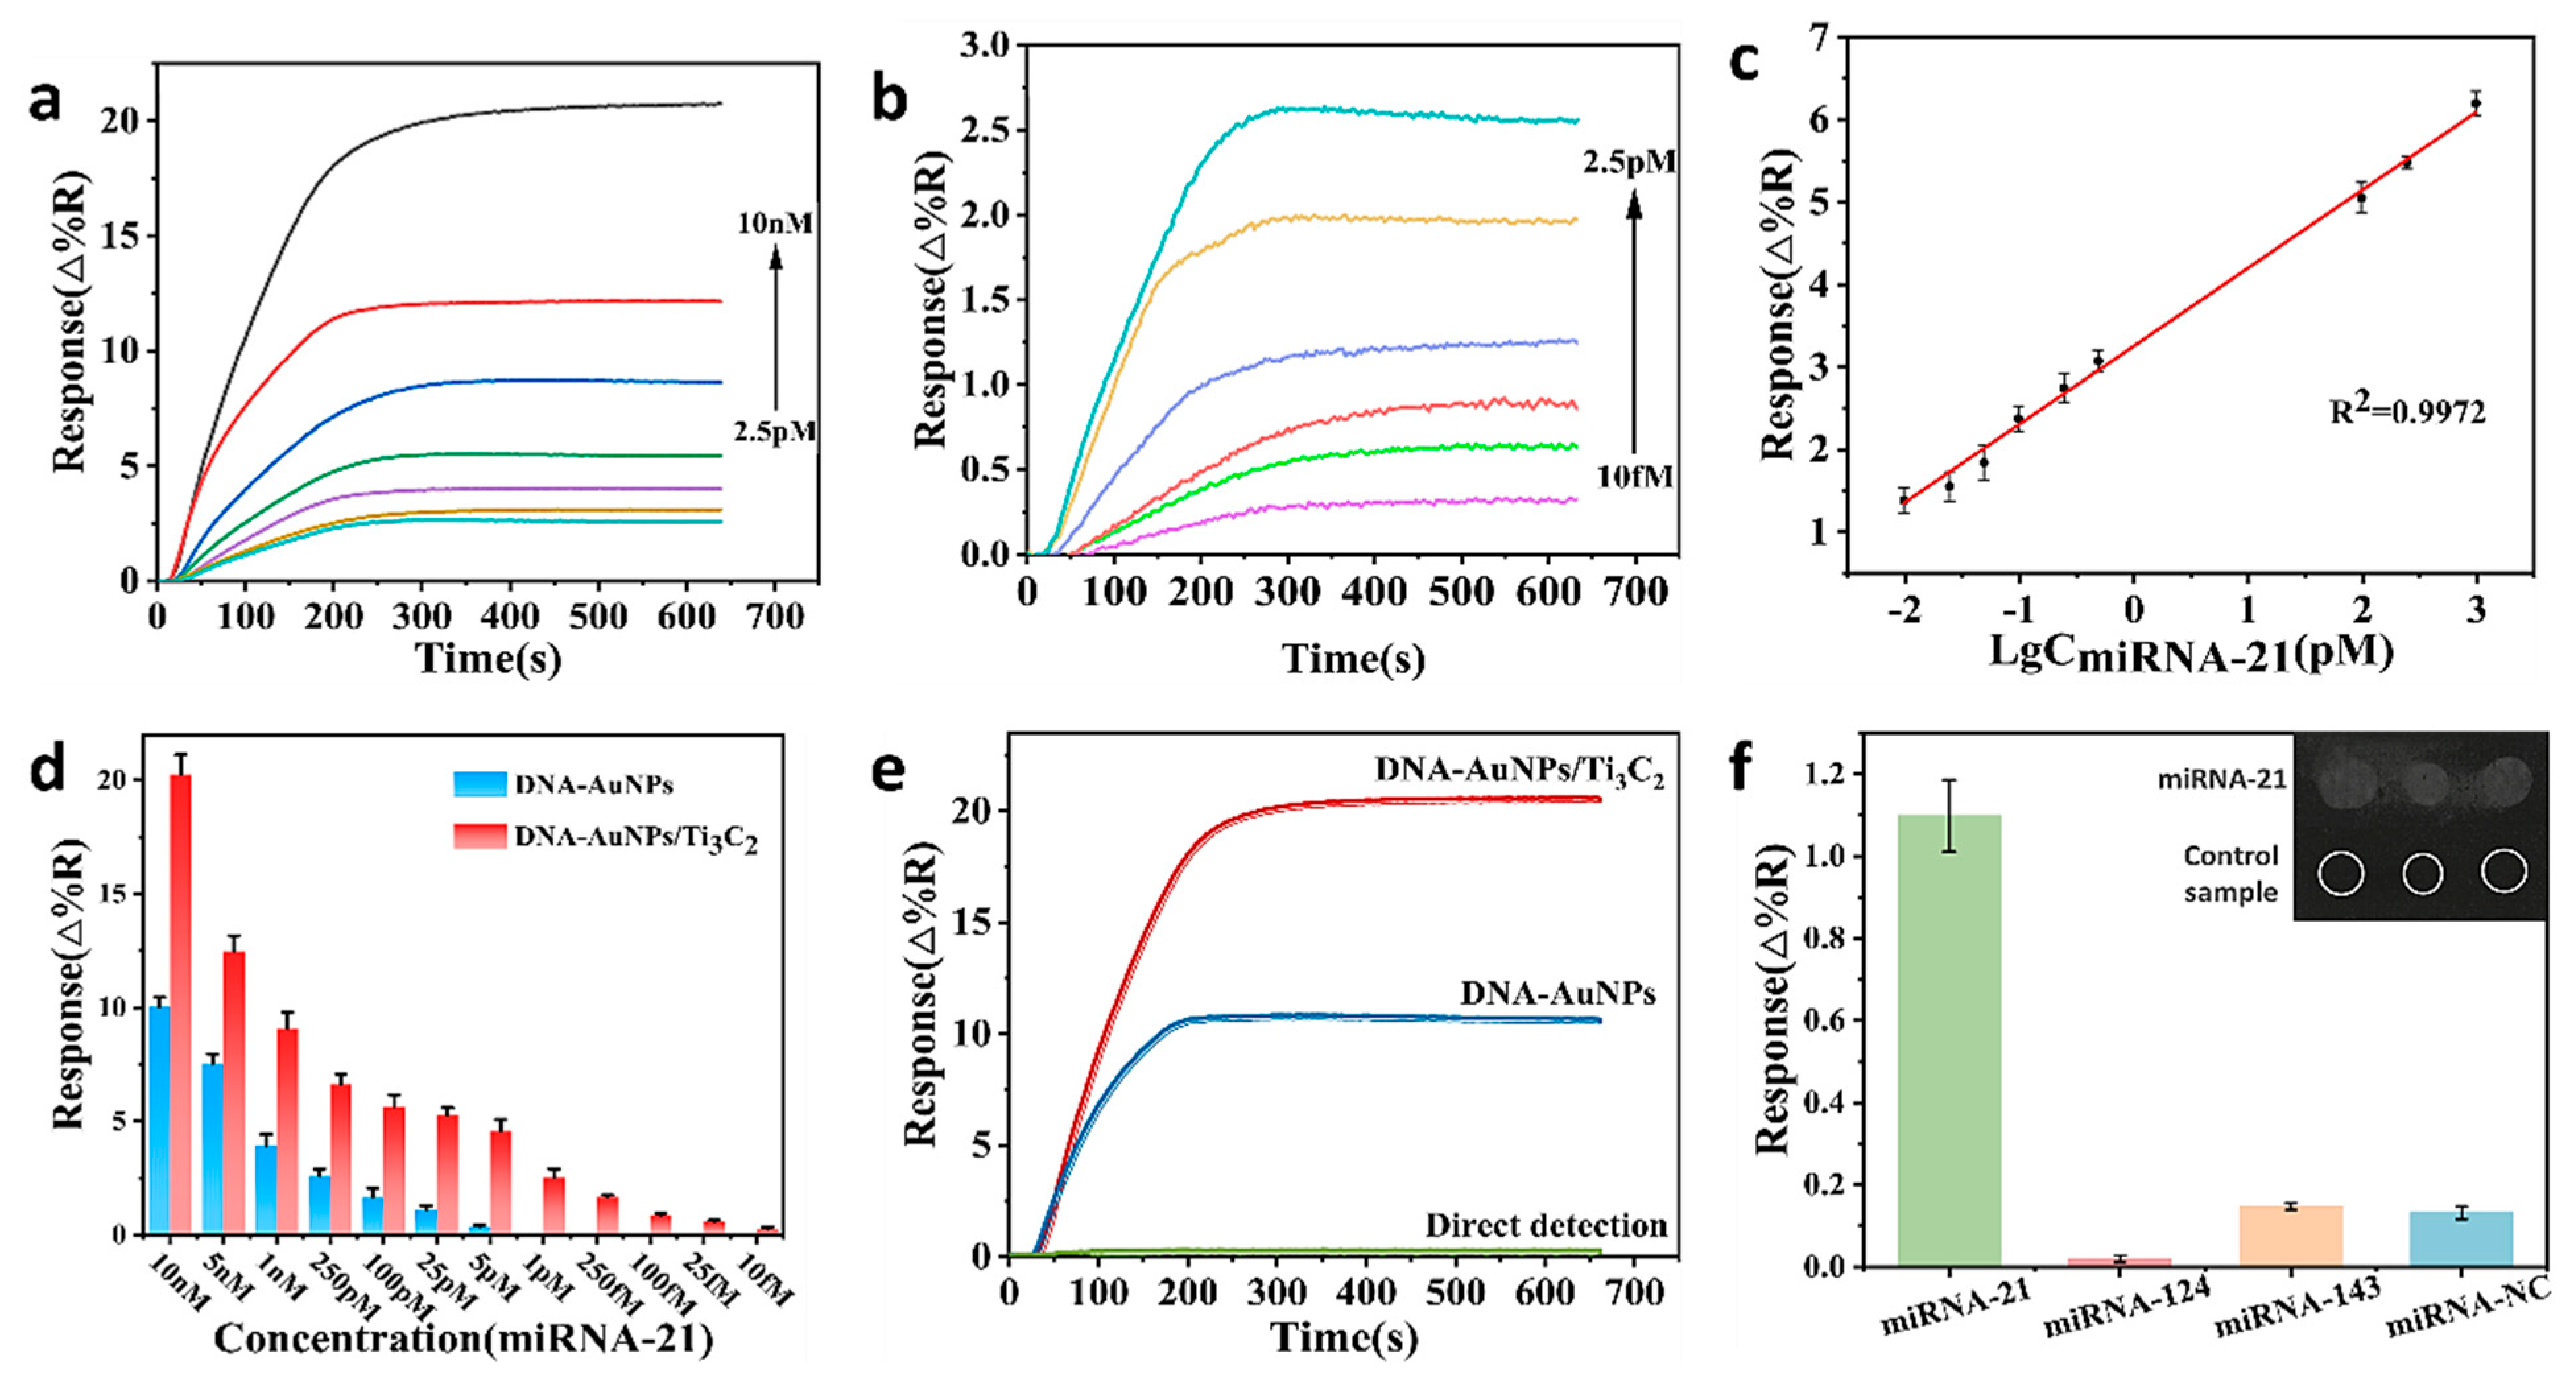
3.3. Direct Detection of Target miRNA-21

A microarray of capture probes with a concentration of 30 μM was established on the surface of the chip, and the immobilization of the capture probes was accomplished by the freezing method. After the biochip was simply cleaned and dried and put into the instrument, the injected miRNA-21 flowed through the chip surface at a flow rate of 50 μL/min, and specifically bound to the capture probe, and the signal response value generated by each spot sample spot under different concentrations of miRNA-21 was recorded. A real-time differential plot of the spot points on the chip surface is shown in Figure 3a. When miRNA-21 binds effectively to the capture probe, the spotting spot becomes brighter. The sensor chip is generally regenerative, and since NaOH can effectively break the hydrogen bond between DNA and RNA double strands, 50 mM NaOH was injected for simple de-washing. From the real-time difference plot of the chip, the dot-like spots can be seen to darken, indicating that miRNA-21 has been dissociated from the capture probe and the sensor chip can be regenerated. As shown in Figure 3b, the SPRi signal increased with the increase of miRNA-21 concentration (800 nM, 400 nM, 200 nM, 100 nM, 50 nM, and 25 nM), indicating that the target material had effectively bound to the capture probe. As shown in Figure 3c, the SPRi response calibration curve had a good linear relationship with the logarithm of miRNA-21 sample concentration between 25 nM and 800 nM. The SPRi measurement gives an equilibrium dissociation constant KD = Kd/Ka in M (mol/L). KD is inversely proportional to affinity. That is, the lower the KD value, the stronger the affinity between the sample and the probe. According to the sensor diagram, the equilibrium dissociation constant of the interacting KD was calculated to be 2.6 (±0.3) nM, which indicates that the direct detection dissociation rate of the sensor is slow and the chip has good binding ability. However, due to the small molecular weight of the target miRNA-21, the minimum concentration detected without a signal amplification strategy was too high, and the resulting SPRi response was much less strong than that produced by proteins with larger molecular weights or metal particles with optical properties. In order to further reduce the detection limit and improve sensor sensitivity, the introduction of signal amplification materials is required.

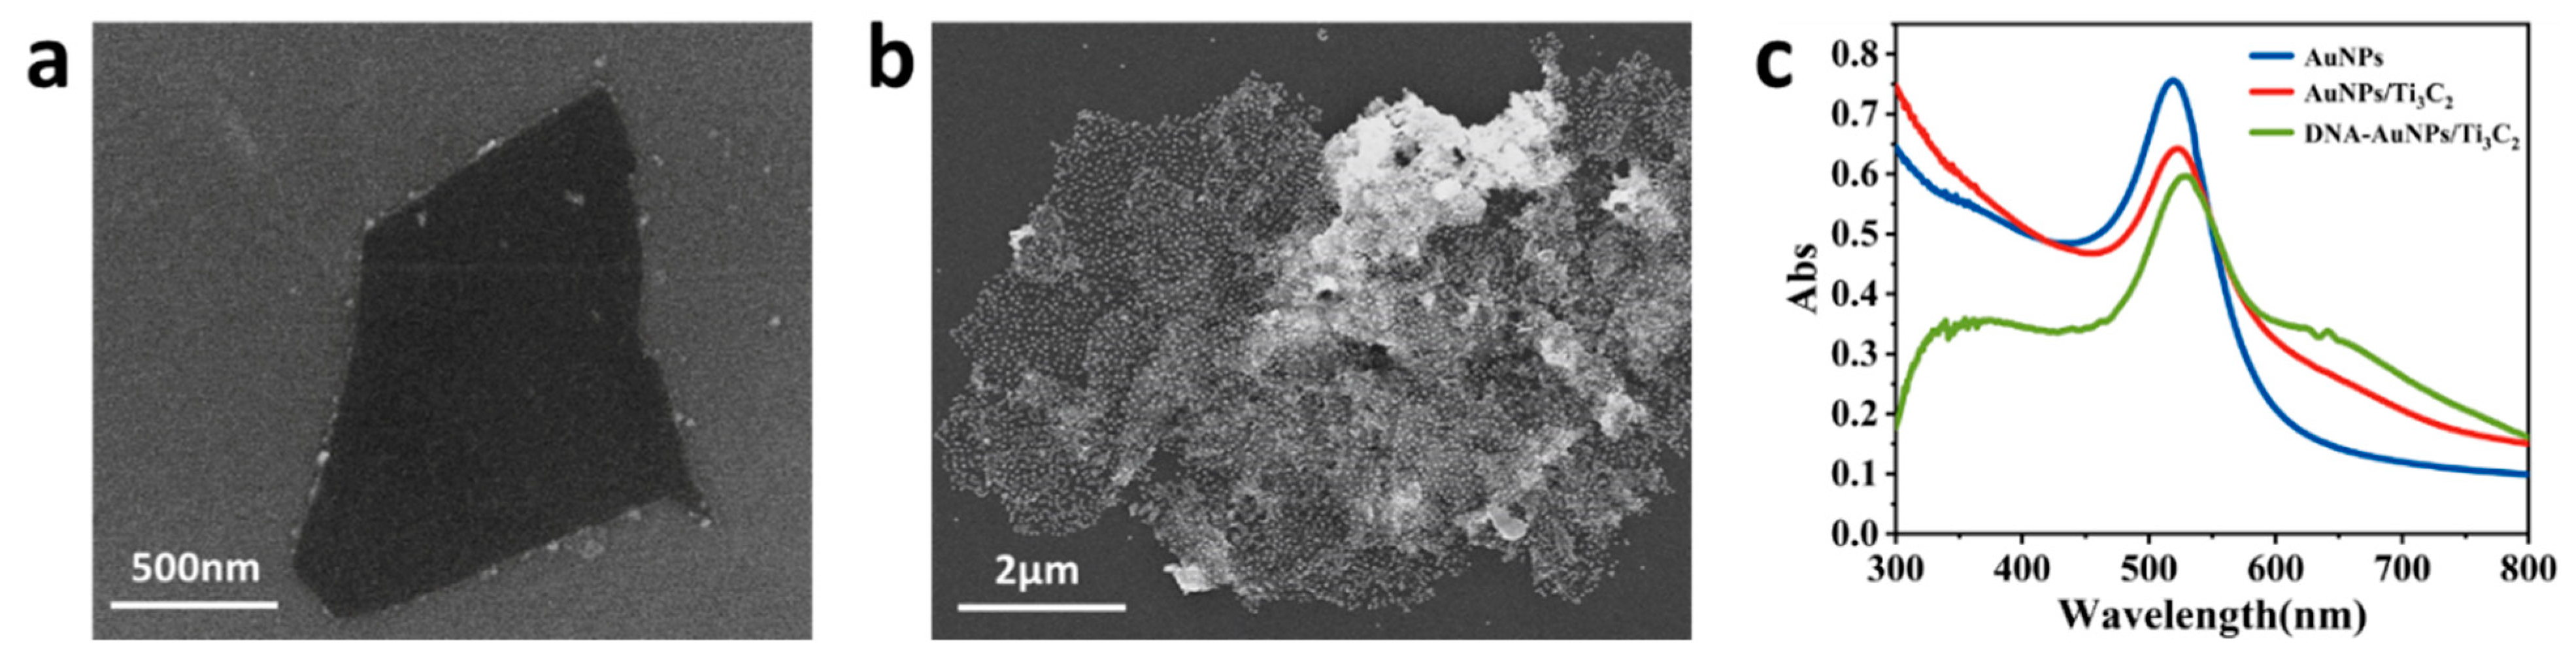
3.4. Characterization of AuNPs/Ti3C2 and DNA−AuNPs/Ti3C2 Composites

The lowest concentration directly detected was 25 nM, and in order to further bring down the detection limit, DNA−AuNPs/Ti3C2 composites were, and the basic DNA−AuNPs couplings were used for comparison. As shown in Figure S1a, the AuNPs are 16 ± 2 nm in diameter and have a uniform size distribution. Figure S1b shows that AuNPs of this size show a strong UV absorption peak at 518 nm. When the auxiliary DNA was coupled to the AuNPs, the absorption peak was shifted to 526 nm. This is because the local dielectric constant of the AuNPs changed during the connection of the DNA−AuNPs coupler, indicating that the DNA successfully formed a coupling with the AuNPs. The SEM of the Ti3C2 nanosheets is shown in Figure 4a, which shows that they have a smooth surface and a monolayer, ultrathin shape. The ultrathin Ti3C2 nanosheets had a large number of AuNPs attached to them, as can be seen in Figure 4b. The UV-Vis absorption spectra are shown in Figure 4c, and the maximum absorption peak of the AuNPs/Ti3C2 complexes is at 523 nm, which is red-shifted by 5 nm compared to AuNPs. AuNPs were successfully attached to Ti3C2 nanosheets. The characteristic absorption peak of DNA−AuNPs/Ti3C2 is at 529 nm, corresponding to the maximum absorption peak of the AuNPs/Ti3C2 complex and red-shifted by 6 nm compared to that of AuNPs/Ti3C2, which demonstrated that the auxiliary DNA used for signal amplification was successfully labeled on the AuNPs/Ti3C2 complex.

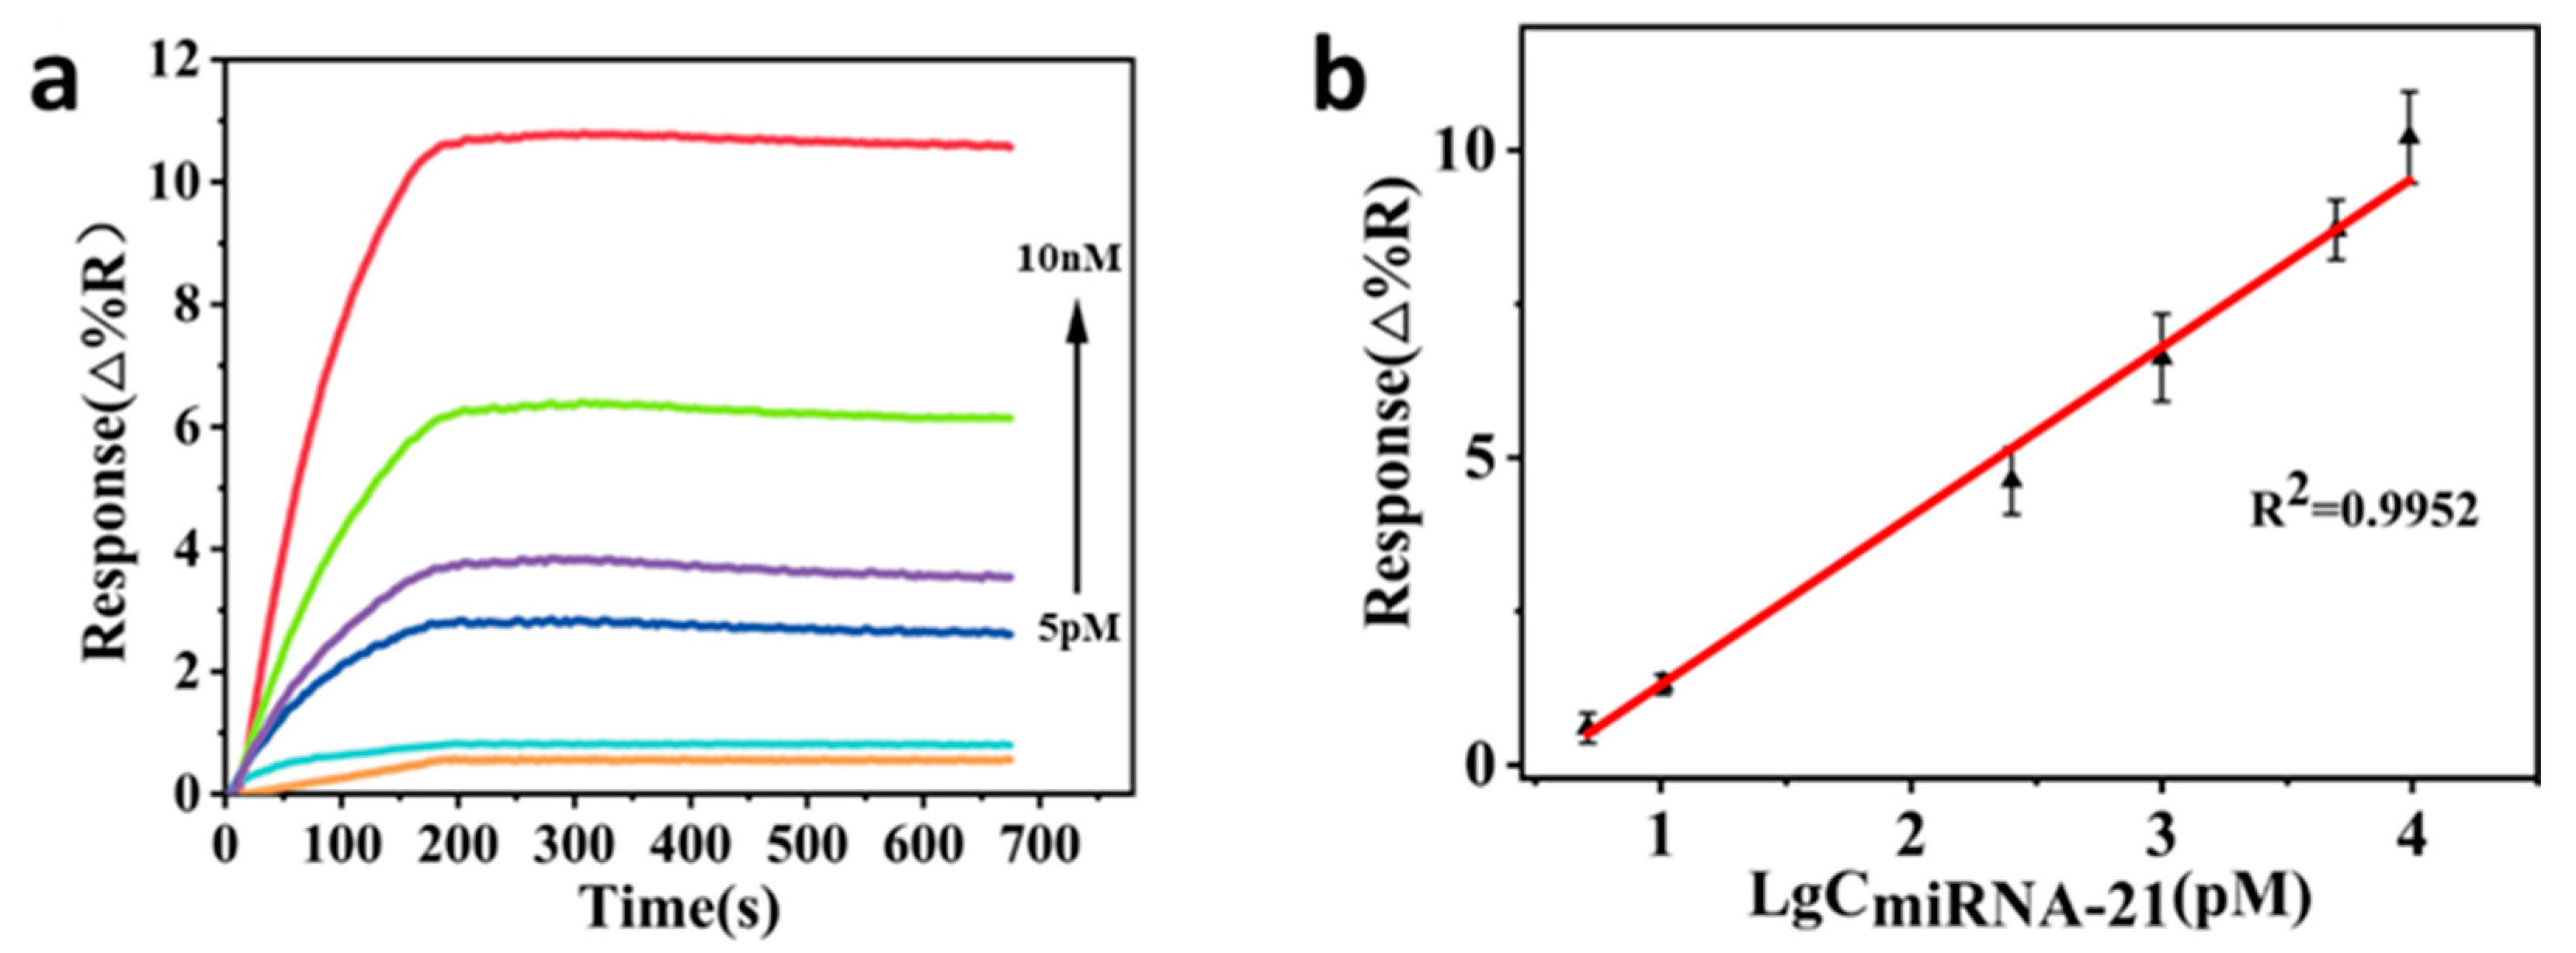
3.5. Enhanced SPRi Signaling by DNA−AuNPs/Ti3C2

When directly detecting the target miRNA-21, the sensor detection limit is too high and not sensitive. Therefore, signal amplification is needed to detect lower concentrations of the target material. Due to the properties of noble metal nanoparticles such as stability, unique optical and electronic properties, and electromagnetic coupling effects between their surface LSPR and SPR metal-sensitive films, AuNPs are usually chosen as signal amplification materials when designing signal amplification strategies. In SPRi detection, 2D materials and AuNPs can be synergized in order to utilize the signal amplification ability of AuNPs to a greater extent. The material Ti3C2 nanosheet has a large specific surface area, and a large number of AuNPs can be attached to the surface to form AuNPs/Ti3C2 complexes, which will greatly reduce the detection limit when applied in miRNA detection. When using DNA−AuNPs/Ti3C2 couplings for signal amplification, a sandwich complex structure is formed with the capture probe immobilized on the chip surface and the target miRNA that undergoes specific binding. It is well known that there are two reasons for SPRi signal amplification: electromagnetic effect and mass effect. The sensor designed in this study can then enhance the SPRi response signal through these two aspects. In the first point, the LSPR of the large number of AuNPs attached to the Ti3C2 nanosheet creates an electromagnetic coupling effect with the plasma wave on the surface of the chip’s metal film, which enhances the SPRi response. In the second point, the Ti3C2 nanosheet can be loaded with a large number of AuNPs, which increases the quality of the surface deposition when connected to the chip surface with the target material for recognition, and the SPRi signal is further enhanced.
In this work, a signal-amplifying substance was added to reduce the detection limit of the sensor. To confirm the signal-enhancing ability of DNA−AuNPs/Ti3C2 couplings when used as signal-amplifying materials, comparisons were made with conventional DNA−AuNPs couplings. Capture probes with a concentration of 30 μM were immobilized on the biochip, and then 10 nM miRNA-21 were injected to flow over the chip surface at a low flow rate. Due to the small molecular weight of the target miRNA itself and the low sample concentration, the SPRi signal generated is weak. DNA−AuNPs couplings were first introduced to enhance SPRi signaling and used as a comparison experiment. As shown in Figure 5a, after the conjugated auxiliary DNA were stabilized by binding to the target miRNA-21, it was observed that the SPRi response signal was effectively enhanced. The SPRi signaling response was correspondingly weakened by decreasing the concentration of target miRNA-21 in equal proportion. The lowest concentration of miRNA-21 that could be detected when signal amplification was performed using the DNA−AuNPs couplers is 5 pM. The plot of the relationship between SPRi response and the logarithm of the concentration of miRNA-21 in Figure 5b shows that the sensor has a good linearity in the range of 5 pM–10 nM, with a linear regression equation of Y = 2.154 × lgc(pM) + 2.457 and a correlation coefficient of 0.9903. The LOD was calculated by adding the mean of the three SPRi enhancement signals after injection into PBS running buffer to a 3-fold standard deviation, and the LOD combined with the linear regression equation was 3.17 pM. Signal amplification was next performed with DNA−AuNPs/Ti3C2 couplers. Figure 6a,b shows the signal response curve of the sensor in the concentration range of miRNA-21 10 nM-10 fM. The relationship between the SPRi response based on the DNA−AuNPs/Ti3C2 coupling and the logarithm of miRNA-21 concentration is plotted in Figure 6c, which shows that the sensor has a good linear relationship in the range of 10 nM-10 fM. The linear regression equation was Y = 1.20795 × lgC(pM) + 2.5806, with a correlation coefficient of 0.9972, according to the LOD calculation method described above and the linear regression equation. In addition, when the signal-to-noise ratio was 3, the LOD was calculated as 6.13 fM and the equilibrium dissociation constant of the interacting KD was calculated as 6.4 (±0.3) fM. Signal amplification using DNA−AuNPs/Ti3C2 conjugates yields 1000-fold lower detection limits compared to DNA−AuNPs. As can be observed from Figure 6d, the concentration of miRNA-21 is within 5 pM–10 nM, and the target miRNA-21 of the same concentration is amplified by DNA−AuNPs/Ti3C2 and DNA−AuNPs, respectively. The former SPRi response signal enhancement effect is much better than that of the latter. When the miRNA-21 concentration is lower than 5 pM, the conventional signal amplification ability has reached its limit, and when AuNPs/Ti3C2 material is introduced for signal amplification, the minimum concentration of miRNA-21 for direct detection can reach 10 fM. Figure 6e shows the SPRi response signals obtained by the three methods (direct detection, amplification by DNA−AuNPs, and amplification by DNA−AuNPs/Ti3C2) at a miRNA-21 concentration of 10 nM; the results showed that DNA−AuNPs/Ti3C2 produced two times the SPRi signal compared to DNA−AuNPs. The above findings confirm that the AuNPs/Ti3C2-SPRi biosensor has a strong signal amplification capability.

3.6. Specificity of SPRi Biosensors

The related sequences of miRNA are usually highly homologous. Therefore, miRNA-124, miRNA-143, and miRNA-NC were selected to verify the specificity and selectivity of the designed sensor. The capture probe complementary to miRNA-21 bases was deposited on a cleaned biochip. Four miRNA samples were prepared, each at a concentration of 100 nM, and injected sequentially, waited for the reaction curve to stabilize, and recorded the reaction signals generated by the different samples. The results are shown in Figure 6f. Only miRNA-21 produced a high SPRi response signal, proving that miRNA-21 specifically binds to CP-21. While the rest of the samples were unable to pair-bind properly with the capture probe and only produced weak response signals. MiRNA-21 produced 6-fold more response signals than the control samples. It can also be seen from the chip difference plot in the upper right corner of Figure 6f that only the target sample caused the spots to brighten. These results show that the designed sensor has excellent selectivity in distinguishing miRNA with similar sequences, which further supports the feasibility of the proposed method.

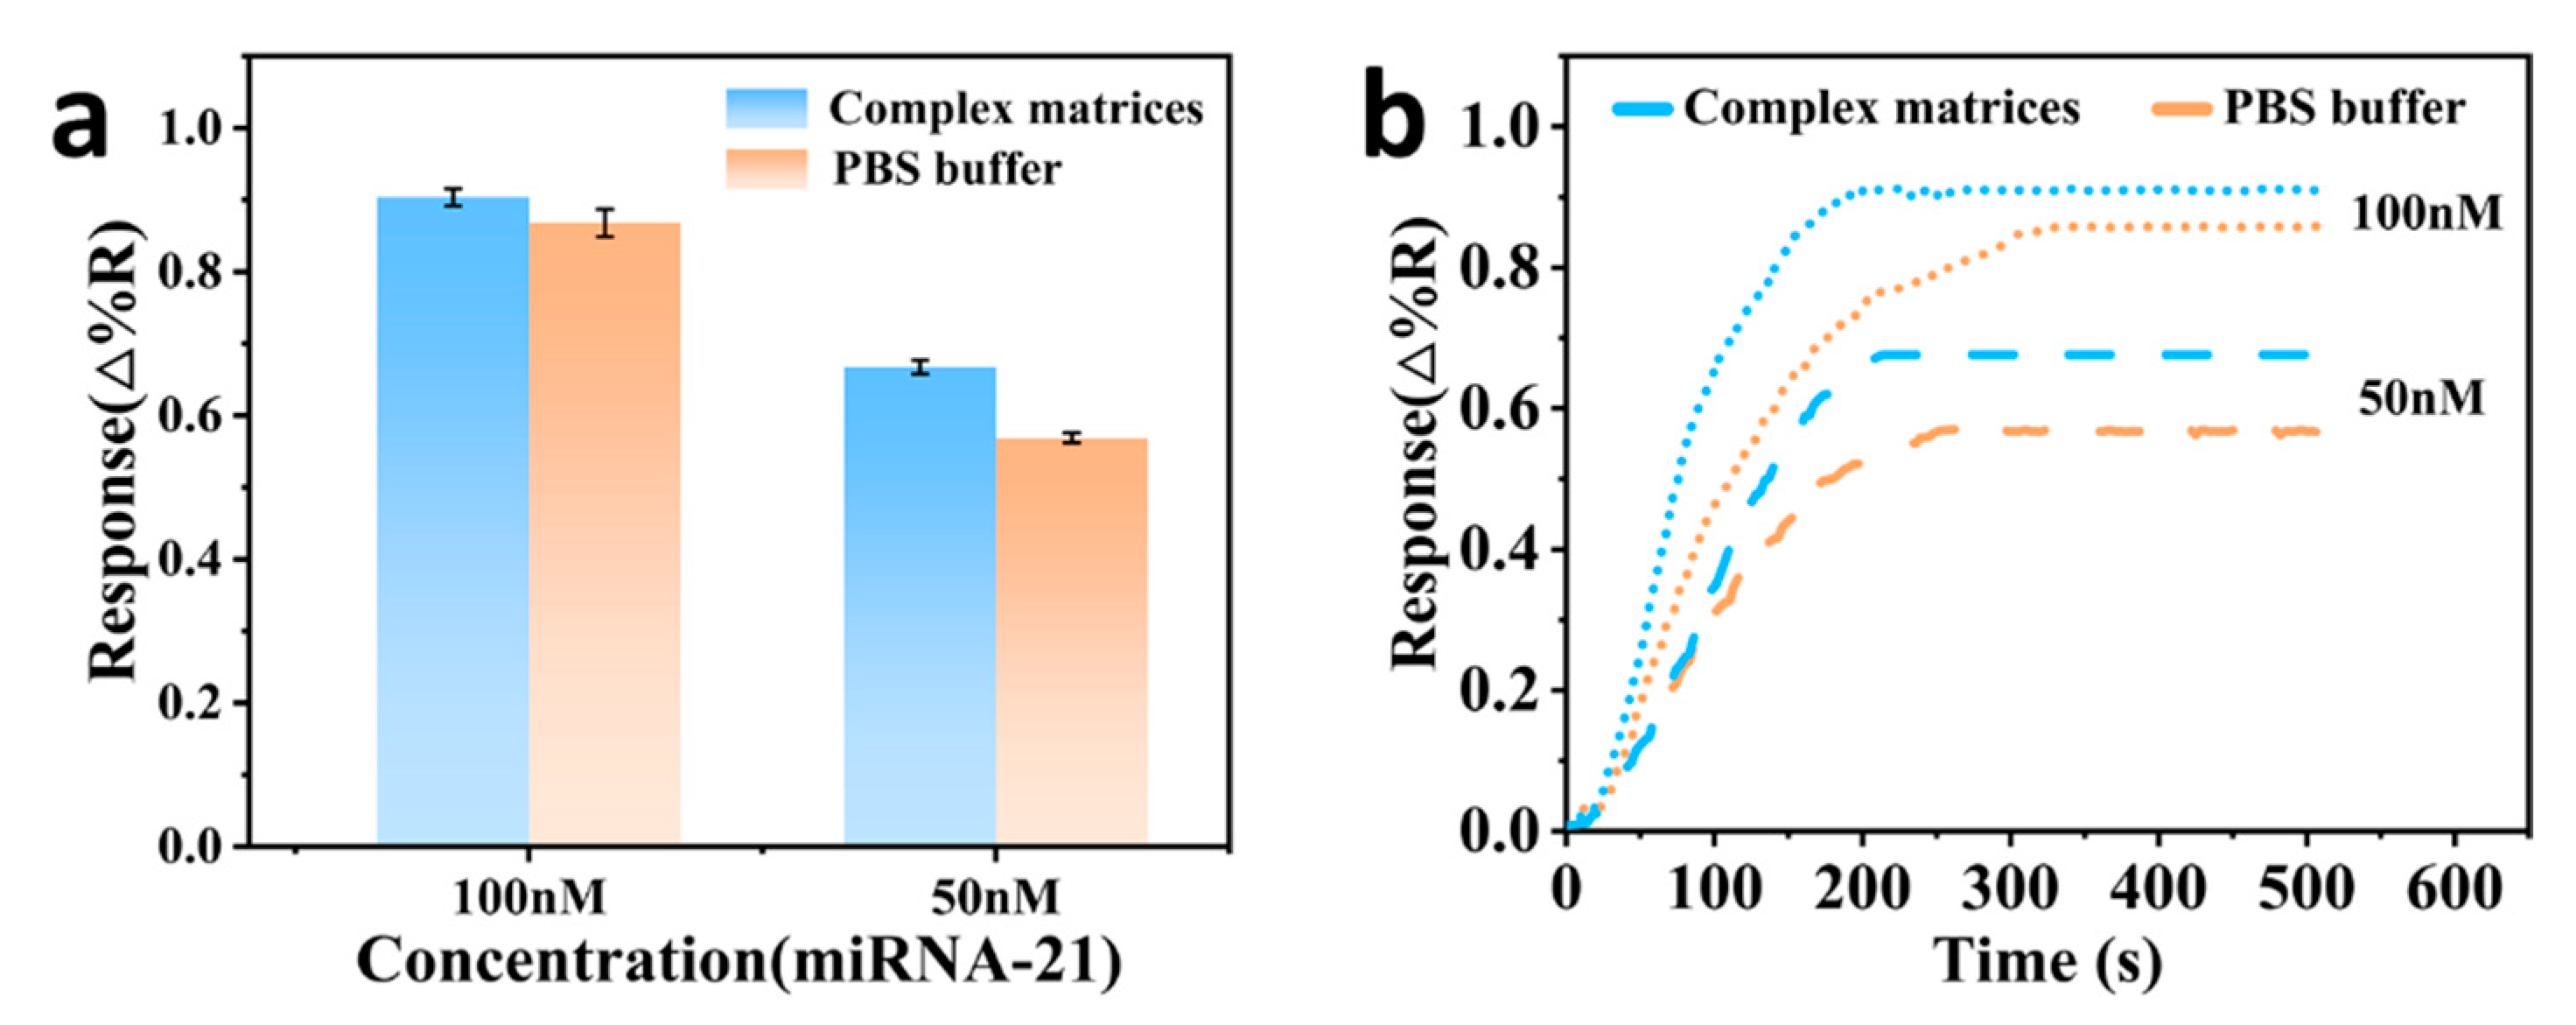
3.7. Detection in Salmon Sperm Sample

To evaluate the practical application capability of AuNPs/Ti3C2-SPRi, salmon sperm were used to simulate the actual sample environment [35]. Totals of 100 nM and 50 nM miRNA-21 were mixed in salmon sperm samples for detection. As shown in Figure 7a,b, the sensing strategy was less affected by the complex matrix, enabling accurate detection of target miRNA-21 and produced SPRi signal response similar to that in PBS buffer. The results show that the SPRi biosensor has high accuracy and reliability in detecting miRNA in complex environments, and can be used in practical applications.

4. Conclusions

In conclusion, we developed an AuNPs/Ti3C2-SPRi sensor for highly sensitive detection of the cancer biomarker miRNA-21. The designed sensor is simple to operate, and the detection of miRNA-21 and signal amplification can be accomplished in two steps. Using the freezing method, the fixation of the polyA−DNA probes were completed in 2 h, which greatly reduced the experimental time and improved the experimental efficiency compared with the conventional 24−hour incubation method. DNA−AuNPs/Ti3C2 conjugates were introduced to amplify the SPRi signal through mass effect and electromagnetic coupling effect. The developed SPRi sensor has high sensitivity for the detection of miRNA-21, with a detection limit as low as 6.13 fM, which is 1000 times lower than that of the DNA−AuNPs signal amplification method, and has a good linear relationship over a wide dynamic range of 10 fM to 10 nM(R2 = 0.9972). In addition, the designed sensor has good selectivity and specificity for miRNA-21 and other miRNAs with similar sequences, and can accurately detect miRNA-21 with less interference when applied in complex matrices. Therefore, the developed biosensors have the potential to become a universal strategy for miRNA detection in medical research and early clinical diagnosis.

Supplementary Materials

The following supporting information can be downloaded at: https://www.mdpi.com/article/10.3390/chemosensors12040066/s1, Table S1: All nucleic acid probe sequences used; Figure S1: (a) SEM image of AuNPs. (b) UV-visible absorption spectra of AuNPs and DNA−AuNPs.

Author Contributions

Conceptualization, Y.Q., and L.J.; methodology, Y.Q., B.S.; validation, Y.F.; formal analysis, Y.Q. and Y.F.; investigation, L.J. ; resources, Y.Q. and R.S.; data curation, Y.Q. and R.S.; writing—original draft preparation, Y.Q. and B.S.; writing—review and editing, Y.Q. and L.J.; supervision, L.J.; project administration, S.J.; funding acquisition, L.J. and S.J. All authors have read and agreed to the published version of the manuscript.

Funding

This research was funded by [Natural Science Foundation of Zhejiang Province] grant number [LZ22F050004] and [National Natural Science Foundation of China] grant number [52271139].

Institutional Review Board Statement

Not applicable.

Informed Consent Statement

Not applicable.

Data Availability Statement

Data are available upon request.

Conflicts of Interest

The authors declare no conflict of interest.

References

  1. Lu, T.X. Rothenberg M E. MicroRNA. J. Allergy Clin. Immunol. 2018, 141, 1202–1207. [Google Scholar] [CrossRef]
  2. Hill, M.; Tran, N. miRNA: miRNA Interactions: A Novel Mode of miRNA Regulation and Its Effect on Disease Systems Biology of MicroRNAs in Cancer; Springer International Publishing: Cham, Switzerland, 2022; pp. 241–257. [Google Scholar]
  3. Shao, T.; Wang, G.; Chen, H.; Xie, Y.; Jin, X.; Bai, J.; Xu, J.; Li, X.; Huang, J.; Jin, Y.; et al. Survey of miRNA-miRNA cooperative regulation principles across cancer types. Brief. Bioinform. 2019, 20, 1621–1638. [Google Scholar] [CrossRef] [PubMed]
  4. Huang, Y.; Yang, Y.B.; Zhang, X.H.; Yu, X.L.; Bin Wang, Z.; Cheng, X.C. MicroRNA-21 gene and cancer. Med. Oncol. 2013, 30, 376. [Google Scholar] [CrossRef]
  5. Kumarswamy, R.; Volkmann, I.; Thum, T. Regulation and function of miRNA-21 in health and disease. RNA Biol. 2011, 8, 706–713. [Google Scholar] [CrossRef]
  6. Krichevsky, A.M.; Gabriely, G. miR-21: A small multi-faceted RNA. J. Cell. Mol. Med. 2009, 13, 39–53. [Google Scholar] [CrossRef] [PubMed]
  7. Jenike, A.E.; Halushka, M.K. miR-21: A non-specific biomarker of all maladies. Biomark. Res. 2021, 9, 18. [Google Scholar] [CrossRef]
  8. Shen, L.; Wan, Z.; Ma, Y.; Wu, L.; Liu, F.; Zang, H.; Xin, S. The clinical utility of microRNA-21 as novel biomarker for diagnosing human cancers. Tumor Biol. 2015, 36, 1993–2005. [Google Scholar] [CrossRef]
  9. Pfeffer, S.R.; Yang, C.H.; Pfeffer, L.M. The role of miR-21 in cancer. Drug Dev. Res. 2015, 76, 270–277. [Google Scholar] [CrossRef]
  10. Sara, M.; Tammaro, C.; Misso, G.; Falco, M.; Scrima, M.; Bocchetti, M.; Rea, I.; De Stefano, L.; Caraglia, M. microRNA detection via nanostructured biochips for early cancer diagnostics. Int. J. Mol. Sci. 2023, 24, 7762. [Google Scholar] [CrossRef]
  11. Liu, Q.; Fan, J.; Zhou, C.; Wang, L.; Zhao, B.; Zhang, H.; Liu, B.; Tong, C. Quantitative detection of miRNA-21 expression in tumor cells and tissues based on molecular beacon. Int. J. Anal. Chem. 2018, 2018, 3625823. [Google Scholar] [CrossRef]
  12. Kong, L.; Li, H.; Zhang, X.; Zhuo, Y.; Chai, Y.; Yuan, R. A novel ratiometric electrochemical biosensor using only one signal tag for highly reliable and ultrasensitive detection of miRNA-21. Anal. Chem. 2022, 94, 5167–5172. [Google Scholar] [CrossRef]
  13. Weng, S.; Lin, D.; Lai, S.; Tao, H.; Chen, T.; Peng, M.; Qiu, S.; Feng, S. Highly sensitive and reliable detection of microRNA for clinically disease surveillance using SERS biosensor integrated with catalytic hairpin assembly amplification technology. Biosens. Bioelectron. 2022, 208, 114236. [Google Scholar] [CrossRef] [PubMed]
  14. Puiu, M.; Bala, C. SPR and SPR imaging: Recent trends in development nanodevices for detection and real-time monitoring of biomolecular events. Sensors 2016, 16, 870. [Google Scholar] [CrossRef] [PubMed]
  15. Fathi, F.; Rashidi, M.R.; Omidi, Y. Ultra-sensitive detection by metal nanoparticles-mediated enhanced SPR biosensors. Talanta 2019, 192, 118–127. [Google Scholar] [CrossRef]
  16. Liu, R.; Wang, Q.; Li, Q.; Yang, X.; Wang, K.; Nie, W. Surface plasmon resonance biosensor for sensitive detection of microRNA and cancer cell using multiple signal amplification strategy. Biosens. Bioelectron. 2017, 87, 433–438. [Google Scholar] [CrossRef] [PubMed]
  17. Wang, Q.; Liu, R.; Yang, X.; Wang, K.; Zhu, J.; He, L.; Li, Q. Surface plasmon resonance biosensor for enzyme-free amplified microRNA detection based on gold nanoparticles and DNA supersandwich. Sens. Actuators B Chem. 2016, 223, 613–620. [Google Scholar] [CrossRef]
  18. Hong, L.; Lu, M.; Dinel, M.P.; Blain, P.; Peng, W.; Gu, H.; Masson, J.-F. Hybridization conditions of oligonucleotide-capped gold nanoparticles for SPR sensing of microRNA. Biosens. Bioelectron. 2018, 109, 230–236. [Google Scholar] [CrossRef] [PubMed]
  19. Pandey, P.S.; Raghuwanshi, S.K.; Kumar, S. Recent advances in two-dimensional materials-based Kretschmann configuration for SPR sensors: A review. IEEE Sens. J. 2021, 22, 1069–1080. [Google Scholar] [CrossRef]
  20. Wang, Q.; Li, Q.; Yang, X.; Wang, K.; Du, S.; Zhang, H.; Nie, Y. Graphene oxide—Gold nanoparticles hybrids-based surface plasmon resonance for sensitive detection of microRNA. Biosens. Bioelectron. 2016, 77, 1001–1007. [Google Scholar] [CrossRef]
  21. Li, Q.; Wang, Q.; Yang, X.; Wang, K.; Zhang, H.; Nie, W. High sensitivity surface plasmon resonance biosensor for detection of microRNA and small molecule based on graphene oxide-gold nanoparticles composites. Talanta 2017, 174, 521–526. [Google Scholar] [CrossRef]
  22. Nie, W.; Wang, Q.; Yang, X.; Zhang, H.; Li, Z.; Gao, L.; Zheng, Y. High sensitivity surface plasmon resonance biosensor for detection of microRNA based on gold nanoparticles-decorated molybdenum sulfide. Anal. Chim Acta 2017, 993, 55–62. [Google Scholar] [CrossRef] [PubMed]
  23. Kumar, J.A.; Prakash, P.; Krithiga, T.; Amarnath, D.J.; Premkumar, J.; Rajamohan, N.; Vasseghian, Y.; Saravanan, P.; Rajasimman, M. Methods of synthesis, characteristics, and environmental applications of MXene: A comprehensive review. Chemosphere 2022, 286, 131607. [Google Scholar] [CrossRef] [PubMed]
  24. Liu, R.; Jiang, L.; Lu, C.; Yu, Z.; Li, F.; Jing, X.; Xu, R.; Zhou, W.; Jin, S. Large-scale two-dimensional titanium carbide MXene as SERS-active substrate for reliable and sensitive detection of organic pollutants. Spectrochim. Acta Part A Mol. Biomol. Spectrosc. 2020, 236, 118336. [Google Scholar] [CrossRef] [PubMed]
  25. Li, X.; Wang, C.; Cao, Y.; Wang, G. Functional MXene materials: Progress of their applications. Chem. Asian J. 2018, 13, 2742–2757. [Google Scholar] [CrossRef] [PubMed]
  26. Wu, Q.; Li, N.; Wang, Y.; Liu, Y.; Xu, Y.; Wei, S.; Wu, J.; Jia, G.; Fang, X.; Chen, F.; et al. A 2D transition metal carbide MXene-based SPR biosensor for ultrasensitive carcinoembryonic antigen detection. Biosens. Bioelectron. 2019, 144, 111697. [Google Scholar] [CrossRef] [PubMed]
  27. Wu, Q.; Li, N.; Wang, Y.; Xu, Y.; Wu, J.; Jia, G.; Ji, F.; Fang, X.; Chen, F.; Cui, X. Ultrasensitive and selective determination of carcinoembryonic antigen using multifunctional ultrathin amino-functionalized Ti3C2-MXene nanosheets. Anal. Chem. 2020, 92, 3354–3360. [Google Scholar] [CrossRef] [PubMed]
  28. Wang, Y.; Hu, Y.; Xie, R.; Zeng, Q.; Hong, Y.; Chen, X.; Zhang, P.; Zeng, L.; Zhang, Y.; Zeng, S.; et al. Ultrasensitive label-free miRNA-21 detection based on MXene-enhanced plasmonic lateral displacement measurement. Nanophotonics 2023, 12, 4055–4062. [Google Scholar] [CrossRef]
  29. Liu, R.; Jiang, L.; Yu, Z.; Jing, X.; Liang, X.; Wang, D.; Yang, B.; Lu, C.; Zhou, W.; Jin, S. MXene (Ti3C2Tx)-Ag nanocomplex as efficient and quantitative SERS biosensor platform by in-situ PDDA electrostatic self-assembly synthesis strategy. Sens. Actuators B Chem. 2021, 333, 129581. [Google Scholar] [CrossRef]
  30. Yu, Z.; Jiang, L.; Liu, R.; Zhao, W.; Yang, Z.; Zhang, J.; Jin, S. Versatile self-assembled MXene-Au nanocomposites for SERS detection of bacteria, antibacterial and photothermal sterilization. Chem. Eng. J. 2021, 426, 131914. [Google Scholar] [CrossRef]
  31. Liu, B.; Liu, J. Freezing directed construction of bio/nano interfaces: Reagentless conjugation, denser spherical nucleic acids, and better nanoflares. J. Am. Chem. Soc. 2017, 139, 9471–9474. [Google Scholar] [CrossRef]
  32. Fang, Y.; Jiang, L.; Jin, S.; Li, Y.; Jiang, C.; Zhang, X.; Peng, Y. AuNPs beacons-enhanced surface plasmon resonance imaging sensor for rapid, high-throughput and ultra-sensitive detection of three fusion genes related to acute promyelocytic leukemia. Sens. Actuators B Chem. 2022, 361, 131728. [Google Scholar] [CrossRef]
  33. Huertas, C.S.; Soler, M.; Estevez, M.C.; Lechuga, L.M. One-step immobilization of antibodies and DNA on gold sensor surfaces via a poly-adenine oligonucleotide approach. Anal. Chem. 2020, 92, 12596–12604. [Google Scholar] [CrossRef] [PubMed]
  34. Li, Y.; Zou, Y.; Tan, H.; Jiang, L.; Fang, Y.; Jin, S. Simultaneous and sensitive detection of two pathogenic genes of thrombotic diseases using SPRi sensor with one-step fixation probe by a poly-adenine oligonucleotide approach. Colloids Surf. B Biointerfaces 2022, 209, 112184. [Google Scholar] [CrossRef] [PubMed]
  35. Bian, X.; Guo, B.; Zhao, M.; Han, D.; Cheng, W.; Song, F.; Ding, S. An enzyme-free “ON-OFF” electrochemiluminescence biosensor for ultrasensitive detection of PML/RARα based on target-switched DNA nanotweezer. ACS Appl. Mater. Interfaces 2019, 11, 3715–3721. [Google Scholar] [CrossRef] [PubMed]
Scheme 1. Schematic of the detection process of AuNPs/Ti3C2-SPRi biosensor.
Chemosensors 12 00066 sch001
Figure 1. (a) The chip surface was functionalized with polyA-DNA. (b) Capture probes were immobilized on the gold chip by freezing and incubation methods. (c) Signal responses of probes immobilized by different methods to different concentrations of miRNA-21. All data show the mean standard deviation of the three measurements. (d) The signals generated by DNA probes fixed by different methods.
Chemosensors 12 00066 g001
Figure 2. (a) Signal responses of different concentrations of capture probes (10 μM, 30 μM, 50 μM, and 70 μM) to 100 nM miRNA-21. (b) Response signals generated by different concentrations of capture probes. All data show the mean standard deviation of the three measurements.
Chemosensors 12 00066 g002
Figure 3. (a) SPRi microarray difference plots of target miRNA-21 upon specific binding and dissociation with the capture probe. (b) SPRi responses generated by different concentrations of miRNA-21 (800 nM, 400 nM, 200 nM, 100 nM, 50 nM, and 25 nM). (c) Linear relationship between the response signal and the logarithm of miRNA-21 concentration in the concentration range of 25 nM-800 nM, R2 = 0.9928.
Chemosensors 12 00066 g003
Figure 4. (a) SEM image of Ti3C2 nanosheets. (b) SEM images of AuNPs/Ti3C2 composites. (c) UV-visible absorption spectra of AuNPs, AuNPs/Ti3C2, and DNA−AuNPs/Ti3C2.
Chemosensors 12 00066 g004
Figure 5. (a) Signal response amplified with DNA−AuNPs for miRNA-21 concentrations from a-f: 5 pM, 10 pM, 250 pM, 1 nM, 5 nM, and 10 nM. (b) Signal response curves for signal amplification with DNA−AuNPs with a linear relationship between amplified signals and the logarithm of the concentration of miRNA-21 over the range of 5 pM-10 nM, when signal amplification with DNA−AuNPs was performed. All data are presented as averages ± standard values.
Chemosensors 12 00066 g005
Figure 6. (a) Signal response curve of miRNA-21 concentration gradient for signal amplification with DNA−AuNPs/Ti3C2. Concentration gradient: 10 nM, 5 nM, 1 nM, 250 nM, 50 pM, 10 pM, and 2.5 pM. (b) Signal response curves at miRNA-21 concentrations of 2.5 pM, 1 pM, 500 fM, 100 fM, 25 fM, and 10 fM. (c) Signal amplification with DNA−AuNPs/Ti3C2, and the response signals were linear between the logarithms of miRNA-21 concentrations in the range of 10 nM to 10 fM. All data are presented as averages ± standard values. (d) Histograms of signal response generated under different signal amplification methods (DNA−AuNPs and DNA−AuNPs/Ti3C2) for the same concentration of miRNA-21. (e) Signal response values generated by direct detection, DNA−AuNPs and DNA−AuNPs/Ti3C2 for the same concentration of miRNA-21. (f) Selectivity and specificity studies of AuNPs/Ti3C2-SPRi sensors.
Chemosensors 12 00066 g006
Figure 7. (a) MiRNA-21 was detected in complex matrices and PBS buffer. (b) SPRi signal generated by 50 nM and 100 nM miRNA-21 in complex matrices and PBS buffer.
Chemosensors 12 00066 g007
Disclaimer/Publisher’s Note: The statements, opinions and data contained in all publications are solely those of the individual author(s) and contributor(s) and not of MDPI and/or the editor(s). MDPI and/or the editor(s) disclaim responsibility for any injury to people or property resulting from any ideas, methods, instructions or products referred to in the content.

