Article

Study of the Gas Sensing Performance of Ni-Doped Perovskite-Structured LaFeO3 Nanospheres

1
College of Information Science and Engineering, Northeastern University, Shenyang 110819, China
2
Hebei Key Laboratory of Micro-Nano Precision Optical Sensing and Measurement Technology, Qinhuangdao 066004, China
3
National Frontiers Science Center for Industrial Intelligence and Systems Optimization, Northeastern University, Shenyang 110819, China
4
Key Laboratory of Data Analytics and Optimization for Smart Industry, Ministry of Education, Northeastern University, Shenyang 110819, China
*
Author to whom correspondence should be addressed.
Chemosensors 2024, 12(4), 65; https://doi.org/10.3390/chemosensors12040065
Submission received: 22 March 2024 / Revised: 6 April 2024 / Accepted: 15 April 2024 / Published: 16 April 2024
(This article belongs to the Special Issue Functional Nanomaterial-Based Gas Sensors)

Abstract

:
This study synthesizes Ni-doped perovskite-structured LaFeO3 composite materials via a one-step hydrothermal method, characterizes the morphology and structure of the materials, and tests their gas sensing performance. The test results show that compared to pure LaFeO3 material, the gas sensing performance of Ni-doped LaFeO3 material is improved in all aspects. Specifically, LFO-Ni2% exhibits a response as high as 102 towards 100 ppm of triethylamine at 190 °C, along with better selectivity and stability. Furthermore, the gas sensing mechanism is investigated. On one hand, doping with an appropriate proportion of Ni can lead to the formation of more-complete and smaller-sized microsphere structures with pores. This is beneficial for the adsorption of oxygen from the air onto the material surface, as well as for the diffusion of the target gas to the surface of the material, thereby enhancing gas sensitivity performance. On the other hand, the doped Ni enters the interior of the LaFeO3 crystal, replacing some of the cations in LaFeO3, increasing the concentration of charge carriers in the material, and reducing the material’s resistance. The sample can adsorb more oxygen, promoting the reaction between adsorbed oxygen and the target gas, and thereby improving the gas sensitivity performance of the sample.

1. Introduction

Triethylamine (TEA) is a common volatile organic compound of the amine class and an important industrial raw material. Due to its low production cost, ease of preparation, and wide range of applications, it is used in various industrial scenarios [1,2,3]. Additionally, TEA is a volatile and toxic substance to the human body. Prolonged exposure to TEA can cause corneal edema, headaches, and other injuries, and in severe cases, it can lead to pulmonary edema and even death [4,5]. The National Institute of Occupational Safety and Health (NIOSH) recommends that the concentration limit of indoor TEA be 10 ppm [6,7]. Therefore, developing a sensor that can effectively detect TEA is necessary.
Common gas detection methods such as chromatography and fluorescence have been applied to the detection of TEA gas [6,7,8,9]. However, factors such as the expensive and complex nature of the detection equipment have greatly limited their application scenarios. Since the 1970s, metal oxide semiconductor gas sensors have been recognized for their significant promise in detecting volatile organic compounds (VOCs) because of their uncomplicated fabrication process, cost-effectiveness, distinctive structure, and chemical characteristics [10,11,12]. Liu et al. [4] synthesized in-modified sheet-like ZnO/NiO gas-sensitive materials using a solvothermal and thermal treatment method. Gas sensitivity testing showed that the material had a response of 33 to 100 ppm of TEA at the optimal operating temperature of 200 °C. Sun et al. [13] synthesized spherical ZnO nanomaterials via a hydrothermal method, and the material exhibited a response of 133 to 100 ppm of TEA at 370 °C. From the above examples, it is evident that traditional single-metal oxide semiconductor materials exhibit shortcomings in the gas sensitivity performance for TEA, such as high operating temperatures, low response, and poor selectivity [14,15]. Therefore, it is necessary to search for more-efficient metal oxide semiconductor gas-sensitive materials.
In recent years, LaFeO3 has been considered as a typical p-type perovskite-type oxide due to its relatively simple preparation, highly stable structure, and excellent thermal stability [16,17]. Previous studies have shown that LaFeO3 exhibits good gas sensitivity towards gases such as ethanol, acetone, and formaldehyde [18]. Jing et al. [19] prepared a Co-doped gas-sensitive material in LaFeO3 using the sol–gel method. The response to 100 ppm acetone at 140 °C was 35.89, with a response recovery time of 14/9 s. However, there have been fewer studies on the detection of TEA using lanthanum ferrite materials, and there are obvious deficiencies in their gas sensitivity performance. Hao et al. [20] synthesized porous spherical LaFeO3 gas-sensitive material modified with RuO2 using a hydrothermal method. The testing showed that this material had the best gas sensitivity performance towards TEA, with a response of 60 to 100 ppm at 260 °C. From the above examples, it is evident that LaFeO3 has shortcomings in terms of high operating temperatures and low response towards TEA. Hence, it is essential to investigate efficient approaches to improving the gas sensitivity performance of LaFeO3 towards TEA.
Doping is one of the common methods used to improve the performance of gas-sensitive materials. Existing studies have shown that impurity doping can not only increase the types of adsorbed oxygen but also alter the microstructure of sensitive elements [21,22]. Perovskite has a molecular formula of ABO3, where both the A-site and B-site elements are easily replaced by other doping elements, resulting in strong adaptability and tunability of perovskite oxides’ structures [23,24]. In this study, spherical LaFeO3 composite gas-sensitive materials doped with Ni were synthesized using a hydrothermal method. The microstructure was studied through various characterizations, and the gas sensitivity performance towards TEA was also tested. This research found that the composite material doped with an appropriate amount of Ni significantly improved its gas sensitivity performance towards TEA and explained its gas sensing mechanism.

2. Experimental Section

2.1. Materials

La(NO3)3·6H2O, Fe(NO3)3·9H2O, Ni(NO3)3·6H2O, anhydrous citric acid, absolute ethanol, deionized water, TEA, and other testing gases are all of analytical grade and can be used directly without the need for further purification.

2.2. Nanocomposite Synthesis

The preparation process of Ni-doped LaFeO3 spherical nanograins: Take five portions of 40 mL of deionized water and place them into five beakers. Add 0.433 g of La(NO3)3·6H2O, 0.404 g of Fe(NO3)3·9H2O, and 5 mmol of citric acid to each beaker and stir until the solution is clear. Then, add 0, 0.01, 0.02, 0.03, and 0.05 mmol of Ni(NO3)3·6H2O to the five beakers, respectively, and stir for half 1 h. Transfer the solutions to a 50 mL explosion-proof reactor and hydrothermally treat at 180 °C for 9 h. After the reaction, wash, centrifuge, dry, and grind the obtained liquid; then, place it in a muffle furnace and calcine at 600 °C for 3 h with a heating rate of 5 °C/min. The materials obtained after calcination are labeled as LFO, LFO-Ni1%, LFO-Ni2%, LFO-Ni3%, and LFO-Ni5% according to the different Ni doping levels.

2.3. Characterizations

The material’s morphology was assessed through SEM, while the elemental composition was analyzed using EDS. Moreover, XRD was employed to determine the internal crystal structure and composition of the material, utilizing a 2θ range spanning from 10° to 80° and a scanning speed of 5 °/min. XPS was employed to characterize the perovskite LaFeO3 sensitive device, providing precise information regarding the surface composition and chemical states of the perovskite LaFeO3 sensitive device.

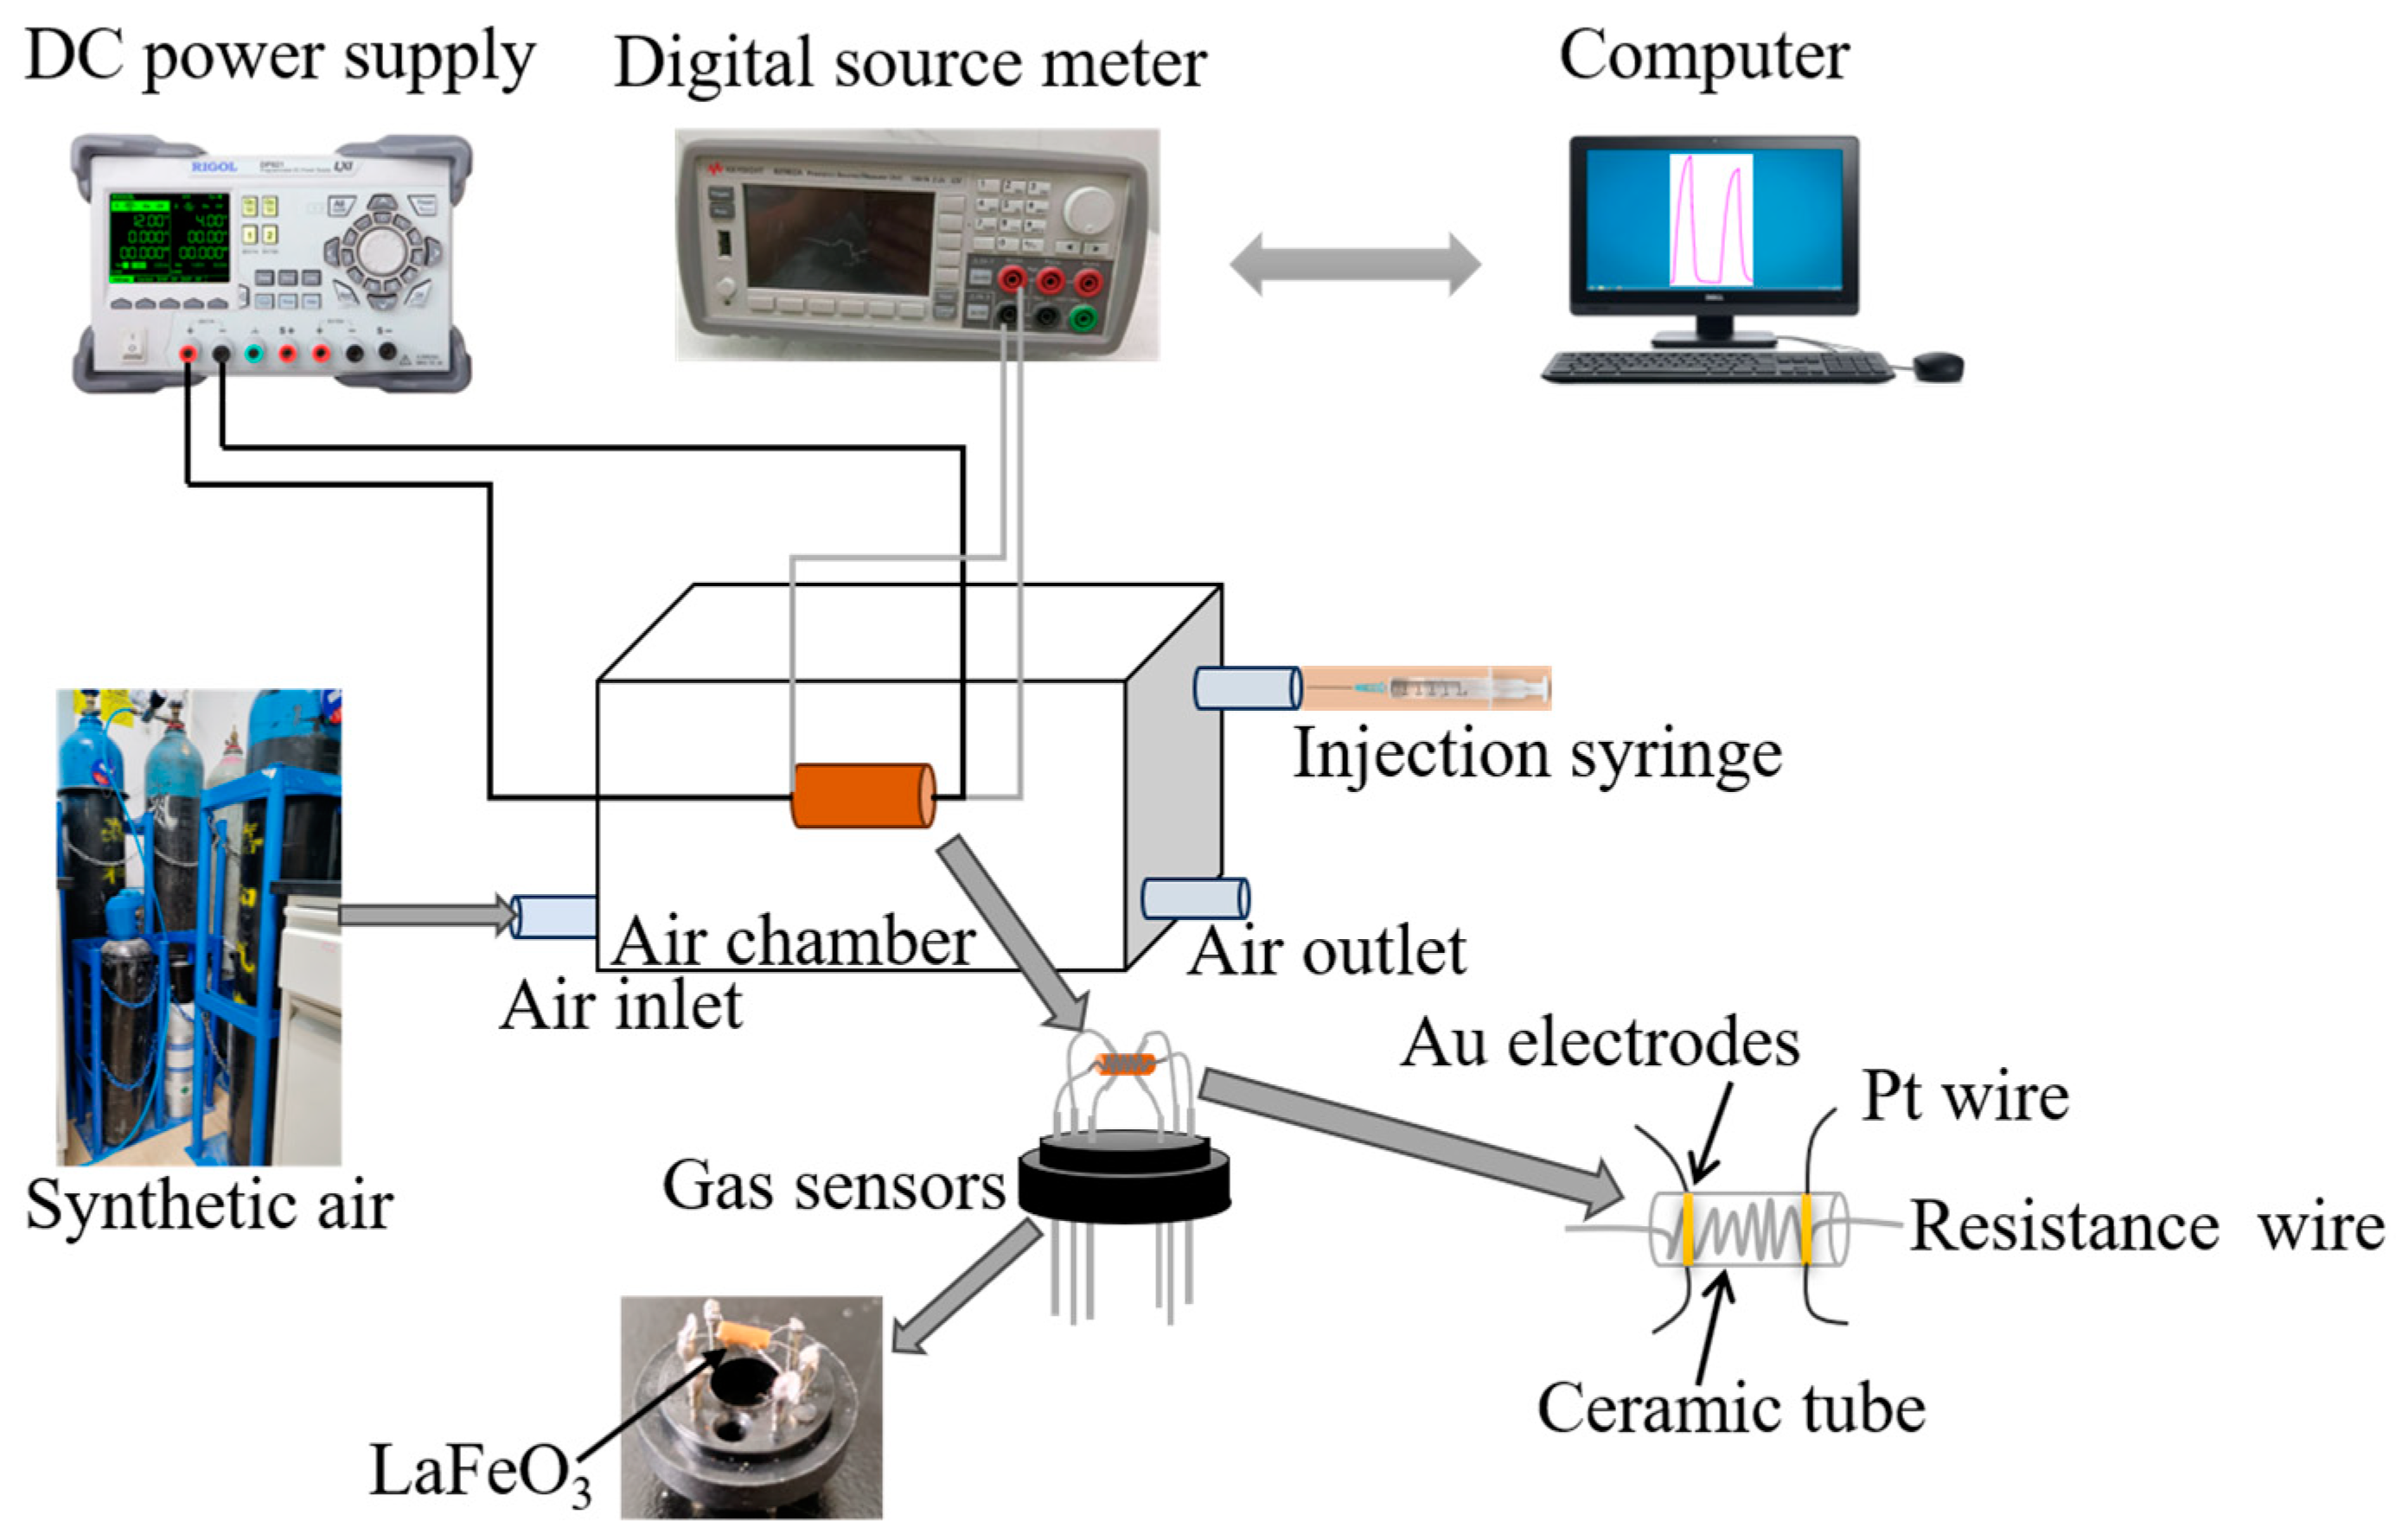
2.4. Test System and Test Procedure

Figure 1 illustrates the structure of the testing system and the gas sensor [25]. The testing system consists of several components, including a computer, a DC power supply, a digital source meter, synthetic air, a gas chamber, and gas sensors. The gas chamber has three ports, each used for injecting synthetic air, purging, and injecting the gas to be tested, respectively. The gas sensor is composed of a base, a resistance wire, a ceramic tube, and several other parts. The base contains six pins, with the upper halves of two pins connected to the resistance wire and the lower halves connected to the DC power supply. The DC power supply heats the resistance wire to adjust the operating temperature of the gas sensor. The upper halves of the remaining four pins are connected to the ceramic tube, which is coated with a gas-sensitive material on top to convert chemical signals into electrical signals. The lower halves are connected to the digital source meter to acquire relevant data from the sensor [26,27].
Before conducting the test, it is necessary to solder the sensor, i.e., to weld the ceramic tube and resistance wire onto the sensor base. After welding, the synthesized material is evenly applied to the ceramic tube and aged at 150 °C for 24 h in an aging station. Then, the aged sensor is inserted into the base of the gas chamber. After adjusting the operating temperature of the sensor, before injecting the test gas, it is necessary to introduce a certain amount of synthesized air (composed of 21% oxygen and 79% nitrogen) into the gas chamber for a certain period of time to exhaust the original gas in the chamber and prevent it from affecting the test process. Then, slowly inject the desired amount of target gas [28]. When the reaction is complete, i.e., the resistance of the sensor no longer changes or changes very little, introduce the same length of synthesized air into the gas chamber to remove the residual test gas in the chamber. In addition, the LaFeO3 material involved in this experiment is a p-type gas sensor, whose response (S) is defined as [29,30]:
S = R a R g .
Rg represents the resistance value of the gas sensor when exposed to the test gas, while Ra signifies the resistance value of the sensor in an air environment. Furthermore, the response recovery time is characterized as the duration necessary for the sensor’s resistance alteration to achieve 90% of its peak value following the introduction or removal of the test gas from the sensor.

3. Result and Discussion

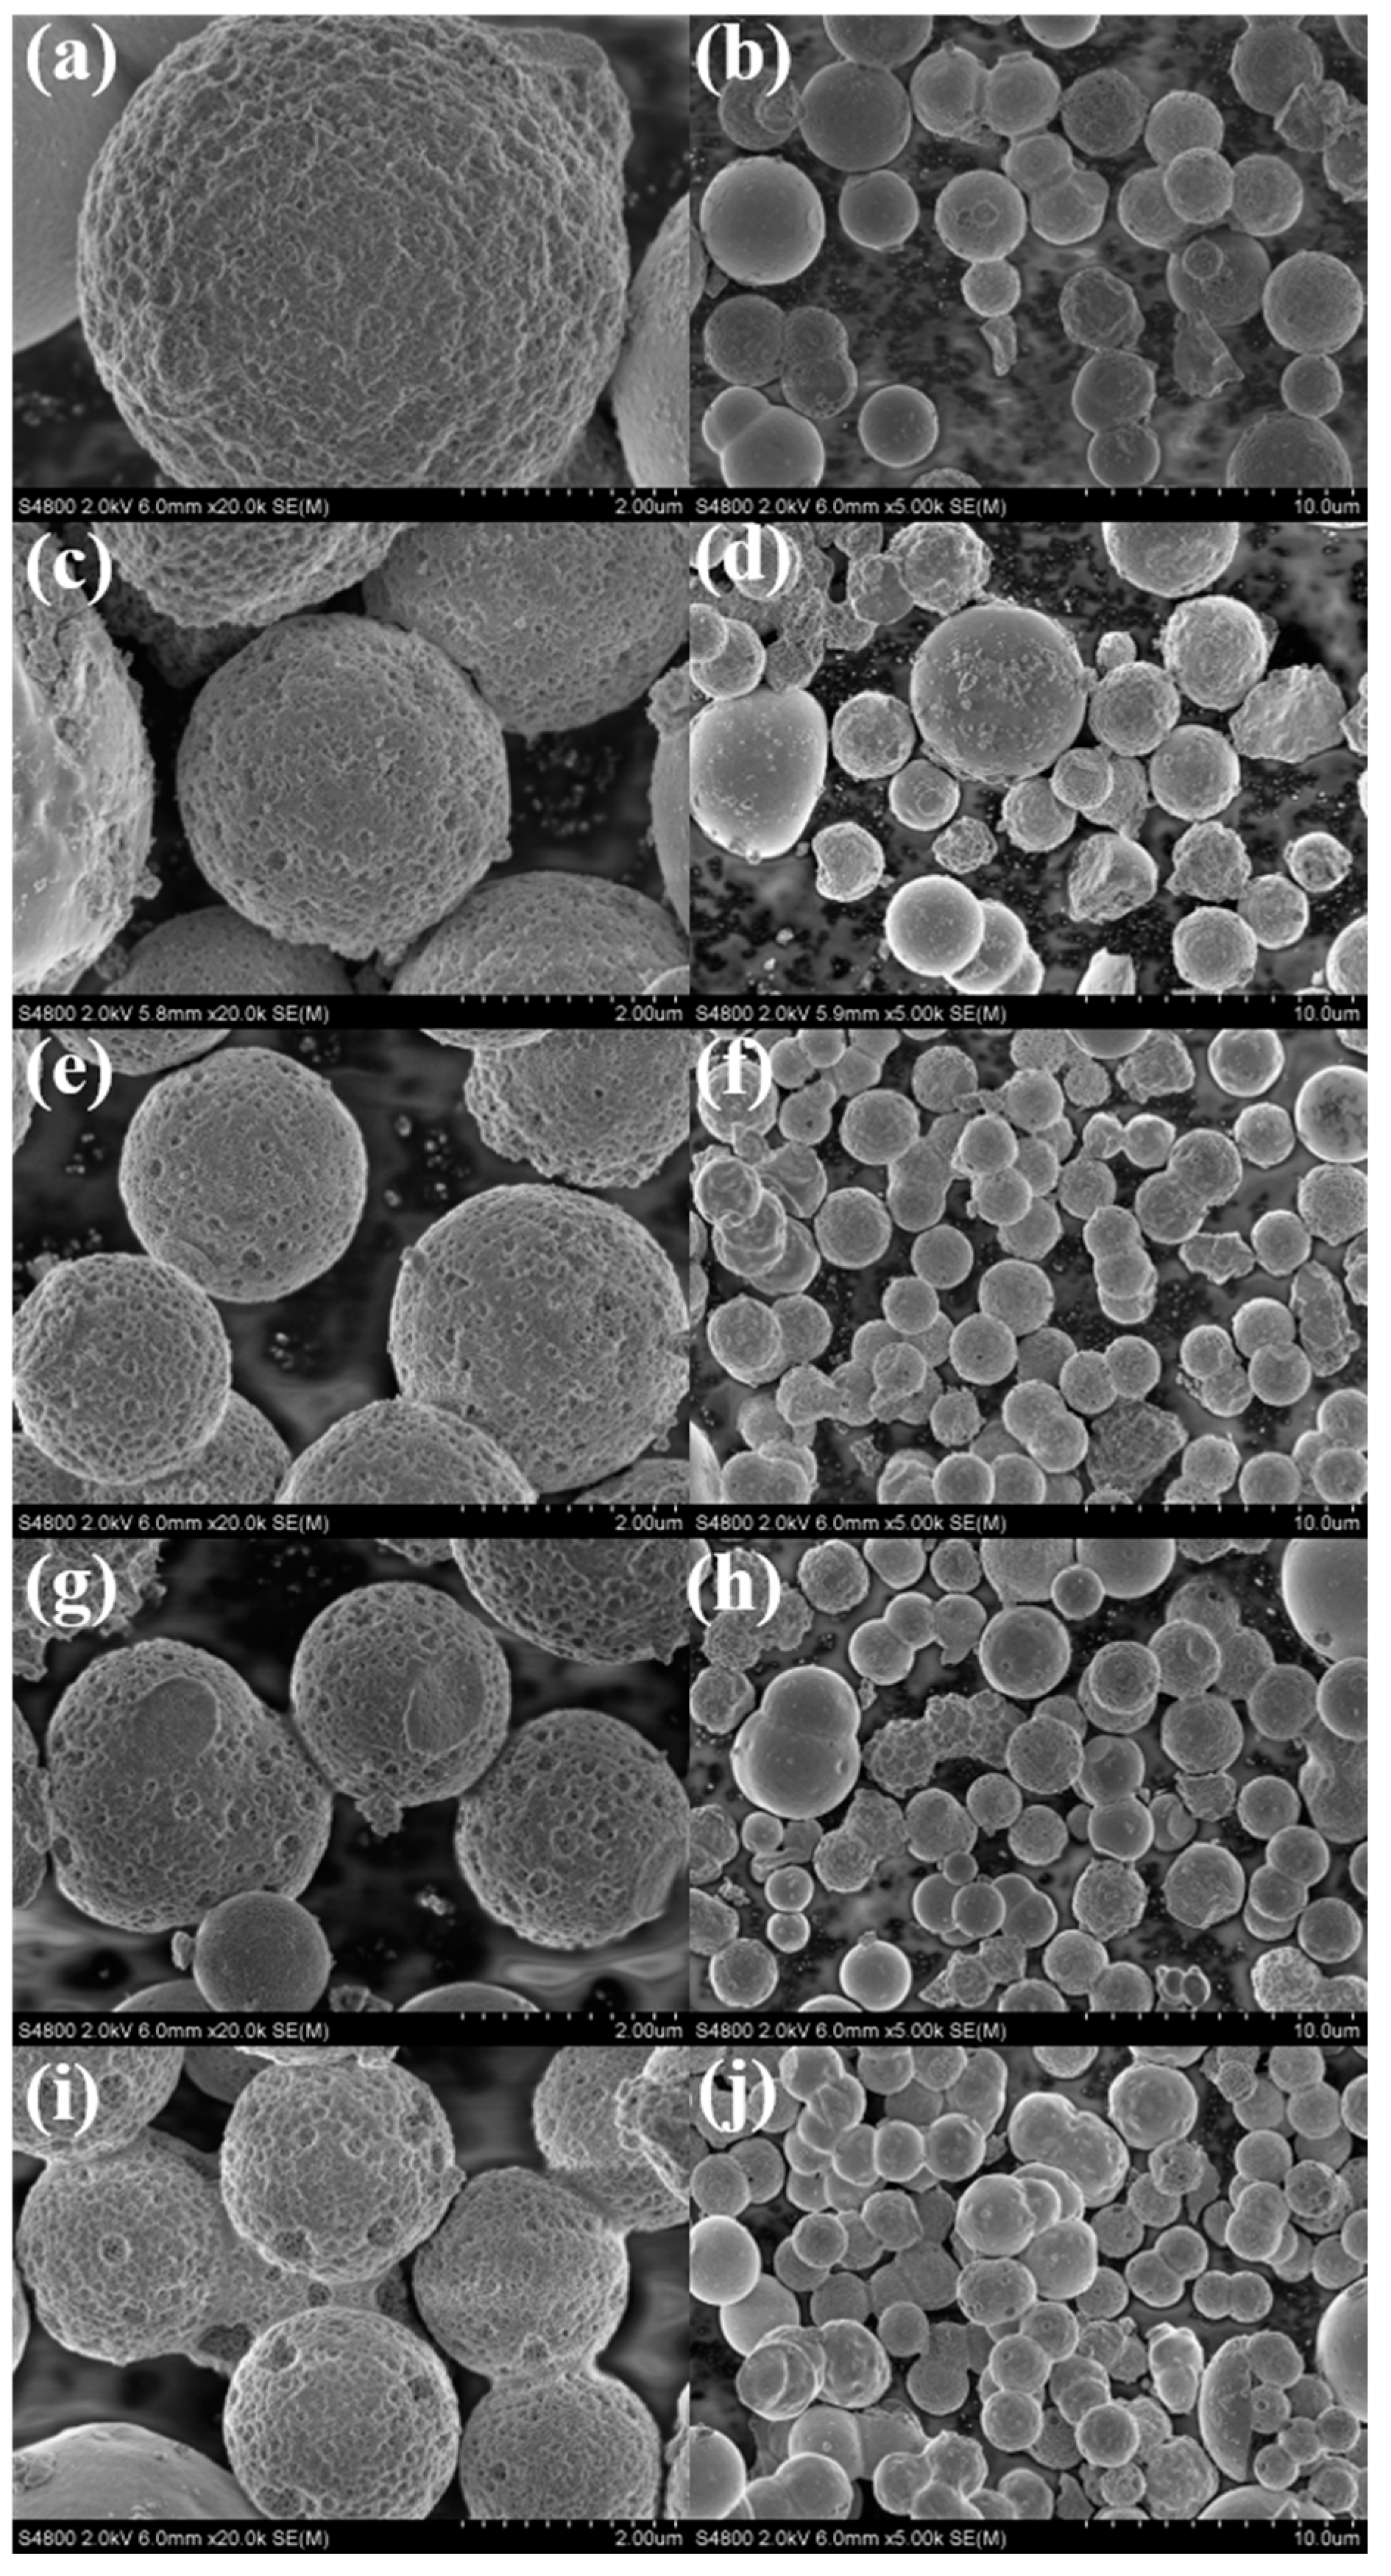
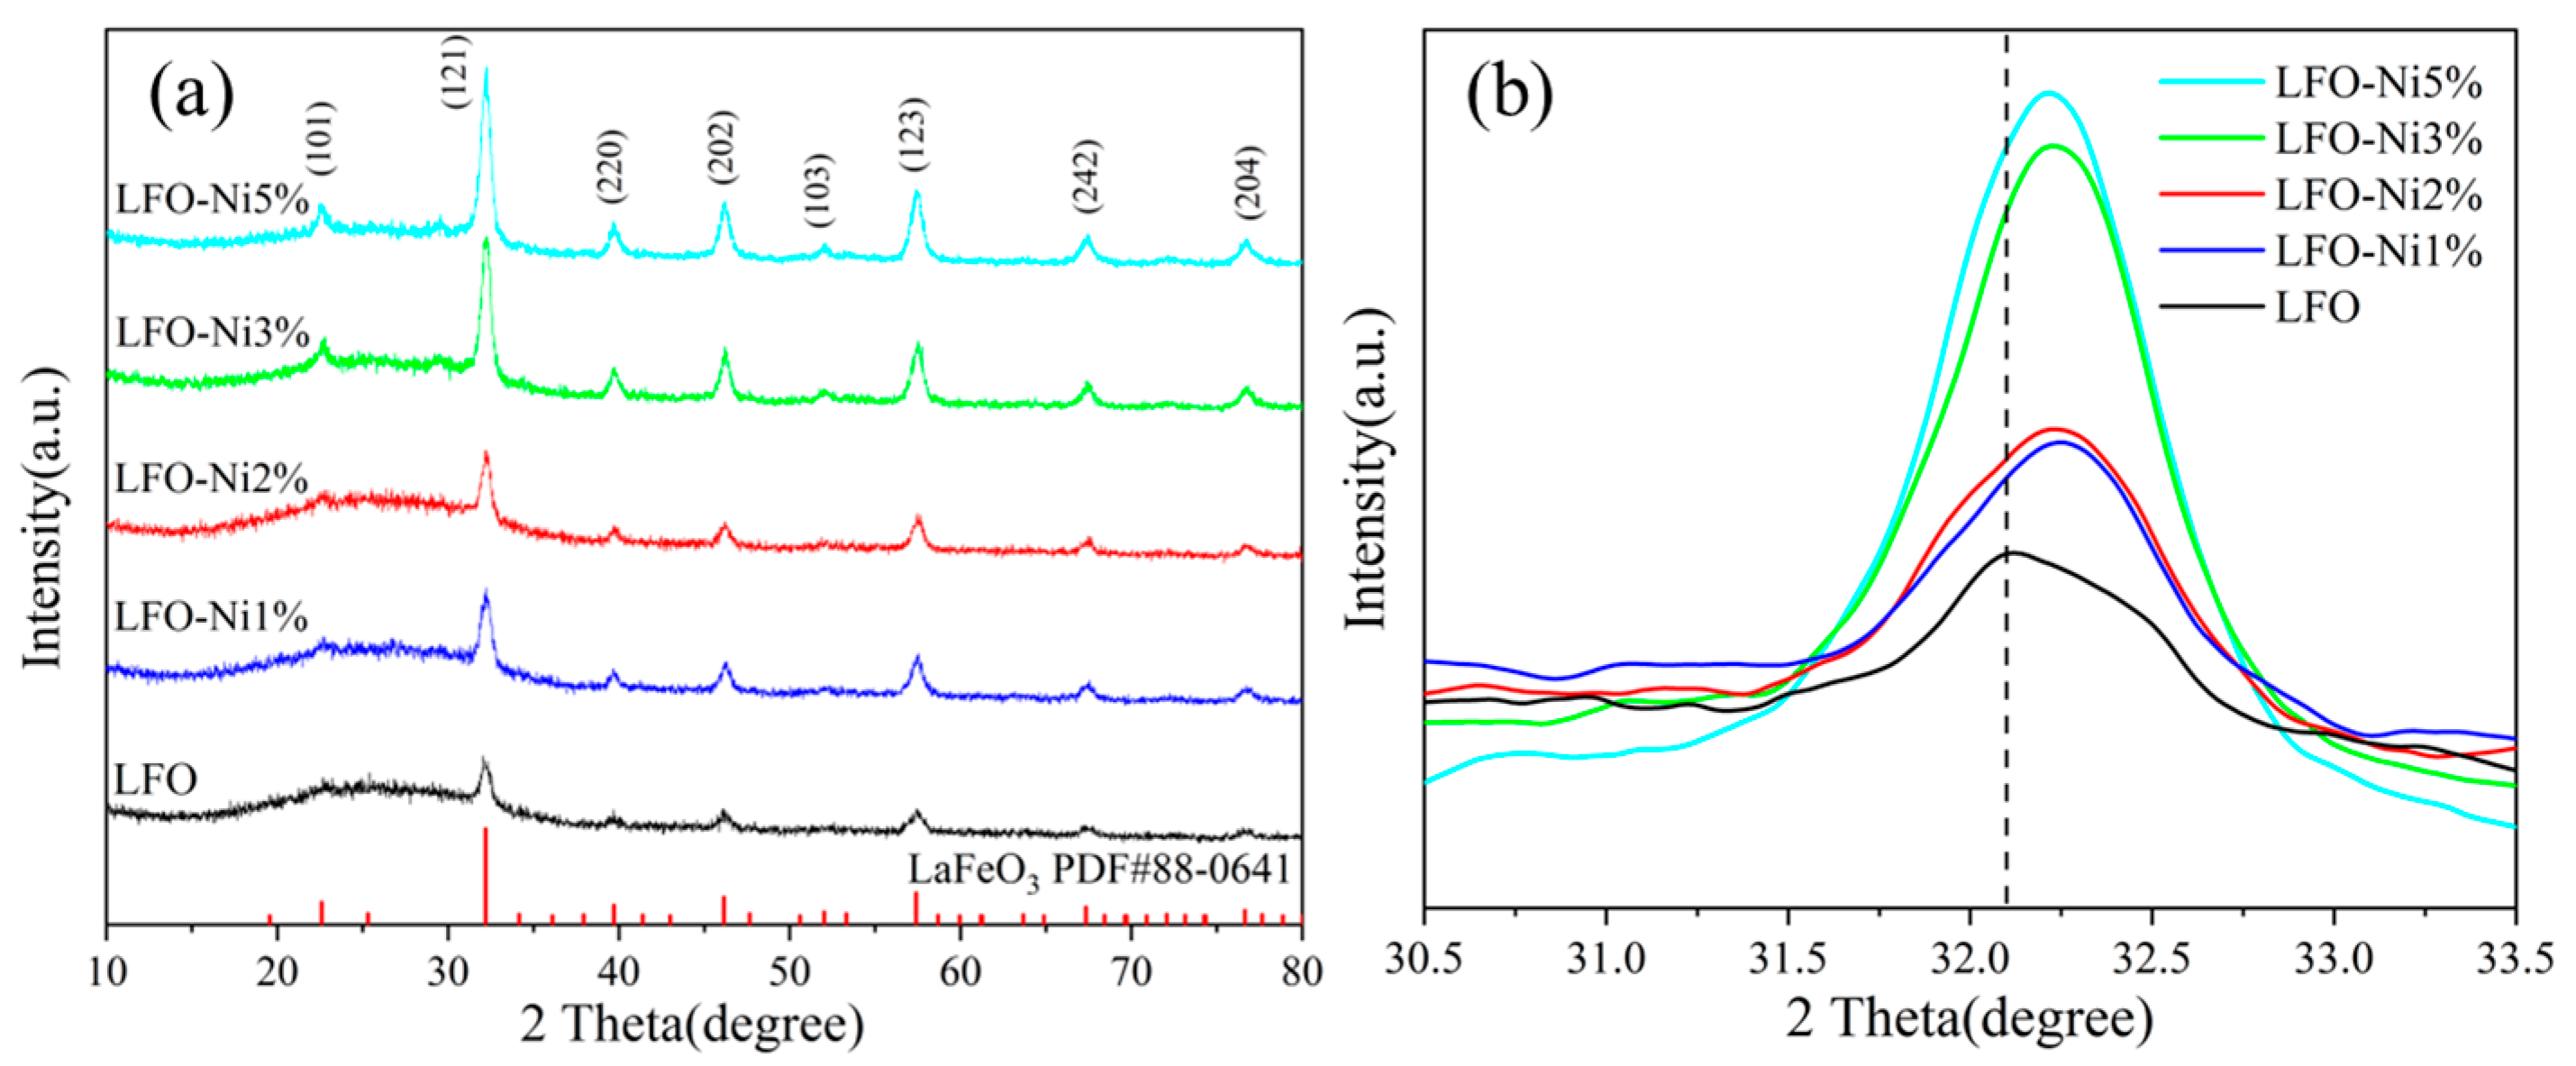
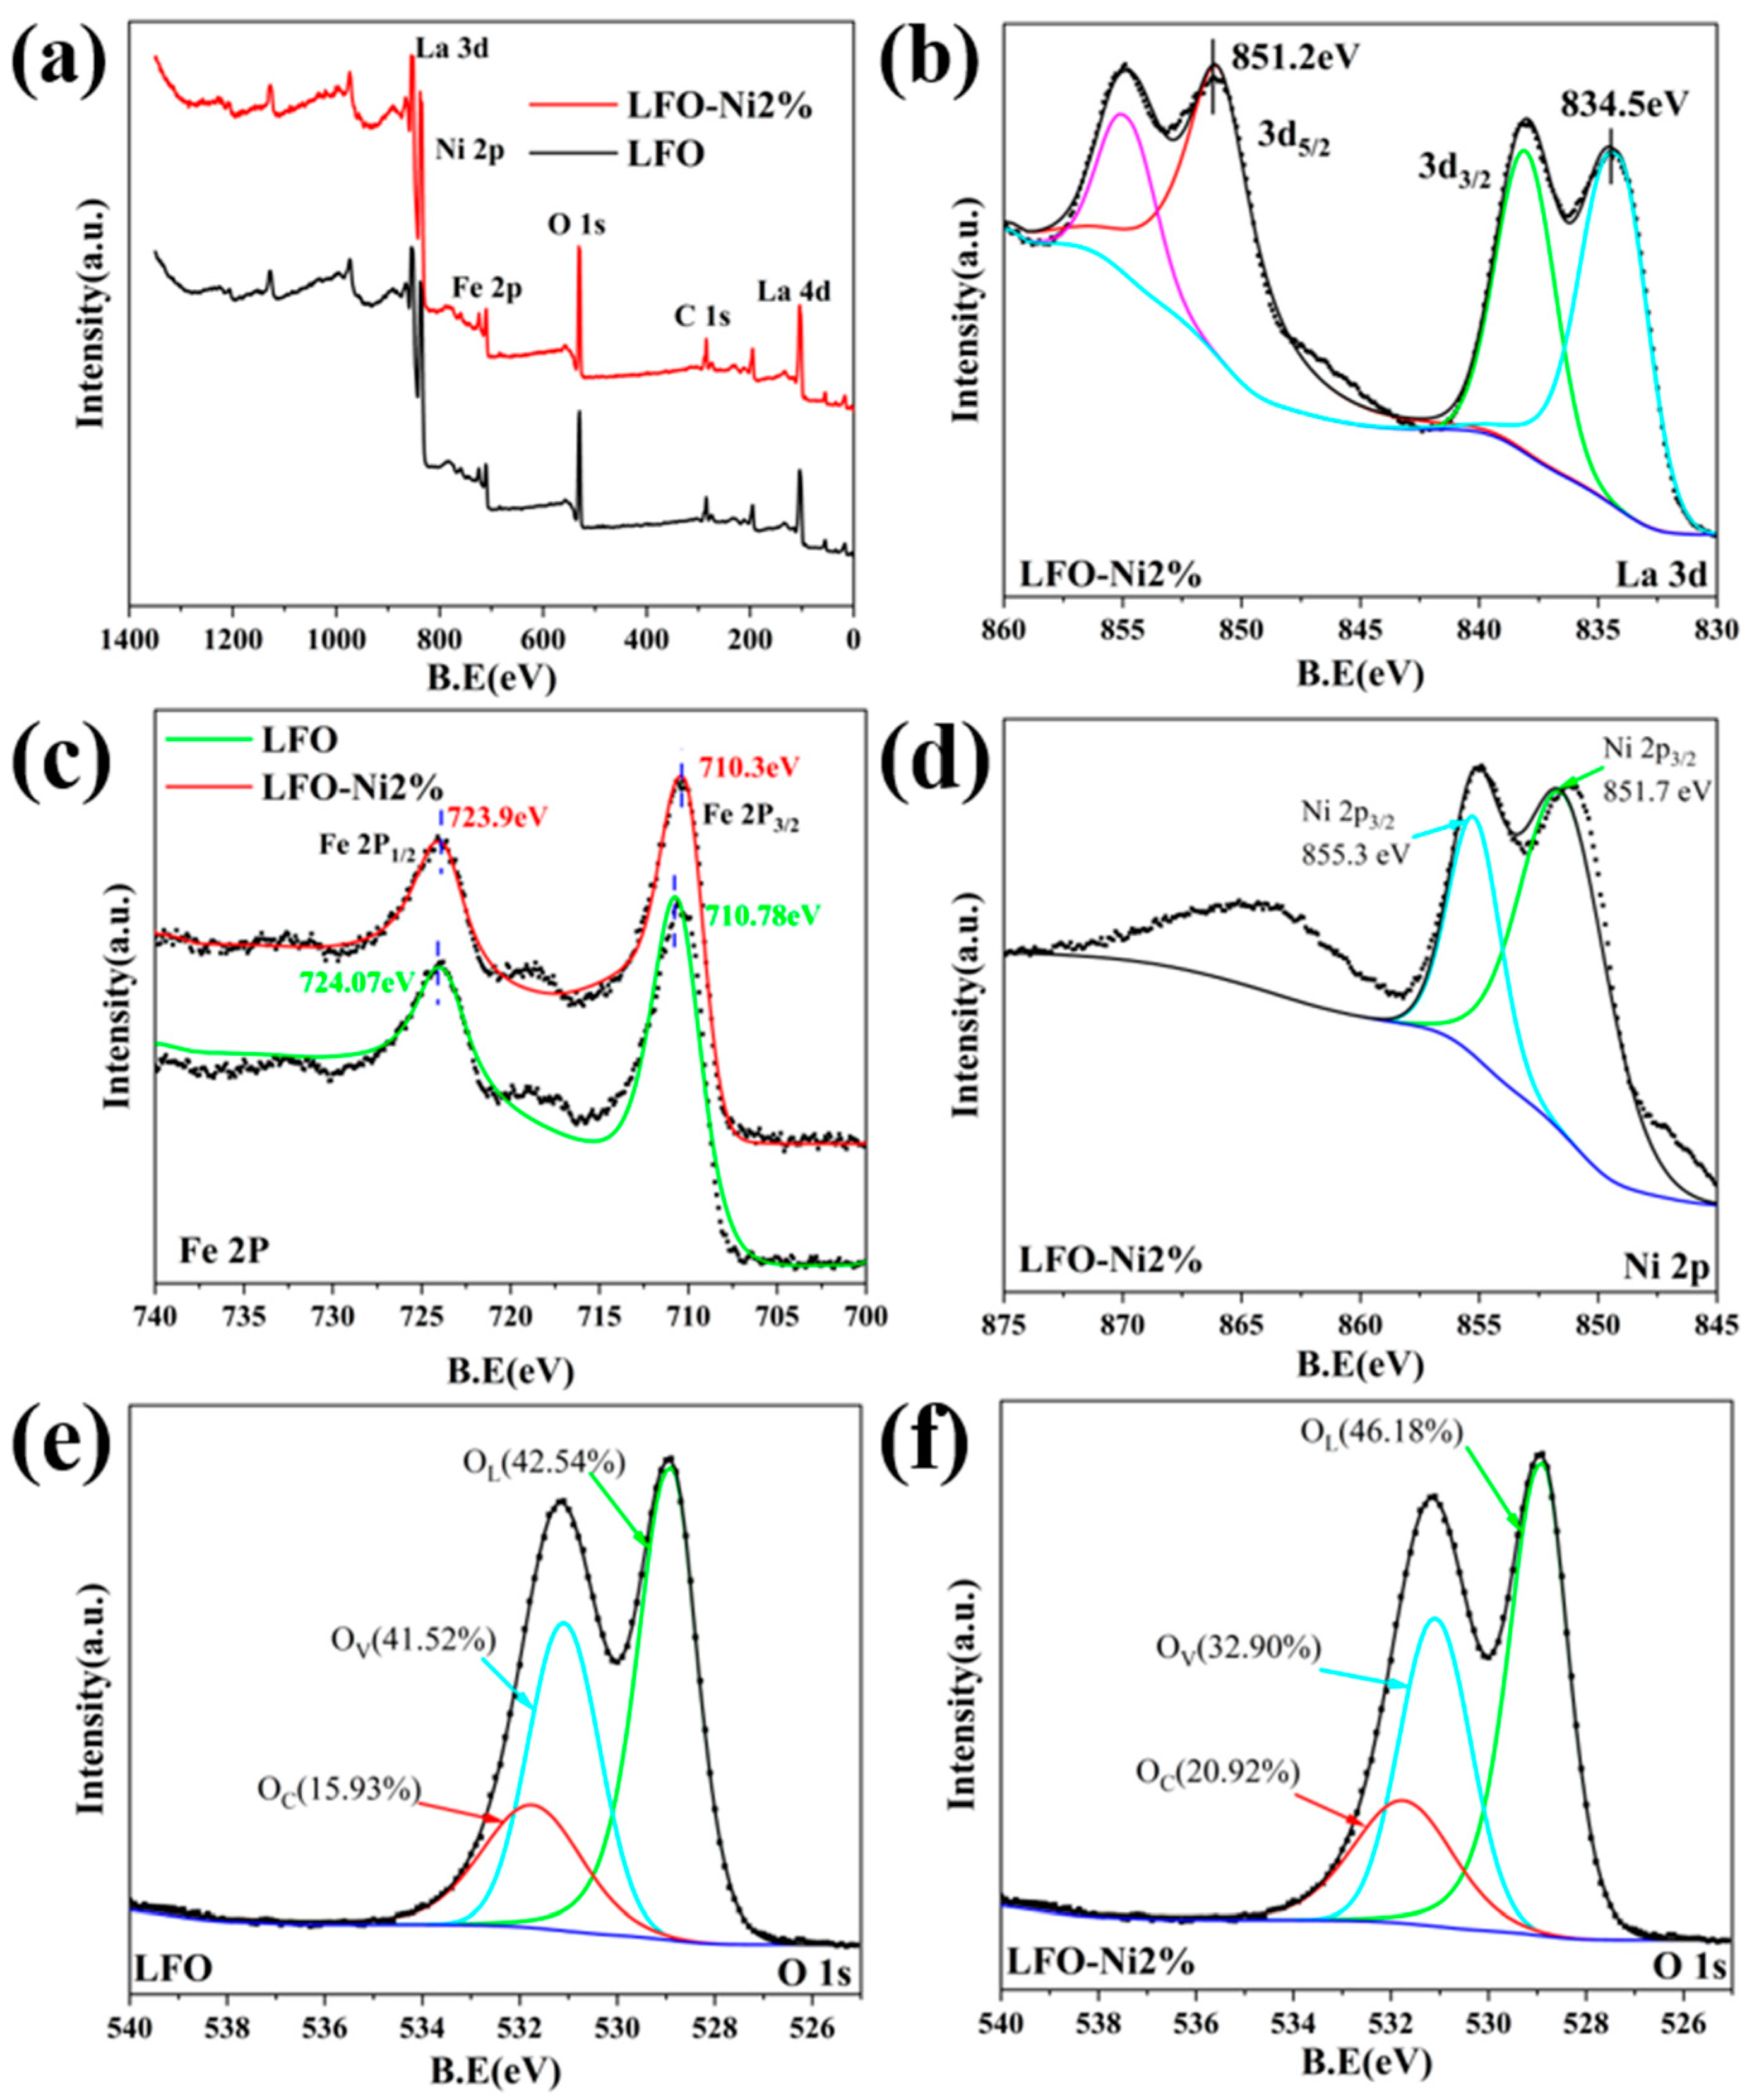
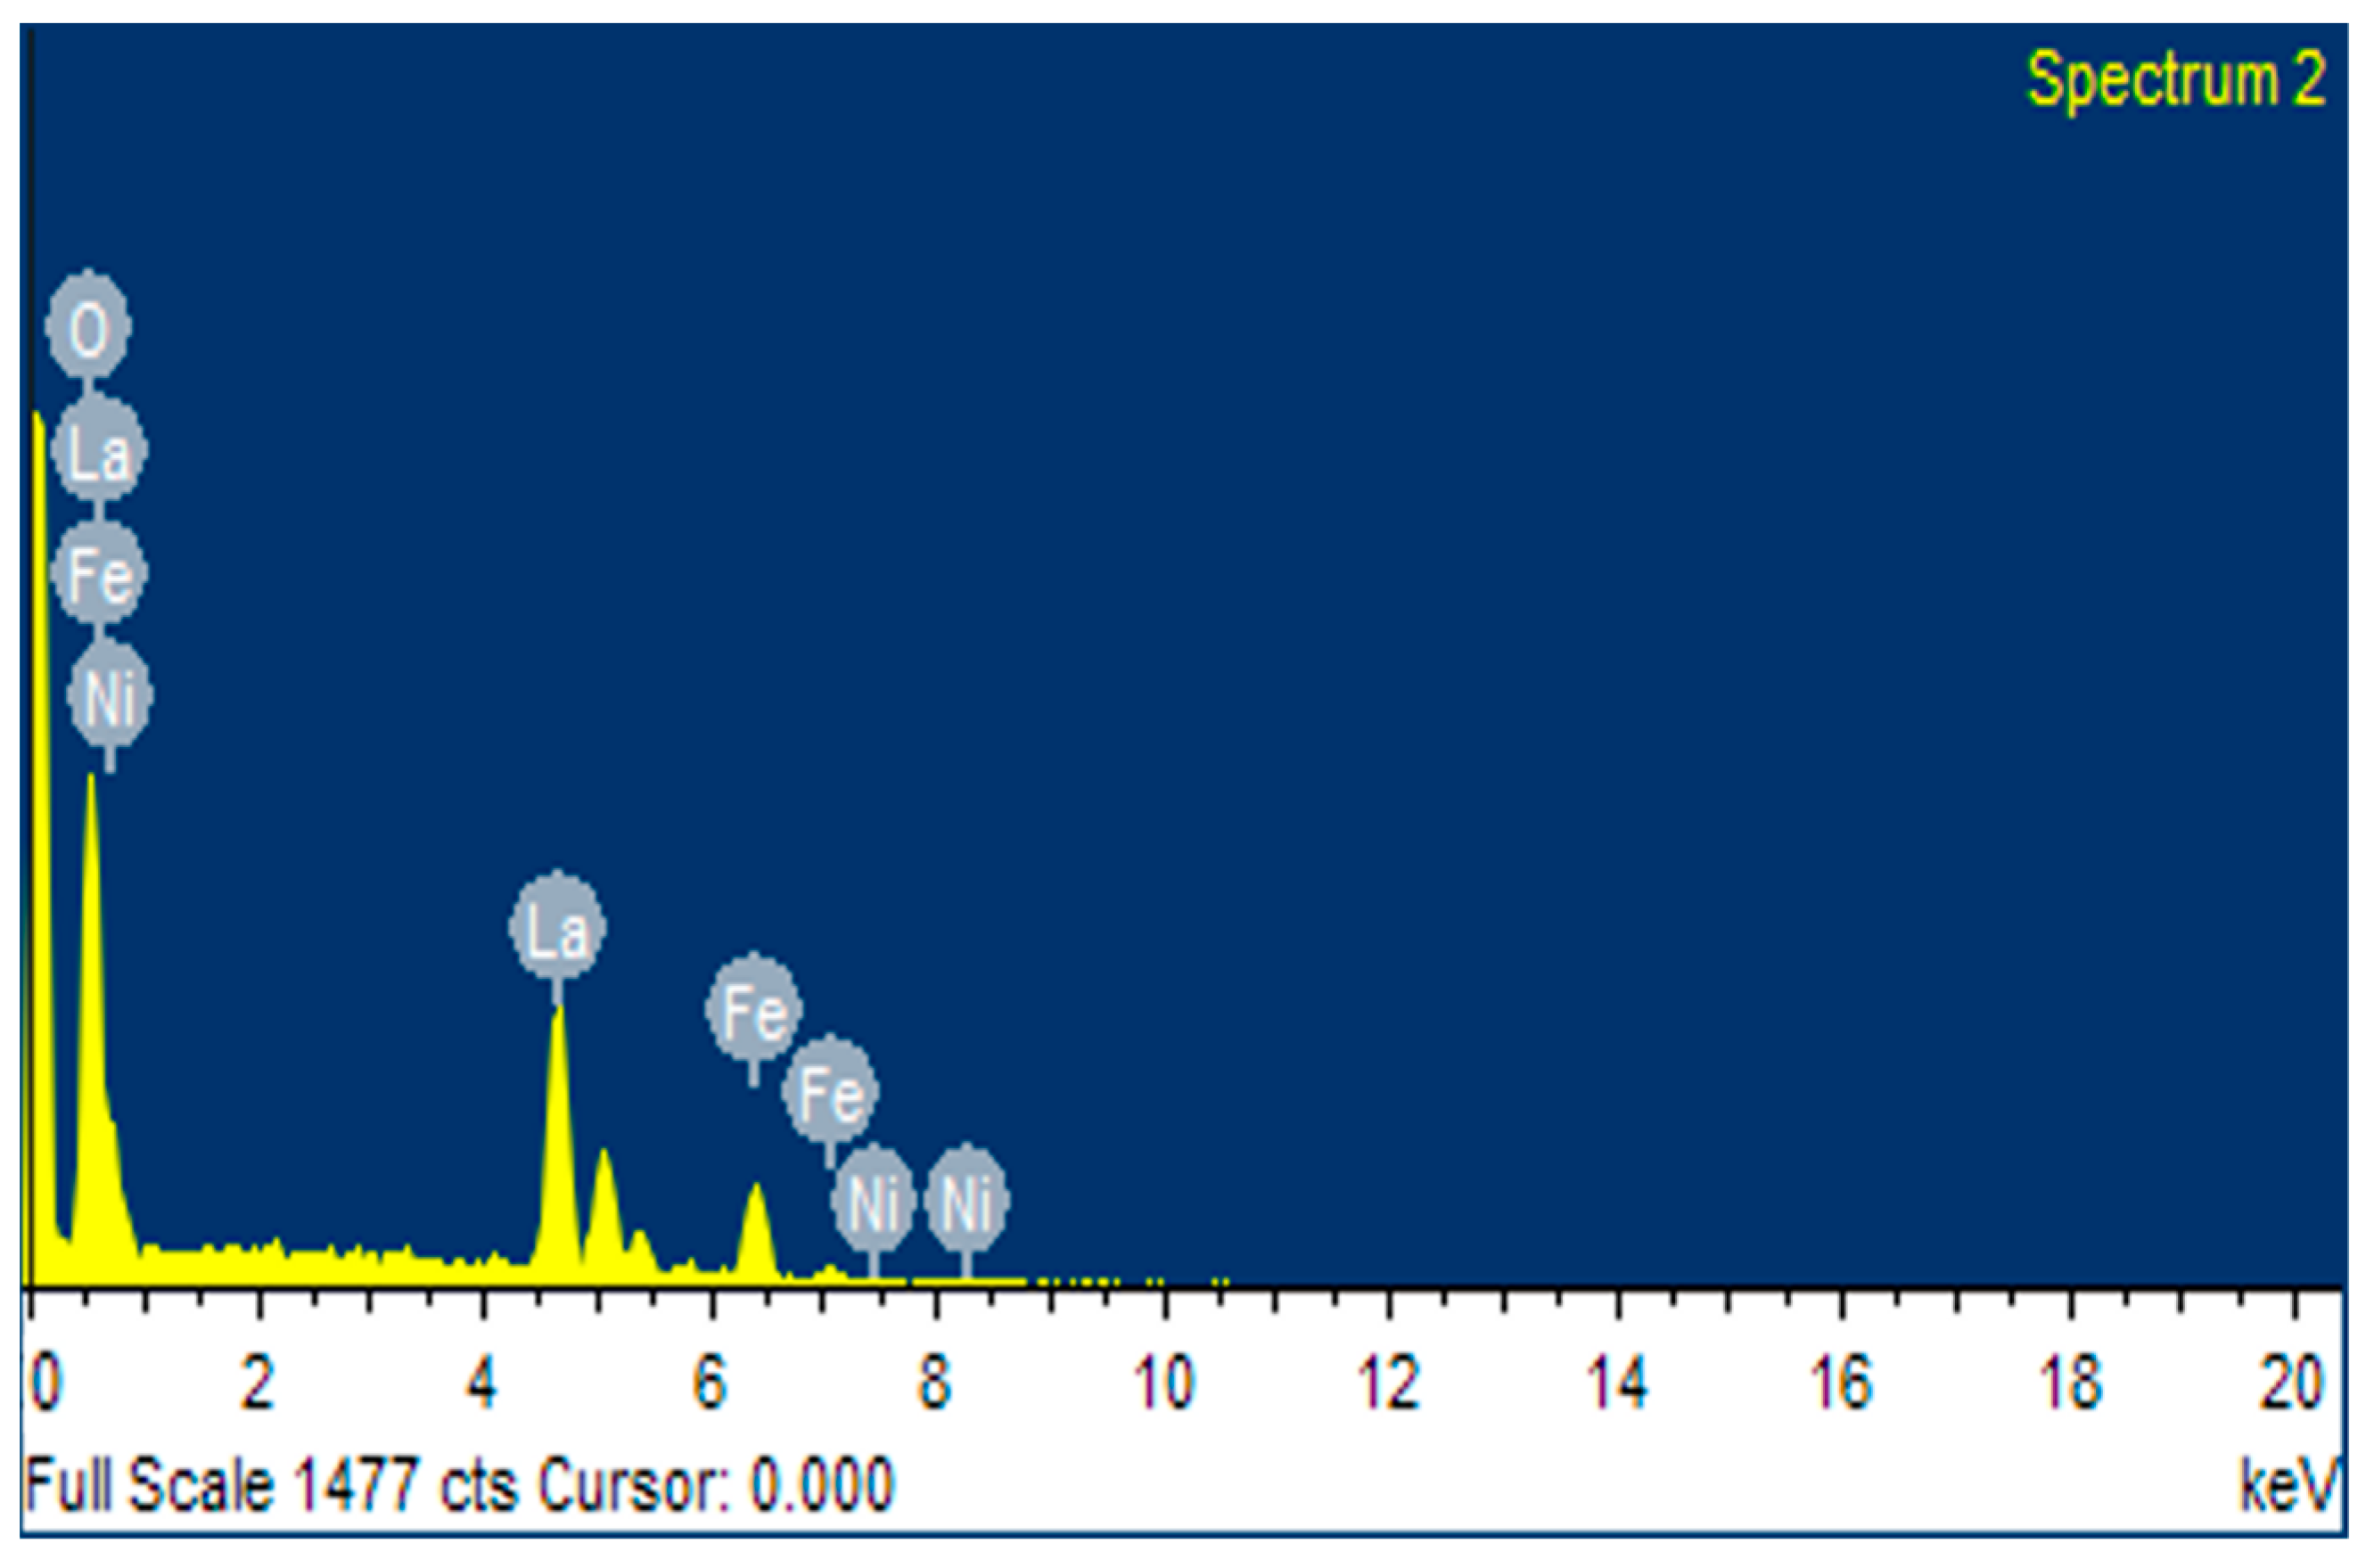
3.1. Materials Characterization

Figure 2 shows the SEM images of different samples. It can be observed from the images that the pure LaFeO3 sample and the lanthanum ferrite sample doped with Ni have similar morphologies, both exhibiting a microsphere structure. However, with an increase in the Ni doping concentration, there are certain differences in the completeness, quantity, and size of the microspheres. The SEM image of the sample doped with 2% Ni, as shown in Figure 2f, indicates good completeness of the generated microspheres, fewer aggregation phenomena, larger porosity, and a higher quantity. Previous research indicates that spherical structures possess a greater specific surface area, and smaller microspheres can augment the contact area between the target gas and the material, thus facilitating the adsorption or desorption of the gas and significantly improving the gas sensing capabilities of the sensor. Additionally, the microsphere structure contains some pore structures, which can also enlarge the specific surface area. These pores facilitate the diffusion and adsorption of triethylamine molecules into the gas-sensitive material, enabling more triethylamine molecules to react with adsorbed oxygen ions, thereby achieving a higher response. The influence of Ni doping on the morphology of the material may be attributed to the distortion of the LaFeO3 crystal structure caused by Ni doping, thereby altering the physicochemical properties of the crystal surface, which, in turn, leads to changes in the growth direction of nanoparticles, thereby affecting the microstructure. When the Ni doping concentration is low, as indicated in Figure 2d, it can be observed that the spherical structure in the sample is incomplete and relatively large in size. Conversely, when the Ni doping concentration is high, as shown in Figure 2g,j, some microspheres in the sample exhibit structural damage or begin to aggregate. These factors can lead to a decrease in the performance of the sensor. Figure 3 shows the EDS map of LFO-Ni2%, revealing the presence of elements such as La, Fe, Ni, and O in the sample, evenly distributed within the nanospheres.
In Figure 4, the crystal structures of five prepared samples are analyzed using XRD. According to Figure 4a, by comparing the diffraction peaks of the samples with the standard card for LaFeO3 (PDF#88-0641), it is evident that the diffraction peaks of all the samples match those of the standard card, indicating the formation of the perovskite structure of LaFeO3 in the prepared samples. For the LaFeO3 samples doped with Ni, no characteristic peaks related to Ni monomers or their compounds were found, indicating that the doped Ni has entered the crystal structure of LaFeO3 without altering the purity of the samples. To further observe the changes in the diffraction peaks of the samples, the maximum peak at 2θ = 32.1° corresponding to the (121) plane was selected and magnified for comparison, as shown in Figure 4b. It is clear that with an increase in the Ni doping concentration, the diffraction peaks shift significantly towards higher 2θ angles, with increased intensity and broadening [31]. This is attributed to the successful doping of Ni into the LaFeO3 lattice, which suppresses the growth of large-sized LaFeO3 sensitive element crystals. To confirm this, the average crystal sizes of the LFO, LFO-Ni1%, LFO-N2%, LFO-Ni3%, and LFO-Ni5% samples were calculated using the Scherer equation, resulting in sizes of 13.076, 12.883, 12.433, 12.112, and 11.728 nm, respectively. The gradual reduction in crystal size for the five samples demonstrates that the Ni doping suppresses the crystal growth of lanthanum ferrite materials [32].
In order to obtain precise information about the surface composition and chemical states of the perovskite LaFeO3 sensitive device, XPS was used to characterize the perovskite LaFeO3 sensitive device. A typical XPS survey spectrum is shown in Figure 5a. It can be noted that the LFO-Ni2% sample mainly contains the elements La, Fe, Ni, O, and C. The presence of carbon is primarily for calibrating the binding energies of elements. Figure 5b clearly depicts the main peaks of La 3d3/2 and La 3d5/2, with binding energies of 834.5 eV and 851.2 eV, respectively, indicating the presence of La in the LFO-Ni2% microspheres in the La3+ state [20,33]. Figure 5c shows the XPS spectra of Fe 2p in LFO and LFO-Ni2%. The Fe peak is divided into two main peaks: Fe 2p3/2 (710.3 eV) and Fe 2p1/2 (723.9 eV). However, a slight shift towards lower binding energy is observed in the Fe 2p peak in LFO-Ni2%. This can be attributed to the influence of doped Ni on the Fe-O bond [34,35]. As shown in Figure 5d, the Ni 2p3/2 orbitals at around 855.3 eV and 851.7 eV correspond to Ni3+ and Ni2+, respectively. This is because some Ni2+ ions are oxidized to Ni3+ ions under high-temperature calcination [36,37]. In the LaFeO3 crystal of LFO-Ni2%, both Ni2+ and Ni3+ replace Fe ions. Extensive and asymmetric O 1s XPS spectra correspond to three different O chemical states within the binding energy range (526.0 eV–538.0 eV). OL (528.9 eV), OV (531.3 eV), and OC (532.5 ± 0.5 eV) represent lattice oxygen, oxygen vacancies, and chemisorbed oxygen, respectively [20,38]. According to Figure 5e,f, the content of OL, OV, and OC in LFO is 42.54%, 41.52%, and 14.93%, respectively, while in LFO-Ni2%, it is 46.18%, 32.90%, and 20.92%. It can be seen that after doping with Ni, the content of OC in the sample has increased, indicating an increase in the surface adsorbed oxygen, which can improve the gas sensitivity of the material. In the air, electrons on the surface of LaFeO3 microspheres are captured by oxygen molecules, forming chemisorbed oxygen. When LaFeO3 microspheres are exposed to target gases, these adsorbed oxygen molecules rapidly capture gas molecules and undergo redox reactions. Due to the increase in the OC component (chemisorbed oxygen), the rate of the above reaction is significantly increased. Therefore, the response of LFO-Ni2% samples to target gases can be effectively improved. The increase in the OC component for gas adsorption actually provides more active sites.

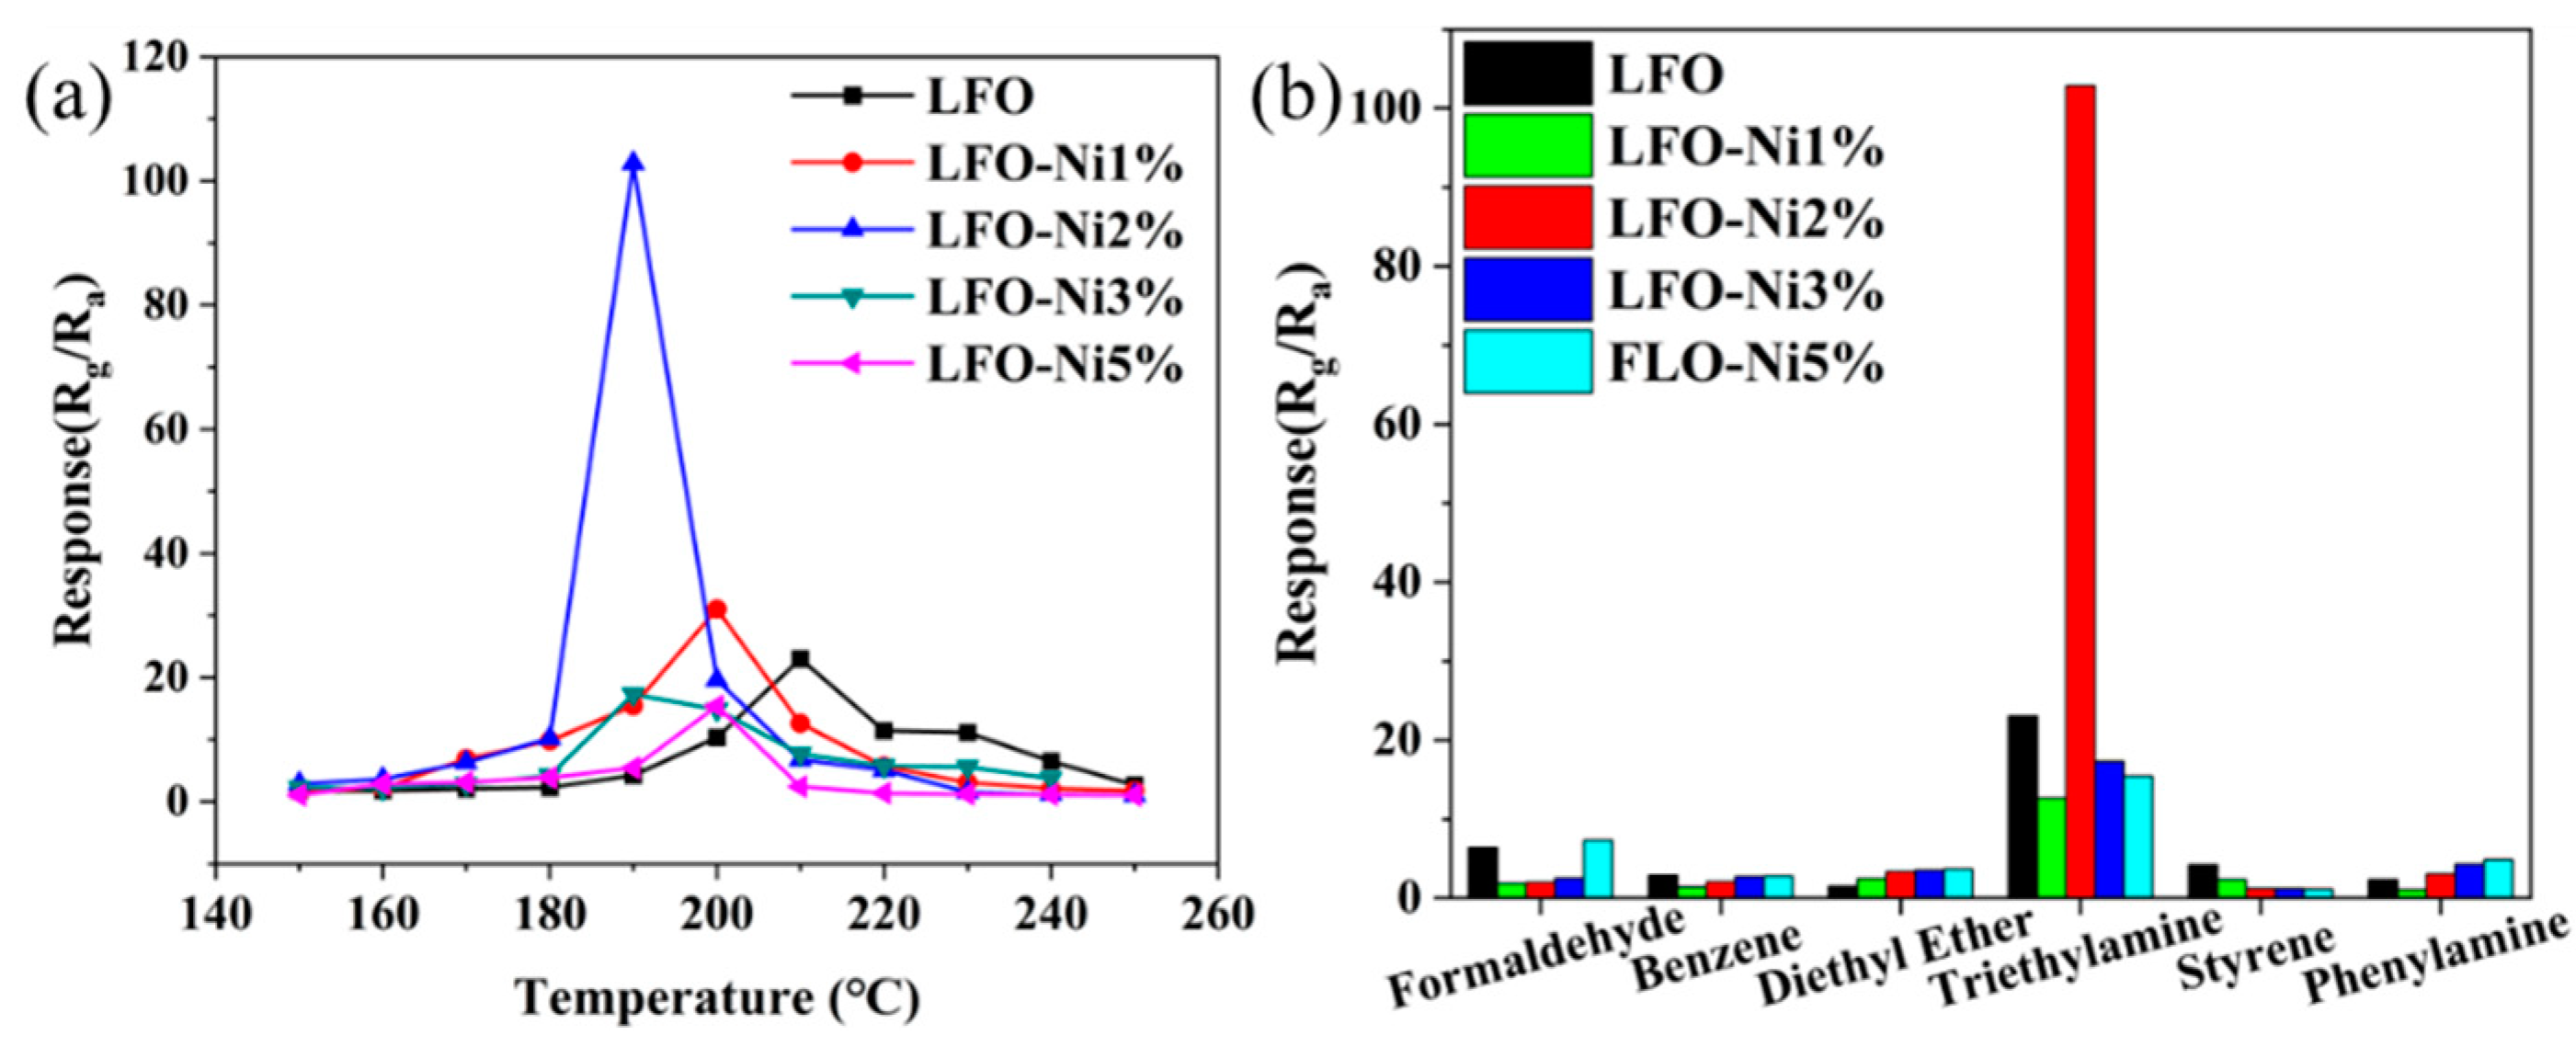
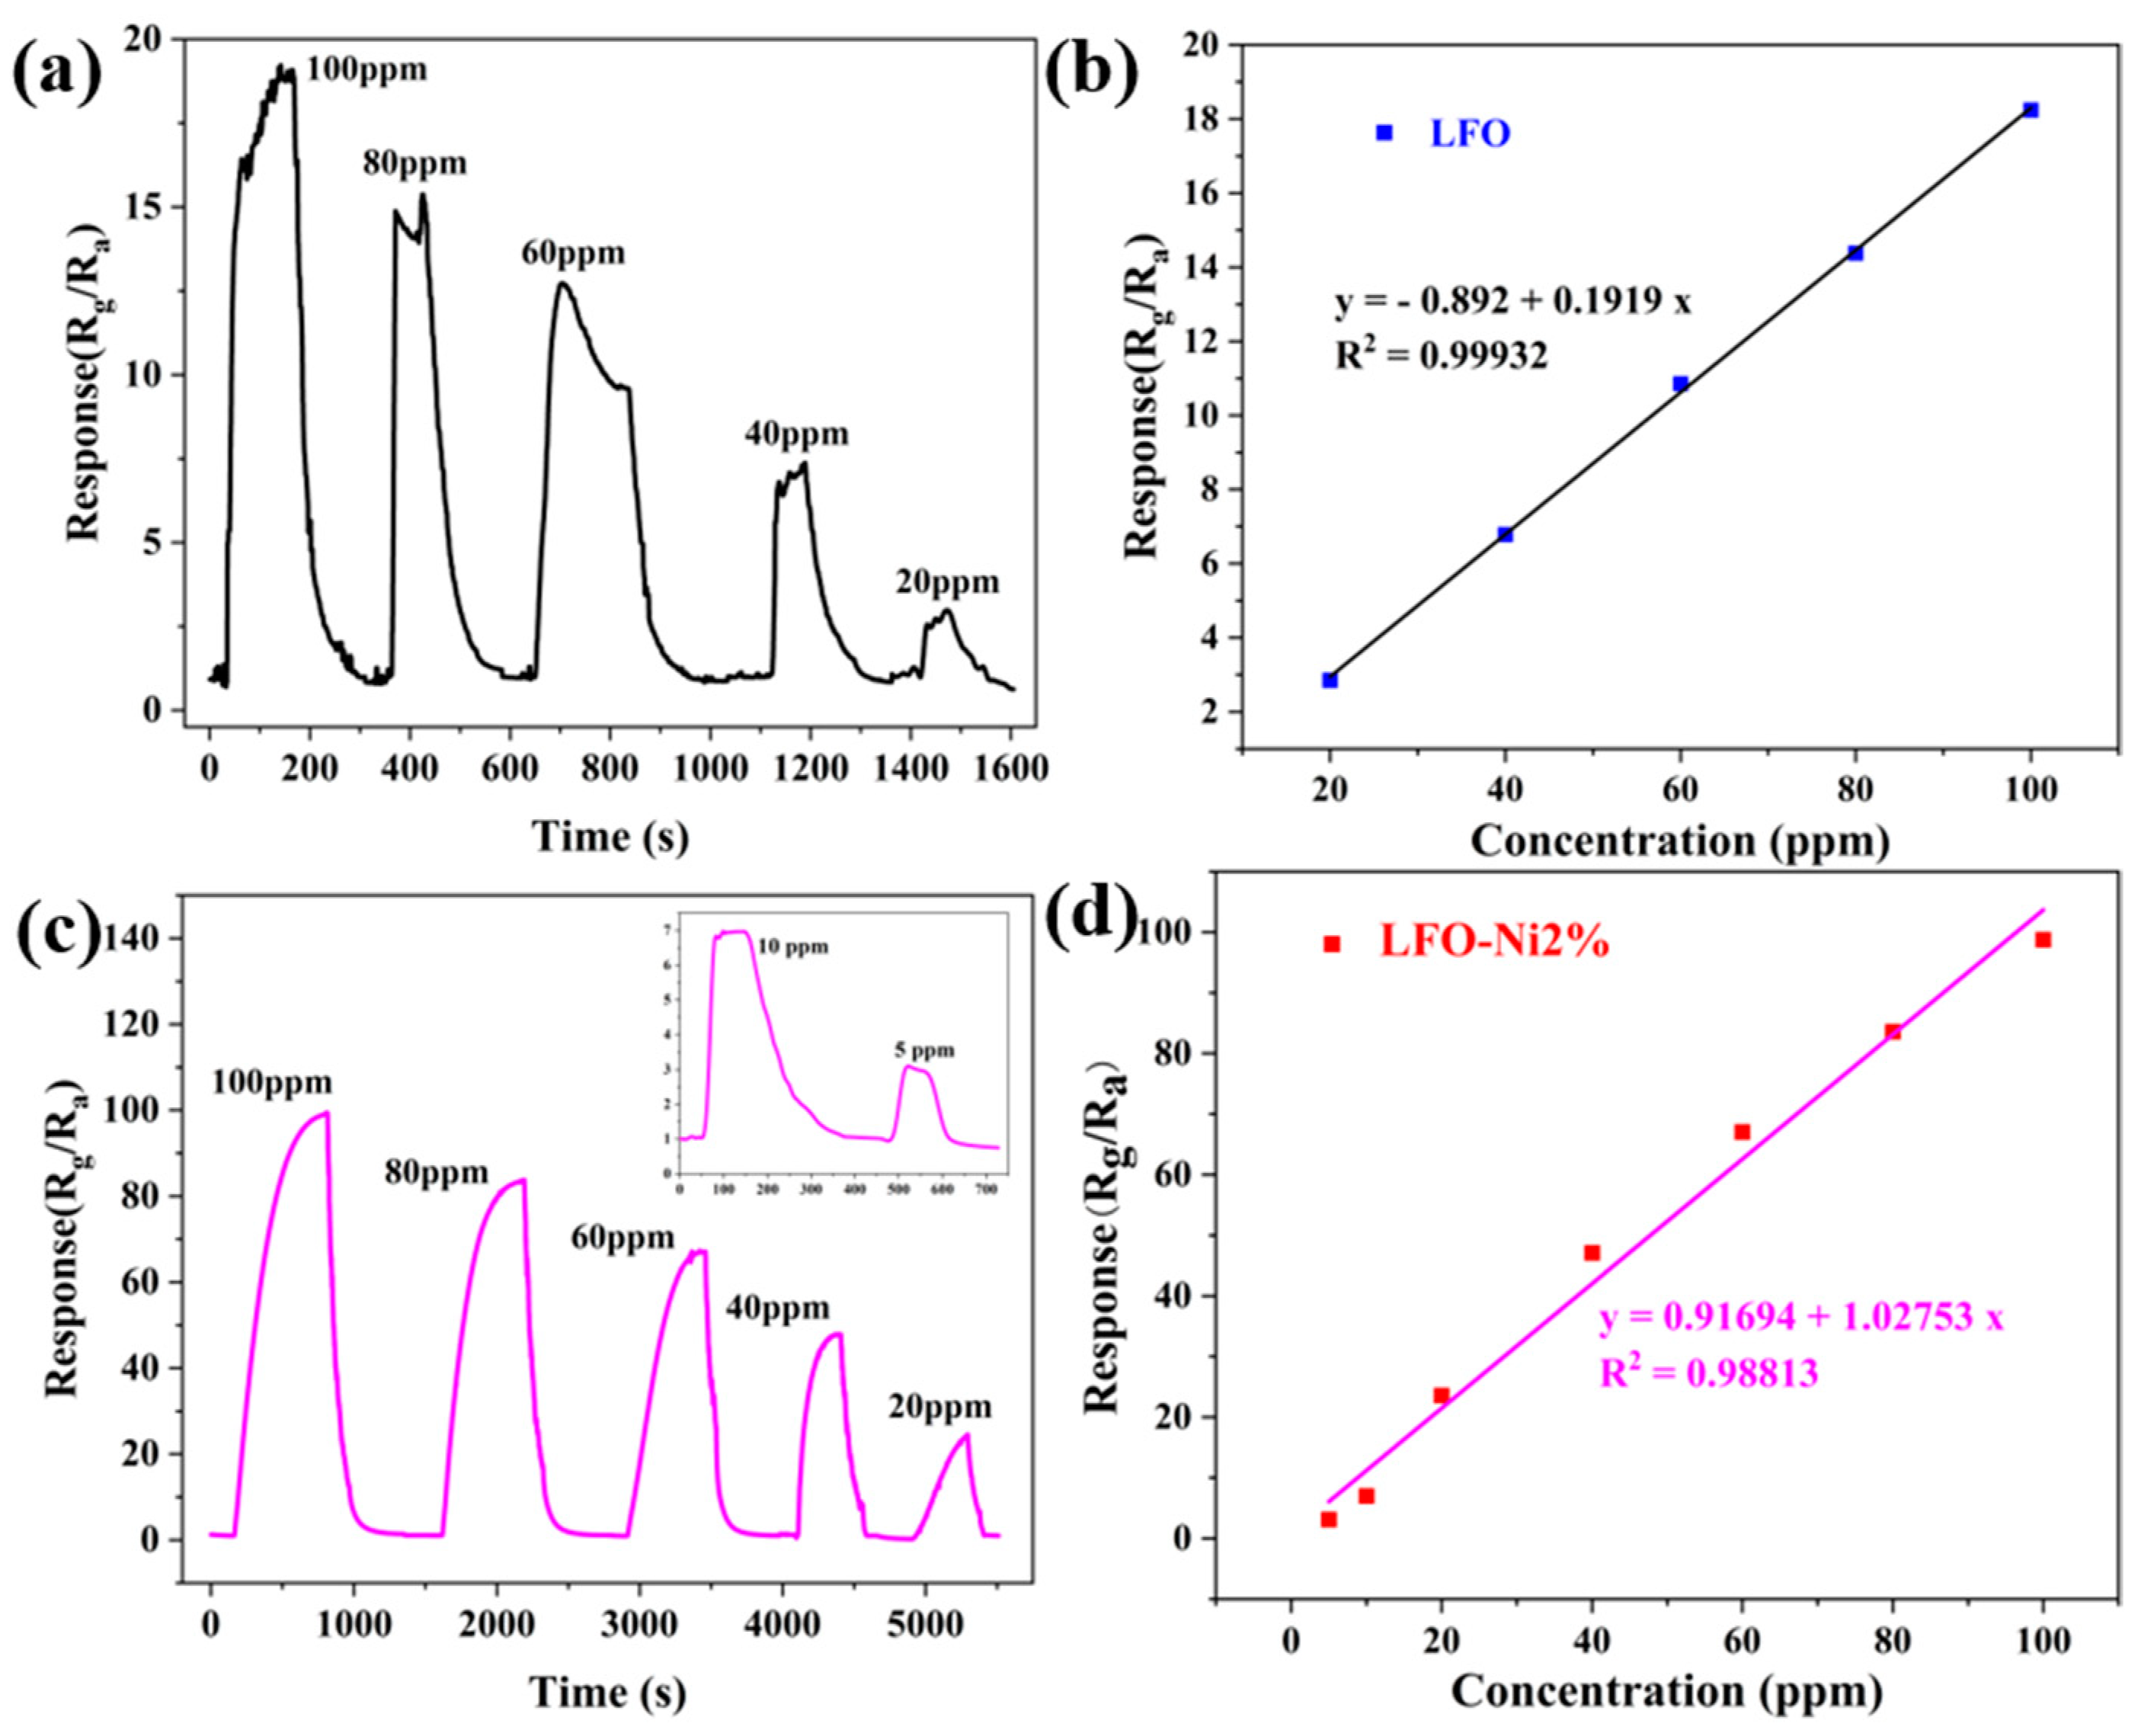
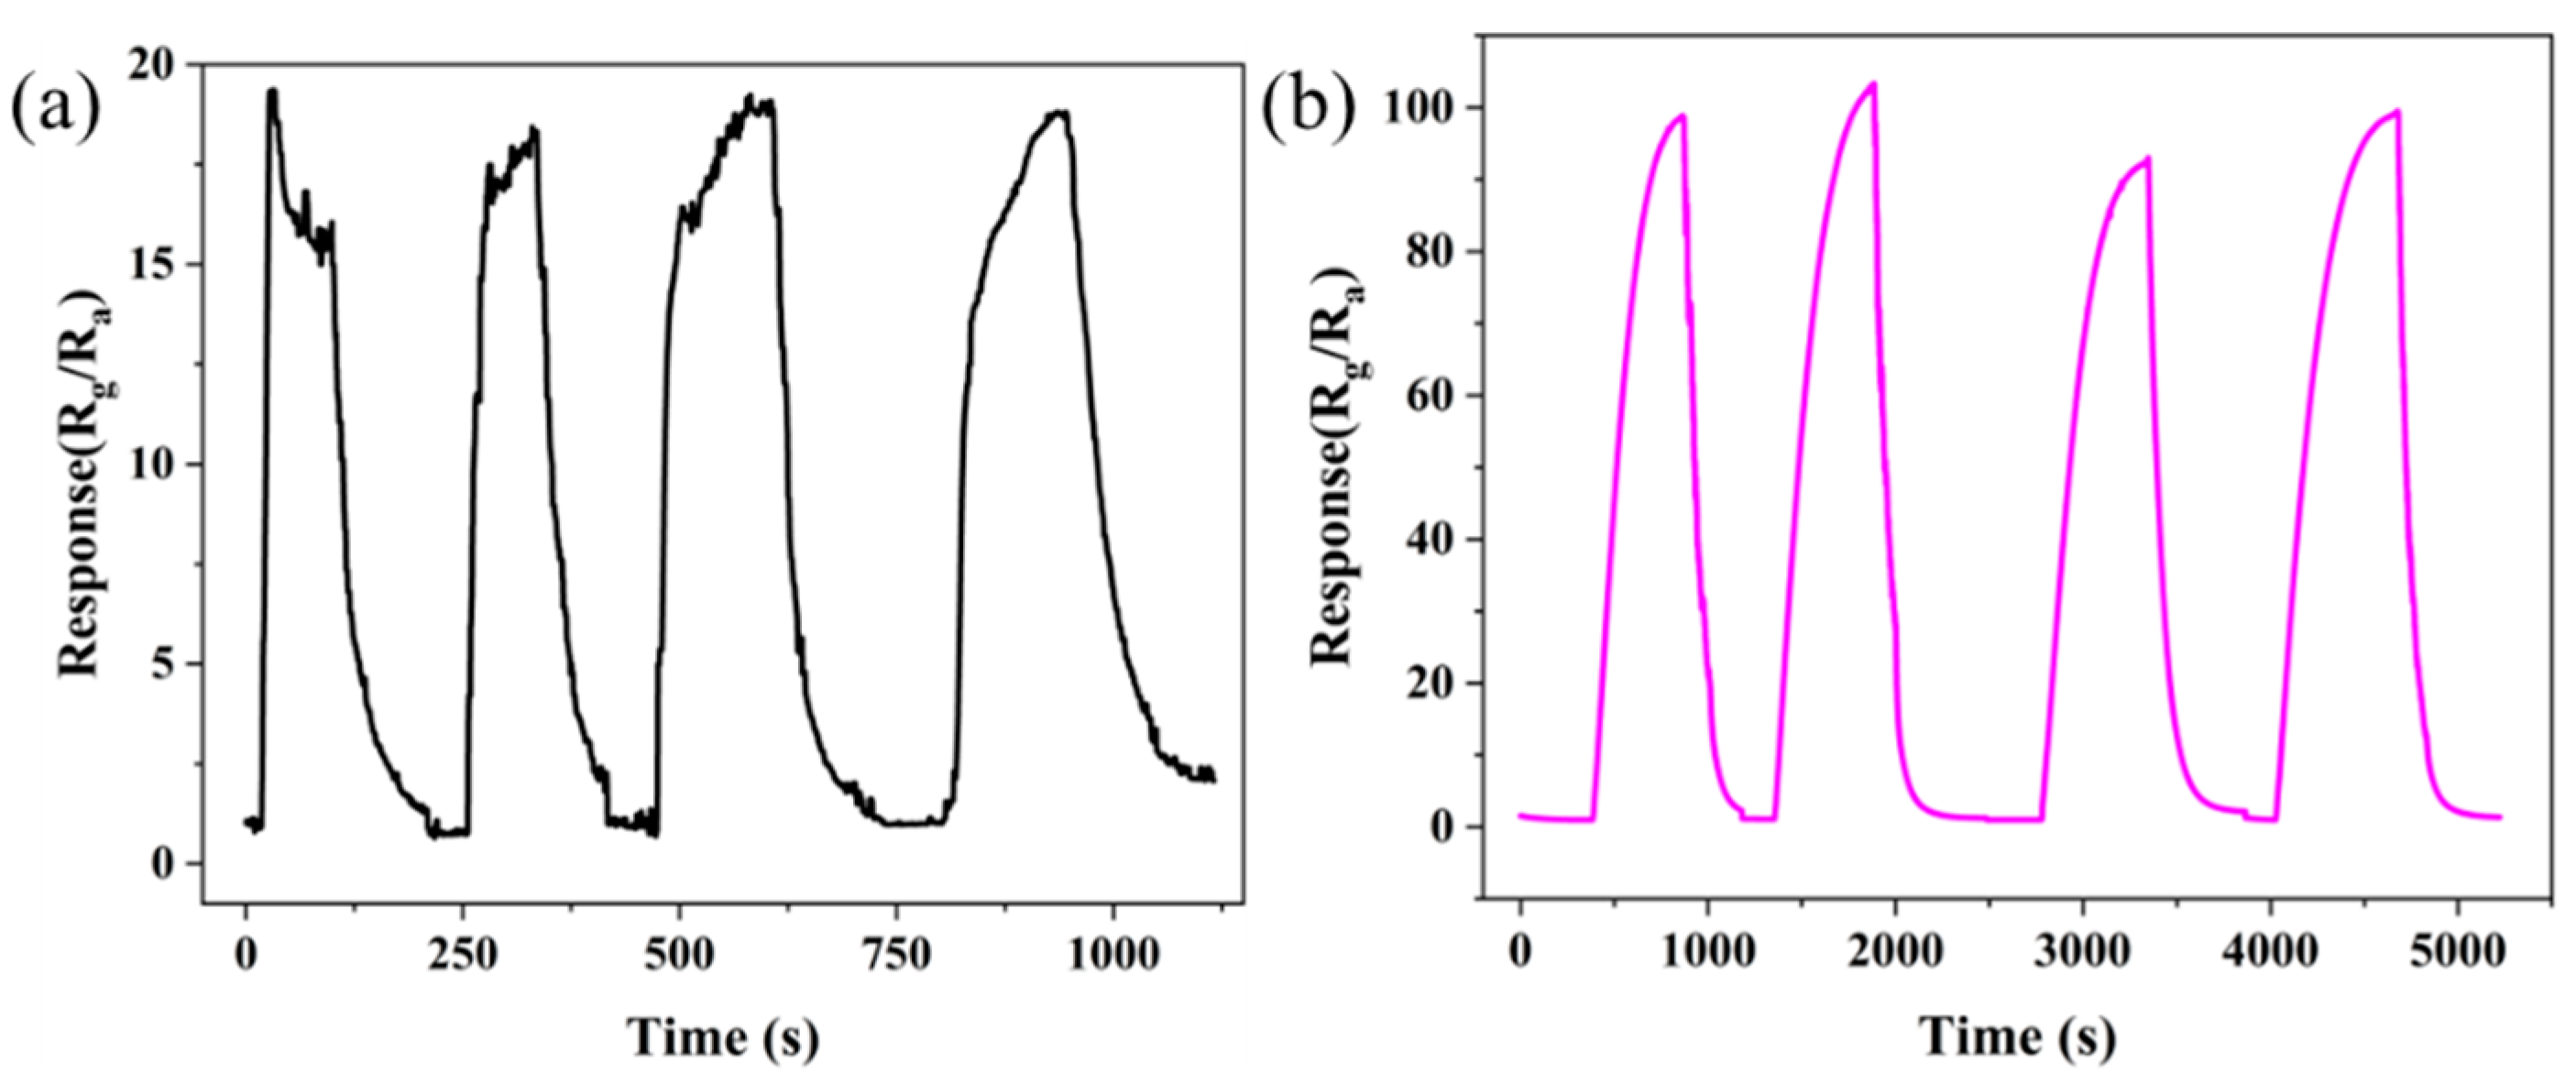
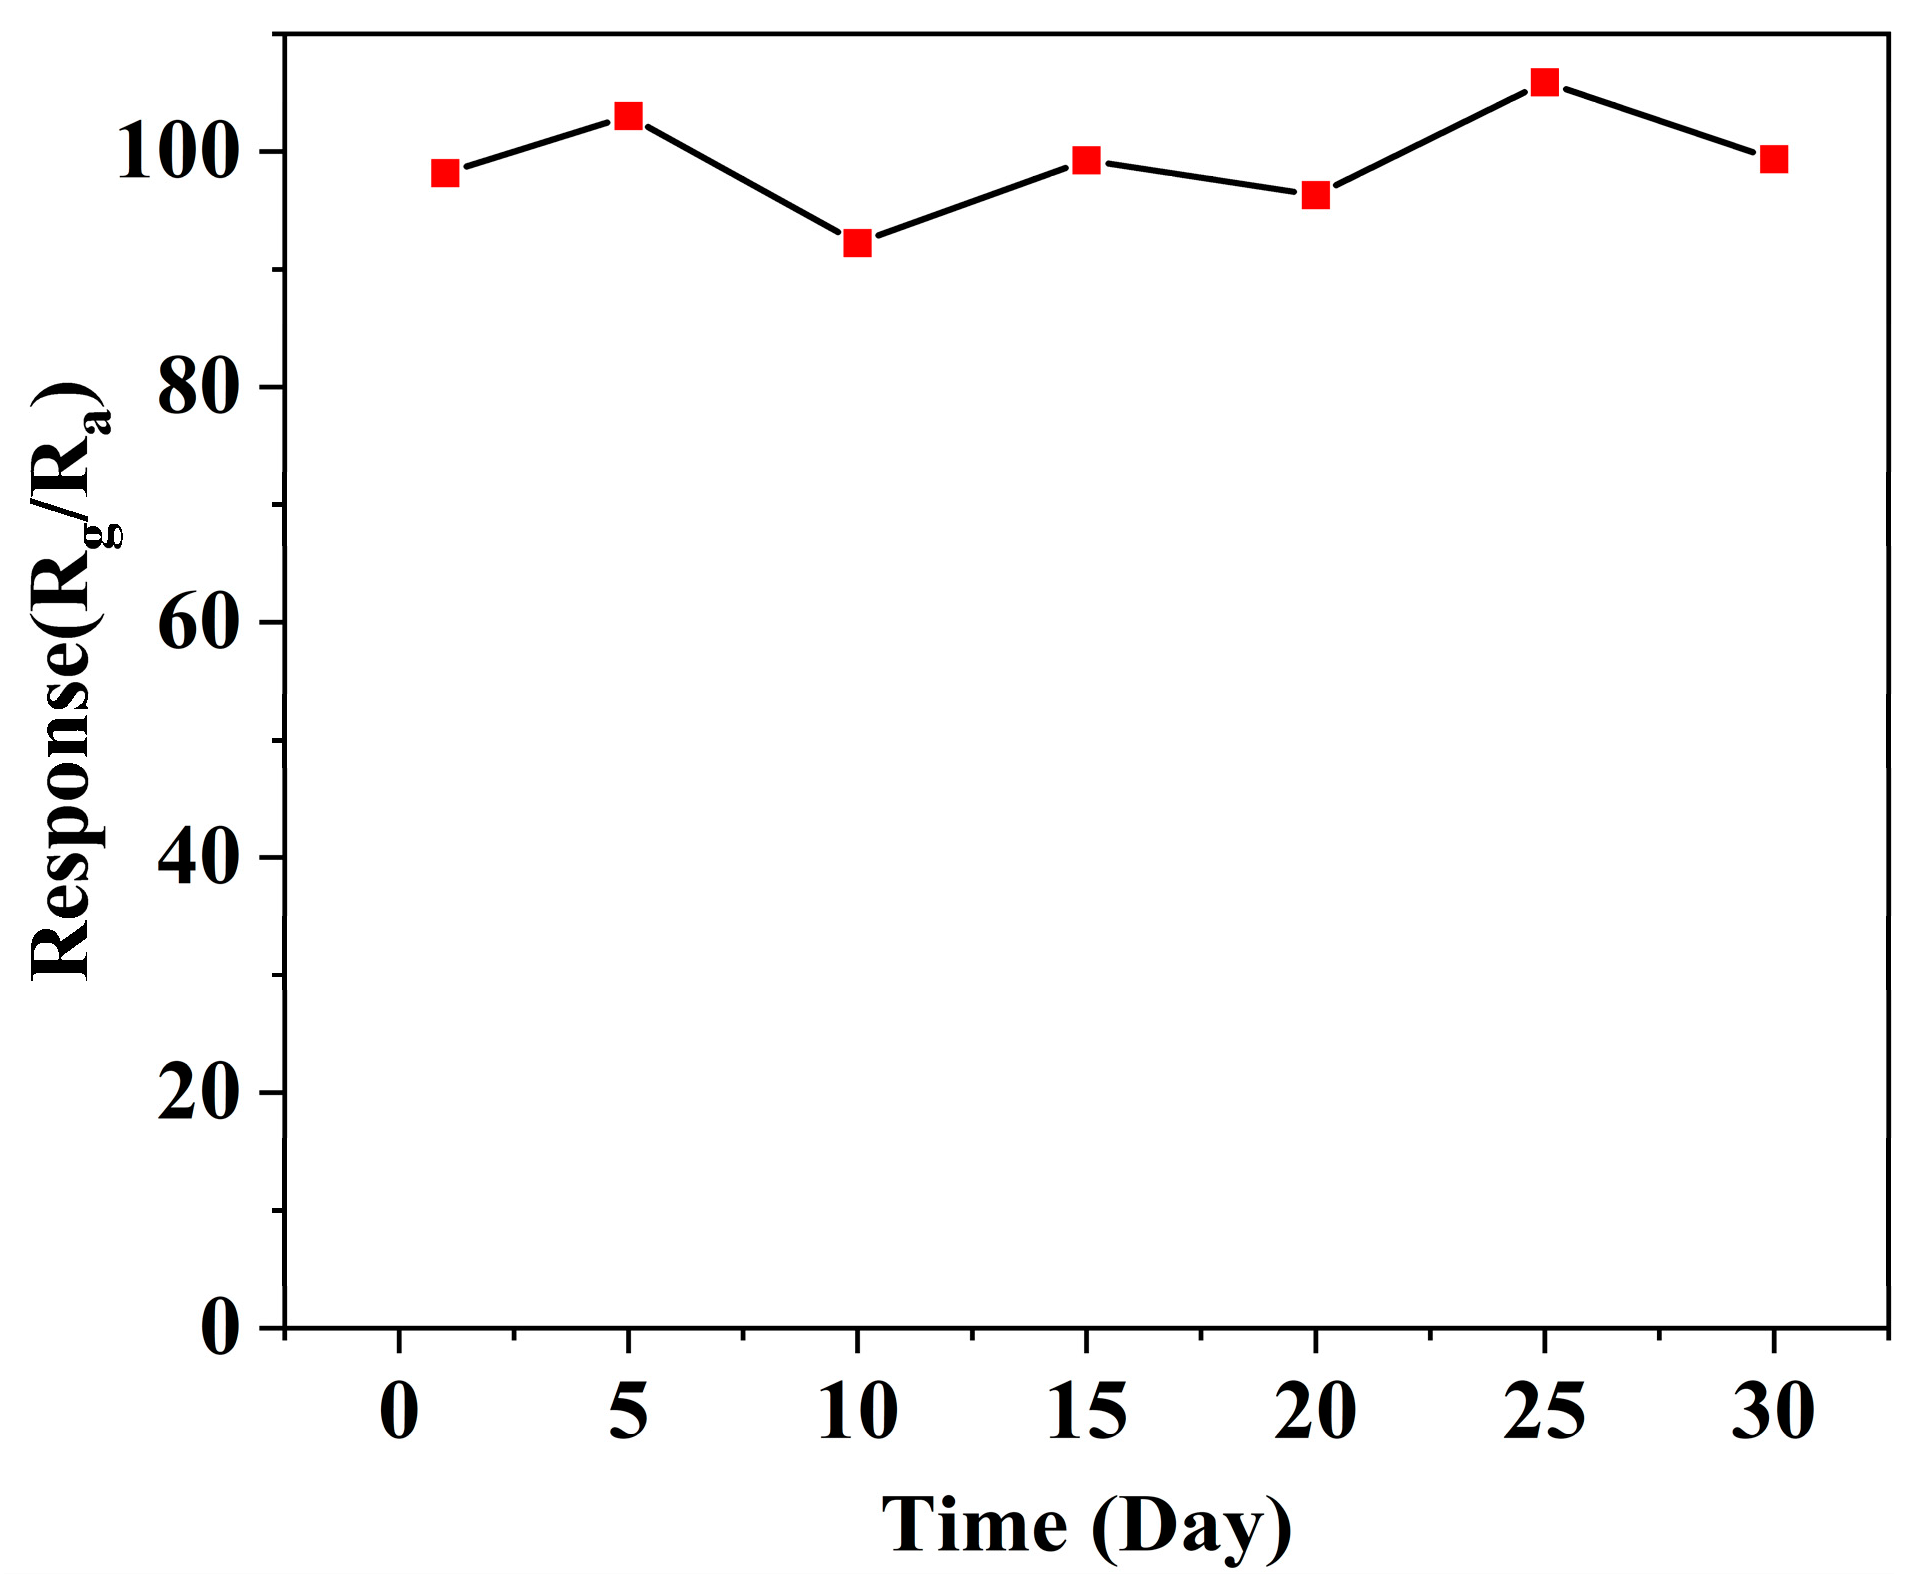
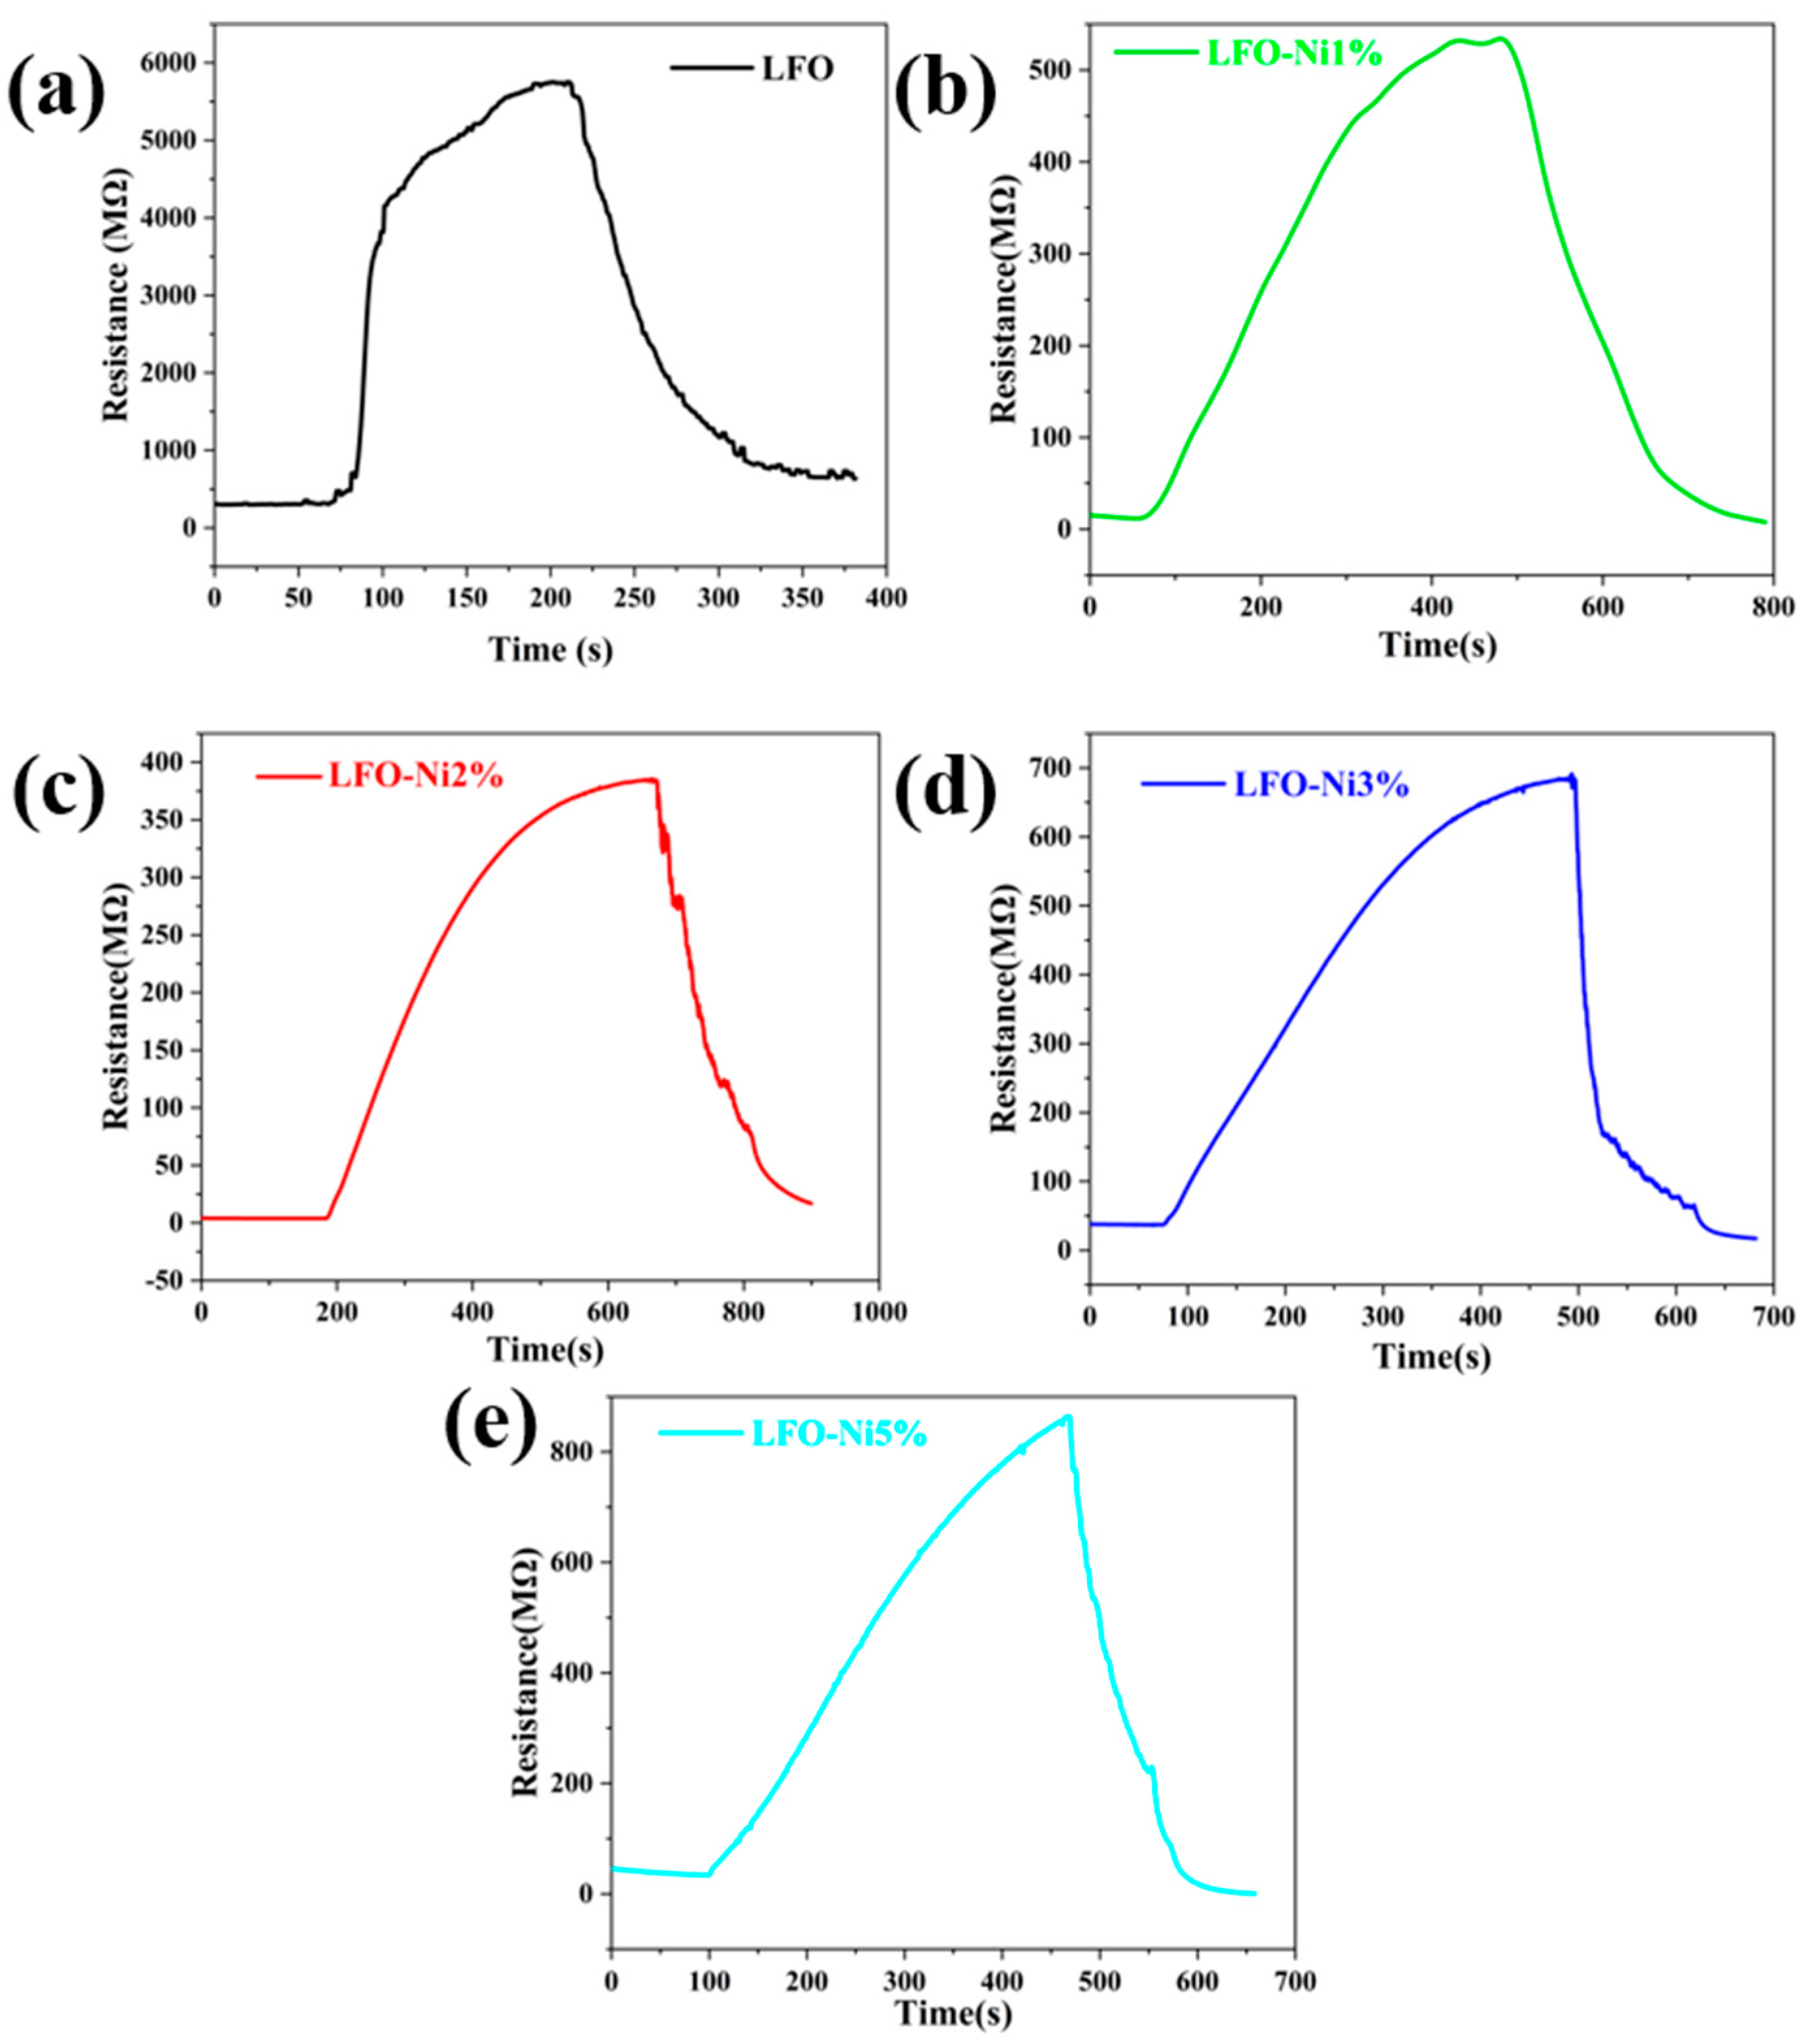
3.2. Gas Sensitive Properties of Materials

Figure 6a shows the optimal operating temperature curves for the detection of TEA at 100 ppm for the five different samples. The temperature range is from 150 °C to 250 °C, with a heating rate of 10 °C per test. From the graph, it can be observed that the response values of the sensors to 100 ppm TEA increase with increasing temperature and reach a maximum value at a certain temperature, which is the optimal operating temperature. Beyond this temperature, the response values decrease with a further increase in temperature. When the sensor operates at the optimal temperature, oxygen in the air adsorbs on the surface of the material, forming adsorbed oxygen. When the target gas is injected, it also adsorbs on the material surface and undergoes redox reactions with the adsorbed oxygen, causing a change in sensor resistance and generating a response. Both the adsorption of oxygen and the adsorption of the target gas require energy. At lower working temperatures, the sensor provides less energy, resulting in lower energy acquisition by the gas molecules and lower reactivity. As a result, the TEA molecules involved in the redox reaction with the adsorbed oxygen are limited, leading to less significant changes in material resistance and lower response values. As the temperature increases, more adsorbed oxygen is formed due to higher energy levels, and the TEA molecules become more active, allowing for more-efficient redox reactions with the adsorbed oxygen, resulting in increased response values. However, at excessively high temperatures, the molecular motion becomes too vigorous, causing the desorption rate of TEA molecules to exceed the adsorption rate, leading to lower sensor response values [39]. Figure 6a reveals that the optimal operating temperature of LFO-Ni2% doped with Ni (190 °C) is 20 °C lower than that of pure LaFeO3 (210 °C). Additionally, the response value of LFO-Ni2% at the optimal operating temperature (102.84) is 4.5 times higher than that of pure LaFeO3 (23.015). This indicates that appropriate doping of Ni in LaFeO3 not only lowers the optimal operating temperature but also effectively enhances its response value. Figure 6b displays the selectivity curves obtained for the five samples at their respective optimal operating temperatures. Regarding the selection of target gases, one to two types were chosen from common VOCs categories. Moreover, the gas concentration during the testing process was set at 100 ppm. From the graph, it can be observed that the response values of the five samples to TEA are much higher than those to other gases, with LFO-Ni2% exhibiting the most prominent phenomenon.
Figure 7a,c show the concentration gradient curves of triethylamine response for LFO at 210 °C to concentrations ranging from 20 ppm to 100 ppm, and LFO-Ni2% at 190 °C to concentrations ranging from 5 ppm to 100 ppm, respectively. From the graphs, it can be observed that for both material samples, as the concentration of TEA increases, more TEA molecules can adsorb on the material surface and undergo redox reactions with the adsorbed oxygen, resulting in larger changes in material resistance and higher response values. Figure 7b,d show the linear fitting curves for concentration and response. It can be seen that there is a good linear relationship between the concentration and response for both LFO and LFO-Ni2% materials, indicating that the prepared sensors have a well-defined linear detection range.
Repeatability and stability are two important indicators for evaluating the excellent performance of sensors. Figure 8a,b show the repeatability curves for LFO and LFO-Ni2% at their respective optimal operating temperatures in response to 100 ppm of TEA. From Figure 8b, it can be observed that the stable response values obtained from multiple measurements of 100 ppm TEA with LFO-Ni2% are consistently around 98, indicating minimal fluctuations. This suggests that the material exhibits good reproducibility, and LFO-Ni2% demonstrates good repeatability for TEA. The results from the repeatability test curves indicate that the LFO-Ni2% sensor is suitable for detecting TEA. Figure 9 illustrates the stability curves of the LFO-Ni2% sensor, showing the gas testing conducted every 5 days within a month. The test results reveal minimal fluctuations in the response for each test conducted over the course of a month, maintaining an overall balance around a relatively fixed value. This indicates the good stability of the LFO-Ni2% sensor.
LaFeO3 is a typical P-type perovskite oxide with a highly stable structure and excellent thermal stability. Substituting low-valence cations (such as Ni2+) for A-site or B-site ions in LaFeO3 can significantly reduce resistance and enhance response. Additionally, the microsphere structure with smaller size and pores increases the specific surface area, facilitating the reaction between triethylamine molecules and adsorbed oxygen, thereby achieving a higher response [18]. Furthermore, this study compared the developed sensor with other TEA sensors (as shown in Table 1). The gas sensor doped with 2% LaFeO3 exhibited a lower optimal operating temperature and a higher response compared to other TEA sensors.

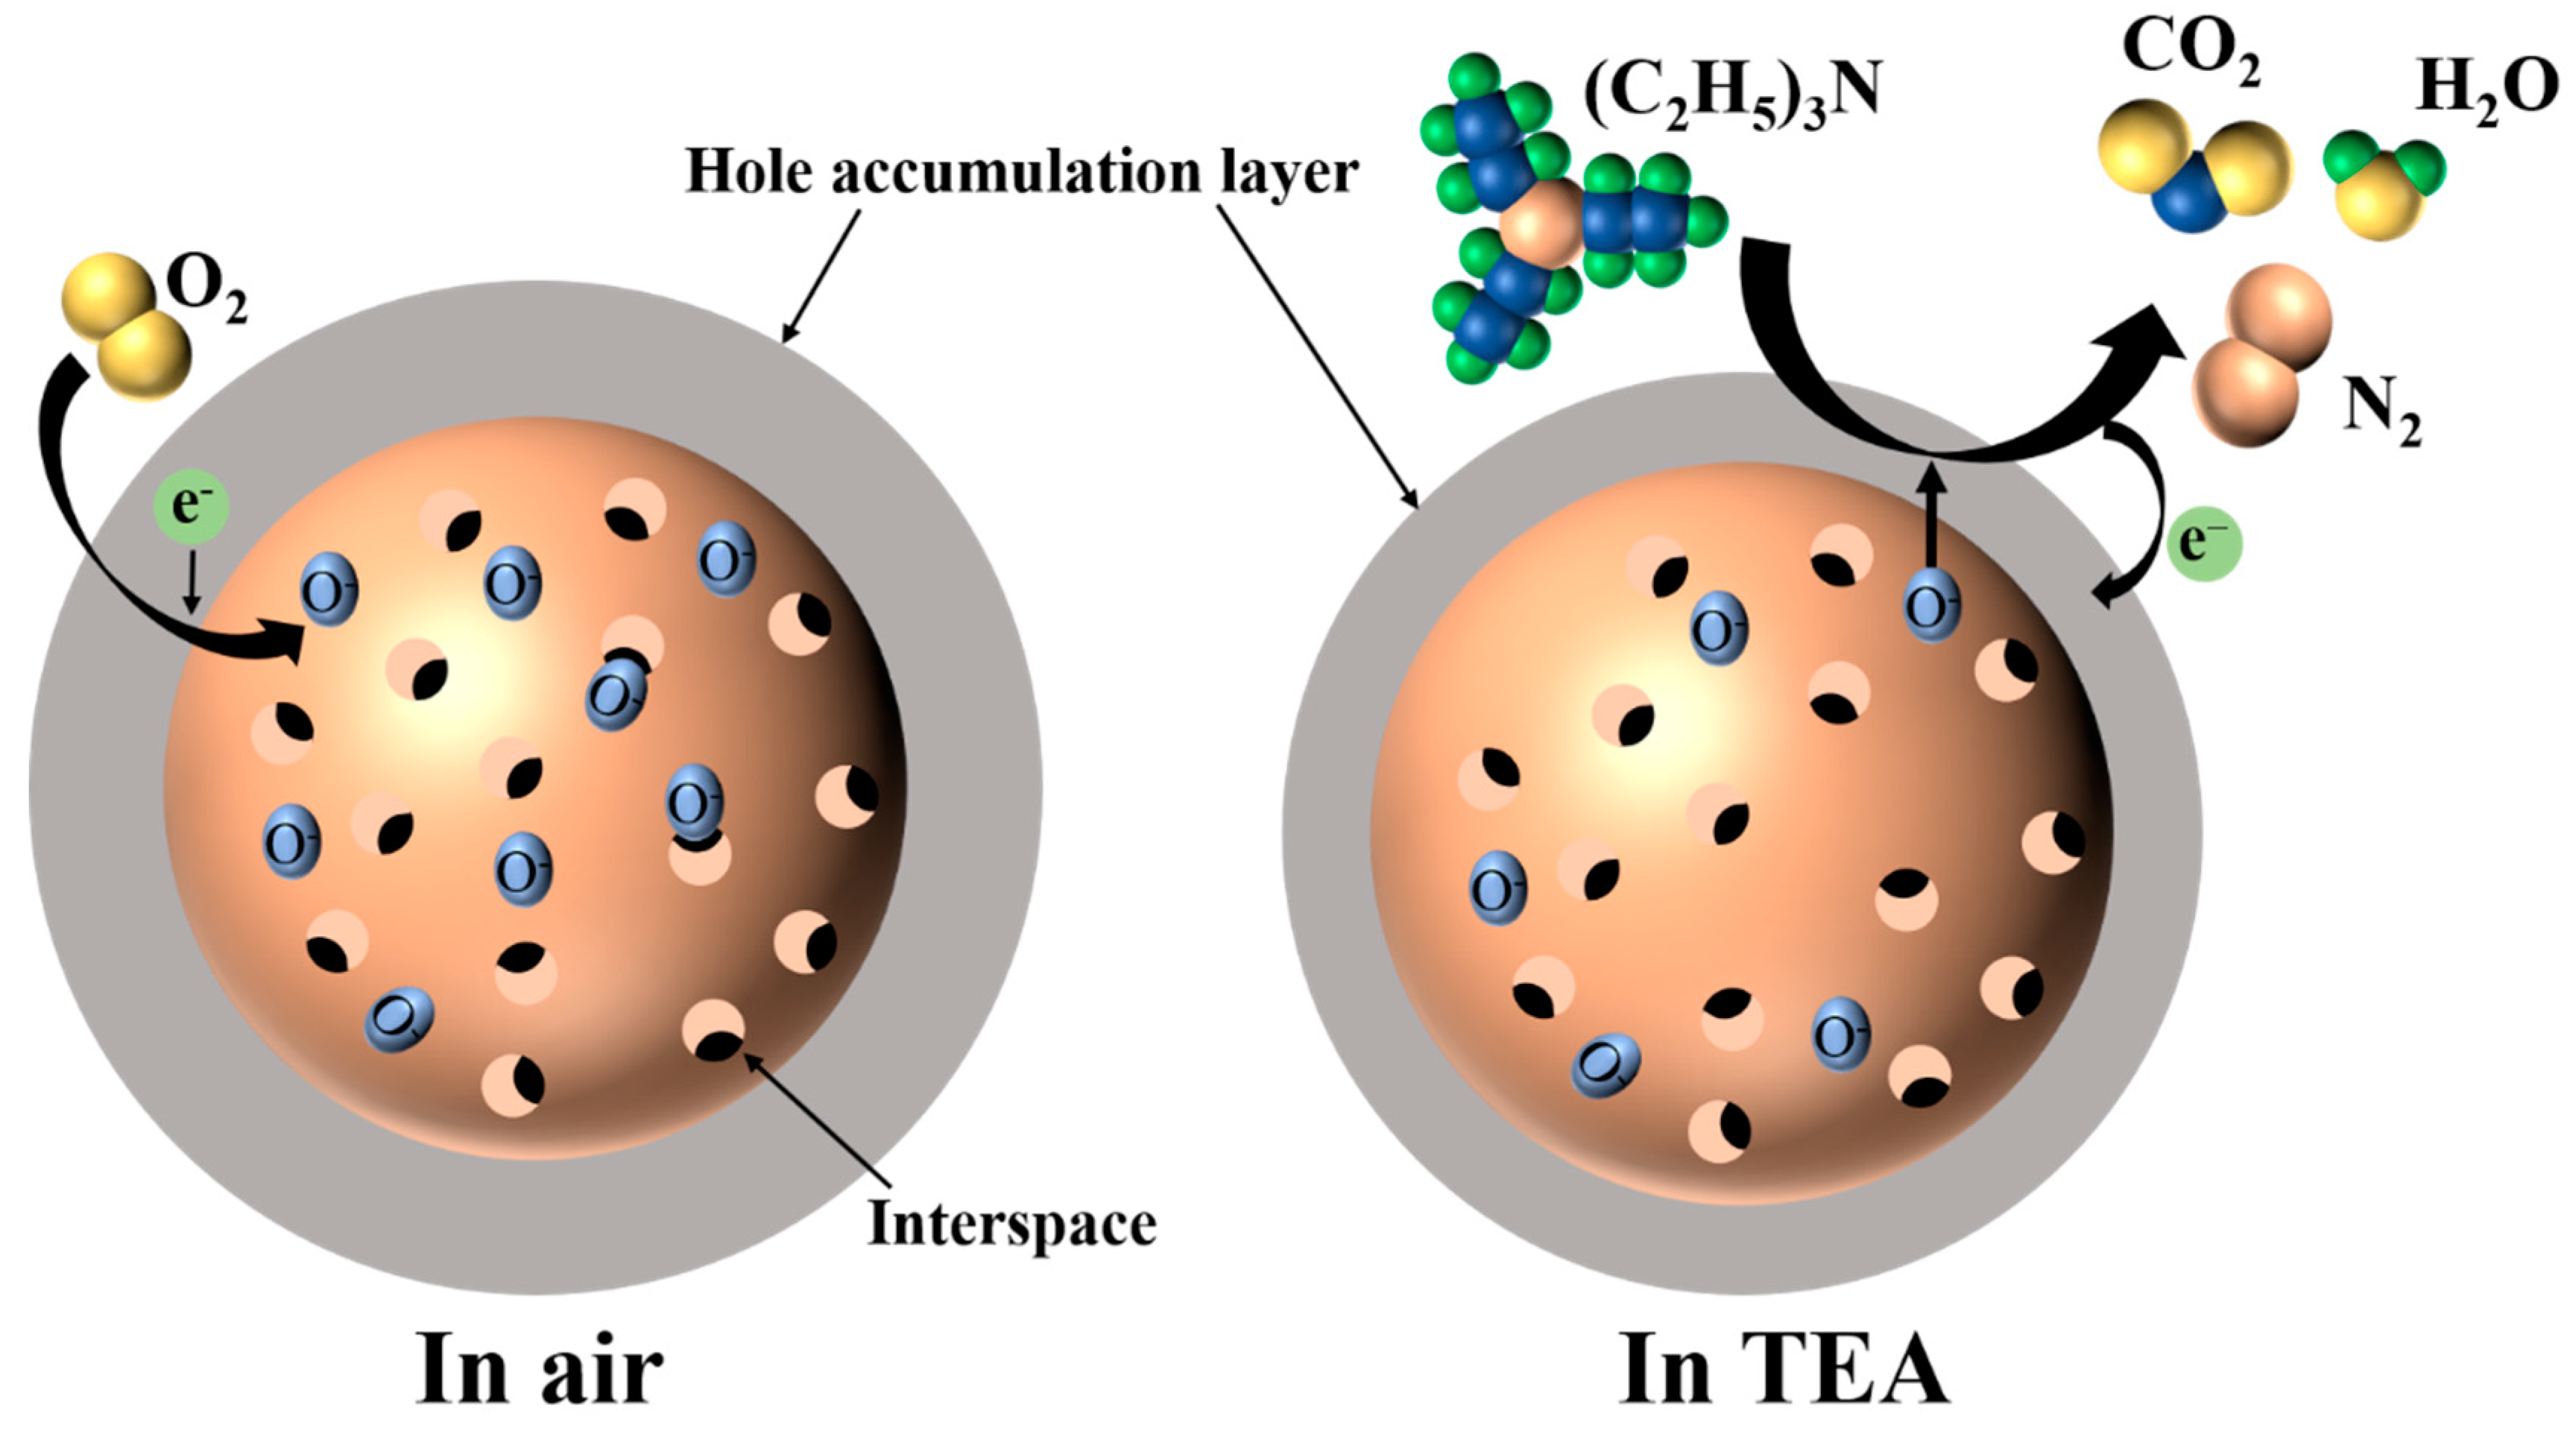
3.3. Gas-Sensitive Mechanism

The gas sensing mechanism of the Ni-doped LaFeO3 gas sensor detecting TEA is depicted in Figure 10. As shown in the figure, when the gas sensing material is placed in air, on the one hand, oxygen molecules in the air will adsorb on the material surface and gain electrons from the material, thereby forming adsorbed oxygen ions; on the other hand, LaFeO3 is a p-type semiconductor material, with the majority of carriers being holes [46]. When oxygen molecules obtain electrons from the material, the concentration of holes in the material increases, leading to an increase in the thickness of the hole accumulation layer and a decrease in the material’s resistance [47]. When the gas sensing material comes into contact with the target gas, the reducing target gas molecules will undergo redox reactions with the adsorbed oxygen ions on the surface of the gas sensing material, causing the electrons to transfer back to the material and undergo charge neutralization with the holes, resulting in a decrease in the thickness of the hole accumulation layer and an increase in the material’s resistance. When the sensor operates at different working temperatures, the adsorbed oxygen formed on the material surface in the air will also form different types of adsorbed oxygen due to the different temperatures. From Equations (2)–(5) and Figure 6a, it can be inferred that the five types of samples all form adsorbed oxygen of a certain type when exposed to air. However, when the material comes into contact with TEA, the TEA molecules will undergo the redox reaction, as shown in Equation (6), with the adsorbed oxygen ions, generating N2, CO2, and H2O [4]. Simultaneously, electrons are released back into the material and undergo charge neutralization with the existing holes, resulting in a reduction in the thickness of the hole accumulation layer and an increase in resistance [48].
O 2 ( g a s ) O 2 ( a d s )
O 2 ( a d s ) + e O 2 ( a d s ) ( T < 100   ° C )
O 2 ( a d s ) + e 2 O ( a d s ) ( 100   ° C < T < 300   ° C )
O ( a d s ) + e O 2 ( a d s ) ( T > 300   ° C )
2 ( C 2 H 5 ) 3 ( gas ) + 39 O ( a d s ) N 2 ( g a s ) + 12 C O 2 ( gas ) + 15 H 2 O ( g a s ) + 39 e
Figure 11 illustrates the variation in resistance during a complete testing cycle for LFO, LFO-Ni1%, LFO-Ni2%, LFO-Ni3%, and LFO-Ni5% when detecting 100 ppm of triethylamine. It can be observed from the graph that the doping of Ni has a significant impact on the material’s resistance. The initial resistances of LFO, LFO-Ni1%, LFO-Ni2%, LFO-Ni3%, and LFO-Ni5% are 306, 15.6, 3.9, 37.4, and 32.44 MΩ, respectively. The initial resistance of samples doped with Ni is much lower than that of pure LaFeO3 samples, with LFO-Ni2% exhibiting the lowest resistance. Combining the analysis above, it can be inferred that the resistance of LFO-Ni2% is significantly lower than that of LFO, indicating that the carrier concentration of LFO-Ni2% is much higher than that of LFO. In other words, the concentration of holes in the hole accumulation layer of LFO-Ni2% is high, and the generation of holes is due to the capture of electrons by oxygen in the air. This implies that LFO-Ni2% adsorbs more adsorbed oxygen ions, which plays a crucial role in enhancing sensor response. When LFO-Ni2% comes into contact with TEA, more thorough oxidation-reduction reactions occur, leading to a more significant change in resistance and, consequently, a higher response.
In summary, the reasons why doping with Ni can improve sensor performance are as follows. On one hand, doping Ni induces structural deformation in the LaFeO3 crystal, thereby altering the physicochemical properties of the crystal surface, leading to a change in the growth direction of nanocrystals and consequently impacting the microstructure [49,50]. As depicted in Figure 2, Ni-doped samples not only exhibit improved integrity and reduced aggregation of microspheres but also feature voids on the surface of the microsphere structure. Additionally, according to the Scherer equation calculations, the crystal size of Ni-doped LaFeO3 samples is smaller than that of pure LaFeO3, resulting in a larger specific surface area for Ni-doped samples, facilitating the adsorption and desorption of the target gas and thereby significantly enhancing the gas sensing performance of the gas sensor [51,52]. On the other hand, as shown in Figure 4, diffraction peaks of LaFeO3 samples exhibit peak shifts, indicating the incorporation of Ni into the interior of the LaFeO3 crystal, where Ni atoms replace some of the elements in LaFeO3, thereby increasing the carrier concentration in the material. Figure 5 demonstrates that the proportion of adsorbed oxygen in Ni-doped samples increases, contributing to the improvement of the material’s gas sensitivity. Furthermore, according to Figure 11, the resistance of Ni-doped samples is significantly lower than that of pure LaFeO3, indicating an increase in carrier concentration, which promotes the reaction between adsorbed oxygen and triethylamine, consequently enhancing its gas sensing performance.

4. Conclusions

According to the requirements of the journal, this study synthesized microsphere-shaped Ni-doped LaFeO3 composite materials using a one-step hydrothermal method. The morphology, crystal structure, and elemental composition of the materials were analyzed using SEM, EDS, XRD, XPS, and other techniques. Based on the gas sensing performance analysis, it was found that LFO-Ni2% exhibited a lower optimum operating temperature and higher response, demonstrating excellent overall gas sensing performance. On one hand, doping Ni induces structural deformation in the LaFeO3 crystal, thereby altering the physicochemical properties of the crystal surface, leading to a change in the growth direction of nanocrystals and consequently impacting the microstructure. On the other hand, the incorporation of Ni into the crystal structure of LaFeO3 increases the concentration of carriers and adsorbed oxygen ions, promoting the reaction between adsorbed oxygen and triethylamine, and thereby enhancing its gas sensing performance.

Author Contributions

Conceptualization, F.M. and Z.Y. (Zhenyu Yuan); methodology, Z.Y. (Zhenhua Yu), R.Z. and H.G.; software, Z.Y. (Zhenhua Yu); validation, F.M. and Z.Y. (Zhenyu Yuan); formal analysis, Z.Y. (Zhenhua Yu), F.M. and R.Z.; investigation, Z.Y. (Zhenhua Yu) and R.Z.; resources, F.M., H.G. and Z.Y. (Zhenyu Yuan); data curation, Z.Y. (Zhenhua Yu) and R.Z.; writing—original draft preparation, Z.Y. (Zhenyu Yuan); visualization, Z.Y. (Zhenhua Yu); supervision F.M., Z.Y. (Zhenyu Yuan) and H.G.; project administration, F.M., Z.Y. (Zhenyu Yuan) and H.G.; funding acquisition, F.M., Z.Y. (Zhenyu Yuan) and H.G. All authors have read and agreed to the published version of the manuscript.

Funding

This work was supported by the National Natural Science Foundation of China (62033002, 62071112); the Fundamental Research Funds for the Central Universities in China (N2201008 and N2304024); the 111 Project (B16009); and the Hebei Natural Science Foundation (F2020501040).

Institutional Review Board Statement

Not applicable.

Informed Consent Statement

Not applicable.

Data Availability Statement

Data are contained within the article.

Conflicts of Interest

The authors declare no conflicts of interest.

References

  1. Sun, D.; Wang, Q.; Wang, W.; Chen, Y.; Ruan, S. Hollow ZnWO4/In2O3 Nanotubes for Ultrasensitive and Rapid Trace Detection of Triethylamine. ACS Appl. Nano Mater. 2023, 6, 10581–10589. [Google Scholar] [CrossRef]
  2. Wang, Y.; Wang, Y.-J.; Chen, S.-S.; Liu, C.-C.; Chen, L.; Liu, Z.-G.; Guo, Z. Chemiresistive Sensor Based on Hollow Fe2O3 Octahedrons Incorporated into Porous In2O3 Nanofibers for Enhanced Sensing Performance and Recognition toward Triethylamine. Sens. Actuators B Chem. 2023, 393, 134129. [Google Scholar] [CrossRef]
  3. Cai, L.-X.; Chen, L.; Sun, X.-Q.; Geng, J.; Liu, C.-C.; Wang, Y.; Guo, Z. Ultra-Sensitive Triethylamine Gas Sensors Based on Polyoxometalate-Assisted Synthesis of ZnWO4/ZnO Hetero-Structured Nanofibers. Sens. Actuators B Chem. 2022, 370, 132422. [Google Scholar] [CrossRef]
  4. Liu, T.; Liu, K.; Chen, X.; Liu, X.; Yin, X.-T. In-Doped ZnO/NiO Nanosheet as Highly Selective Triethylamine Sensor. J. Mater. Res. 2023, 38, 4747–4758. [Google Scholar] [CrossRef]
  5. Miao, G.-Y.; Chen, S.-S.; Wang, Y.-J.; Guo, Z.; Huang, X.-J. SnO2 Nanostructures Exposed with Various Crystal Facets for Temperature-Modulated Sensing of Volatile Organic Compounds. ACS Appl. Nano Mater. 2022, 5, 10636–10644. [Google Scholar] [CrossRef]
  6. Liu, J.; Zhu, B.; Zhang, L.; Fan, J.; Yu, J. 0D/2D CdS/ZnO Composite with n-n Heterojunction for Efficient Detection of Triethylamine. J. Colloid Interface Sci. 2021, 600, 898–909. [Google Scholar] [CrossRef] [PubMed]
  7. Sun, H.; Tang, X. Facile Synthesis of MOF-Derived Hierarchical Flower-Like Sr-Doped Co3O4 Structure for Effective TEA Sensing. IEEE Sens. J. 2022, 22, 23773–23779. [Google Scholar] [CrossRef]
  8. Liu, J.; Zhang, L.; Fan, J.; Yu, J. Semiconductor Gas Sensor for Triethylamine Detection. Small 2022, 18, 2104984. [Google Scholar] [CrossRef]
  9. Ji, H.; Mi, C.; Yuan, Z.; Liu, Y.; Zhu, H.; Meng, F. Multicomponent Gas Detection Method via Dynamic Temperature Modulation Measurements Based on Semiconductor Gas Sensor. IEEE Trans. Ind. Electron. 2023, 70, 6395–6404. [Google Scholar] [CrossRef]
  10. Yang, D.; Gopal, R.A.; Lkhagvaa, T.; Choi, D. Metal-Oxide Gas Sensors for Exhaled-Breath Analysis: A Review. Meas. Sci. Technol. 2021, 32, 102004. [Google Scholar] [CrossRef]
  11. Krishna, K.G.; Parne, S.; Pothukanuri, N.; Kathirvelu, V.; Gandi, S.; Joshi, D. Nanostructured Metal Oxide Semiconductor-Based Gas Sensors: A Comprehensive Review. Sens. Actuators A Phys. 2022, 341, 113578. [Google Scholar] [CrossRef]
  12. Meng, F.; Qi, T.; Zhang, J.; Zhu, H.; Yuan, Z.; Liu, C.; Qin, W.; Ding, M. MoS2-Templated Porous Hollow MoO3 Microspheres for Highly Selective Ammonia Sensing via a Lewis Acid-Base Interaction. IEEE Trans. Ind. Electron. 2022, 69, 960–970. [Google Scholar] [CrossRef]
  13. Sun, Y.; Fan, H.; Zhu, S.; Wang, H.; Dong, W.; Al-Bahrani, M.; Wang, W.; Ma, L. Nitrogen-Doped ZnO Microspheres with a Yolk-Shell Structure for High Sensing Response of Triethylamine. Sens. Actuators B Chem. 2023, 389, 133882. [Google Scholar] [CrossRef]
  14. Meng, F.-J.; Xin, R.-F.; Li, S.-X. Metal Oxide Heterostructures for Improving Gas Sensing Properties: A Review. Materials 2022, 16, 263. [Google Scholar] [CrossRef] [PubMed]
  15. Ou, L.-X.; Liu, M.-Y.; Zhu, L.-Y.; Zhang, D.W.; Lu, H.-L. Recent Progress on Flexible Room-Temperature Gas Sensors Based on Metal Oxide Semiconductor. Nano-Micro Lett. 2022, 14, 206. [Google Scholar] [CrossRef]
  16. Li, F.; Lv, Q.; Gao, L.; Zhong, X.; Zhou, J.; Gao, X. Ultra-Sensitive Ag-LaFeO3 for Selective Detection of Ethanol. J. Mater. Sci. 2021, 56, 15061–15068. [Google Scholar] [CrossRef]
  17. Xu, D.; Zhang, Y.; Deng, Z.; Zi, B.; Zeng, J.; Song, Z.; Lu, Q.; Zhang, J.; Zhao, J.; Liu, Q. Metal-Organic Framework-Derived LaFeO3@SnO2/Ag p–n Heterojunction Nanostructures for Formaldehyde Detection. ACS Appl. Nano Mater. 2022, 5, 14367–14376. [Google Scholar] [CrossRef]
  18. Cao, E.; Zhang, Y.; Sun, L.; Sun, B.; Hao, W.; Zhang, Y.; Nie, Z. WO3-LaFeO3 Nanocomposites for Highly Sensitive Detection of Acetone Vapor at Low Operating Temperatures. Chemosensors 2023, 11, 439. [Google Scholar] [CrossRef]
  19. Jing, Z.-J.; Zhong, Z.-C.; Zhang, C.-M.; Gao, Q.-C. Co-Doped LaFeO3 Gas Sensor for Fast Low-Power Acetone Detection. J. Nanoelectron. Optoelectron. 2022, 17, 775–784. [Google Scholar] [CrossRef]
  20. Hao, P.; Song, P.; Yang, Z.; Wang, Q. Synthesis of Novel RuO2/LaFeO3 Porous Microspheres Its Gas Sensing Performances towards Triethylamine. J. Alloys Compd. 2019, 806, 960–967. [Google Scholar] [CrossRef]
  21. Li, Z.; Lou, C.; Lei, G.; Lu, G.; Pan, H.; Liu, X.; Zhang, J. Regulation of Electronic Properties of ZnO/In2O3 Heterospheres via Atomic Layer Deposition for High Performance NO2 Detection. CrystEngComm 2021, 23, 5060–5069. [Google Scholar] [CrossRef]
  22. Wang, X.; Li, Y.; Jin, X.; Sun, G.; Cao, J.; Wang, Y. The Effects of Co Doping on the Gas Sensing Performance of In2O3 Porous Nanospheres. Sens. Actuators B Chem. 2024, 403, 135155. [Google Scholar] [CrossRef]
  23. Tamilalagan, E.; Muthumariappan, A.; Chen, T.; Chen, S.-M.; Maheshwaran, S.; Huang, P.-J. A Highly Selective Enzyme-Free Amperometric Detection of Glucose Using Perovskite-Type Lanthanum Cobaltite (LaCoO3). J. Electrochem. Soc. 2021, 168, 086501. [Google Scholar] [CrossRef]
  24. Qin, W.; Zhang, R.; Yuan, Z.; Xing, C.; Meng, F. Preparation of P-LaFeO₃/n-Fe2O3 Heterojunction Composites by One-Step Hydrothermal Method and Gas Sensing Properties for Acetone. IEEE Trans. Instrum. Meas. 2022, 71, 1501809. [Google Scholar] [CrossRef]
  25. Qin, W.; Yuan, Z.; Gao, H.; Meng, F. Ethanol Sensors Based on Porous In2O3 Nanosheet-Assembled Micro-Flowers. Sensors 2020, 20, 3353. [Google Scholar] [CrossRef] [PubMed]
  26. Zhao, J.; Yuan, Z.; Ji, H.; Zhang, H.; Meng, F.; Gao, H. Highly Sensitive Ethanol Sensor Based on Two-Dimensional Layered Mesoporous In2O3 Nanosheets. IEEE Trans. Nanotechnol. 2020, 19, 486–491. [Google Scholar] [CrossRef]
  27. Meng, D.; Liu, D.; Wang, G.; Shen, Y.; San, X.; Si, J.; Meng, F. In-Situ Growth of Ordered Pd-Doped ZnO Nanorod Arrays on Ceramic Tube with Enhanced Trimethylamine Sensing Performance. Appl. Surf. Sci. 2019, 463, 348–356. [Google Scholar] [CrossRef]
  28. Meng, D.; Qiao, T.; Wang, G.; Shen, Y.; San, X.; Pan, Y.; Meng, F. NiO-Functionalized In2O3 Flower-like Structures with Enhanced Trimethylamine Gas Sensing Performance. Appl. Surf. Sci. 2022, 577, 151877. [Google Scholar] [CrossRef]
  29. Qin, W.; Yuan, Z.; Shen, Y.; Meng, F. Macroporous Perovskite-Structured LaFeO3 Microspheres and Their Highly Sensitive and Selective Sensing Properties to Alcohols Gas. IEEE Trans. Ind. Electron. 2023, 70, 3188–3198. [Google Scholar] [CrossRef]
  30. Gu, C.; Shanshan, L.; Huang, J.; Shi, C.; Liu, J. Preferential Growth of Long ZnO Nanowires and Its Application in Gas Sensor. Sens. Actuators B Chem. 2013, 177, 453–459. [Google Scholar] [CrossRef]
  31. Li, H.; Yu, K.; Wan, C.; Zhu, J.; Li, X.; Tong, S.; Zhao, Y. Comparison of the Nickel Addition Patterns on the Catalytic Performances of LaCoO3 for Low-Temperature CO Oxidation. Catal. Today 2017, 281, 534–541. [Google Scholar] [CrossRef]
  32. Luo, Y.; Zheng, Y.; Feng, X.; Lin, D.; Qian, Q.; Wang, X.; Zhang, Y.; Chen, Q.; Zhang, X. Controllable P Doping of the LaCoO3 Catalyst for Efficient Propane Oxidation: Optimized Surface Co Distribution and Enhanced Oxygen Vacancies. ACS Appl. Mater. Interfaces 2020, 12, 23789–23799. [Google Scholar] [CrossRef]
  33. Cao, E.; Qin, Y.; Cui, T.; Sun, L.; Hao, W.; Zhang, Y. Influence of Na Doping on the Magnetic Properties of LaFeO3 Powders and Dielectric Properties of LaFeO3 Ceramics Prepared by Citric Sol-Gel Method. Ceram. Int. 2017, 43, 7922–7928. [Google Scholar] [CrossRef]
  34. Peng, Q.; Shan, B.; Wen, Y.; Chen, R. Enhanced Charge Transport of LaFeO3 via Transition Metal (Mn, Co, Cu) Doping for Visible Light Photoelectrochemical Water Oxidation. Int. J. Hydrogen Energy 2015, 40, 15423–15431. [Google Scholar] [CrossRef]
  35. Cao, K.; Cao, E.; Zhang, Y.; Hao, W.; Sun, L.; Peng, H. The Influence of Nonstoichiometry on Electrical Transport and Ethanol Sensing Characteristics for Nanocrystalline LaFeO3-Sensors. Sens. Actuators B Chem. 2016, 230, 592–599. [Google Scholar] [CrossRef]
  36. Liu, L.; Zhang, Y.; Wang, G.; Li, S.; Wang, L.; Han, Y.; Jiang, X.; Wei, A. High Toluene Sensing Properties of NiO-SnO2 Composite Nanofiber Sensors Operating at 330 °C. Sens. Actuators B Chem. 2011, 160, 448–454. [Google Scholar] [CrossRef]
  37. Li, Z.; Li, S.; Song, Z.; Yang, X.; Wang, Z.; Zhang, H.; Guo, L.; Sun, C.; Liu, H.; Shao, J.; et al. Influence of Nickel Doping on Ultrahigh Toluene Sensing Performance of Core-Shell ZnO Microsphere Gas Sensor. Chemosensors 2022, 10, 327. [Google Scholar] [CrossRef]
  38. Zhang, J.; Li, M.; Feng, Z.; Chen, J.; Li, C. UV Raman Spectroscopic Study on TiO2. I. Phase Transformation at the Surface and in the Bulk. J. Phys. Chem. B 2006, 110, 927–935. [Google Scholar] [CrossRef]
  39. Xue, D.; Wang, Y.; Cao, J.; Zhang, Z. Hydrothermal Synthesis of CeO2-SnO2 Nanoflowers for Improving Triethylamine Gas Sensing Property. Nanomaterials 2018, 8, 1025. [Google Scholar] [CrossRef]
  40. Zheng, C.; Zhang, C.; He, L.; Zhang, K.; Zhang, J.; Jin, L.; Asiri, A.M.; Alamry, K.A.; Chu, X. ZnFe2O4/ZnO Nanosheets Assembled Microspheres for High Performance Trimethylamine Gas Sensing. J. Alloys Compd. 2020, 849, 156461. [Google Scholar] [CrossRef]
  41. Zhang, Y.; Liu, N.; Bu, W.; Chuai, X.; Zhou, Z.; Hu, C.; Wang, T.; Sun, P.; Liu, F.; Lu, G. Au Modified Nd-Doped In2O3 Hollow Microspheres for High Performance Triethylamine Gas Sensor. Vacuum 2023, 214, 112240. [Google Scholar] [CrossRef]
  42. Xu, X.; Wang, X.; Liu, W.; Wang, S.; Jiang, H.; Ma, S.; Yuan, F.; Ma, N. Triethylamine Gas Sensors Based on BiOBr Microflowers Decorated with ZnO Nanocrystals. ACS Appl. Nano Mater. 2022, 5, 15837–15846. [Google Scholar] [CrossRef]
  43. Wu, R.; Liu, T.; Chen, X.; Yin, X.-T. Shape-Controlled Multi-Dimensional In2O3/Mn2O3 p-n Heterojunction for Triethylamine Detection. J. Alloys Compd. 2023, 960, 170527. [Google Scholar] [CrossRef]
  44. Wang, X.; Zhou, J.; Wang, Y.; Yi, G.; Sun, G.; Wang, T.; Yang, B.; Zhang, Z. Construction of ZnCo2O4 Decorated ZnO Heterostructure Materials for Sensing Triethylamine with Dramatically Enhanced Performance. New J. Chem. 2023, 47, 22226–22234. [Google Scholar] [CrossRef]
  45. Li, S.; Zhang, Y.; Han, L.; Li, X.; Xu, Y. Hierarchical Kiwifruit-like ZnO/ZnFe2O4 Heterostructure for High-Sensitive Triethylamine Gaseous Sensor. Sens. Actuators B Chem. 2021, 344, 130251. [Google Scholar] [CrossRef]
  46. Qin, W.; Yuan, Z.; Shen, Y.; Zhang, R.; Meng, F. Phosphorus-Doped Porous Perovskite LaFe1−xPxO3−δ Nanosheets with Rich Surface Oxygen Vacancies for ppb Level Acetone Sensing at Low Temperature. Chem. Eng. J. 2022, 431, 134280. [Google Scholar] [CrossRef]
  47. Yuan, Z.; Li, J.; Meng, F. High Response N-Propanol Sensor Based on Co-Modified ZnO Nanorods. J. Alloys Compd. 2022, 910, 164971. [Google Scholar] [CrossRef]
  48. Shuai, Y.; Peng, R.; He, Y.; Liu, X.; Wang, X.; Guo, W. NiO/BiVO4 p-n Heterojunction Microspheres for Conductometric Triethylamine Gas Sensors. Sens. Actuators B Chem. 2023, 384, 133625. [Google Scholar] [CrossRef]
  49. Yao, Y.; Liao, G.; Dong, W.; Cui, H.; Zhao, Z.; Han, X. Ag@ZnO Yolk-Shell Nanospheres for High-Performance Ethanol Sensor. Chem. Phys. Lett. 2022, 791, 139391. [Google Scholar] [CrossRef]
  50. Yin, Y.; Shen, Y.; Zhou, P.; Lu, R.; Li, A.; Zhao, S.; Liu, W.; Wei, D.; Wei, K. Fabrication, Characterization and n-Propanol Sensing Properties of Perovskite-Type ZnSnO3 Nanospheres Based Gas Sensor. Appl. Surf. Sci. 2020, 509, 145335. [Google Scholar] [CrossRef]
  51. Zhao, S.; Shen, Y.; Zhou, P.; Hao, F.; Xu, X.; Gao, S.; Wei, D.; Ao, Y.; Shen, Y. Enhanced NO2 Sensing Performance of ZnO Nanowires Functionalized with Ultra-Fine In2O3 Nanoparticles. Sens. Actuators B Chem. 2020, 308, 127729. [Google Scholar] [CrossRef]
  52. Jia, X.; Liu, T.; Feng, S.; Yu, S.; Zhang, J.; Yang, J.; Wang, S.; Li, Y.; Song, H. Construction of ZnO@ZIF-CoZn Bimetallic Core-Shell Nanospheres for Enhanced Ethanol Sensing Performance. Vacuum 2023, 215, 112271. [Google Scholar] [CrossRef]
Figure 1. Structure diagram of test system and gas sensor.
Chemosensors 12 00065 g001
Figure 2. SEM of (a,b) LFO, (c,d) LFO-Ni1%, (e,f) LFO-Ni2%, (g,h) LFO-Ni3%, and (i,j) LFO-Ni5%.
Chemosensors 12 00065 g002
Figure 3. EDS spectrums of LFO-Ni2% composites.
Chemosensors 12 00065 g003
Figure 4. XRD spectra of LFO, LFO-Ni1%, LFO-Ni2%, LFO-Ni3%, and LFO-Ni5%: (a) full spectrum; (b) magnified spectrum.
Chemosensors 12 00065 g004
Figure 5. This Figure presents the XPS spectra of LFO and LFO-Ni2% for (a) the full scan, (b) La 3d of LFO-Ni2%, (c) Fe 2p, (d) Ni 2p of LFO-Ni2%, and (e,f) O 1s of LFO and LFO-Ni2%.
Chemosensors 12 00065 g005
Figure 6. (a) The optimal operating temperature diagram for 100 ppm of TEA at temperatures ranging from 150 °C to 250 °C for the five samples; (b) selectivity diagrams for six different gases at their respective optimal operating temperatures for each of the five samples.
Chemosensors 12 00065 g006
Figure 7. (a) Concentration gradient curve of LFO in response to 20 ppm to 100 ppm triethylamine at 210 °C; (b) linear fitting curve of concentration gradient response for LFO; (c) concentration gradient curve of LFO-Ni2% in response to 5 ppm to 100 ppm triethylamine at 190 °C; (d) Linear fitting curve of concentration gradient response for LFO-Ni2%.
Chemosensors 12 00065 g007
Figure 8. (a) Reproducibility graph of LFO; (b) reproducibility graph of LFO-Ni2%.
Chemosensors 12 00065 g008
Figure 9. Stability test result curve graph of LFO-Ni2%.
Chemosensors 12 00065 g009
Figure 10. Gas sensing mechanism diagram of Ni-doped LaFeO3 material for TEA.
Chemosensors 12 00065 g010
Figure 11. The resistance change process of LFO (a), LFO-Ni1% (b), LFO-Ni2% (c), LFO-Ni3% (d), and LFO-Ni5% (e) detecting 100 ppm of TEA.
Chemosensors 12 00065 g011
Table 1. Sensing performance of some TEA gas sensors reported.
MaterialsTemperature (°C)Concentration (ppm)ResponseReference
ZnFe2O4/ZnO24010031.5[40]
2wt% Au/Nd-In2O325010061[41]
BiOBr/ZnO20010020.57[42]
In2O3/Mn2O318010044.3[43]
RuO2/LaFeO326010060.4[20]
ZC/ZnO-228010078.684[44]
ZnO/ZnFe2O420010040.15[45]
LFO-Ni2%190100102This work
Disclaimer/Publisher’s Note: The statements, opinions and data contained in all publications are solely those of the individual author(s) and contributor(s) and not of MDPI and/or the editor(s). MDPI and/or the editor(s) disclaim responsibility for any injury to people or property resulting from any ideas, methods, instructions or products referred to in the content.

