Article

Quick Plant Sample Preparation Methods Using a Micro-Homogenizer for the Detection of Multiple Citrus Pathogens

by
Chia-Wei Liu
1,
Sohrab Bodaghi
2,
Georgios Vidalakis
2,* and
Hideaki Tsutsui
1,3,*
1
Department of Mechanical Engineering, University of California, Riverside, CA 92521, USA
2
Department of Microbiology and Plant Pathology, University of California, Riverside, CA 92521, USA
3
Department of Bioengineering, University of California, Riverside, CA 92521, USA
*
Authors to whom correspondence should be addressed.
Chemosensors 2024, 12(6), 105; https://doi.org/10.3390/chemosensors12060105
Submission received: 20 April 2024 / Revised: 22 May 2024 / Accepted: 3 June 2024 / Published: 8 June 2024
(This article belongs to the Section Analytical Methods, Instrumentation and Miniaturization)

Abstract

:
Effective pathogen detection is essential for plant disease control. However, plant sample preparation for downstream assays, such as quantitative polymerase chain reaction (qPCR), is challenging to perform outside of a laboratory. This paper reports two sample preparation methods featuring chemical and mechanical lysis and nucleic acid extraction using a micro-homogenizer, followed by serial dilution or nucleic acid purification with a paper disk before assay. Five minutes of lysis and extraction resulted in DNA and RNA yields of up to 76.5% and 63.3%, respectively, compared to mortar and pestle controls. Crude lysates were unsuitable for direct use in qPCR assays; however, serial dilution or quick wash using chromatography paper rendered samples ready for such assays. Additionally, the nucleic acids stored on paper disks under various storage conditions remained stable for one month. These methods can facilitate the in-field preparation of citrus samples and allow for both onsite and mail-in diagnostics for growers.

Graphical Abstract

1. Introduction

A variety of citrus pathogens (e.g., viruses, viroids, and bacteria) have been reported to severely damage citrus-related industries worldwide and cause billions of economic losses in several countries, including the US, Brazil, and China, where citrus species are considered a mainstay of local agriculture [1,2,3,4]. These pathogens include, but are not limited to, citrus tristeza virus (CTV), citrus psorosis virus (CPsV), citrus leaf blotch virus (CLBV), citrus exocortis viroid (CEVd), citrus bark cracking viroid (CBCVd), hop stunt viroid (HSVd), Spiroplasma citri (S. citri), and ‘Candidatus Liberibacter asiaticus’ (CLas). They are most well known for their high infectivity, adverse effects, and fatality in sensitive species, not only to citrus and its relatives but a wide range of woody and herbaceous hosts, such as cucumber, hop, tomato, almond, peach, grapevine, and others [5,6,7,8,9,10,11,12]. Developing an efficient and sensitive strategy to enable in-field pathogen detection is critically important for disease management. To date, several diagnostic tools have been developed for citrus pathogen identification, including bio-indexing (BI) [13,14], sequencing [15], enzyme-linked immunosorbent assay (ELISA) [16,17,18], dot immunobinding assay (DIBA) [19], direct tissue-blot immunoassay (DTBIA) [20,21], sequential polyacrylamide gel electrophoresis (sPAGE) [22,23], and molecular hybridization [24]. However, the use of these tools is often limited by their cost, time-consuming sample preparation processes, seasonal fluctuations in pathogen titers, and uneven distribution of pathogens in some hosts, making them impractical for efficient and timely use in the field [7,24].
More recently, singleplex and multiplex reverse transcription–quantitative polymerase chain reaction (RT–qPCR) and qPCR have drawn more attention and have been extensively utilized in detecting citrus pathogens due to their convenience and elevated levels of sensitivity and specificity [6,7,18,25,26,27]. They both allow for the simultaneous detection of several pathogens in a single well and give more reliable and reproducible results through quantification compared to conventional PCR and other approaches [26,27]. Although qPCR-based techniques are sensitive, they are still some critical steps away from being practically applied in the field. Sample preparation is one of the most challenging parts because it requires multiple procedures to extract high-quality nucleic acids from plant tissues [27,28]. Thus, the lack of appropriate sample preparation makes RT–qPCR/qPCR strategies unsuited for in-field diagnosis.
Typically, the extraction of nucleic acids from plant samples requires a mechanical process to break the cell walls with the help of chemical lysis buffers, followed by chemical extraction and purification of the targeted nucleic acids [29,30]. Although such methods provide high-yield and good-quality nucleic acids, they are time-consuming, laborious, and require hazardous chemicals and benchtop equipment (e.g., refrigerated microcentrifuge) [31]. High-throughput commercial instruments such as the SPEX SamplePrep GenoGrinder and MagMAX Express-96 Magnetic Particle Processor (a predecessor to the Pharma KingFisher Flex 96 Deep-Well Magnetic Particle Processor) offer semi-automated and large-scale sample processing in the laboratory. Still, their cost, size, and power requirements are unsuitable for in-field use [32]. To date, several commercial products and lab studies for sample preparation (e.g., Qiagen DNeasy/RNeasy plant mini kits, Whatman FTA cards, and microneedle patches) [33,34,35,36,37,38,39,40,41] have attempted to address this key bottleneck (Table S1). However, they are usually expensive and sometimes require additional equipment to use together. The resulting lysates or fresh nucleic acid extracts are hard to preserve for additional purposes (e.g., distant shipping or long and consecutive testing) without a cold chain, which limits their applications for in-field assays. Recently, several studies have successfully used paper disks to extract nucleic acids from plants quickly without specialized instruments [42,43,44]. However, manual grinding used in these reports is prone to person-to-person variability and potential human errors.
In this study, we developed two simplified protocols as potential alternatives to the benchtop protocol (Figure 1a) for preparing assay-ready nucleic acids from citrus samples in a portable manner. Specifically, an OmniLyse micro-homogenizer was used to lyse the petioles and midveins of citrus to produce a crude lysate, followed by one of two strategies, serial dilution and paper-disk-assisted extraction, to enable downstream use in qPCR-based assays (Figure 1b). To the best of our knowledge, the OmniLyse micro-homogenizer has not been used for the quick lysis of plant tissues, except for one report in 2023 [45]. Thus, this current study expands the application of the device successfully to plant tissues that are mechanically robust and difficult to lyse. Additionally, the protocol also contains quick nucleic acid extraction using paper disks, where specific parameters, such as soaking time, eluting time, and the addition of salt were thoroughly investigated in this study.

2. Materials and Methods

2.1. Reagents and Buffers

Guanidine lysis buffer, Tris HCl-based buffer, and nuclease-free water (Milli-Q Biopak Polisher, Sigma-Aldrich, St. Louis, MO, USA) were used for nucleic acid extraction from citrus tissues. The guanidine lysis buffer was composed of 4 M guanidine isothiocyanate (GITC) (Sigma-Aldrich, St. Louis, MO, USA), 0.2 M sodium acetate trihydrate (pH 5.0) (Thermo Fisher Scientific, Waltham, MA, USA), 2 mM ethylenediaminetetraacetic acid (EDTA, Thermo Fisher Scientific, Waltham, MA, USA), and 2.5% polyvinylpyrrolidone (PVP, Sigma-Aldrich, St. Louis, MO, USA), with a final pH of 5.0 [6]. The Tris HCl-based buffer was prepared with 50 mM Tris(hydroxymethyl)aminomethane hydrochloride (Tris-HCl, Sigma-Aldrich, St. Louis, MO, USA) (pH 8.0), 150 mM sodium chloride (NaCl, Thermo Fisher Scientific, Waltham, MA, USA), 2% PVP, and 1% Tween-20 (Thermo Fisher Scientific, Waltham, MA, USA) [42]. Untreated, cellulose-based paper disks (d = 0.25 in) used in this study were cut out from Whatman Grade 1 CHR cellulose chromatography papers (Cat. No. 3001-861, Sigma-Aldrich, St. Louis, MO, USA) using a hole puncher. AgPath-ID One-Step RT-PCR kit (Life Technologies, Carlsbad, CA, USA) and QuantiFast Multiplex RT-PCR kit (Qiagen, Valencia, CA, USA) were used for singleplex and multiplex RT–qPCR reactions (12 μL), respectively, whereas iTaq Universal Probes One-Step kit (Bio-Rad, Hercules, CA, USA) was used for singleplex qPCR reactions.

2.2. Pathogens and Plant Materials

Healthy citrus varieties, including Citrus excelsa, Mexican lime (Citrus aurantifolia Christm. Swingle), sweet orange (Citrus sinensis), Pineapple sweet orange (Citrus sinensis L. Osbeck), Rusk citrange (X Citroncirus spp.), rough lemon (Citrus jambhiri Lush. Rutaceae), sour orange (Citrus aurantium L.), and citron (Citrus medica L.) were used for evaluating the developed protocols. Citrus plants, including the ones graft-inoculated singly or with various combinations of citrus pathogen types (i.e., virus, viroid, and bacterium), were provided by the Citrus Clonal Protection Program (CCPP) disease bank at the University of California, Riverside (Table 1).

2.3. Primers and Probes

Primers and probes used in the study for singleplex qPCR/RT–qPCR and multiplex RT–qPCR assays were adapted from previous reports, with the quality and homology of the primers validated [6,7,48]. The sequences of the primers, the probes, and the corresponding nucleotide positions of the pathogens (i.e., CLBV, CPsV, CTV, CEVd, HSVd, CBCVd, and S. citri) are available in Table S2. Primers and probes targeting the cytochrome oxidase (COX) gene in the citrus genome are routinely used as a reliable positive internal control for the assessment of nucleic acid integrity. The corresponding primer and probe sequences are listed in Table S2 [6,7]. Measuring the integrity of the COX gene, a housekeeping gene, in the samples informs COX degradation levels, representing variations between populations subject to different treatments [7,49].

2.4. Citrus Tissue Processing

2.4.1. High-Throughput Benchtop Protocol for Lysis of Positive and Negative Controls

All positive controls (PC) and negative controls (NC) used in this study were prepared by following the high-throughput protocol previously developed by Dang et al. for plant tissue pulverization [32]. Phloem-rich bark tissues peeled off from fresh infected/healthy stems were chopped into small fragments with a clean razor blade. Chopped tissues were aliquoted to 250 mg each in 2 mL centrifuge tubes and stored at −80 °C for at least 2 h. The tissues were then freeze-dried for 24 h in a FreeZone Triad Cascade Benchtop Freeze Dryer (Labconco, Kansas City, MO, USA). Each tube from the freeze dryer received a small stainless-steel ball (5/32 inch) and was immediately transferred to a −80 °C freezer until further processing. Tubes with freeze-dried tissues were placed on a metal rack in a SPEX SamplePrep Cryo-Station (SPEX SamplePrep, Metuchen, NJ, USA), a specialized apparatus that holds liquid nitrogen inside and provides a freezing environment. Using a SPEX SamplePrep GenoGrinder 2010 (SPEX SamplePrep, Metuchen, NJ, USA), the tubes were shaken twice at 1680 rpm for 20 s each, allowing the stainless-steel ball to pulverize the freeze-dried bark tissue. The ground tissue was then lysed by mixing with the guanidine lysis buffer (4 M, 750 µL) and incubating for 15 min at 4 °C, followed by another 20 s grinding (1680 rpm) using the GenoGrinder 2010. The mixture was centrifuged at 17,200× g at 4 °C for 25 min. The supernatant (150 μL) was collected for subsequent nucleic acid extraction.

2.4.2. Semi-Automated Protocol for Lysis of Test Samples

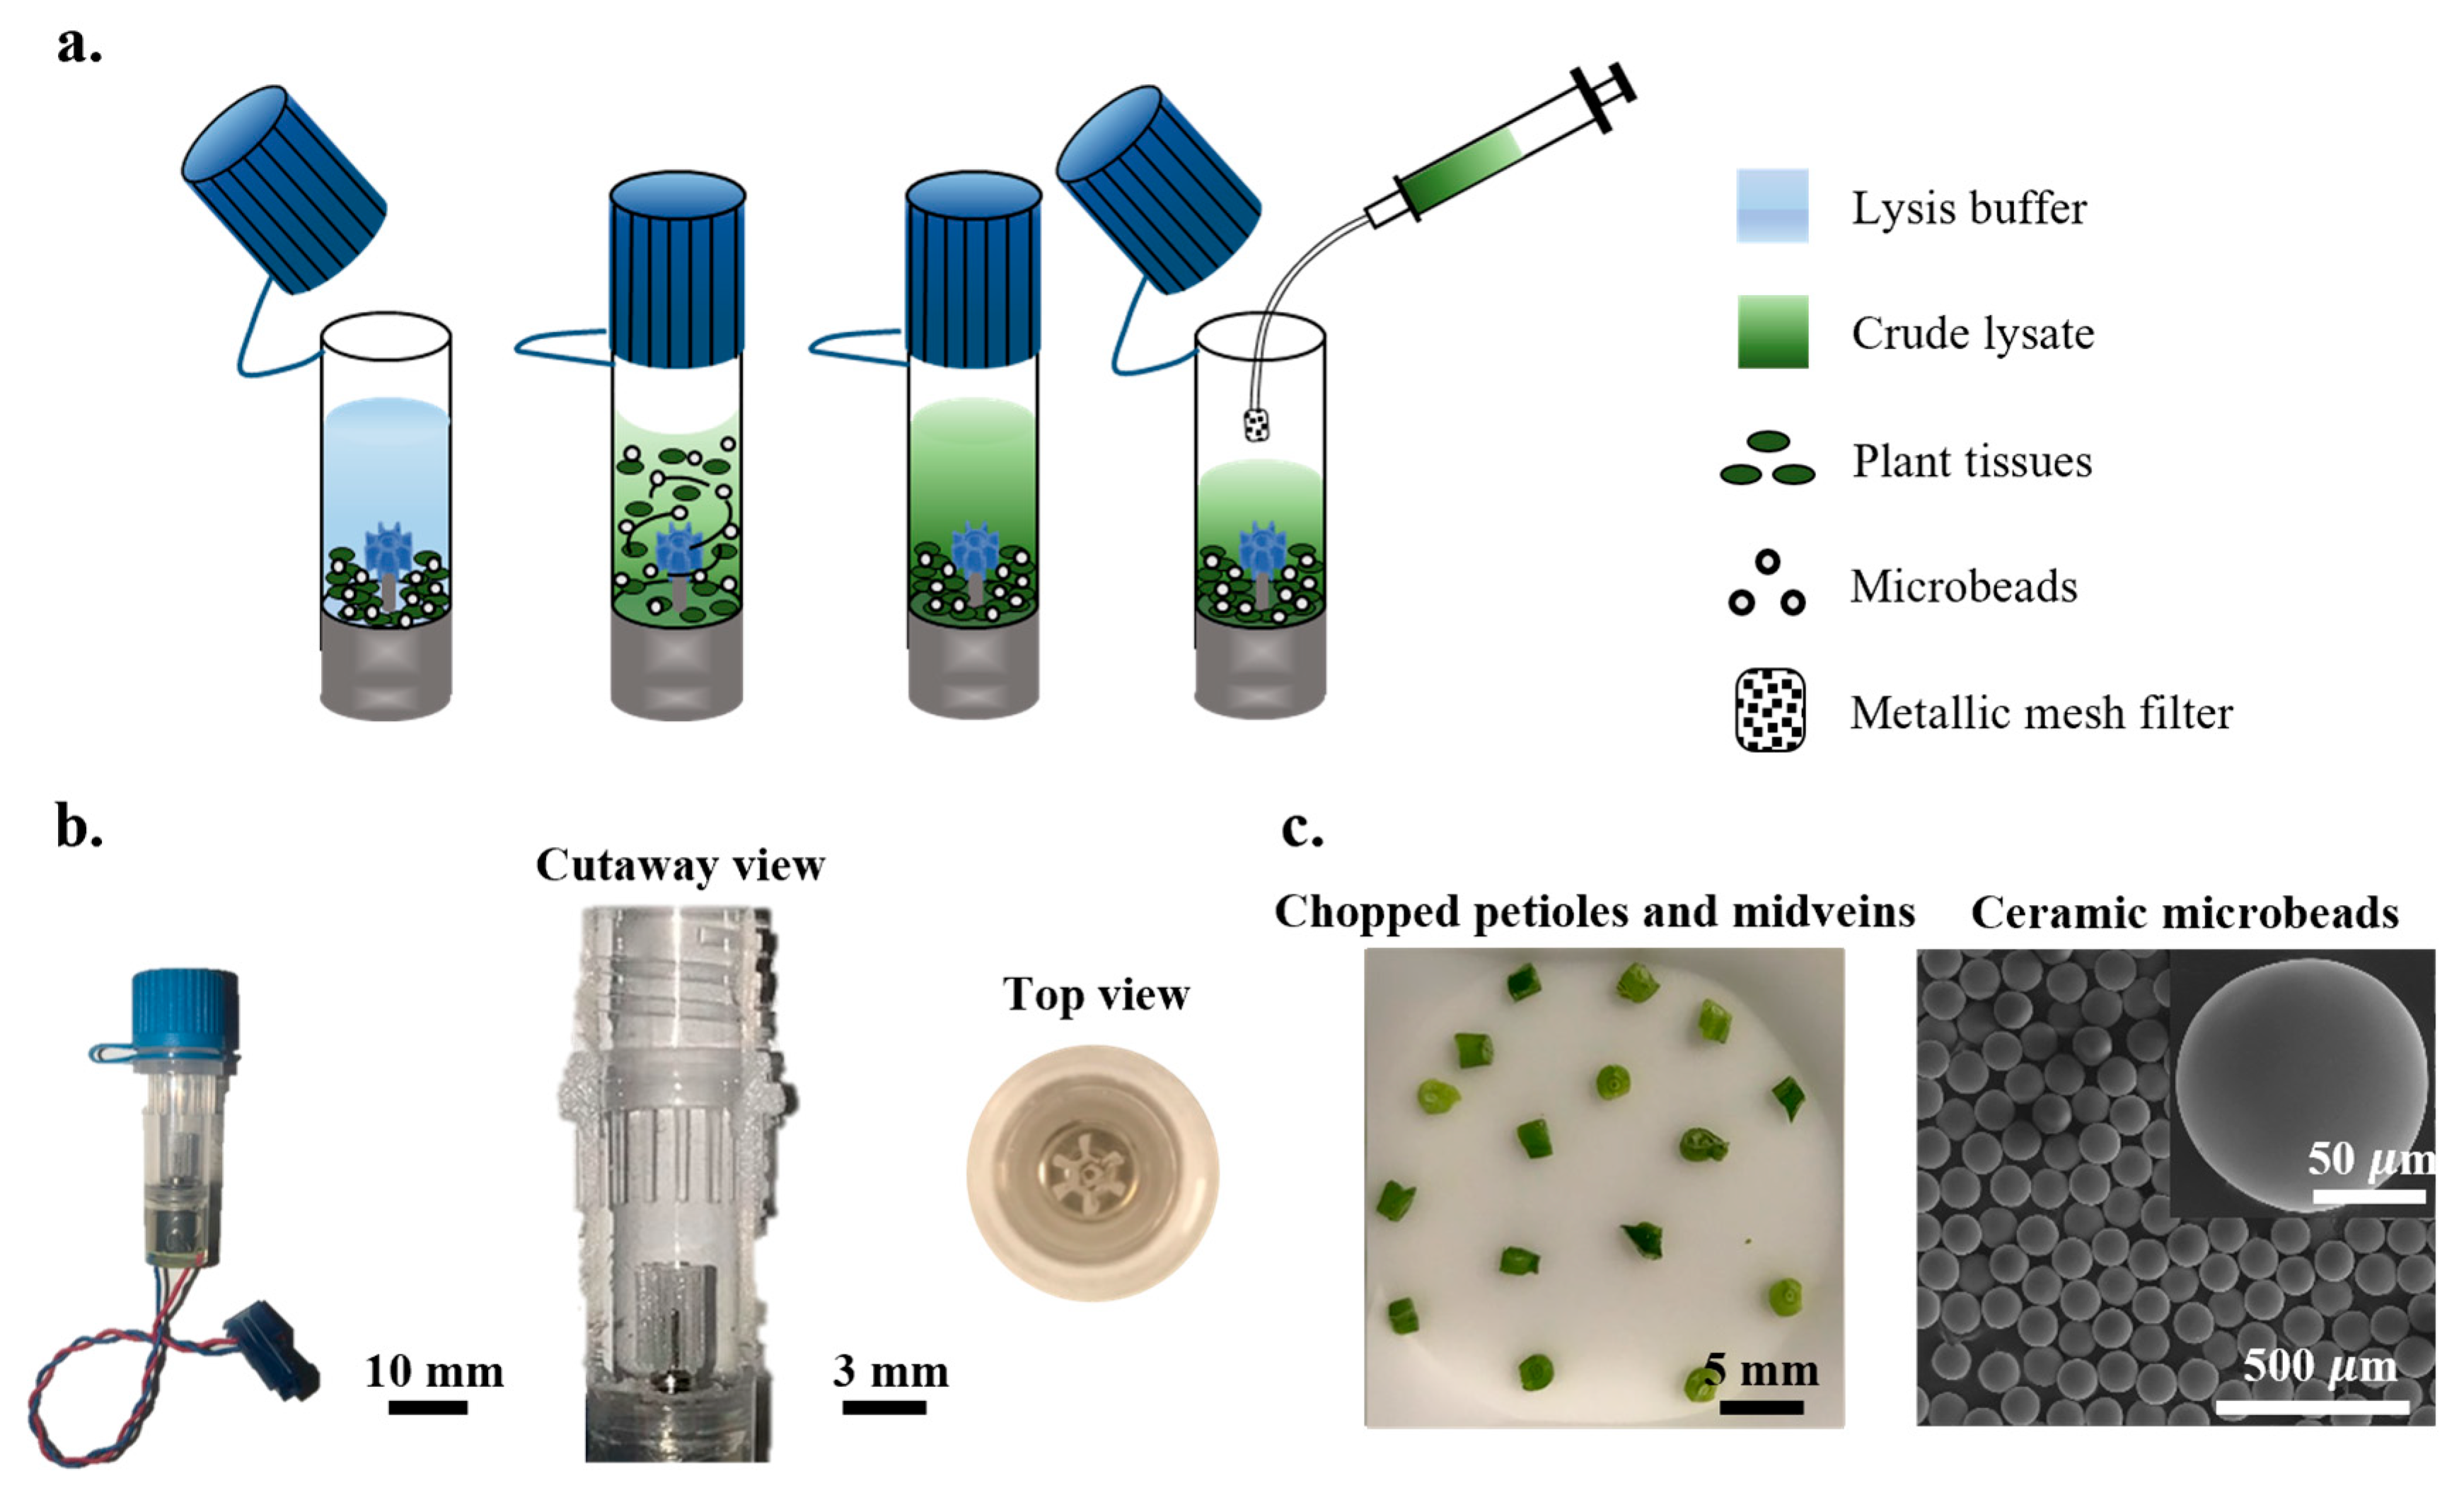
OmniLyse X-mini Cell and Tissue Lysis Devices (Item# 01.532.48, Claremont BioSolutions, Upland, CA, USA) were used throughout this study and are referred to as OmniLyse micro-homogenizers (Figure 2). OmniLyse micro-homogenizers feature a small motor-driven, gear-shaped impeller in a plastic tube, allowing for quick mixing and homogenization of small samples (Figure 2b). The kit comes with a pack of ceramic microbeads (Figure 2c) for enhanced homogenization and a set of syringe tips with a mesh filter for transferring the resulting fluid while filtering the microbeads and large sample debris (Figure 2a).
Crude lysates were prepared from phloem-rich petioles and midveins from the fresh foliage of diseased and healthy trees in the CCPP greenhouses. All branches were randomly sampled to avoid collection bias and gently wiped with wet paper napkins to remove dust from the leaves prior to collection. The petioles and midveins (100 mg) were chopped into small fragments (approximately 2 mm × 2 mm) with a clean razor blade to fit inside the micro-homogenizer comfortably (Figure S1). The chopped tissues (100 mg) and a fixed amount of microbeads (tissue/bead ratio (w/w) = 1:0, 1:1, 1:3, and 1:5) were mixed with the guanidine lysis buffer (4 M, 300 μL) in the micro-homogenizer. The micro-homogenizer was operated for 5 min with fixed DC driving voltages (6, 9, 11, and 12 V). The supernatant (150 μL) was drawn out using the filtered syringe tip and collected in a centrifuge tube for subsequent processing.

2.4.3. Manual Extraction Protocol for Preparation of Test Samples

Crude lysates were also prepared by manually grinding petioles and midveins using a mortar and pestle. Manual grinding served as an essential benchmark to compare against the semi-automated protocol and is referred to as a grinding control (GC) in this study. Briefly, petioles and midveins acquired from fresh foliage were finely ground in liquid nitrogen using a mortar and pestle. The resulting tissue powder (100 mg) was transferred to a centrifuge tube and then lysed with the guanidine lysis buffer (4 M, 300 µL) for 5 min with mild vortexing. The tube was centrifuged at 12,000× g at 4 °C for 30 min (Allegra X-22R Centrifuge, Beckman Coulter, Indianapolis, IN, USA). The supernatant (150 μL) was collected in a clean centrifuge tube for subsequent nucleic acid extraction.

2.5. High-Throughput Protocol for Extraction of Nucleic Acids from Lysates

As previously reported by Dang et al. [32], total RNAs in crude lysates were isolated by using a MagMAX-96 Viral RNA isolation kit (Cat. No. AM1836) with MagMAX Express-96 Magnetic Particle Processor (both from Life Technologies, Carlsbad, CA, USA). Each reaction contained 150 μL of supernatant (crude lysate), 22 μL of RNA binding bead mix (10 μL lysis/binding enhancer + 10 μL RNA binding beads + 2 μL carrier RNA), 139 μL of lysis/binding solution as recommended by the manufacturer, and an extra 139 μL of 100% isopropanol. Samples were subjected to two sequential washes with 500 μL of wash solution 1, followed by another two with 500 μL of wash solution 2. The resulting nucleic acids were eluted in 100 μL of nuclease-free water. The purity of the nucleic acids was assessed by measuring the spectrophotometric absorbances at 260 nm (A260) and 280 nm (A280) using a NanoDrop 2000c spectrophotometer (Thermo Fisher Scientific, Waltham, MA, USA). The absorbance ratio (A260/A280) of 2.0 indicates pure extracts, while a low number would be considered contaminated due to proteins [32,50]. Nucleic acid concentrations (ng/μL) were determined using a Qubit 2.0 fluorometer (Life Technologies, Carlsbad, CA, USA). These extracts were aliquoted and stored at −80 °C for later use.

2.6. Quick Sample Preparation Protocols for qPCR/RT–qPCR Assays

2.6.1. Serial Dilution Method

Sweet orange (Citrus sinensis L.) infected with CTV was used as the source of crude lysates for this test. Fresh petioles and midveins (100 mg) from the tree were processed using the OmniLyse micro-homogenizer with 300 µL lysis buffer (guanidine-based buffer, Tris HCl-based buffer, or nuclease-free water) by following the optimized conditions in Section 2.4.2. The resulting crude lysates were then subjected to ten-, one-hundred-, or one-thousand-fold serial dilutions (10–1000×) with nuclease-free water and tested for the target RNA (CTV) and the internal control (COX) by RT–qPCR.
A series of statistical analyses were performed with a two-tailed Student’s t-test. Variabilities within the technical replicates (N = 3) in a trial (intra-assay) and those across three trials (inter-assay) were determined through the coefficient of variation (CV), which is defined as follows: standard deviations of the replicates divided by the mean of the replicates × 100%. Small intra-assay CV (<5%) and inter-assay CV (<10%) indicate repeatable results and reliable processes [51,52]. Furthermore, the number of cycles required for the fluorescent signal to cross the threshold (or so-called quantification cycle, Cq) was measured. True positive rates, defined as true positives/(true positives + false negatives) × 100%, were calculated for the dilutions (10–1000×).

2.6.2. Paper Disk Method

In this method, five pieces of paper disks (d = 0.25 in) were soaked in a 250 µL crude lysate from the OmniLyse micro-homogenizer for quick nucleic acid capture. After soaking, disks were transferred using sterilized tweezers to a clean centrifuge tube filled with 1 mL of 10 mM Tris buffer (pH 8) to undergo one step of washing with mild vortex for 1 min [53]. Washed disks were transferred to a clean, open-lid centrifuge tube for air drying. These dried paper disks were then ready for either elution in 100 µL of elution buffers (i.e., nuclease-free water, Tris-EDTA buffer w/ and w/o 0.1 M NaCl) immediately for qPCR/RT–qPCR assays or storage for later uses.
The feasibility and reliability of this method were estimated through intra- and inter-assay CVs calculated from paper disk assays where the crude lysates were harvested from various sources, including diseased (single and multiple infections) and healthy trees. In addition, true positive rates and Cq values of target pathogens and COX from the paper disks subjected to different storage conditions (temperature and duration) were measured.

2.7. Singleplex and Multiplex qPCR/RT–qPCR Assays

As reported previously [6,7,48], primers and probes used in this study were designed to target conserved regions of these pathogenic genomes through genome sequence alignments and thorough investigation of the primers’ specificities and sensitivities to the corresponding pathogens in qPCR/RT–qPCR assays. All the assays were conducted using an Applied Biosystems QuantStudio 12K Flex Real-Time PCR System (Thermo Fisher Scientific, Waltham, MA, USA) with reagents and protocols tailored to each pathogen (Table S3). Primer/probe mixtures were all prepared with final concentrations of 417 nM primers and 83 nM probes [52]. Real-time fluorescent signals were recorded during the amplification, and the resulting Cq values were automatically determined based on the corresponding threshold levels in the assays.

3. Results and Discussion

3.1. Characterization of OmniLyse Micro-Homogenizer

3.1.1. Quality and Quantity of Extracts

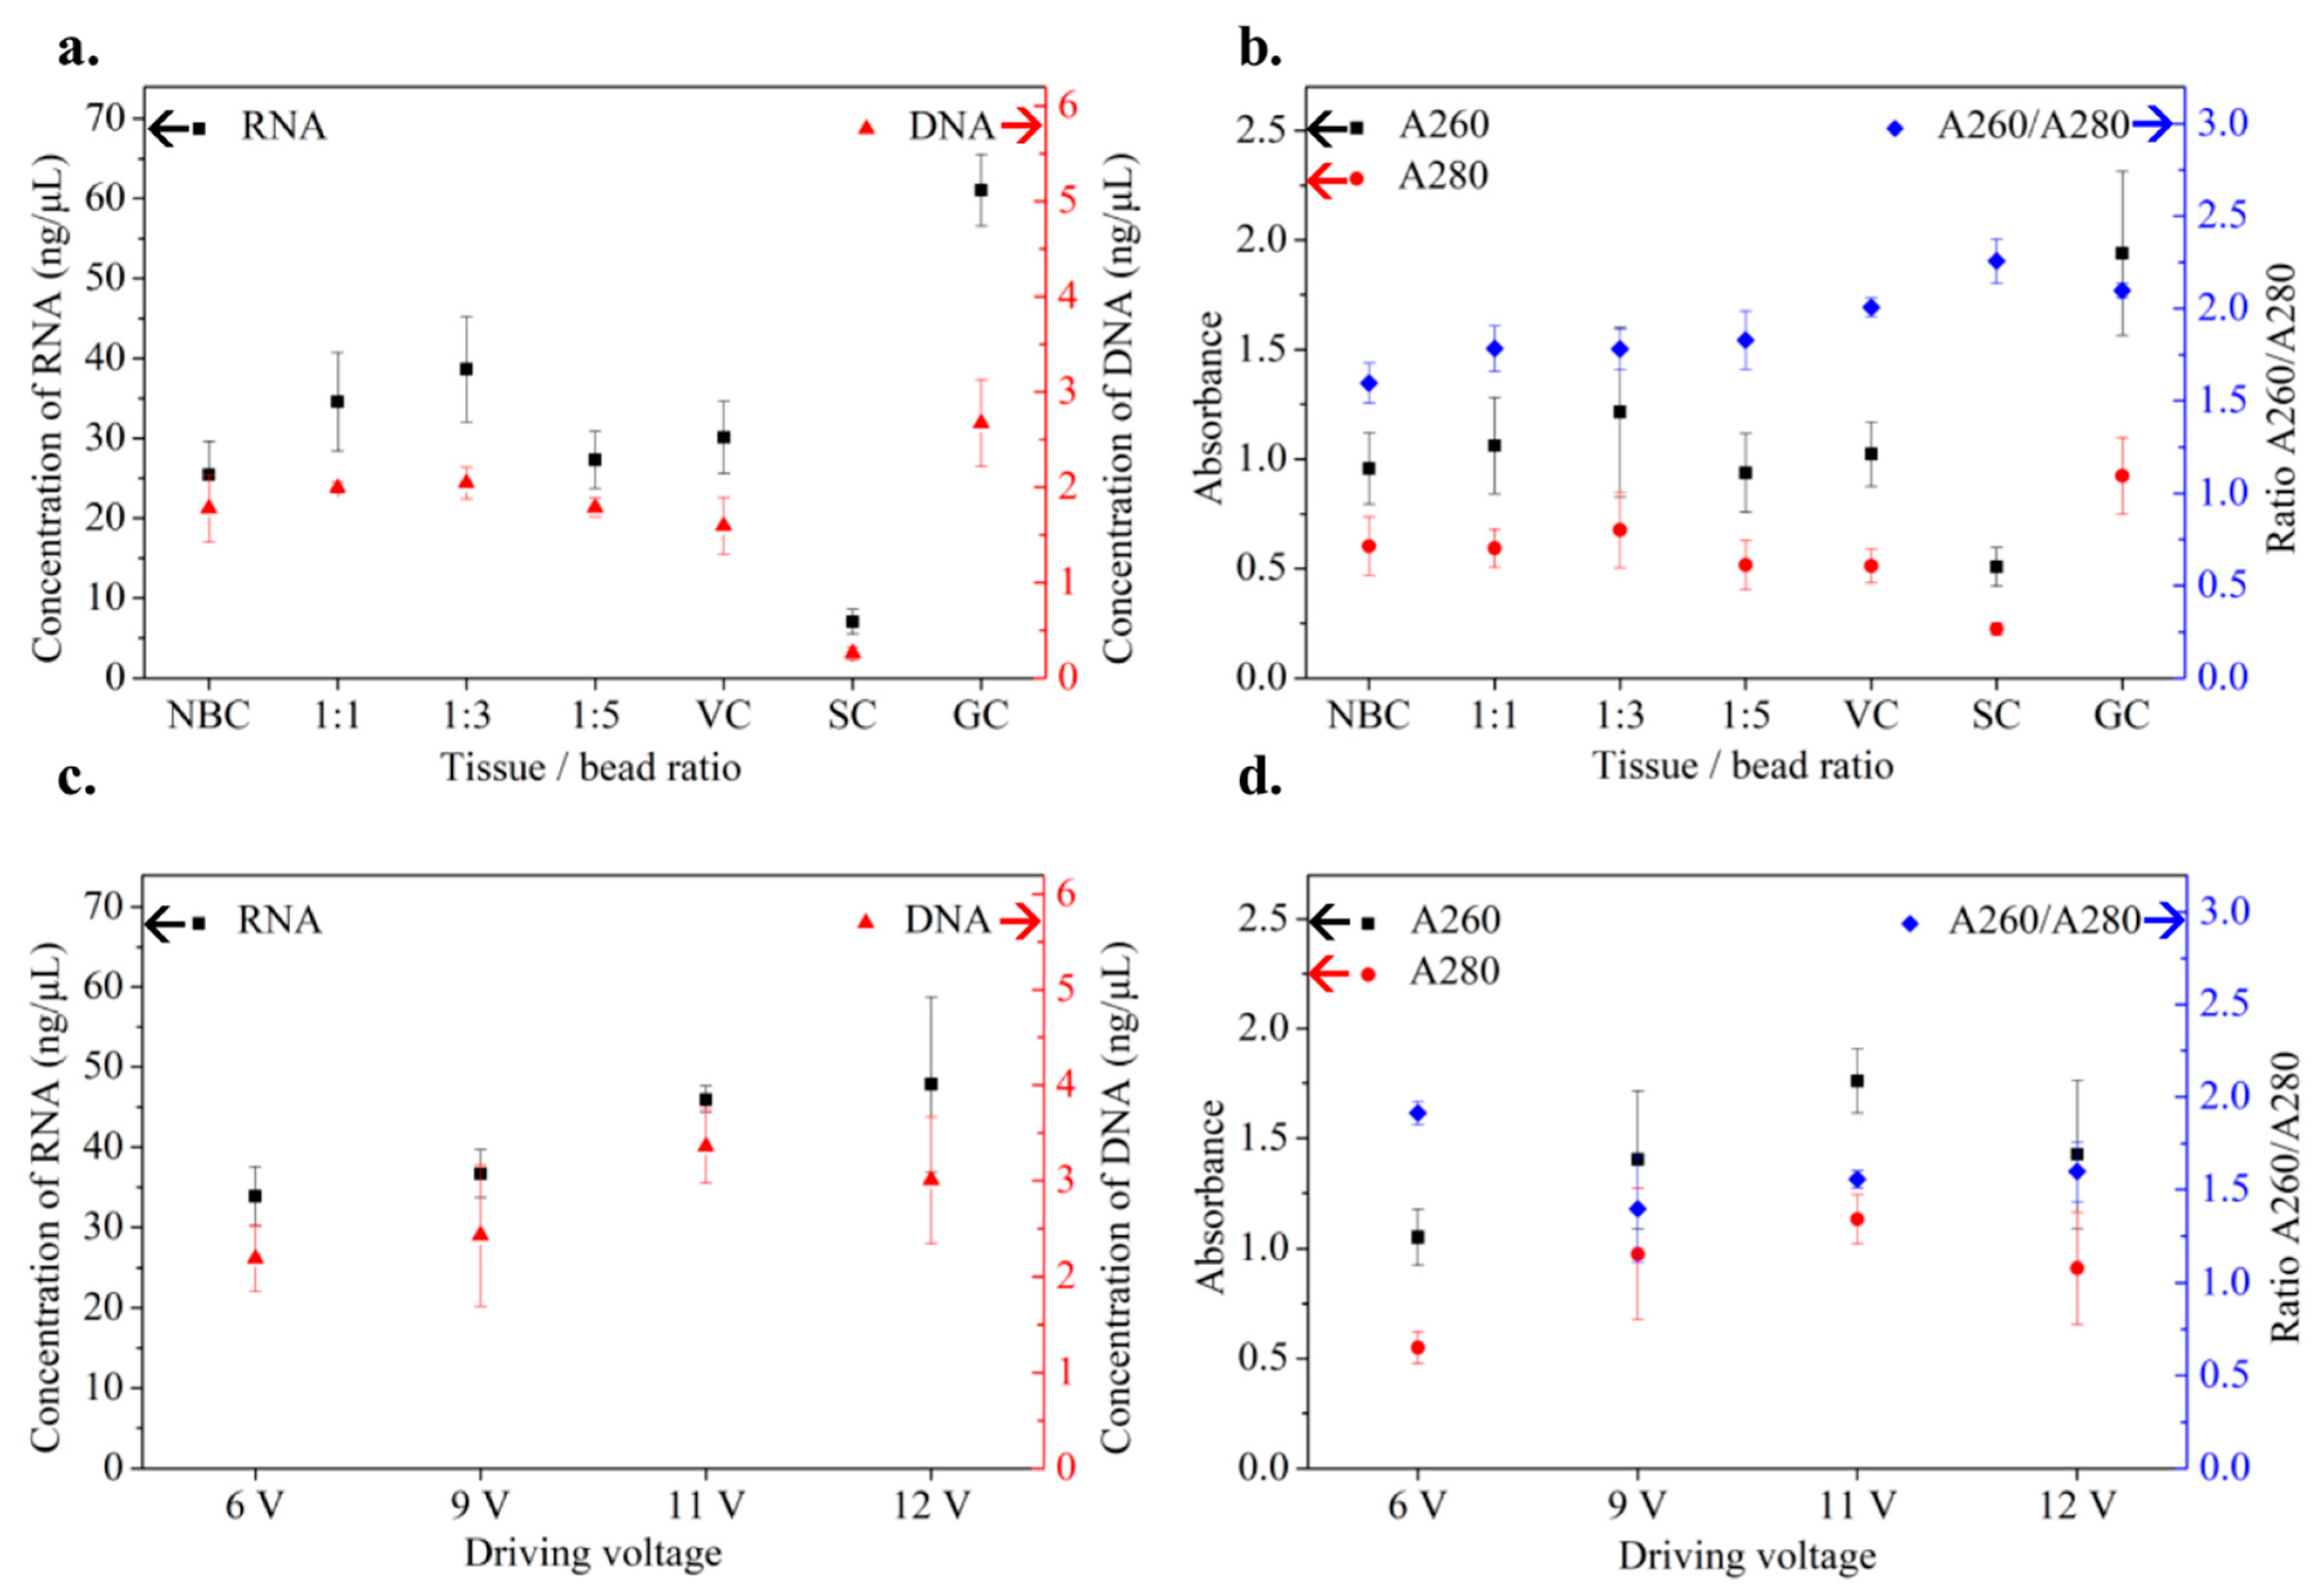
To maximize the efficiency of the OmniLyse micro-homogenizer for lysing petioles and midveins, a series of tissue/bead ratios and driving voltages were tested (N = 3). In our first test, the amount of ceramic microbeads was varied while the driving voltage was kept at 6 V. The resultant crude lysates underwent high-throughput nucleic acid extraction using MagMAX Magnetic Particle Processor. The qualities of the extracts were then assessed in two ways: nucleic acid concentrations using a Qubit fluorometer and A260/A280 levels using a NanoDrop spectrophotometer for the estimation of nucleic acid purity and integrity. Controls included conditions where the OmniLyse impeller remained off, or the microbeads were not added. Among the tissue:bead ratios tested, 1:3 yielded the highest concentration (38.7 ± 6.6 ng/μL of extracted RNA while A260/A280 levels were similar (1.78 ± 0.11–1.83 ± 0.16) across different test conditions (Figure 3a,b)). The former is equivalent to 193.5 ± 33 ng of RNA per 100 mg of plant material. As shown in Figure 3a, the resulting DNA and RNA with a tissue:bead ratio of 1:3 reached 76.5% and 63.3% of those obtained from the mortar-and-pestle grinding control (GC), respectively. The A260/A280 ratio of the sample was 1.78 compared to 2.10 of the GC (Figure 3b). Other notable results included lower RNA yield in the no-bead control (NBC) and even lower yields in the static control (SC) in Figure 3a. These results demonstrated the critical importance of both microbeads and fluid mixing.
In the second test, the driving voltage of the micro-homogenizer varied between 6 V and 12 V to find its optimal setting. A tissue:bead ratio of 1:3 was kept from the previous test. As shown in Figure 3c, samples lysed with driving voltages of 11 V and 12 V had higher yields than those of lower driving voltages. However, 12 V occasionally caused unexpected motor shutdown and was determined to be inappropriate for further testing. The 11 V sample resulted in a relatively high A260 value (nucleic acids) compared to that of the rest of the samples, although the purity was not the highest due to a high A280 value (proteins) (Figure 3d). Consequently, the combination of a tissue/bead ratio of 1:3 and a driving voltage of 11 V was considered optimal and used throughout the rest of this study.

3.1.2. Verification with RT–qPCR Assays

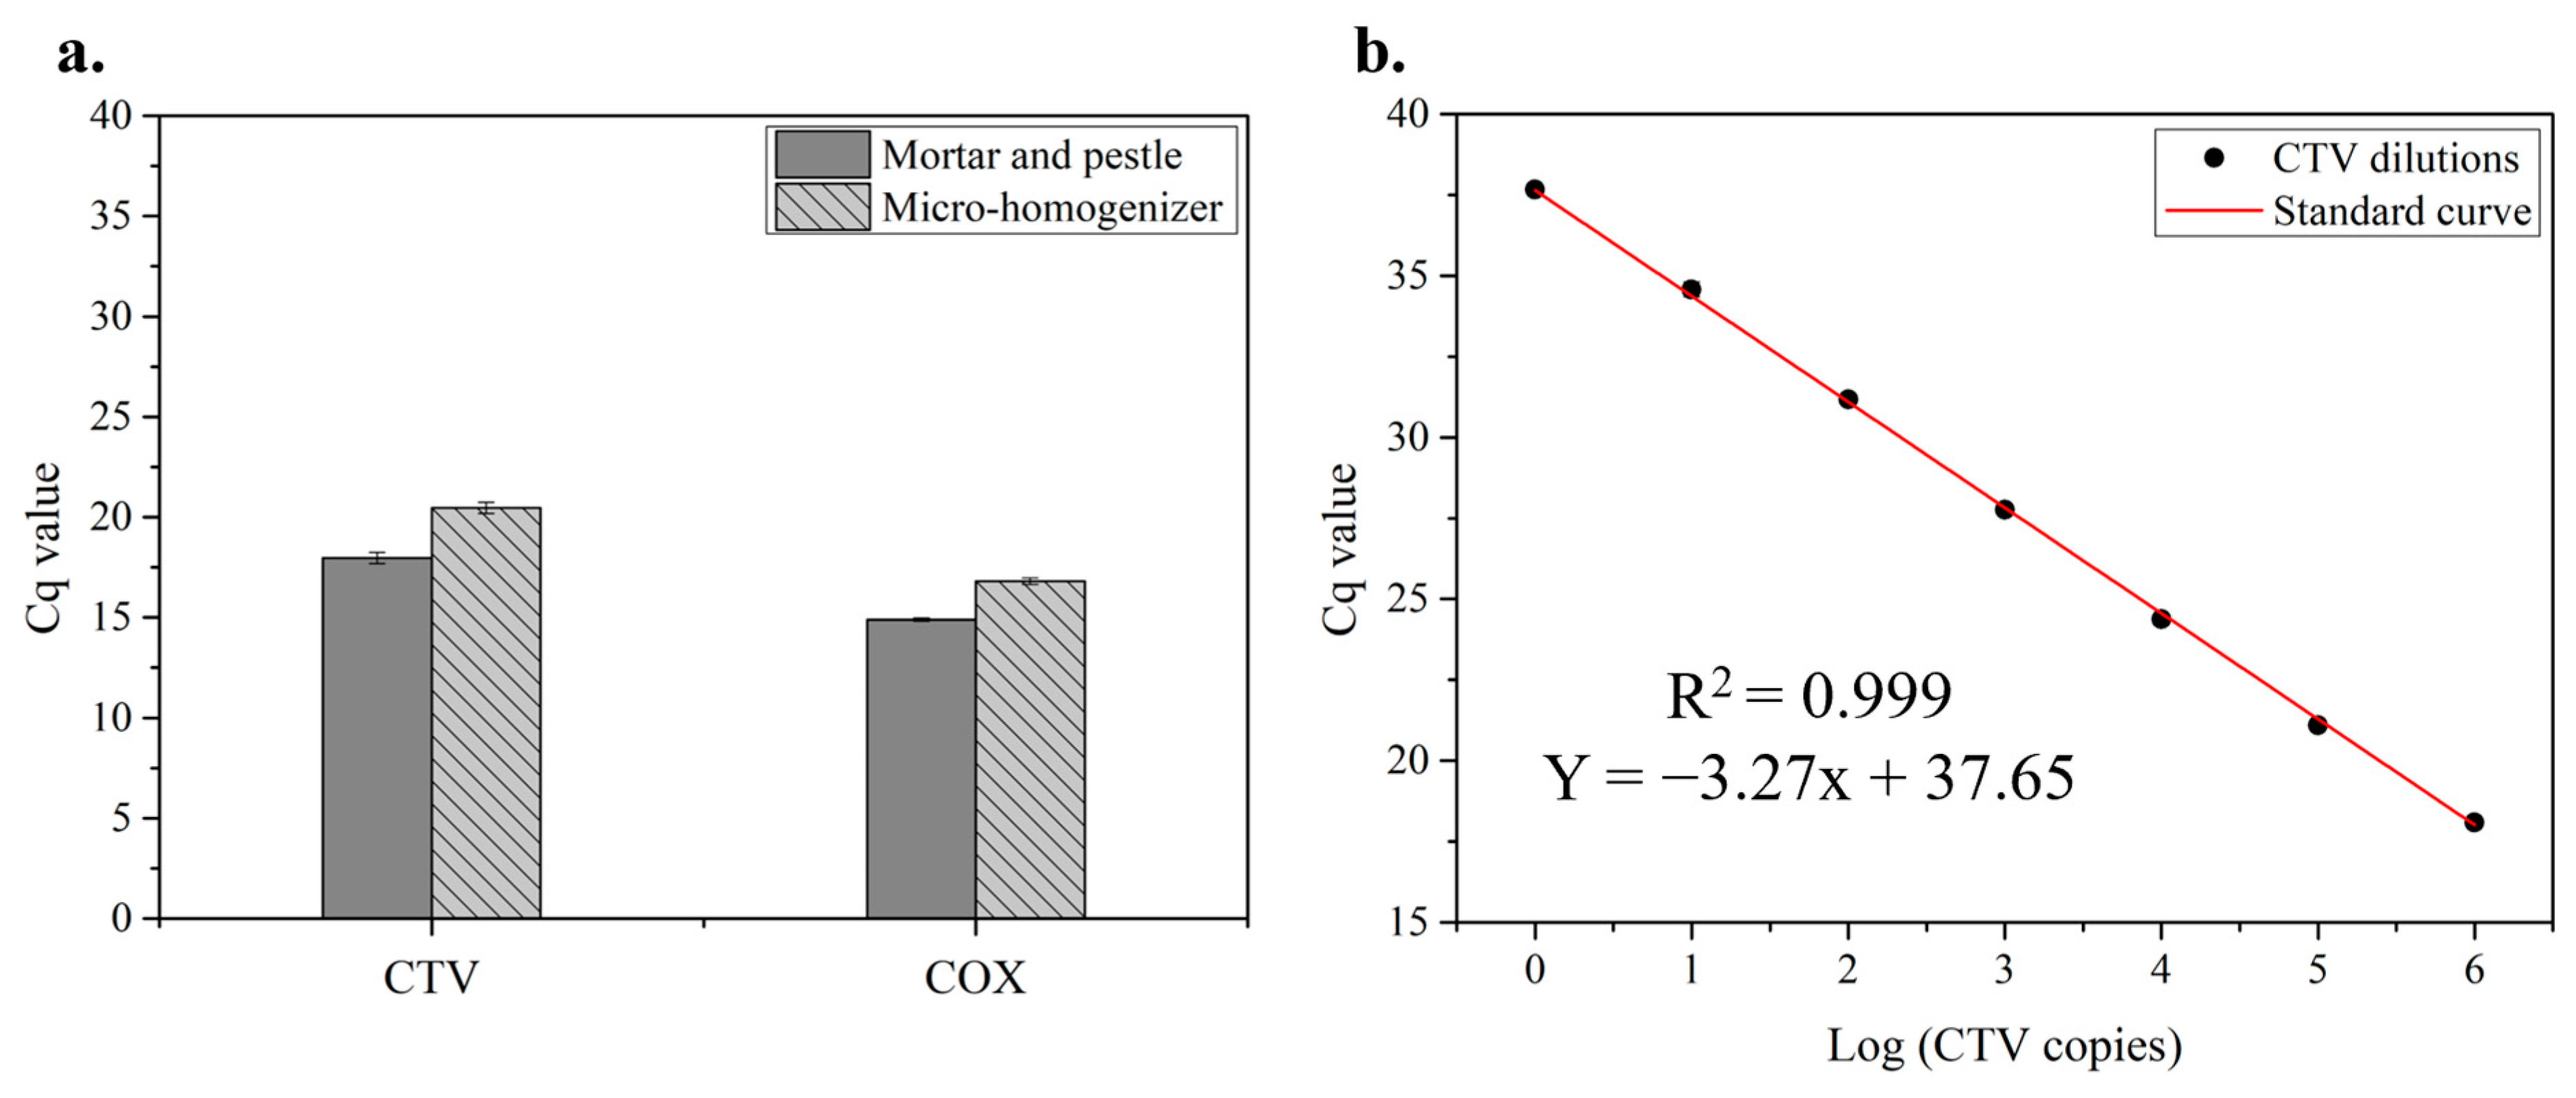
As described above, the OmniLyse operated with a tissue/bead ratio of 1:3 and at a driving voltage of 11 V yielded a good quantity and purity of the extracted nucleic acids. The next step was to test both the micro-homogenizer samples and mortar-and-pestle grinding controls using RT–qPCR to determine CTV and COX expressions. During the experiment (~3 months), diseased leaf tissues were picked six times from source 2987-32 (Table 1) to prepare crude lysates using both methods. The lysates were, again, processed using MagMAX for RNA isolation, enabling subsequent analyses. We first determined the efficacies of both methods by comparing the Cq values (N = 18) and assay variations of all six diseased samples through RT–qPCR assays (Figure 4a). The Cq differences between the two populations ranged from 1.60 to 3.49, with an average difference of 2.48. The viral RNA recovery ratio of the samples using the OmniLyse micro-homogenizer method can achieve up to 33% (calculated based on 1/2(∆Cq) where the ∆Cq ranges from 1.60 to 3.49, as mentioned above) compared to that using a mortar and pestle. Low variations between different biological replicates among these samples were also confirmed with the CV of 1.31% for the micro-homogenizer method and 1.45% for the mortar-and-pestle method, respectively.
To evaluate the RNA integrity, Cq differences of COX between the two populations ranged from 1.58 to 2.16, with an average difference of 1.92. Micro-homogenizer samples (Cq = 16.81 ± 0.16, CV = 0.97%) and grinding controls (Cq = 14.89 ± 0.08, CV = 0.54%) demonstrated highly consistent Cq values, not only representing good RNA integrity but also indicating high repeatability and reliability of both methods.
The use of the OmniLyse micro-homogenizer successfully demonstrated high compatibility with the benchtop extraction process and PCR-based assays by showing equivalently low assay variations and highly accurate diagnostic results (no false positive reactions) compared to manual mortar-and-pestle grinding. However, the micro-homogenizer is not as effective as manual mortar-and-pestle grinding in sample preparation based on the observed Cq values. The micro-homogenizer can save up to 25 min (~70% of preparation time; see Figure 1a,b, part i) in tissue pulverization and crude lysate collection with little trade-off in working efficacy.

3.2. RT–qPCR Assays Combined with Serial Dilution

In the previous subsections, the manual sample grinding using a mortar and pestle was successfully replaced by the micro-homogenizer for quick sample lysis. However, subsequent RT–qPCR assays were conducted using RNAs isolated by a highly sophisticated and automated benchtop magnetic particle processor (MagMAX). Our next step was to attempt direct RT–qPCR assays using water-diluted crude lysates prepared from the micro-homogenizer and different lysis buffers, thereby skipping the nucleic acid extraction stage (Figure 1b, part ii). Diluting testing samples for direct downstream assays, such as qPCR, has long been used to quickly reduce inhibition [54]. Previous studies have also demonstrated its effectiveness in enabling target nucleic acids to be directly collected from challenging samples, such as soil, human bloodstrain, saliva, and nasopharyngeal swabs, for forensic and clinical analysis (e.g., SARS-CoV-2) [55,56,57,58,59]. To increase the chance of success in this attempt, Tris HCl-based buffer (T) and nuclease-free water (H) were also tested as alternative lysis buffers in place of the most frequently used one, guanidine lysis buffer (G). Ten to a thousand times serial dilutions with nuclease-free water were applied to the lysates to dilute potential inhibitors of PCR amplification.
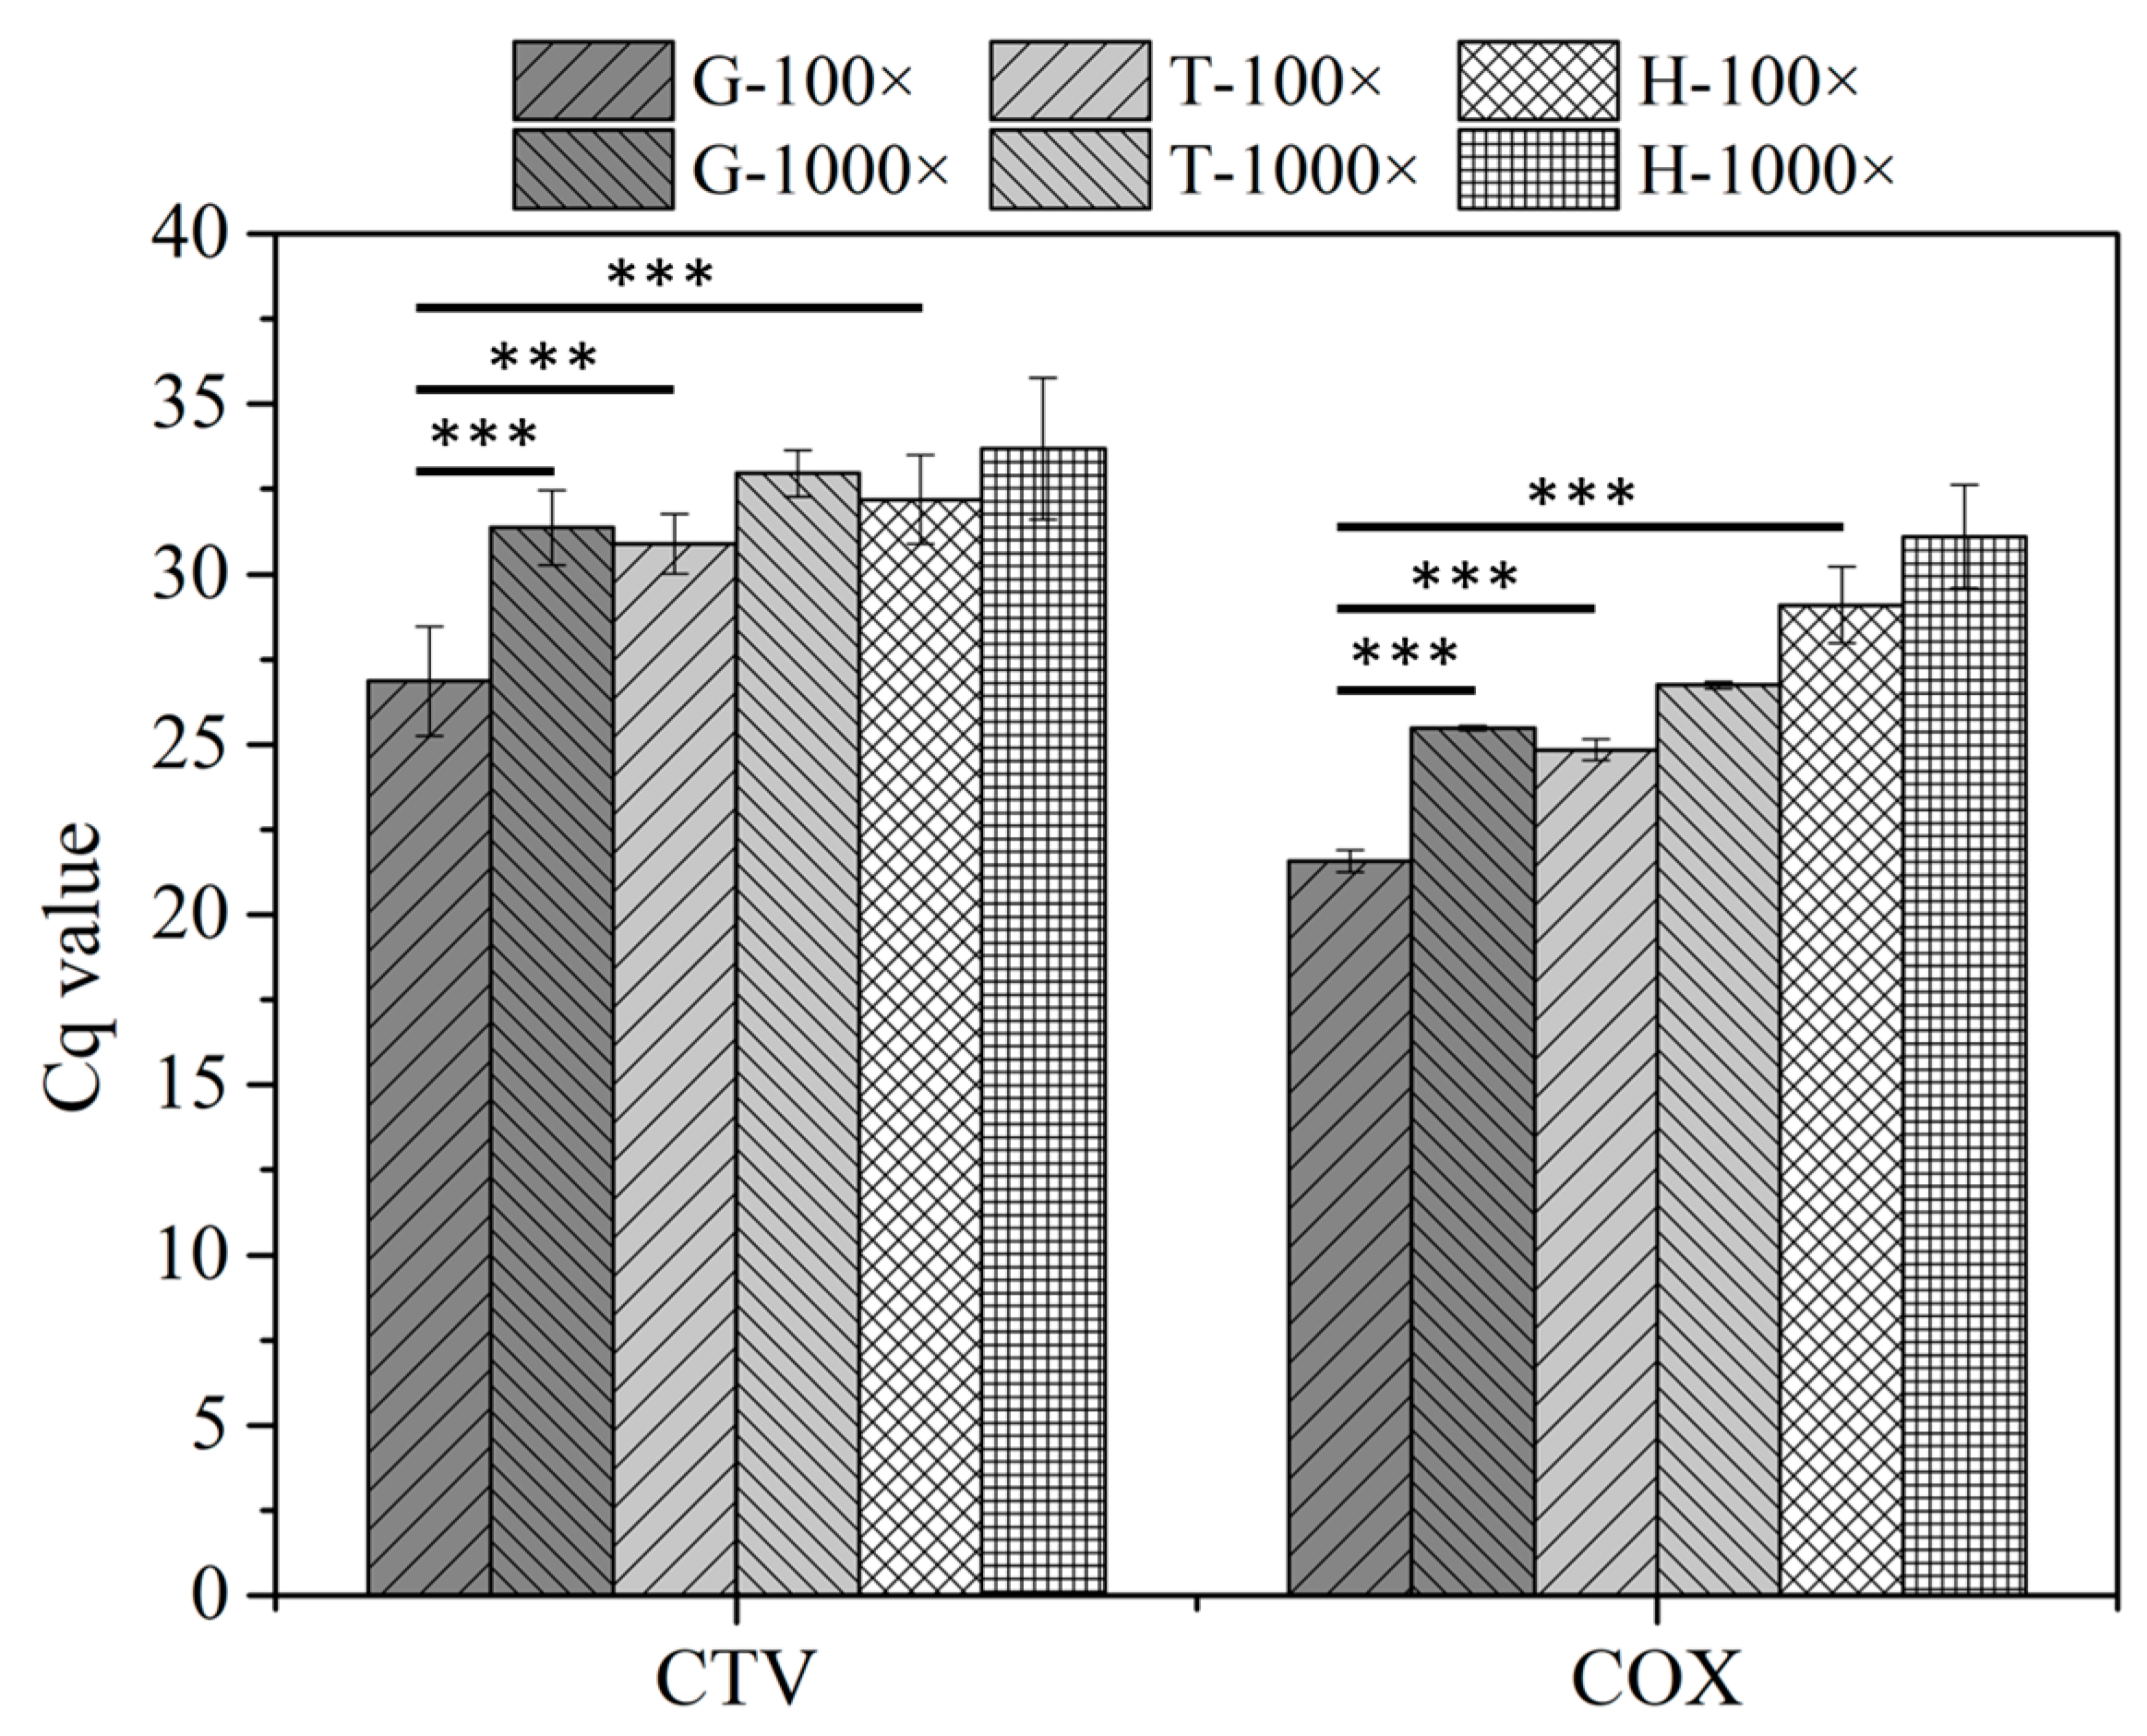
In the serial dilution tests (N = 9), we found that undiluted lysates (0% success for T, H, and G) and 10× dilutions (<30% success for G and 0% for T and H) did not work in RT–qPCR assays regardless of the lysis buffer used (Table S4). It was inferred that impurities such as sucrose, proteinase, and/or tannins originating from the plants inhibited PCR reactions [54]. However, the lysates subjected to 100× and 1000× dilutions performed successfully in CTV and COX RT–qPCR assays with 100% true positive rates (Table S4) and low assay variations with intra-assay CVs < 2.69% and inter-assay CVs < 6.92%. In addition, the Cq values of G and T diluted lysates (100×) were significantly lower compared to their 1000× counterparts, where the average Cq differences are 4.50 (G) and 2.07 (T), respectively (Figure 5). While evaluating 100× diluted lysates, G lysates demonstrated significantly lower Cq values (26.87 ± 1.61) compared to T (30.89 ± 0.88) and H (32.19 ± 1.31) lysates, suggesting that extraction with guanidine lysis buffer followed by 100× dilution with nuclease-free water is by far the most effective combination found in the test.

3.3. qPCR and RT–qPCR Assays Combined with a Paper Disk

3.3.1. Characterization of Paper Disk Method

As described above, the serial dilution method with the guanidine lysis buffers showed convenience and excellent compatibility with RT–qPCR assays. However, a relatively high Cq (low nucleic acid recovery) is problematic for low-titer pathogens. In addition, aqueous nucleic acid samples are easily degradable, a challenge when long-distance transport without a cold chain is necessary. To address these issues, we proposed another protocol using Whatman Grade 1 CHR cellulose chromatography papers to isolate and preserve nucleic acids.
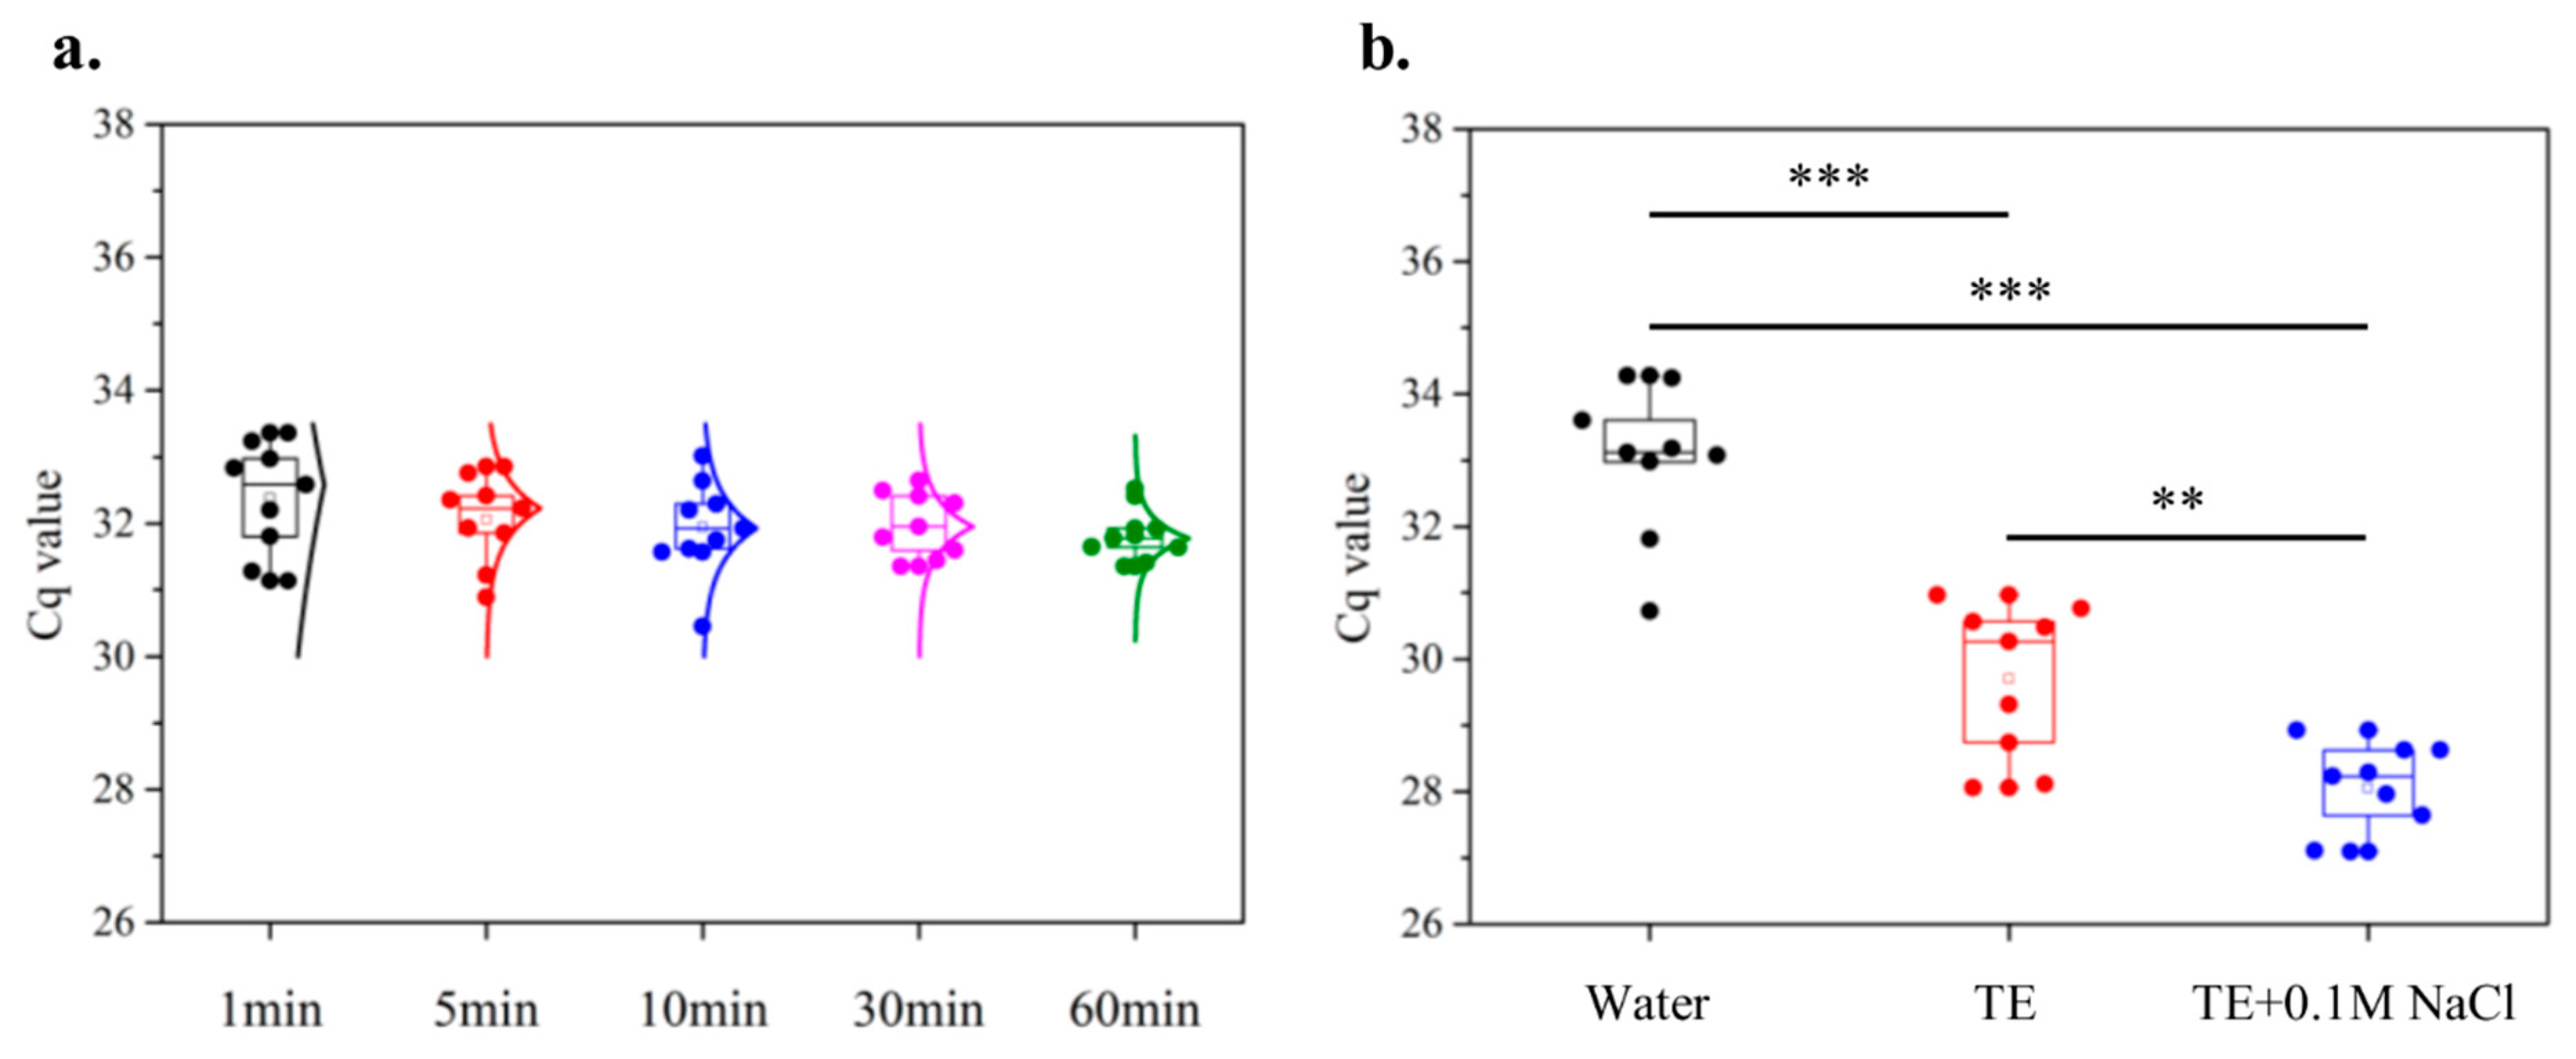
For this purpose, untreated paper disks (d = 0.25 in) were characterized in terms of soaking time and the compositions of elution buffers while using the same CTV source and guanidine lysis buffer. In the soaking time tests (N = 9), various periods (1, 5, 10, 30, and 60 min) were selected to test the correlation between soaking time and the amount of nucleic acid captured. As shown in Figure 6a, 5 min soaking yielded acceptable Cq values with good consistency compared to the 1 min case, whereas longer soaking (10 min and 30 min cases) did not provide better results (i.e., lower Cq). Although a slightly narrower distribution was achieved after 60 min of soaking, such a small gain was not justifiable against the short processing time (5 min soaking). The results indicated that the binding of nucleic acids to paper was rapid, quickly approaching a plateau in the first few minutes after the paper was dipped into the lysate.
In the second set of experiments (N = 9), three different elution buffers (nuclease-free water, TE buffer, and TE + 0.1M NaCl) were tested for their efficiency in nucleic acid elution. As demonstrated in Figure 6b, elution with TE + 0.1 M NaCl resulted in lower Cq (28.06 ± 0.66) with good assay stability (CV = 2.36%) compared to the case with just TE buffer (29.70 ± 1.16, CV = 3.89%). In comparison, the one with nuclease-free water persistently showed a much greater Cq (33.00 ± 1.13, CV = 3.42%) throughout the tests. The results indicated that TE buffer provided a significantly better environment for elution by maintaining a stable pH and reducing the activities of DNase and RNase in the reaction [60]. Additionally, NaCl in TE buffer also played a crucial role in improving elution where the cations (Na+) neutralized the negatively charged DNA/RNA backbones, and the anions (Cl) neutralized the positive charges in the proteins. Thus, nucleic acids no longer formed strong ionic bonds with proteins (inhibitors) and could be purified and released into buffers, whereas proteins were mostly retained by the paper disks [61]. The results suggested that the combination of 5 min soaking in G lysates and elution with TE + 0.1 M NaCl was the most optimized protocol for quick sample preparation.
The use of just one extracted paper disk for qPCR did not significantly improve Cq values. However, simultaneously eluting multiple disks increased the amount of nucleic acids recovered, thus greatly improving the Cq values (Figure S2). Alternatively, paper disks can be easily chemically modified (e.g., chitosan) for improved nucleic acid capture and release [62].

3.3.2. Validations with Healthy, Single-Infected, and Multi-Infected Sources

As listed in Section 2.2 and Table 1, seven healthy, six single-infected, and four multi-infected sources were used to test the reliability of the paper disk as an extraction medium. The crude lysates were prepared using a micro-homogenizer with optimal parameters (11 V, 1:3 tissue/bead ratio, and 5 min), and the resulting nucleic acids were collected using untreated paper disks (tests) and MagMAX (controls) for further comparison. The limits of detection of the paper disk method for singleplex and multiplex assays of all viruses and viroids were estimated based on the standard curves reported in the previous studies [6,7], as shown in detail in Figure S3.

Healthy Samples

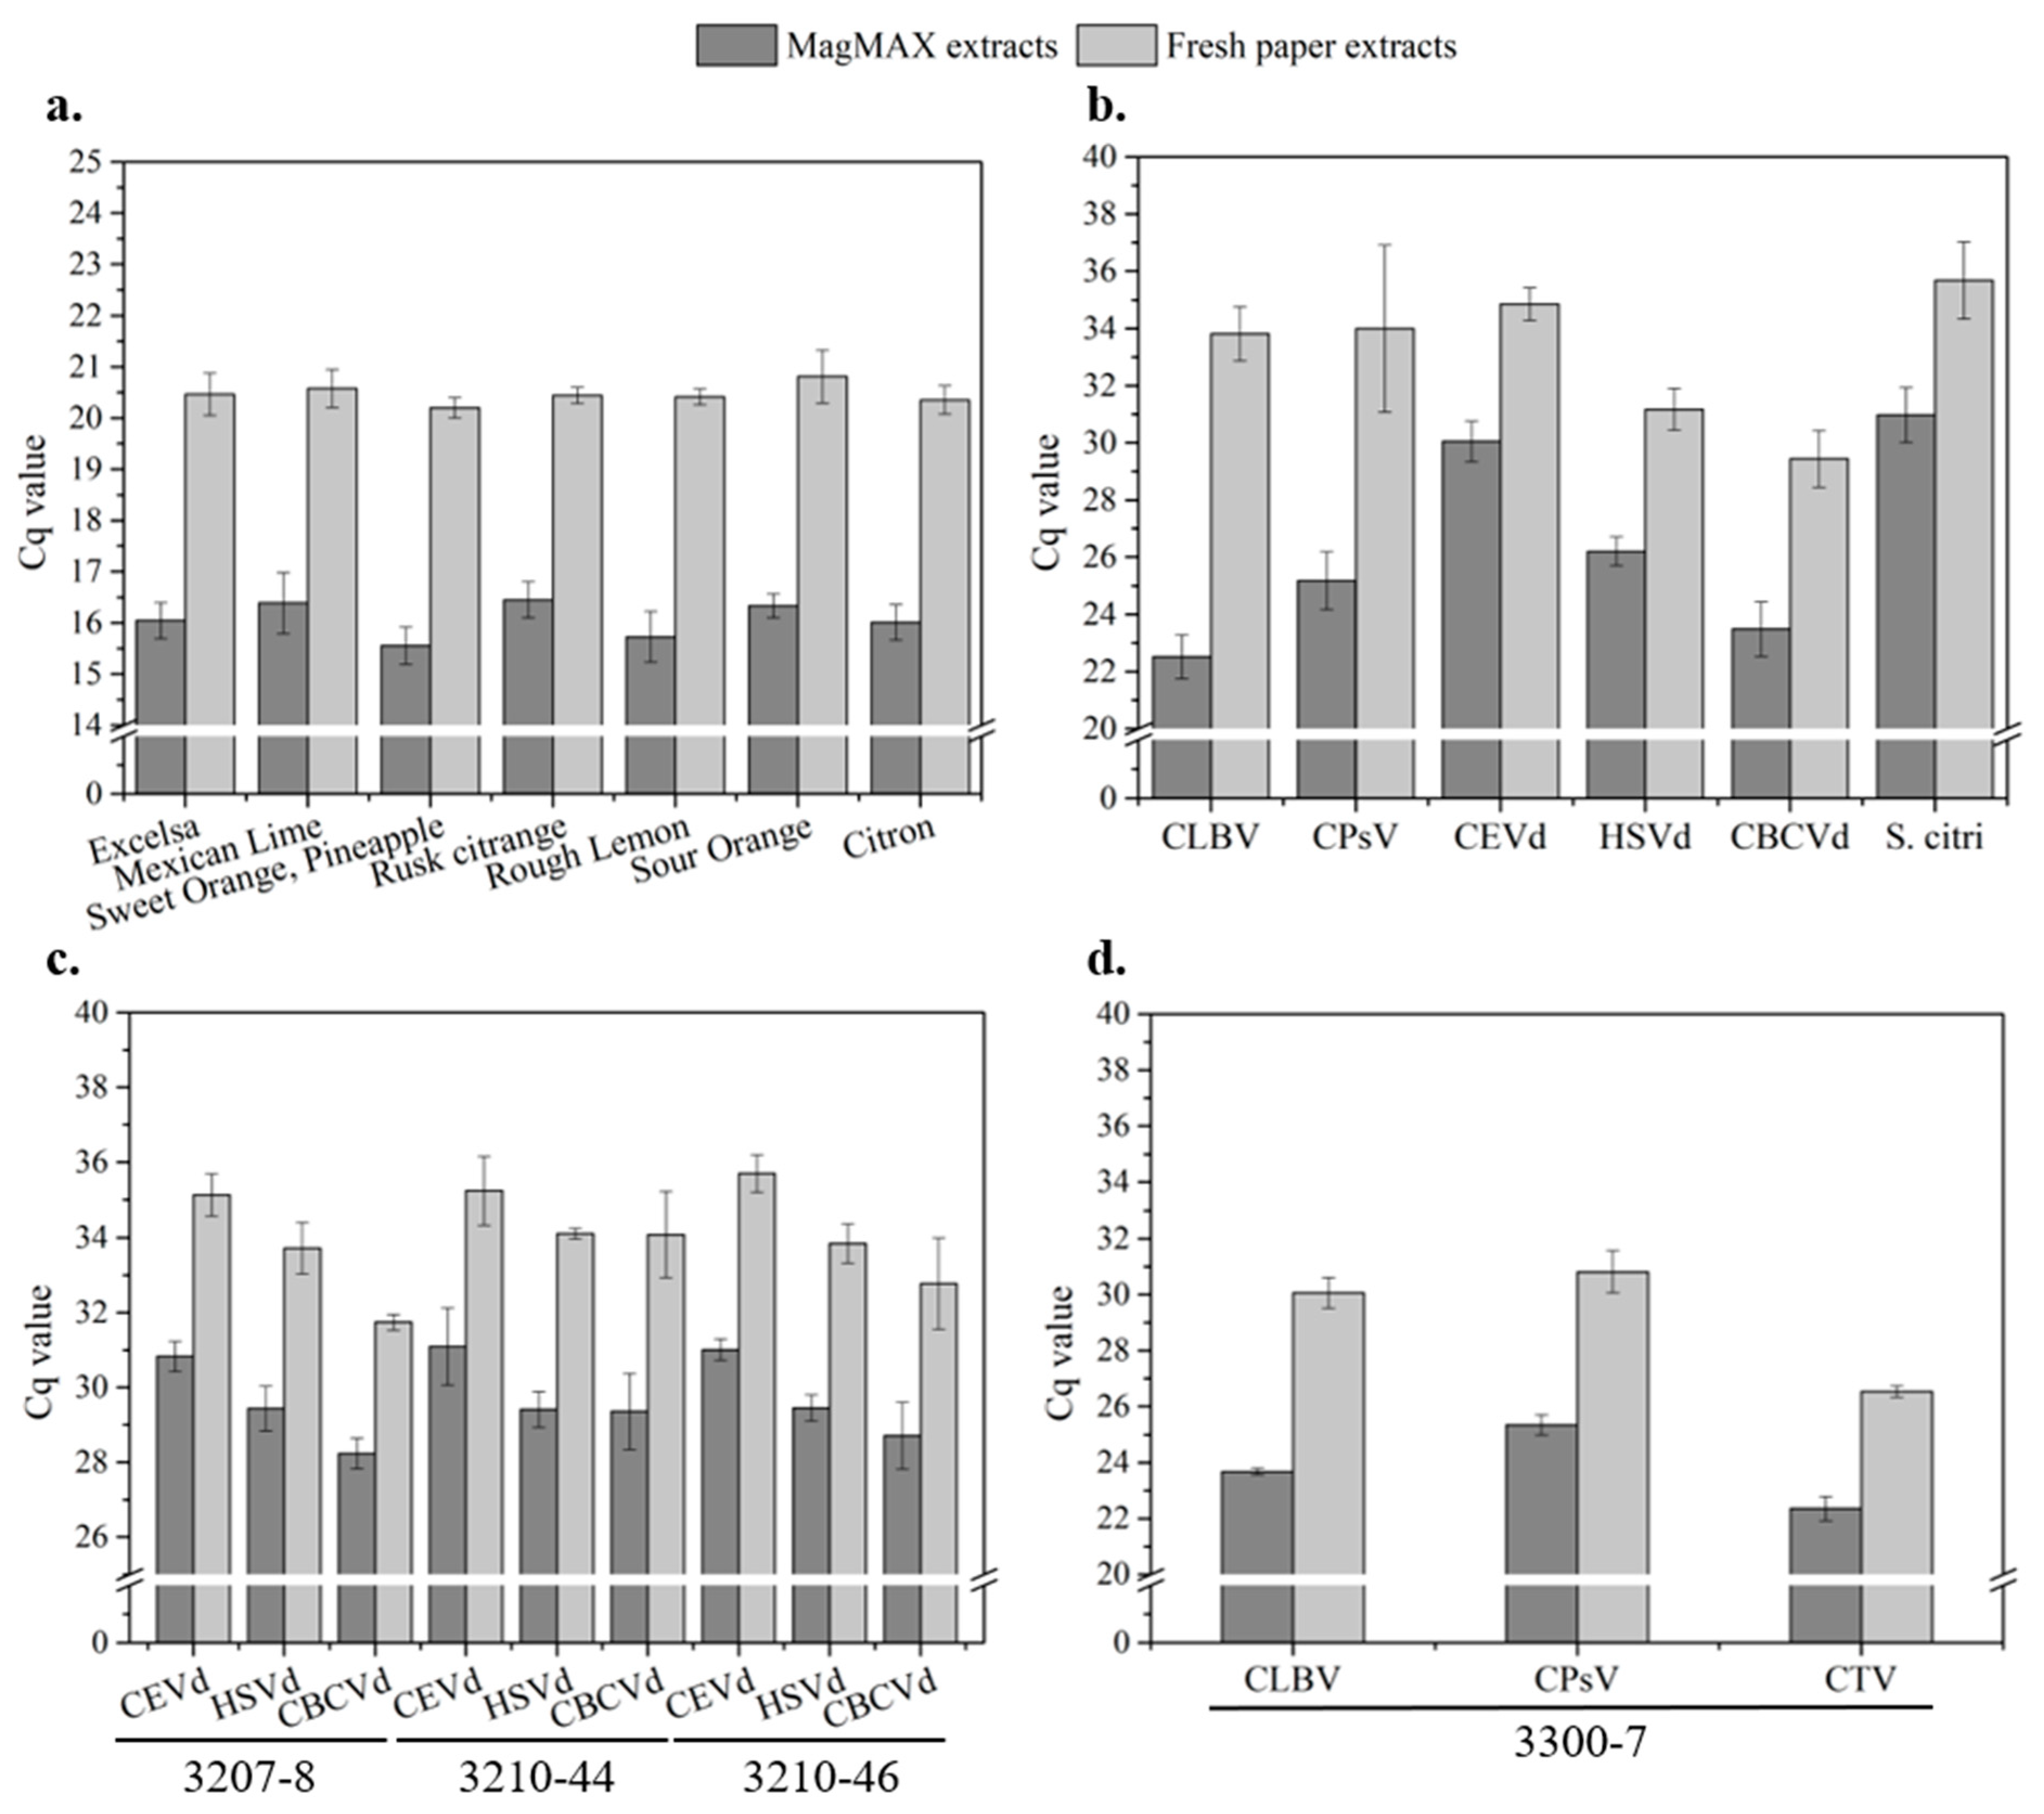
As shown in Figure 7a and Table S5, the average Cq (N = 9) of COX in each source with the paper disk method ranged from 20.20 to 20.81, whereas the average Cq of COX with MagMAX ranged from 15.57 to 16.45. The average Cq differences between fresh paper extracts and MagMAX extracts of each source ranged from 3.99 to 4.69, where the highest and lowest ones were found in rough lemon and Rusk citrange, respectively. Higher Cq in the paper disk method suggested either worse nucleic acid recovery or incomplete removal of reaction inhibitors such as lignin, phenolics, and polysaccharides [54,63]. However, sufficiently low assay variations were demonstrated for the paper disk method, where intra-assay and inter-assay CV ranged from 0.34 to 2.25% and 0.39 to 2.7%, while those of MagMAX ranged from 0.21 to 1.49% and 0.16 to 4.15%.
The untreated paper disk was justified as robust and comparable in assay stability and convenience in this study. Although higher Cq is still an issue to be addressed, untreated chromatography paper, as an economical medium, is a potential and reliable alternative for quick nucleic acid extraction directly from crude lysates of healthy sources.

Single-Infected Samples

Next, we tested untreated paper disks for detecting single-infected samples where the pathogens included two RNA viruses (CLBV and CPsV), three viroids (CEVd, HSVd, and CBCVd), and one bacterium (S. citri), as listed in Table 1. The paper disk method resulted in the following Cq values (N = 9): CLBV (33.81 ± 0.95), CPsV (33.99 ± 2.92), CEVd (34.85 ± 0.57), HSVd (31.17 ± 0.73), CBCVd (29.44 ± 0.99), and S. citri (35.68 ± 1.35) (Figure 7b). The benchtop method with MagMAX yielded smaller Cq values for all pathogens: CLBV (22.52 ± 0.77), CPsV (25.18 ± 1.00), CEVd (30.05 ± 0.71), HSVd (26.21 ± 0.50), CBCVd (23.49 ± 0.95), and S. citri (30.98 ± 0.96). The Cq differences between the two methods ranged from 4.70 to 11.29, with the highest and lowest found in CLBV and S. citri. It is also important to note that both the paper disk and the benchtop methods had 100% true positive rates for all pathogens without exception. For assay stability, all the assays of both methods demonstrated a low level of both intra- and inter-assay CV (<4%) except for the CPsV assay with the paper disk method, where a more significant deviation (up to 9.38% in inter-assay CV) was found.
Although a gap in extraction performance exists between the two methods based on the reported Cq of targets, which is particularly noticeable in RNA virus assays (Table S6), Cq differences of COX (3.69–5.33) remained in an equivalent range as they did in the assays of healthy sources. The results suggest that the paper disk method performed stably as expected for the COX assays. However, higher Cqs found in the assays of the pathogens listed (∆Cq: RNA virus >> RNA viroid > DNA bacterium) might indicate the low effectiveness of the paper disk for the assays of RNA virus (Table S6). Additionally, the estimated limits of detection of the paper disk method for singleplex assays of all viruses and viroids are listed in Figure S3c.

Multi-Infected Samples

In the field, citrus trees are more likely to face threats of multiple pathogen infections instead of single pathogen infections. To simulate such situations, we selected various multi-infected sources (3207-8, 3210-44, 3210-46, and 3300-7) to test the paper disk method (Table 1).
As shown in Figure 7c and Table S7, the average Cq differences (N = 8) of the viroid targets among the sources steadily ranged between 4.15 and 4.69 for CEVd, 4.28 and 4.70 for HSVd, and 3.51 and 4.72 for CBCVd, respectively, while the average Cq differences of COX were 4.29 (3207-8), 4.87 (3210-44), and 4.68 (3210-46), which were about the same compared to those of targets, indicating more pathogen RNAs were recovered during the process and the assays worked successfully. Unlike the tests in single-infected sources, the reported Cq differences suggested smaller deviations between both methods and higher consistency in nucleic acid extraction among the assays. In addition, assay variabilities with the paper disk method remained acceptably low, where inter-assay CVs were less than 2.71% and intra-assay CVs were less than 3.72%, regardless of pathogens and sources. More importantly, the true positive rate was 100% throughout the assays without exception.
The assays of source 3300-7 (N = 9) yielded COX Cq of both methods that are similar to those of the other assays, indicating a successful extraction and an equivalent level of COX expression (Table S7). However, similar to the assays of single-infected sources, the most deviated Cq was found in the assays of CLBV and CPsV with the paper disk method, as shown in Figure 7d, where the Cq differences were 6.39 and 5.47, respectively. The Cq difference in CTV was 4.18, about the average obtained from the other pathogens. It could be inferred that the paper disk method was not as compatible with CLBV and CPsV as it was with other pathogens (e.g., CTV and viroids). Without failing any true positive case, all the assays with the paper disk method achieved a 100% true positive rate with low assay variation (<0.62% for intra-assay CVs and <2.79% for inter-assay CVs). Additionally, the estimated limits of detection of the paper disk method for multiplex assays of all viruses and viroids are listed in Figure S3c.
The efficacy of untreated paper disks in quick sample preparation was demonstrated by testing a certain amount of healthy and infected sources (single and multiple infections). Although paper disks did not perform effectively on the sources infected with RNA viruses, good assay stability (intra- and inter-assay CV < 10%) and superior diagnostic accuracy (100% true positive rate) were all achieved without exception. The gap in nucleic acid extraction between untreated paper and MagMAX is still significant because lower nucleic acid recovery and existing inhibitors in paper-disk extracts were not sufficiently addressed. Chemical modification (e.g., chitosan) for efficient nucleic acid binding or the use of multiple paper disks at a time is expected to improve this method [62].

3.3.3. Long-Term Storage Tests

In this section, the long-term performances of nucleic acid-deposited paper disks were evaluated by testing two factors, temperature and storage period. They were considered crucial for maintaining the quality of nucleic acids. Tested conditions included one-week storage at room temperature (1wRT), one-week storage at 4 °C (1w4C), one-month storage at room temperature (1mRT), one-month storage at 4 °C (1m4C), as well as fresh paper extracts.

Healthy Samples

The comparison between fresh extracts and storage-treated extracts in terms of COX Cq is shown in Figure 8a and Table S8a for each healthy source. The Cq of all the stored samples remained steady, where the greatest Cq difference between fresh and 1wRT for Citrus excelsa was less than 1. Although stable Cq values (N = 9) were demonstrated regardless of storage conditions, worse stabilities were still evident in those stored at RT based on the statistical measurements (Table S8a). In addition, three assays (rough lemon, sour orange, and citron) demonstrated high consistency regardless of storage conditions compared to their fresh counterparts (Table S8a). The impacts of temperature and storage periods were separately assessed with statistical measurements (Table S8b,c). The results suggested that storage at a lower temperature (4 °C) was more beneficial than at RT (~25 °C), given the higher true positive rate and lower Cq values regardless of storage period (see Table S8c). However, differences between samples stored at 4 °C and RT for 1 m were statistically less significant, especially for Citrus excelsa, Rusk citrange, and rough lemon (Table S8b). In terms of assay stability, low intra-assay CVs (<2.28%) and inter-assay CVs (<5.26%) were demonstrated throughout this study. In addition, a 100% true positive rate (N = 9) was broadly found in most assays except for 1mRT for rough lemon (66.7%, N = 6) and citron (66.7%, N = 6). It was inferred that, for some cases, a longer storage period (1 m) at room temperature degraded the quality of nucleic acids in paper disks, resulting in false negatives.
Although samples stored at RT are relatively weak given the reported outcomes, successful demonstration of these assays is still encouraging, especially for resource-limited settings where a cold chain is unavailable for sample shipping and storage. Generally, the effects of storage temperature are considered more dominant to Cq values than the storage period. In contrast, assay variations were reasonably low throughout the tests without being intensively affected by these two factors.

Single-Infected Samples

As shown in Figure 8b, the results of the pathogen nucleic acids on paper disks under different storage conditions were quite variable, where the greatest Cq difference compared to the fresh extract was 1.84 (1m4C for CLBV, N = 9), while the smallest one was −2.01 (1w4C for HSVd, N = 9). According to the statistical analyses (Table S9a), both the assays of CEVd and S. citri demonstrated low Cq difference (<0.8) without statistical significance compared to their fresh counterparts, where the responses were considered stable and well compatible with paper disks. By contrast, regardless of conditions, the remaining assays all demonstrated varying extents of significant deviations (−2.01–1.84) in Cq compared to the fresh extracts. For example, the Cq differences of CLBV were high (1.39–1.84) and broadly observed in all the samples, which implied that any storage condition could remarkably affect CLBV paper disks. However, most Cq from stored CPsV, HSVd, and CBCVd samples was significantly lower (∆Cq: −0.89–−2.01) than the fresh extracts. This finding could indicate either no impact or better performance with the stored samples. It is more likely that inhibitors/buffers retained in wet and fresh paper disks suppressed qPCR reactions.
While comparing the stored samples (Table S9b,c), no significant differences were found in the assays of CEVd and CLBV, regardless of temperature and storage period. It suggested that the varying conditions have either limited or indiscriminate effects on these pathogen-deposited paper disks. In terms of diagnostic accuracy, most 1w assays exhibited a 100% true positive rate (N = 9), except for 1w4C for CEVd (88.9%, N = 8), whereas 1 m assays that failed to pick up all the true positive samples are 1mRT for CLBV (83.3%, N = 20), HSVd (83.3%, N = 10), and S. citri (88.9%, N = 8). Based on the observed true positive rates, longer storage (1 m) at room temperature had a greater impact on some pathogens, resulting in low diagnostic accuracy and false negatives. It is also worth mentioning that these assays still maintained good consistency with overall intra-assay CVs (<3.74%) and inter-assay CVs (<6.61%).
Given no noticeable Cq differences (Table S9b), it was demonstrated that the quality of nucleic acids in paper disks was stable and barely affected by temperature in shorter storage (1w stored samples), making them highly appropriate for shipping. For longer storage (1m stored samples), however, it was justified that a lower temperature (4 °C) should be used (Table S9c).

Multi-Infected Samples

In this set of experiments, three viroid-based multi-infected (3207-8, 3210-44, and 3210-46) and one virus-based multi-infected (3300-7) sources were selected (Figure 8c). Both the assays of CEVd and HSVd throughout the three sources (3207-8, 3210-44, and 3210-46) exhibited similar responses to the storage conditions, where the Cq values (N = 9) were quite different from those of single-infected sources. Interestingly, CEVd and HSVd samples with longer storage periods demonstrated lower Cq compared to the ones stored for a shorter time. The 1mRT samples were the only cases with negative Cq differences (−1.07–−0.17). Based on the analysis (Table S10a), most Cq differences (>70%) found in the assays of CEVd and HSVd were far less than one and considered negligible in clinical diagnosis. However, statistical significances were mitigated with the samples treated with longer storage (Table S10b). In contrast, the effect of low temperature (4 °C) was limited for Cq but still noticeable (Table S10c).
For the assays of CBCVd, the Cq yielded by storage-treated samples was equivalent compared to the fresh extracts, with the majority of Cq difference (>80%) being less than 1 (Table S10a). By comparing the stored samples, no significant differences were found in any assays despite the temperature and storage period (Table S10b,c). Given the stable Cq values, it could be inferred that CBCVd paper disks are relatively tolerant to such conditions. Particularly, the assays of viroid samples demonstrated perfect diagnostic accuracy (100% true positive rate for all the sources) and good assay stability with overall intra-assay CVs < 2.43% and inter-assay CVs < 7.02%.
We selected a source infected with multiple viruses (3300-7) as the final target for long-term storage tests. According to the analysis in Table S10a, low Cq values equivalent to those of the fresh extracts were achieved by the 1wRT samples (∆Cq: −0.31–0.44) instead of the 1w4C samples (∆Cq: 0.37–1.53). However, lower Cq was not necessarily accompanied by good diagnostic accuracy. Worse diagnostic accuracy was found in 1wRT samples (CLBV: 66.7%, CPsV: 66.7%, CTV: 77.8%; N = 6) than in 1w4C counterparts (CLBV: 88.9%, N = 8; CPsV, and CTV: 100%, N = 9). For the samples with longer storage, none of the 1m CPsV were successfully detected regardless of the storage temperature, whereas CLBV demonstrated 0% and 66.7% (N = 6) of true positive rates for 1mRT and 1m4C cases, respectively. Although both 1mRT and 1m4C for CTV showed a 100% true positive rate (N = 9), which performed relatively more stably, the Cq yielded by the 1mRT sample was still much higher (∆Cq: 4.78) than the rest. The statistical analyses in Table S10b,c also justified that higher temperature (RT) and a longer storage period considerably harmed viral RNA deposited on paper disks, given the low diagnostic accuracy and higher Cq. In addition, good assay stability was achieved, with overall intra-assay CVs < 1.44% and inter-assay CVs < 5.17%.
A shorter period (1w) and a lower temperature (4 °C) for paper disk storage were desirable for all the selected pathogens. Viroids’ nucleic acids on paper disks were more stable and tolerant to the varying conditions during storage. However, a longer period (1 m) and a higher temperature (RT) were unfavorable and should be avoided for viral nucleic acids.

4. Conclusions

In this study, we demonstrated two new sample preparation protocols. The micro-homogenizer with optimal parameters (11 V, 1:3 tissue/bead ratio, 5 min) successfully produced plant lysates, followed either by serial dilution for the reduction of inhibitory substances or by dropping untreated chromatography paper disks into the lysate for nucleic acid extraction before subsequent qPCR/RT–qPCR analysis. The capability of the nucleic acid-deposited papers was also thoroughly investigated and verified by testing a variety of healthy and diseased citrus sources and different storage conditions in terms of target nucleic acid expression, true positive rate, and assay stability. This study proves that the mechanical lysis in such a miniaturized device is effective even for plant tissues. In addition, the protocol’s great compatibility was also proven with multiple citrus pathogens across multiple different species. Further, paper disks provide a reliable method of storing extracted nucleic acids for a long time.
These new methods can expedite current disease diagnosis practices where cumbersome specimen collection, packaging, and submission steps are carried out by growers. It also expands the potential for better disease management in the field as in situ sample preparation and subsequent shipping is much easier and less risky than shipping infected tissue. Although a single disk was sufficient for our study, multiple disks securing more nucleic acids may be necessary depending on the use case, such as low-titer and unevenly distributed pathogens. Furthermore, these protocols are also expected to be integrated with isothermal amplification methods such as loop-mediated isothermal amplification (LAMP) to satisfy the increasing demands of Point-of-Care disease diagnosis in the field.

Supplementary Materials

The following supporting information can be downloaded at https://www.mdpi.com/article/10.3390/chemosensors12060105/s1. Table S1: Comparison of quick and portable extraction techniques for qPCR-based assays; Table S2: Oligonucleotide primers and qPCR probes used for singleplex and multiplex qPCR/RT–qPCR assays; Table S3: Kits and protocols used for singleplex and multiplex qPCR/RT–qPCR assays; Table S4: A list with the true positive rates that achieved by different serial dilutions and controls (N = 9); Table S5: Comparison of Cq values for COX between MagMAX-treated samples and paper disk-treated samples in testing healthy citrus plants; Table S6: Comparison of target/COX Cq values between MagMAX-treated samples and paper disk-treated samples in detecting single-infected citrus plants; Table S7: Comparison of target Cq values between MagMAX-treated samples and paper disk-treated samples in detecting multi-infected citrus plants; Table S8: Effects of storage conditions on nucleic acids stored on paper disks (Healthy sources, N = 9) (a), Effects of storage temperature on Cq values (b), and Effects of storage period on Cq values (c); Table S9: Effects of storage conditions on nucleic acids stored on paper disks (single-infected sources, N = 9) (a), Effects of storage temperature on Cq values (b), and Effects of storage period on Cq values (c); Table S10: Effects of storage conditions on nucleic acids stored on paper disks (Multi-infected sources, N = 9) (a), Effects of storage temperature on Cq values (b), and Effects of storage period on Cq values (c); Figure S1: Illustration of the sample pretreatment of citrus leaves; Figure S2. Comparison between one-paper-disk extract and four-paper-disk extract; Figure S3. Estimation of limits of detection of the paper disk extraction method.

Author Contributions

Conceptualization, C.-W.L., S.B. and H.T.; methodology, C.-W.L., S.B., G.V. and H.T.; validation, C.-W.L. and S.B.; formal analysis, C.-W.L. and S.B.; investigation, C.-W.L.; resources, S.B. and G.V.; writing—original draft preparation, C.-W.L. and H.T.; writing—review and editing, C.-W.L., S.B., G.V. and H.T.; visualization, C.-W.L. and H.T.; supervision, S.B., G.V. and H.T.; project administration, G.V. and H.T.; funding acquisition, S.B., G.V. and H.T. All authors have read and agreed to the published version of the manuscript.

Funding

This research was funded by the National Science Foundation under grant no. 1654010, UCR OASIS Internal Funding Award, USDA Agricultural Marketing Service through California Department of Food and Agriculture (CDFA) grant 23-0001-034-SF, and it was supported in part by the Citrus Research Board (CRB) project 6100, USDA National Institute of Food and Agriculture’s Hatch project 1020106, and the National Clean Plant Network–USDA Animal and Plant Health Inspection Service (AP20PPQS&T00C049, AP21PPQS&T00C139, and AP22PPQS&T00C084).

Institutional Review Board Statement

Not applicable.

Informed Consent Statement

Not applicable.

Data Availability Statement

The data that support the findings of this study are available from the corresponding author upon reasonable request.

Acknowledgments

The authors thank Sidharth Modha for his help with Scanning Electron Microscopy at the UCR Central Facility for Advanced Microscopy and Microanalysis (CFAMM).

Conflicts of Interest

The authors declare that they have no known competing financial interests or personal relationships that could have appeared to influence the work reported in this paper.

References

  1. Benítez-Galeano, M.J.; Hernández-Rodríguez, L.; Dalmao, F.; Bertoni, E.; Bertalmío, A.; Rubio, L.; Rivas, F.; Maeso, D.; Colina, R. First comprehensive sanitary report of citrus-infecting viruses and viroids in Uruguay. J. Citrus Pathol. 2021, 8, c481049181. [Google Scholar] [CrossRef]
  2. Folimonova, S.Y. Citrus tristeza virus: A large RNA virus with complex biology turned into a valuable tool for crop protection. PLoS Pathog. 2020, 16, e1008416. [Google Scholar] [CrossRef] [PubMed]
  3. Li, S.; Wu, F.; Duan, Y.; Singerman, A.; Guan, Z. Citrus greening: Management strategies and their economic impact. HortScience 2020, 55, 604–612. [Google Scholar] [CrossRef]
  4. Wang, J.; Boubourakas, I.; Voloudakis, A.; Agorastou, T.; Magripis, G.; Rucker, T.; Kyriakopoulou, P.; Vidalakis, G. Identification and characterization of known and novel viroid variants in the Greek national citrus germplasm collection: Threats to the industry. Eur. J. Plant Pathol. 2013, 137, 17–27. [Google Scholar] [CrossRef]
  5. Davis, T.J.; Gómez, M.I.; Harper, S.J.; Twomey, M. The Economic Impact of Hop Stunt Viroid and Certified Clean Planting Materials. HortScience 2021, 56, 1471–1475. [Google Scholar] [CrossRef]
  6. Osman, F.; Dang, T.; Bodaghi, S.; Vidalakis, G. One-step multiplex RT-qPCR detects three citrus viroids from different genera in a wide range of hosts. J. Virol. Methods 2017, 245, 40–52. [Google Scholar] [CrossRef] [PubMed]
  7. Osman, F.; Hodzic, E.; Kwon, S.-J.; Wang, J.; Vidalakis, G. Development and validation of a multiplex reverse transcription quantitative PCR (RT-qPCR) assay for the rapid detection of Citrus tristeza virus, Citrus psorosis virus, and Citrus leaf blotch virus. J. Virol. Methods 2015, 220, 64–75. [Google Scholar] [CrossRef] [PubMed]
  8. Stelinski, L.L. Ecological aspects of the vector-borne bacterial disease, citrus greening (Huanglongbing): Dispersal and host use by Asian citrus psyllid, Diaphorina citri Kuwayama. Insects 2019, 10, 208. [Google Scholar] [CrossRef] [PubMed]
  9. Yokomi, R.; Rattner, R.; Osman, F.; Maheshwari, Y.; Selvaraj, V.; Pagliaccia, D.; Chen, J.; Vidalakis, G. Whole genome sequence of five strains of Spiroplasma citri isolated from different host plants and its leafhopper vector. BMC Res. Notes 2020, 13, 320. [Google Scholar] [CrossRef]
  10. Wang, J.; Zhu, D.; Tan, Y.; Zong, X.; Wei, H.; Liu, Q. First Report of Citrus leaf blotch virus in Sweet Cherry. Plant Dis. 2016, 100, 1027. [Google Scholar] [CrossRef]
  11. Jakse, J.; Radisek, S.; Pokorn, T.; Matousek, J.; Javornik, B. Deep-sequencing revealed Citrus bark cracking viroid (CBCVd) as a highly aggressive pathogen on hop. Plant Pathol. 2015, 64, 831–842. [Google Scholar] [CrossRef]
  12. Eiras, M.; Targon, M.L.P.N.; Fajardo, T.V.M.; Flores, R.; Kitajima, E.W. Citrus exocortis viroid and Hop Stunt viroid Doubly infecting grapevines in Brazil. Fitopatol. Bras. 2006, 31, 440–446. [Google Scholar] [CrossRef]
  13. Atta, S.; Cao, M.; Umar, U.u.d.; Zhou, Y.; Yang, F.; Zhou, C. Biological indexing and genetic analysis of Citrus tristeza virus in Pakistan. J. Gen. Plant Pathol. 2017, 83, 382–389. [Google Scholar] [CrossRef]
  14. Lee, R.F.; Keremane, M.L.; Ramadugu, C. Use of young plants for biological indexing of graft transmissible pathogens of citrus. Crop Prot. 2021, 143, 105524. [Google Scholar] [CrossRef]
  15. Chalupowicz, L.; Dombrovsky, A.; Gaba, V.; Luria, N.; Reuven, M.; Beerman, A.; Lachman, O.; Dror, O.; Nissan, G.; Manulis-Sasson, S. Diagnosis of plant diseases using the Nanopore sequencing platform. Plant Pathol. 2019, 68, 229–238. [Google Scholar] [CrossRef]
  16. Kishore, K.; Rahman, H.; Kalita, H.; Pandey, B.; Monika, N. Prevalence of Citrus tristeza virus in mandarin of Sikkim Himalayan Region. Indian J. Virol. 2010, 21, 140–143. [Google Scholar] [CrossRef]
  17. Tarafdar, A.; Godara, S.; Dwivedi, S.; Jayakumar, B.; Biswas, K.K. Characterization of Citrus tristeza virus and determination of genetic variability in North-east and South India. Indian Phytopathol. 2013, 66, 302–307. [Google Scholar]
  18. Warghane, A.; Kokane, A.; Kokane, S.; Motghare, M.; Surwase, D.; Chodhury, S.P.; Biswas, K.K.; Ghosh, D.K. Molecular detection and coat protein gene based characterization of Citrus tristeza virus prevalent in Sikkim state of India. Indian Phytopathol. 2020, 73, 135–143. [Google Scholar] [CrossRef]
  19. Ghosh, A.; Das, A.; Lepcha, R.; Majumdar, K.; Baranwal, V. Identification and distribution of aphid vectors spreading Citrus tristeza virus in Darjeeling hills and Dooars of India. J. Asia-Pac. Entomol. 2015, 18, 601–605. [Google Scholar] [CrossRef]
  20. Abubaker, M.Y.A.; Elhassan, S.M.; Irabi, A.I. First report of Citrus tristeza virus (CTV) disease in commercial citrus Orchards in Sudan. Asian Res. J. Agric. 2017, 3, 1–11. [Google Scholar] [CrossRef]
  21. Ding, F.; Duan, Y.; Paul, C.; Brlansky, R.H.; Hartung, J.S. Localization and distribution of ’Candidatus Liberibacter asiaticus’ in citrus and periwinkle by direct tissue blot immuno assay with an anti-OmpA polyclonal antibody. PLoS ONE 2015, 10, e0123939. [Google Scholar] [CrossRef] [PubMed]
  22. Duran-Vila, N. Detection of Viroids by sPAGE Gel Electrophoresis. In Viroids: Methods and Protocols; Humana: New York, NY, USA, 2022; pp. 71–77. [Google Scholar]
  23. Murcia, N.; Serra, P.; Olmos, A.; Durán-Vila, N. A novel hybridization approach for detection of citrus viroids. Mol. Cell. Probes 2009, 23, 95–102. [Google Scholar] [CrossRef]
  24. Pallás, V.; Sánchez-Navarro, J.A.; Kinard, G.R.; Di Serio, F. Molecular hybridization techniques for detecting and studying viroids. In Viroids and Satellites; Elsevier: Amsterdam, The Netherlands, 2017; pp. 369–379. [Google Scholar]
  25. Simeone, M.; Gómez, C.; Bertalmío, A.; Ruiz, E.; Hauteville, C.; Godoy Suarez, L.; Tito, B.; García, M.L. Detection of citrus psorosis virus by RT-qPCR validated by diagnostic parameters. Plant Pathol. 2021, 70, 980–986. [Google Scholar] [CrossRef]
  26. Chambers, G.A.; Geering, A.D.; Holford, P.; Vidalakis, G.; Donovan, N.J. Development of a one-step RT-qPCR detection assay for the newly described citrus viroid VII. J. Virol. Methods 2022, 299, 114330. [Google Scholar] [CrossRef] [PubMed]
  27. Osman, F.; Vidalakis, G. Real-Time Detection of Viroids Using Singleplex and Multiplex Quantitative Polymerase Chain Reaction. In Viroids: Methods and Protocols; Humana: New York, NY, USA, 2022; pp. 181–194. [Google Scholar]
  28. Huatang, W.; Xinnian, Z.; Peipei, X.; Liu, Y. Rapid DNA Extraction Methods for Direct-PCR Detection Citrus Huanglongbing. Plant Dis. Pests 2015, 6, 1. [Google Scholar]
  29. Rezaian, M.; Krake, L. Nucleic acid extraction and virus detection in grapevine. J. Virol. Methods 1987, 17, 277–285. [Google Scholar] [CrossRef] [PubMed]
  30. Li, R.; Mock, R.; Huang, Q.; Abad, J.; Hartung, J.; Kinard, G. A reliable and inexpensive method of nucleic acid extraction for the PCR-based detection of diverse plant pathogens. J. Virol. Methods 2008, 154, 48–55. [Google Scholar] [CrossRef] [PubMed]
  31. Barbier, F.F.; Chabikwa, T.G.; Ahsan, M.U.; Cook, S.E.; Powell, R.; Tanurdzic, M.; Beveridge, C.A. A phenol/chloroform-free method to extract nucleic acids from recalcitrant, woody tropical species for gene expression and sequencing. Plant Methods 2019, 15, 62. [Google Scholar] [CrossRef] [PubMed]
  32. Dang, T.; Osman, F.; Wang, J.; Rucker, T.; Bodaghi, S.; Tan, S.-h.; Pagliaccia, D.; Lavagi-Craddock, I.; Vidalakis, G. High-Throughput RNA Extraction from Citrus Tissues for the Detection of Viroids. In Viroids: Methods and Protocols; Humana: New York, NY, USA, 2022; pp. 57–64. [Google Scholar]
  33. Liu, C.-W.; Tsutsui, H. Sample–to-answer sensing technologies for nucleic acid preparation and detection in the field. SLAS Technol. 2023, 28, 302–323. [Google Scholar] [CrossRef]
  34. Carpinetti, P.d.A.; Fioresi, V.S.; Ignez da Cruz, T.; de Almeida, F.A.N.; Canal, D.; Ferreira, A.; Ferreira, M.F.d.S. Efficient method for isolation of high-quality RNA from Psidium guajava L. tissues. PLoS ONE 2021, 16, e0255245. [Google Scholar] [CrossRef]
  35. Fujiwara, K.; Inoue, H.; Sonoda, R.; Iwamoto, Y.; Kusaba, M.; Tashiro, N.; Miyasaka, A. Real-time PCR detection of the onion downy mildew pathogen Peronospora destructor from symptomless onion seedlings and soils. Plant Dis. 2021, 105, 643–649. [Google Scholar] [CrossRef] [PubMed]
  36. Qiagen. RNeasy Plant Mini Kit. Available online: https://www.qiagen.com/us/products/discovery-and-translational-research/dna-rna-purification/rna-purification/total-rna/rneasy-plant-mini-kit (accessed on 26 March 2024).
  37. Qiagen. DNeasy Plant Pro and Plant Kits. Available online: https://www.qiagen.com/us/products/discovery-and-translational-research/dna-rna-purification/dna-purification/genomic-dna/dneasy-plant-pro-and-plant-kits (accessed on 26 March 2024).
  38. Jia, Z.; Ding, M.; Nakano, M.; Hong, K.; Huang, R.; Becker, D.; Glazebrook, J.; Katagiri, F.; Han, X.; Tsuda, K. DNA purification-free PCR from plant tissues. Plant Cell Physiol. 2021, 62, 1503–1505. [Google Scholar] [CrossRef] [PubMed]
  39. Qiagen. QIAcard FTA PlantSaver. Available online: https://www.qiagen.com/us/products/discovery-and-translational-research/sample-collection-stabilization/qiacard-fta/qiacard-fta-plantsaver (accessed on 26 March 2024).
  40. Paul, R.; Saville, A.C.; Hansel, J.C.; Ye, Y.; Ball, C.; Williams, A.; Chang, X.; Chen, G.; Gu, Z.; Ristaino, J.B. Extraction of plant DNA by microneedle patch for rapid detection of plant diseases. ACS Nano 2019, 13, 6540–6549. [Google Scholar] [CrossRef] [PubMed]
  41. Paul, R.; Ostermann, E.; Gu, Z.; Ristaino, J.B.; Wei, Q. DNA extraction from plant leaves using a microneedle patch. Curr. Protoc. Plant Biol. 2020, 5, e20104. [Google Scholar] [CrossRef] [PubMed]
  42. Zou, Y.; Mason, M.G.; Wang, Y.; Wee, E.; Turni, C.; Blackall, P.J.; Trau, M.; Botella, J.R. Nucleic acid purification from plants, animals and microbes in under 30 seconds. PLoS Biol. 2017, 15, e2003916. [Google Scholar] [CrossRef] [PubMed]
  43. Mathews, D.M.; Bodaghi, S.; Heick, J.A.; Dodds, J.A. Detection of Avocado Sunblotch and Other Viroids Using RNA Filter Paper Capture and RT-PCR. In Viroids: Methods and Protocols; Humana: New York, NY, USA, 2023; pp. 219–233. [Google Scholar]
  44. Pretorius, L.-S.; Chandra, K.A.; Jooste, A.E.; Motaung, L.C.; Parkinson, L.E.; Geering, A.D. Adaptation of a filter paper method for RNA template preparation for the detection of avocado sunblotch viroid by reverse transcription qPCR. J. Virol. Methods 2022, 301, 114455. [Google Scholar] [CrossRef] [PubMed]
  45. Haveman, N.J.; Schuerger, A.C.; Yu, P.-L.; Brown, M.; Doebler, R.; Paul, A.-L.; Ferl, R.J. Advancing the automation of plant nucleic acid extraction for rapid diagnosis of plant diseases in space. Front. Plant Sci. 2023, 14, 1194753. [Google Scholar] [CrossRef] [PubMed]
  46. Zhou, C.; da Graça, J.V.; Freitas-Astua, J.; Vidalakis, G.; Durán-Vila, N.; Lavagi, I. Citrus viruses and viroids. In The Genus Citrus; Elsevier: Amsterdam, The Netherlands, 2020; pp. 391–410. [Google Scholar]
  47. Lavagi, I.; Matoušek, J.; Vidalakis, G. Other cocadviroids. In Viroids and Satellites; Elsevier: Amsterdam, The Netherlands, 2017; pp. 275–287. [Google Scholar]
  48. Shi, J.; Pagliaccia, D.; Morgan, R.; Qiao, Y.; Pan, S.; Vidalakis, G.; Ma, W. Novel diagnosis for citrus stubborn disease by detection of a Spiroplasma citri-secreted protein. Phytopathology 2014, 104, 188–195. [Google Scholar] [CrossRef] [PubMed]
  49. Dotti, I.; Bonin, S. Integrity assessment of nucleic acids. In Guidel. Mol. Anal. Arch. Tissues: Springer: Berlin, Heidelberg, 2011, pp. 81–85.
  50. Gallagher, S.R.; Desjardins, P.R. Quantitation of DNA and RNA with absorption and fluorescence spectroscopy. Curr. Protoc. Mol. Biol. 2006, 76, A.3D.1–A.3D.21. [Google Scholar] [CrossRef]
  51. Schultheiss, O.C.; Stanton, S.J. Assessment of salivary hormones. In Methods Soc. Neurosci.; Guilford Press: New York, NY, USA, 2009; pp. 17–44. [Google Scholar]
  52. Tan, S.-h.; Osman, F.; Bodaghi, S.; Dang, T.; Greer, G.; Huang, A.; Hammado, S.; Abu-Hajar, S.; Campos, R.; Vidalakis, G. Full genome characterization of 12 citrus tatter leaf virus isolates for the development of a detection assay. PLoS ONE 2019, 14, e0223958. [Google Scholar] [CrossRef]
  53. Mason, M.G.; Botella, J.R. Rapid (30-second), equipment-free purification of nucleic acids using easy-to-make dipsticks. Nat. Protoc. 2020, 15, 3663–3677. [Google Scholar] [CrossRef] [PubMed]
  54. Alaeddini, R. Forensic implications of PCR inhibition—A review. Forensic Sci. Int. Genet. 2012, 6, 297–305. [Google Scholar] [CrossRef] [PubMed]
  55. Wang, H.; Qi, J.; Xiao, D.; Wang, Z.; Tian, K. A re-evaluation of dilution for eliminating PCR inhibition in soil DNA samples. Soil Biol. Biochem. 2017, 106, 109–118. [Google Scholar] [CrossRef]
  56. Ambers, A.; Wiley, R.; Novroski, N.; Budowle, B. Direct PCR amplification of DNA from human bloodstains, saliva, and touch samples collected with microFLOQ® swabs. Forensic Sci. Int. Genet. 2018, 32, 80–87. [Google Scholar] [CrossRef] [PubMed]
  57. Merindol, N.; Pépin, G.; Marchand, C.; Rheault, M.; Peterson, C.; Poirier, A.; Houle, C.; Germain, H.; Danylo, A. SARS-CoV-2 detection by direct rRT-PCR without RNA extraction. J. Clin. Virol. 2020, 128, 104423. [Google Scholar] [CrossRef] [PubMed]
  58. Hasan, M.R.; Mirza, F.; Al-Hail, H.; Sundararaju, S.; Xaba, T.; Iqbal, M.; Alhussain, H.; Yassine, H.M.; Perez-Lopez, A.; Tang, P. Detection of SARS-CoV-2 RNA by direct RT-qPCR on nasopharyngeal specimens without extraction of viral RNA. PLoS ONE 2020, 15, e0236564. [Google Scholar]
  59. Wee, S.K.; Sivalingam, S.P.; Yap, E.P.H. Rapid direct nucleic acid amplification test without RNA extraction for SARS-CoV-2 using a portable PCR thermocycler. Genes 2020, 11, 664. [Google Scholar] [CrossRef] [PubMed]
  60. Heikrujam, J.; Kishor, R.; Mazumder, P.B. The chemistry behind plant DNA isolation protocols. Biochem. Anal. Tools–Methods Bio-Mol. Stud 2020, 8, 131–141. [Google Scholar]
  61. Madhad, V.J.; Sentheil, K. The Rapid & Non-Enzymatic isolation of DNA from the Human peripheral whole blood suitable for Genotyping. Eur. J. Biotechnol. Biosci. 2014, 1, 1–16. [Google Scholar]
  62. Gan, W.; Gu, Y.; Han, J.; Li, C.-x.; Sun, J.; Liu, P. Chitosan-modified filter paper for nucleic acid extraction and “in situ PCR” on a thermoplastic microchip. Anal. Chem. 2017, 89, 3568–3575. [Google Scholar] [CrossRef]
  63. Cheng, Y.-J.; Guo, W.-W.; Yi, H.-L.; Pang, X.-M.; Deng, X. An efficient protocol for genomic DNA extraction from Citrus species. Plant Mol. Biol. Report. 2003, 21, 177–178. [Google Scholar] [CrossRef]
Figure 1. Stepwise miniaturization and development of key components in sample lysis and nucleic acid extraction toward portable sample preparation strategies. (a) Conventional benchtop process including a mortar and pestle for grinding leaf petiole and midvein, refrigerated centrifugation for settling plant debris, multistep nucleic acids extraction, and RT–qPCR assay for pathogen detection and quantification. (b) Proposed processes toward miniaturization: (i) verification of OmniLyse micro-homogenizer to replace manual mortar and pestle grinding, (ii) direct RT–qPCR assays using serial dilution of crude lysates to eliminate nucleic acid extraction, and (iii) incorporation of untreated chromatography paper to replace benchtop extraction machine.
Chemosensors 12 00105 g001
Figure 2. Schematic illustration of tissue lysis using OmniLyse micro-homogenizer. (a) OmniLyse micro-homogenizer features a motor-driven impeller that macerates plant tissues with the help of added ceramic microbeads. Lysate is collected using a syringe with a metallic mesh filter to exclude microbeads and large plant debris. (b) Image of OmniLyse micro-homogenizer (left), cutaway view showing the impeller (middle), and top view (right). (c) Image of chopped petioles and midveins from citrus leaf (left), SEM images of ceramic microbeads (right).
Chemosensors 12 00105 g002
Figure 3. Optimization of operating conditions of OmniLyse micro-homogenizer, including tissue/bead ratio and driving voltage. (a) Comparison of DNA and RNA concentrations and (b) absorption coefficients (A260 and A280) using different amounts of ceramic microbeads relative to 100 mg of plant tissues (6 V driving voltage, N = 3). (c) Comparison of DNA and RNA concentrations and (d) absorption coefficients (A260 and A280) at varying driving voltages (tissue/bead ratio = 1:3, N = 3). All the above cases were macerated for 5 min. NBC: no-bead control—no microbeads added. VC: vortex control—samples in microcentrifuge tubes without microbeads and mixed for 5 min using a benchtop vortex mixer. SC: static control—samples in microcentrifuge tubes without microbeads and sat stationary for 5 min. GC: grinding control—samples processed by manual mortar-and-pestle grinding.
Chemosensors 12 00105 g003
Figure 4. Validation of RNA extracts acquired from maceration with OmniLyse micro-homogenizer. (a) Evaluation of the efficacies of mortar-and-pestle grinding and micro-homogenizer maceration by comparing Cq values of CTV and COX (N = 18). (b) Cq vs. Log CTV copies based on RT–qPCR assay of CTV positive control (PC) and its serial dilutions (10−1–10−6), (N = 3).
Chemosensors 12 00105 g004
Figure 5. Evaluation of direct RT–qPCR assays using serial dilutions of crude lysates prepared with one of the lysis buffers: guanidine-based buffer (G), Tris HCl-based buffer (T), and nuclease-free water (H). By comparing the Cq values of CTV and COX from different treatments, statistical significances were found in G-100× vs. G-1000×, T-100×, and H-100× (N = 9). *** denotes p < 0.001.
Chemosensors 12 00105 g005
Figure 6. Characterization of the untreated chromatography paper disk. (a) Effects of paper soaking time on Cq values of CTV assay (N = 9). (b) Effects of elution buffers on resultant Cq values (N = 9). The species of elution buffers where three buffers were tested based on the optimal soaking time (5 min) acquired from (a) and evaluated by comparing the Cq values. ** and *** denote p < 0.01 and 0.001, respectively.
Chemosensors 12 00105 g006
Figure 7. Evaluation of the two sample preparation methods, MagMAX and untreated chromatography paper, by testing the resulting extracts of a number of citrus plants that are (a) healthy (N = 9), (b) infected with a single pathogen (N = 9), (c) infected with multiple pathogens (viroids, N = 8), and (d) infected with multiple pathogens (viruses, N = 9).
Chemosensors 12 00105 g007
Figure 8. Effects of storage conditions on nucleic acids stored on paper disks. Tested conditions included storage period (one week and one month) and temperature (room temperature (RT) and 4 °C). (a) Healthy plants. N = 9, except for 1mRT rough lemon (N = 6) and 1m RT citron (N = 6). (b) Single-infected plants. N = 9, except for 1w4C CEVd (N = 8), 1mRT CLBV (N = 20), 1mRT CPsV (N = 15), 1m4C CPsV (N = 15), 1mRT HSVd (N = 10), and 1mRT S. citri (N = 8). (c) Multi-infected plants with viroids. N = 9. (d) Multi-infected plants with viruses. N = 9, except for all 1wRT (N = 6), 1w4C CLBV (N = 8), and 1m4C CLBV (N = 6). All data are based on positive detections out of nine replicates. X denotes no successful detection.
Chemosensors 12 00105 g008
Table 1. Samples inoculated with different citrus pathogens in this study.
CategorySource NumberSource PlantCitrus Pathogen/Isolate
Single infection2987-32Pineapple sweet orangeCTV/T517
Not availableUnknownCPsV/P202
3069-1Sweet orangeCLBV
2765-1Madam vinus sweet orange CEVd
2765-4Madam vinus sweet orange CVd-IIa a/E818
3200-1Madam vinus sweet orange CVd-IV b
Not availablePineapple sweet orangeS. citri/C189
Multiple infection3300-7Madam vinus sweet orange CLBV + CTV + CPsV
3210-44Madam vinus sweet orangeCEVd + CVdII + CVdIV
3210-46Madam vinus sweet orangeCEVd + CVdII + CVdIV
3207-8Madam vinus sweet orangeCEVd + CBCVd + HSVd + CBLVd + CDVd + CVd-V
CTV: Citrus tristeza virus; CPsV: Citrus psorosis virus; CLBV: Citrus leaf blotch virus; CEVd: Citrus exocortis viroid; CBCVd: Citrus bark cracking viroid; HSVd: Hop stunt viroid; S. citri: Spiroplasma citri. a CVd-IIa is a HSVd variant [46]. b CVd-IV (also known as CBCVd) is a chimeric recombinant of CEVd and HSVd [47].
Disclaimer/Publisher’s Note: The statements, opinions and data contained in all publications are solely those of the individual author(s) and contributor(s) and not of MDPI and/or the editor(s). MDPI and/or the editor(s) disclaim responsibility for any injury to people or property resulting from any ideas, methods, instructions or products referred to in the content.