A “Turn-Off” Pyrene-Based Ligand as a Fluorescent Sensor for the Detection of Cu2+ and Fe2+ Ions: Synthesis and Application in Real Water Samples, Logic Gate Construction, and Bio-Imaging


Abstract
1. Introduction
2. Materials and Methods
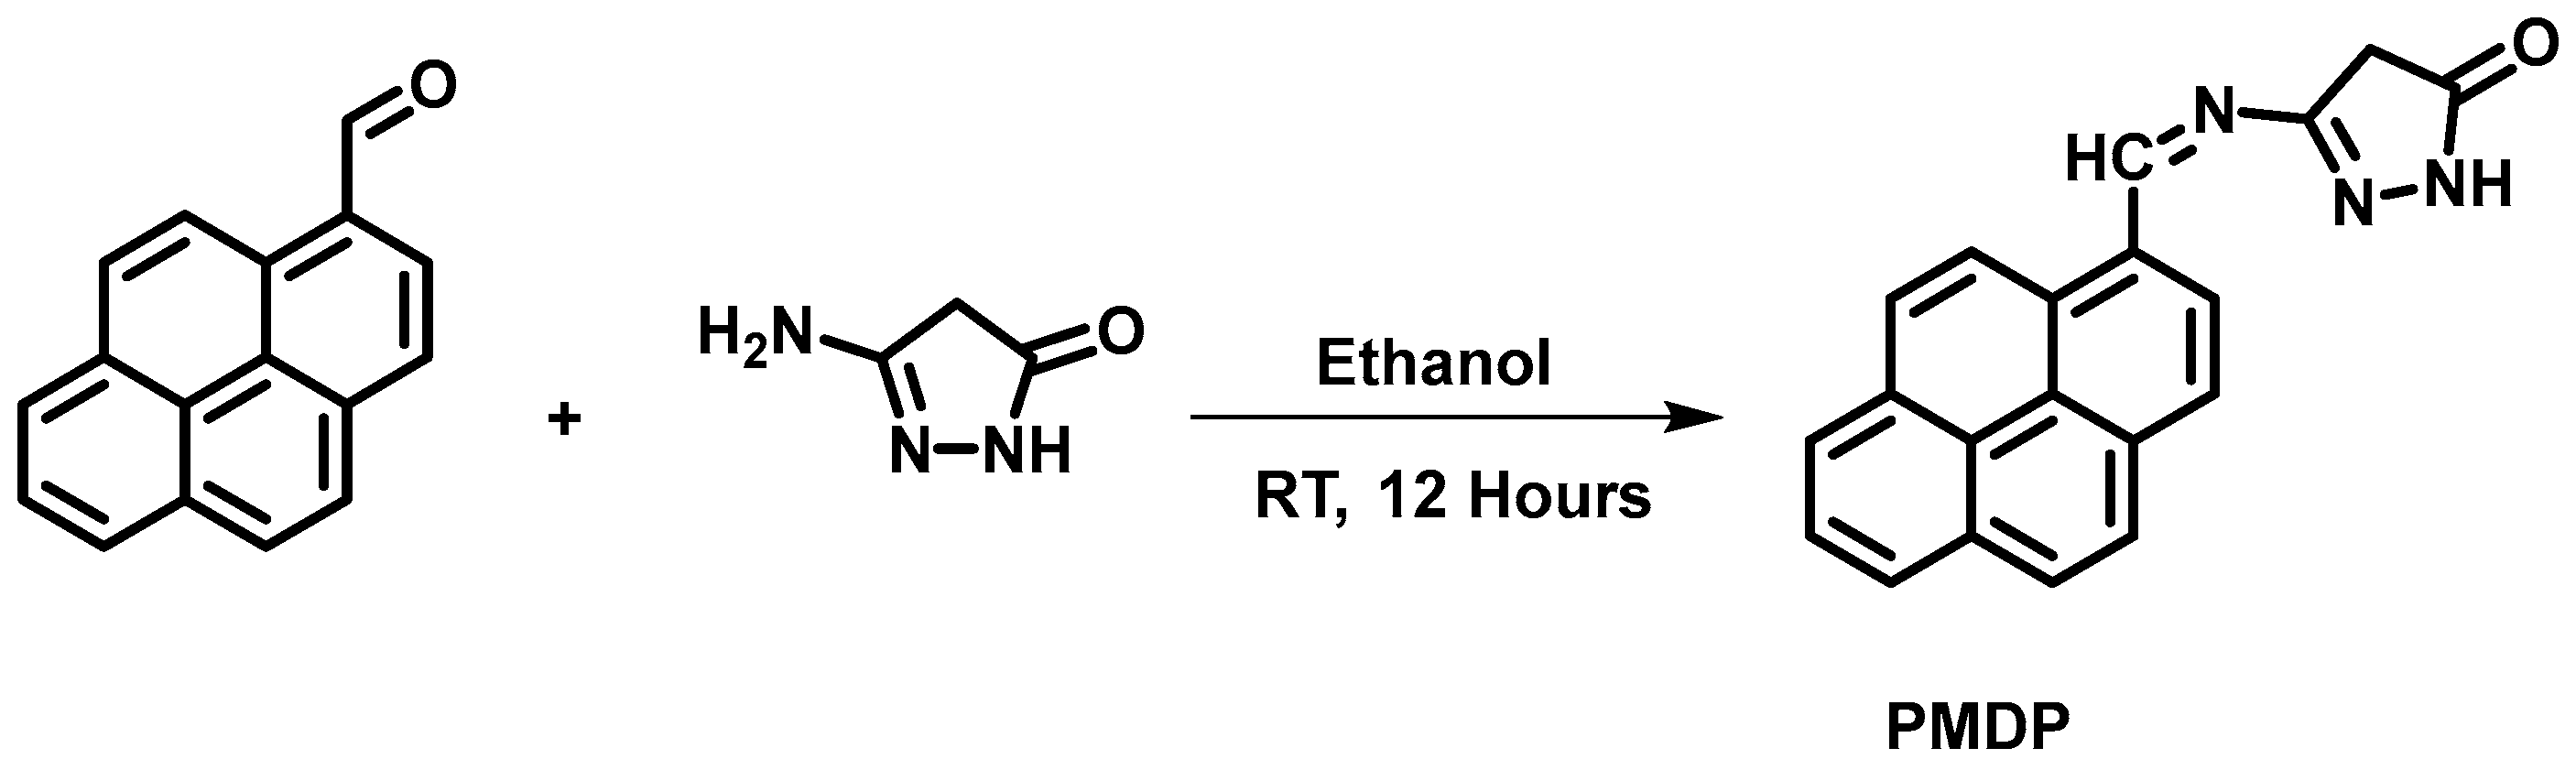
2.1. Synthesis of Ligand (PMDP)
2.2. Synthesis of Metal Complexes
2.3. Cytotoxicity Assay and Cell Imaging
3. Results and Discussions
3.1. UV–Visible Titration Studies
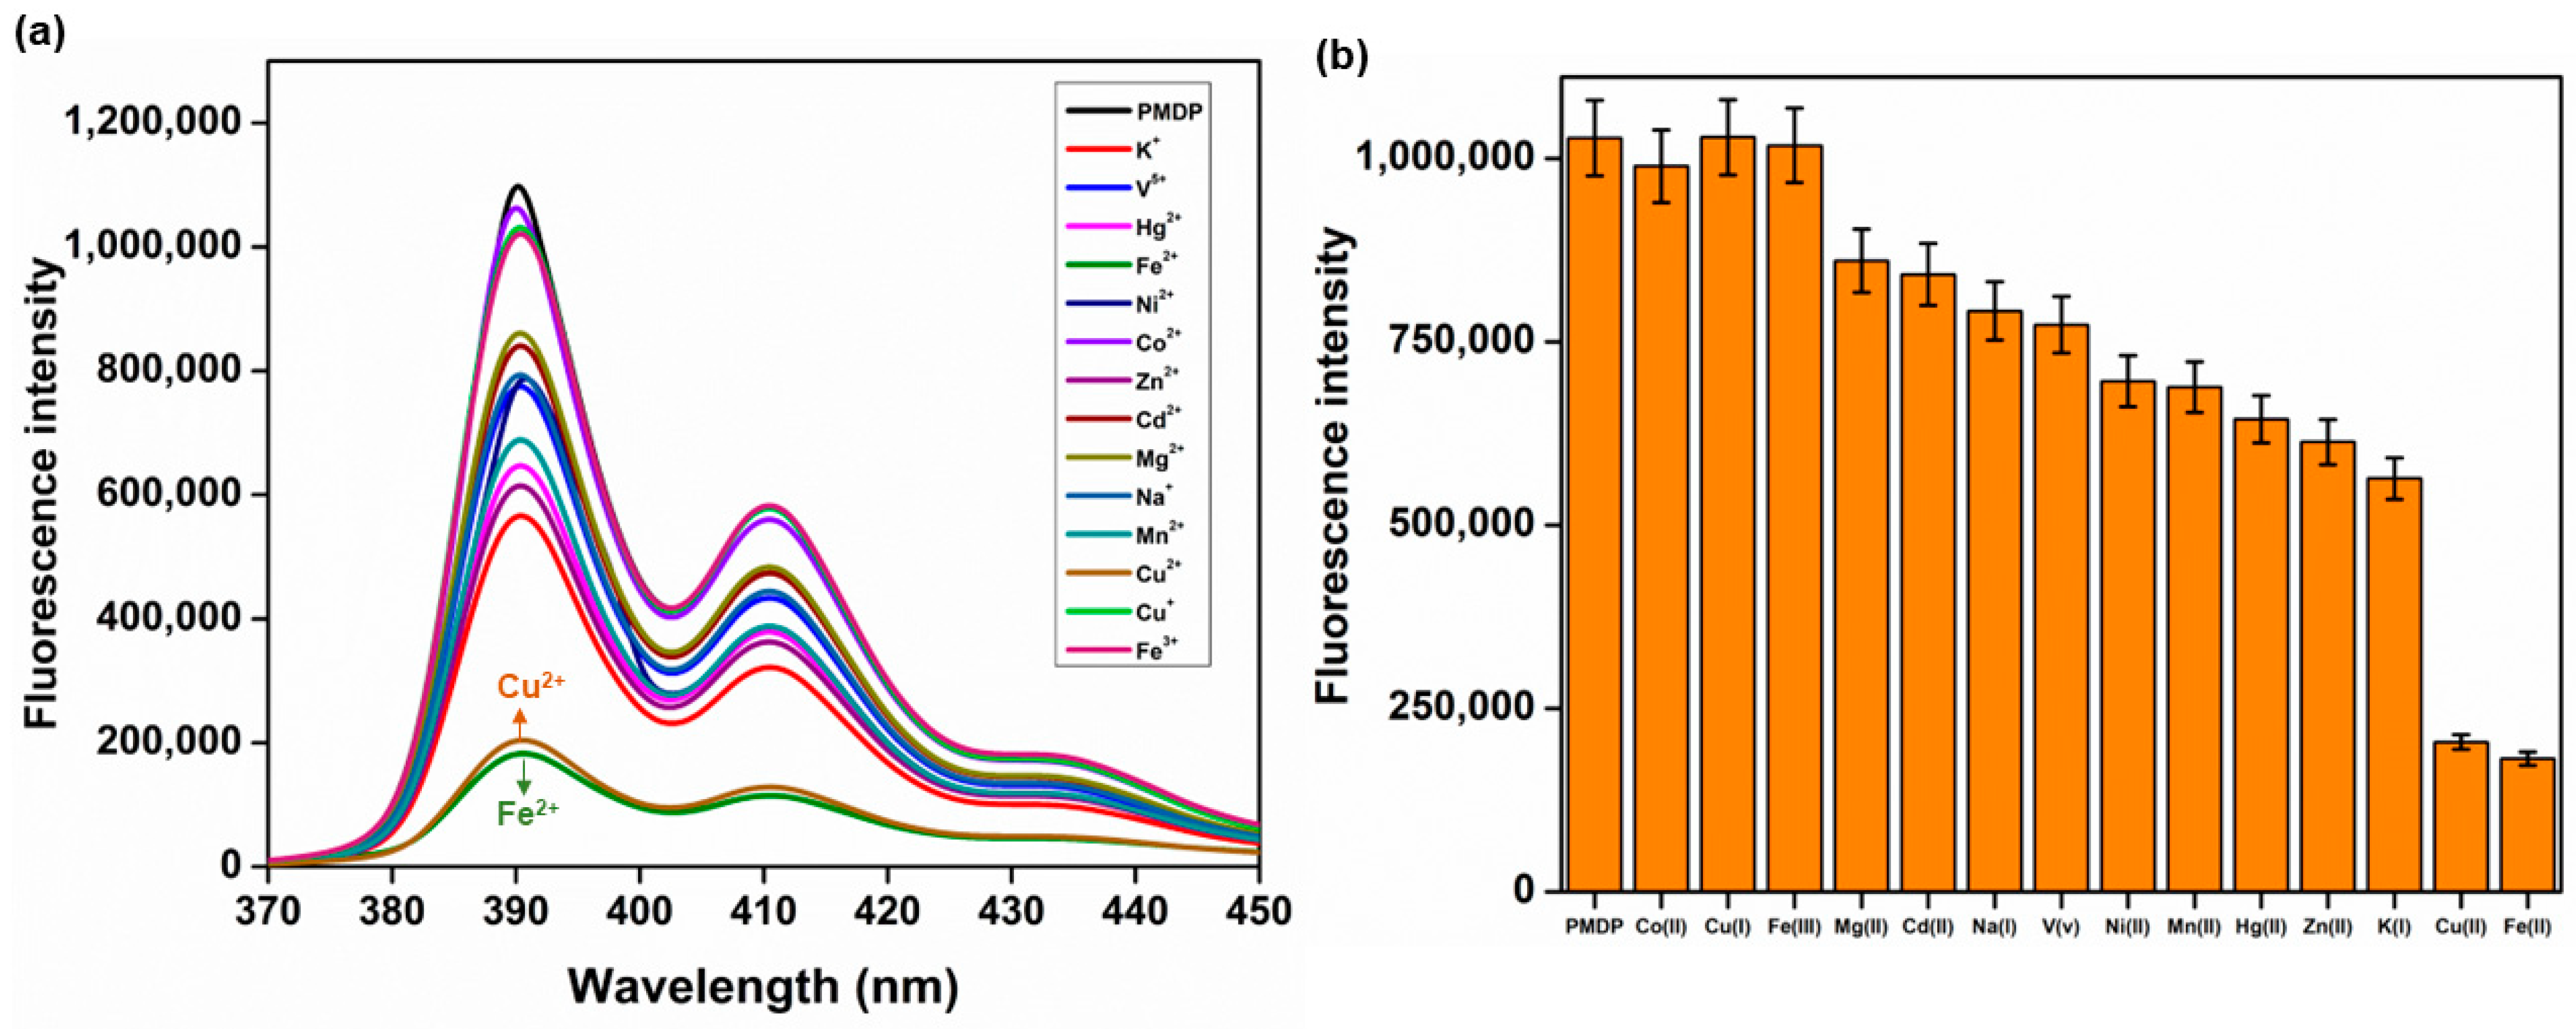
3.2. Fluorescence Studies
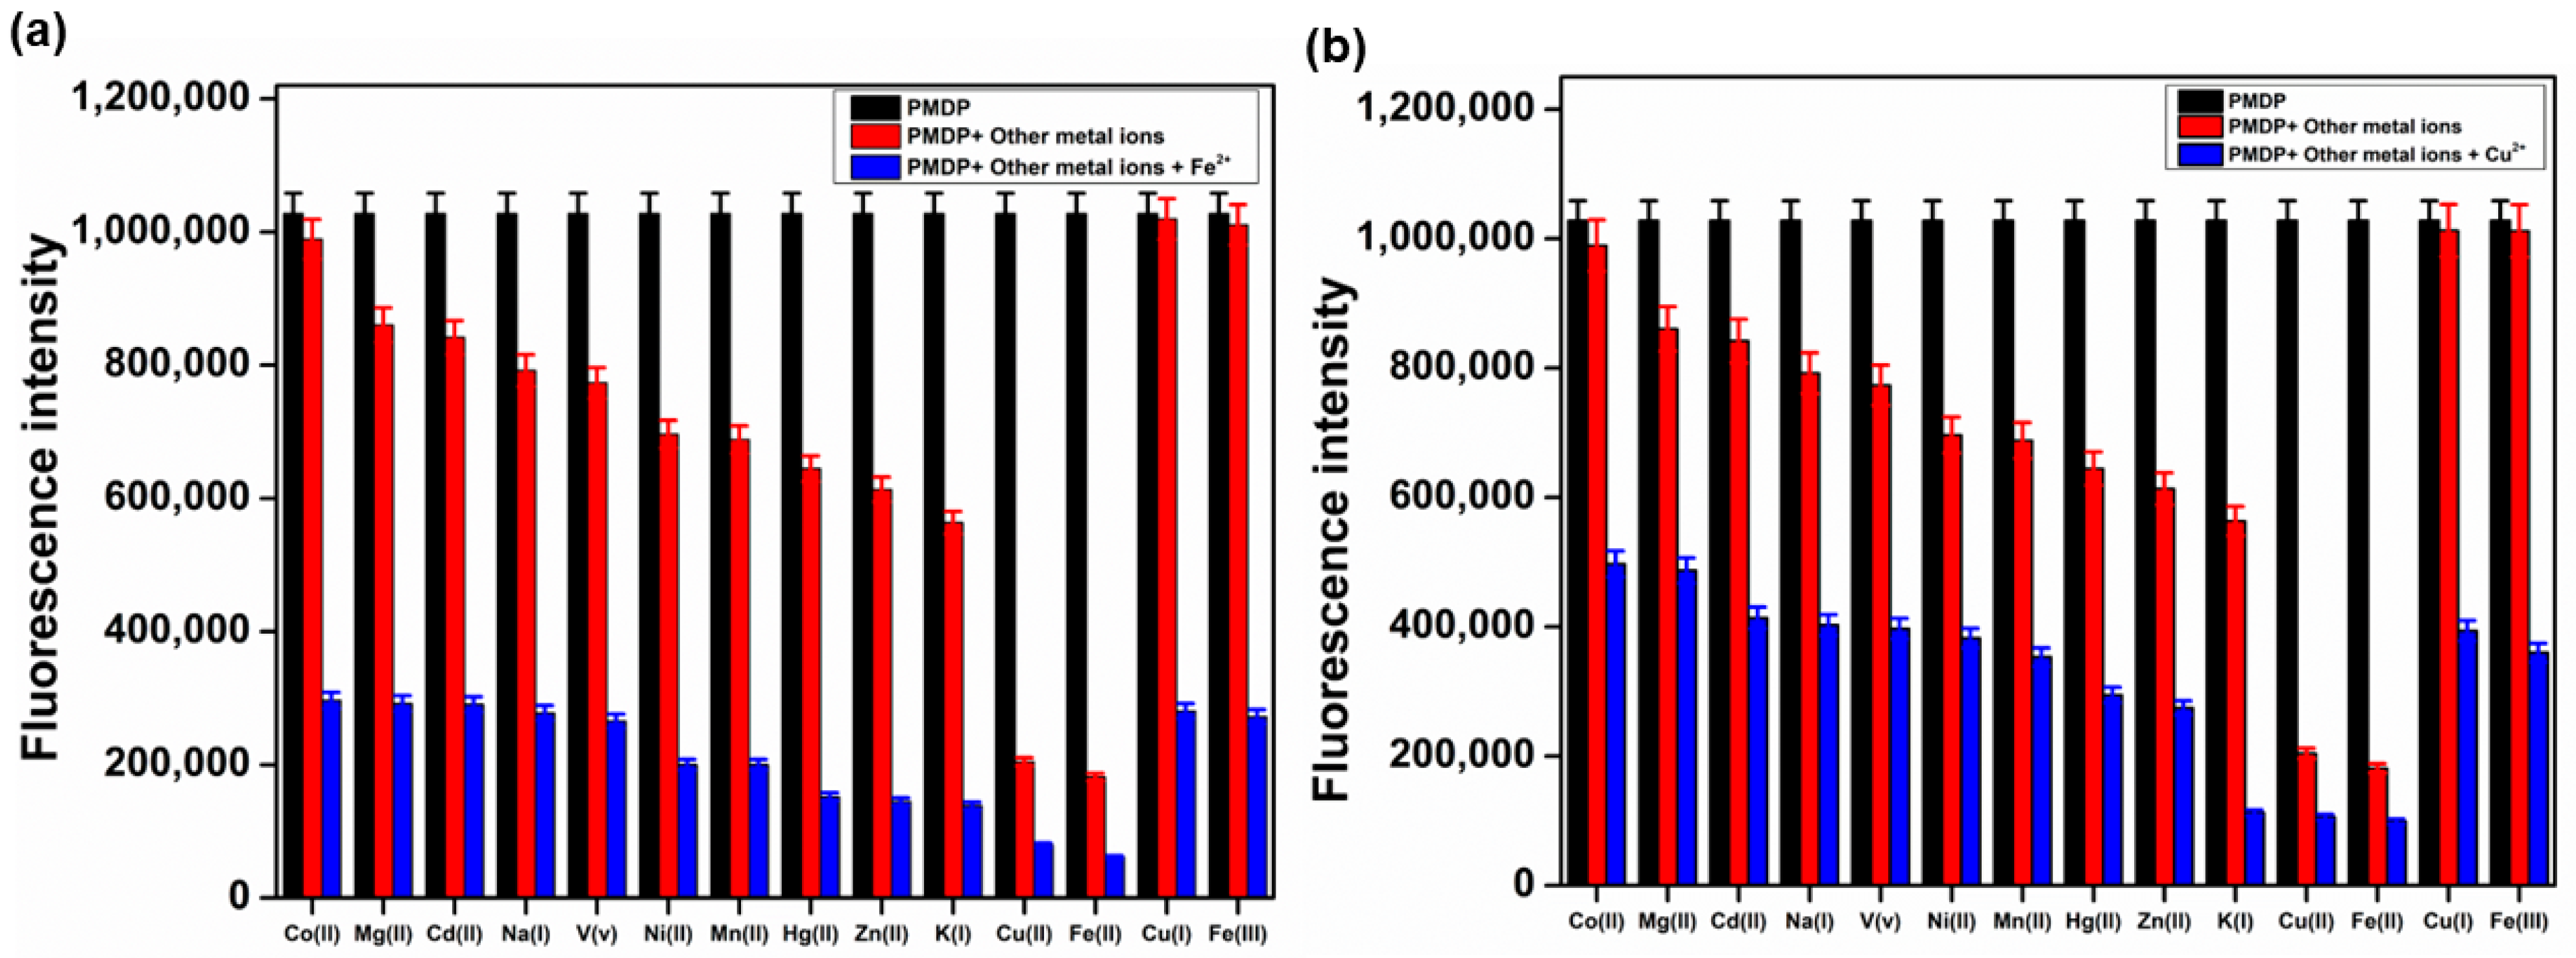
3.3. Competitive Studies
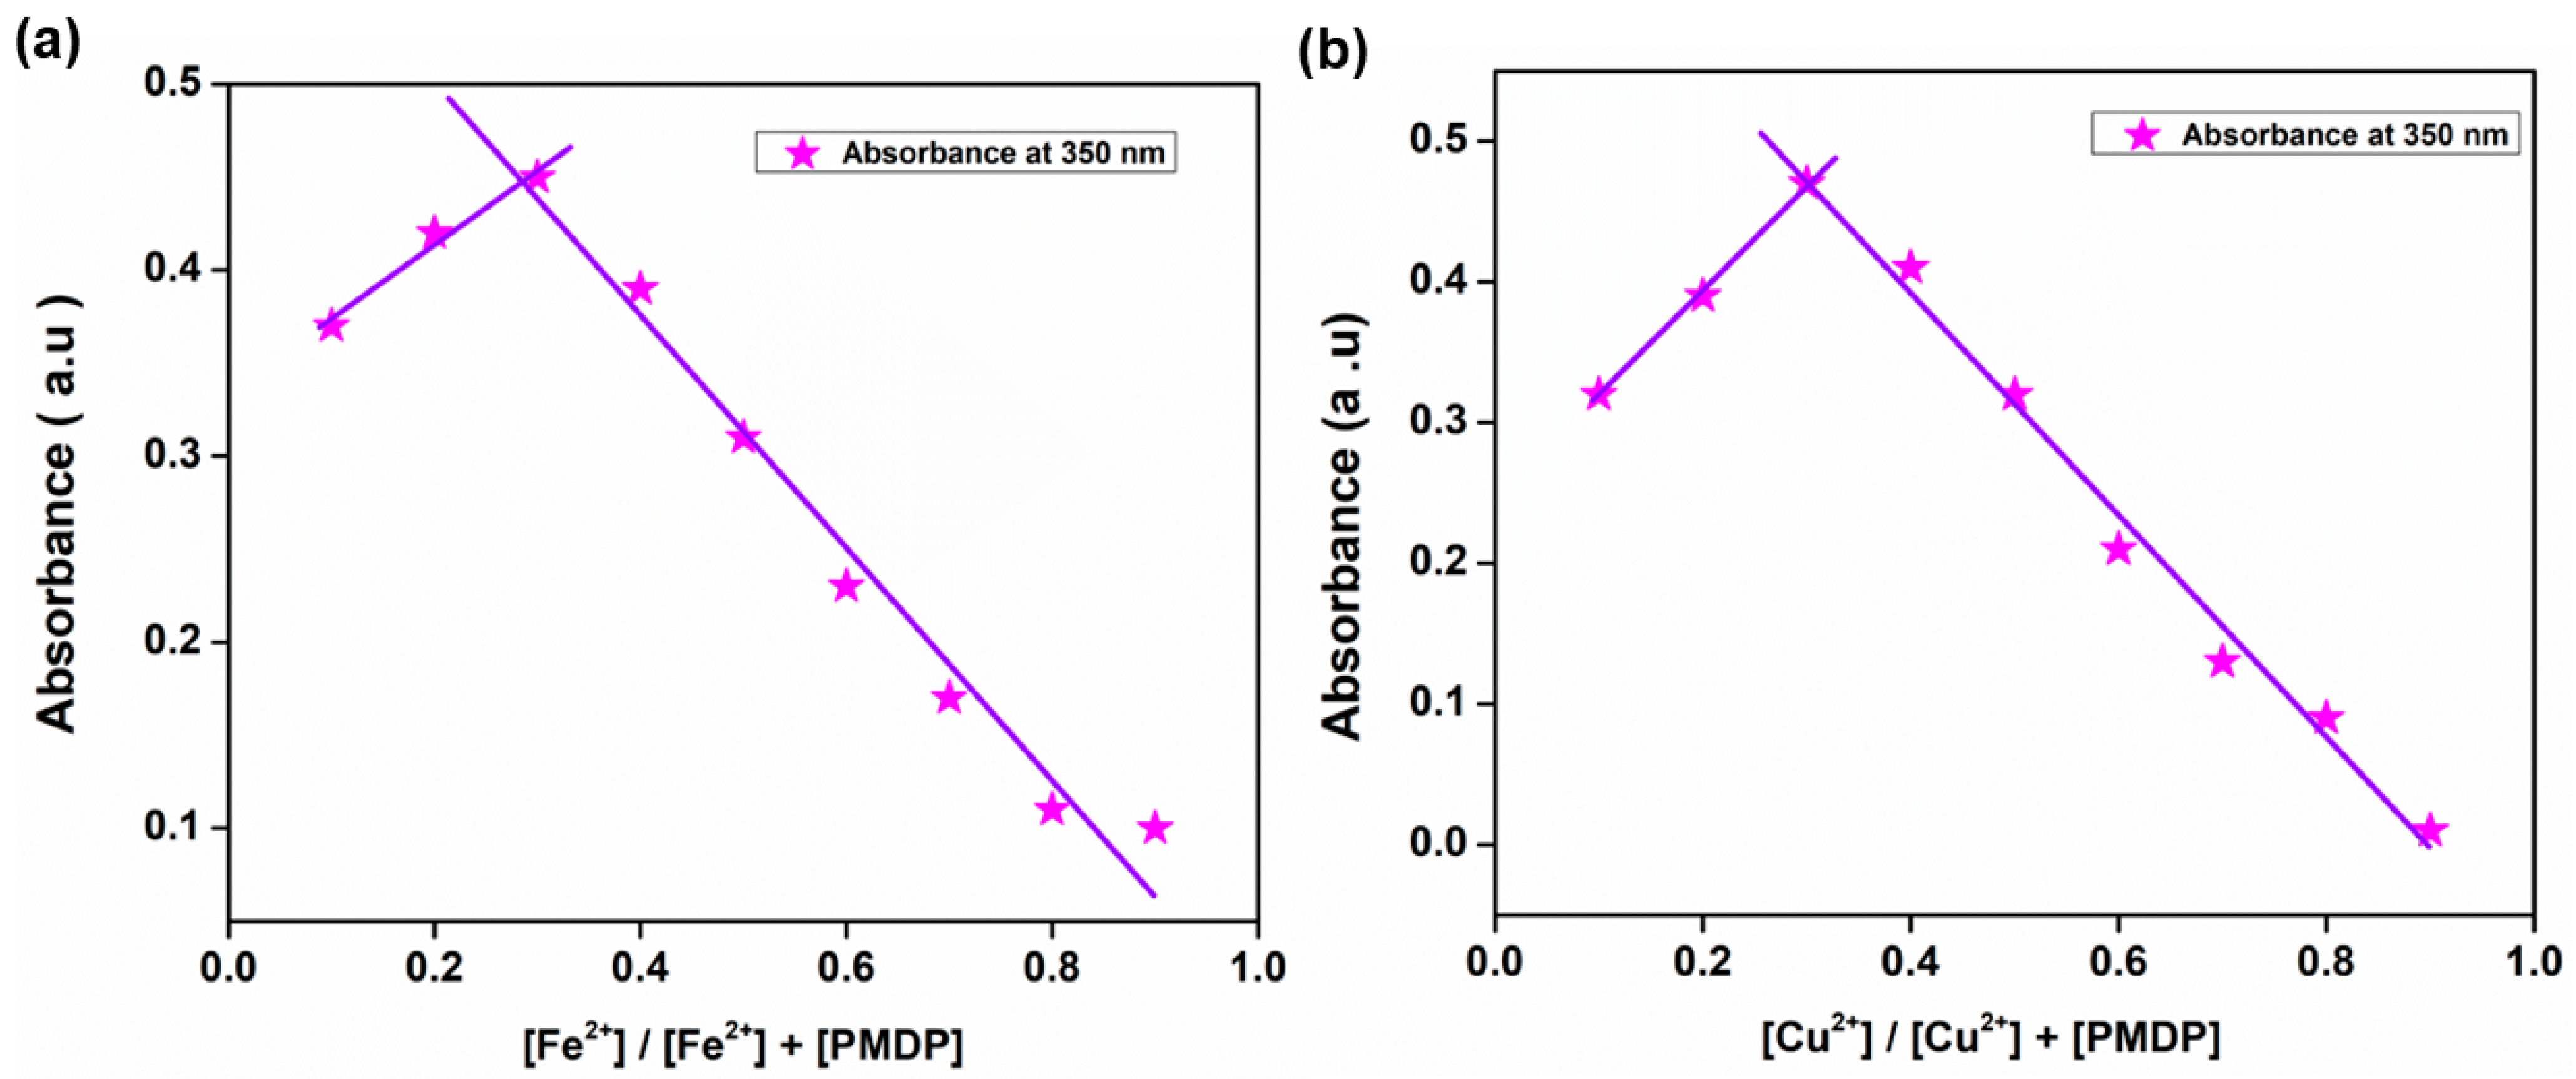
3.4. Job’s Plot
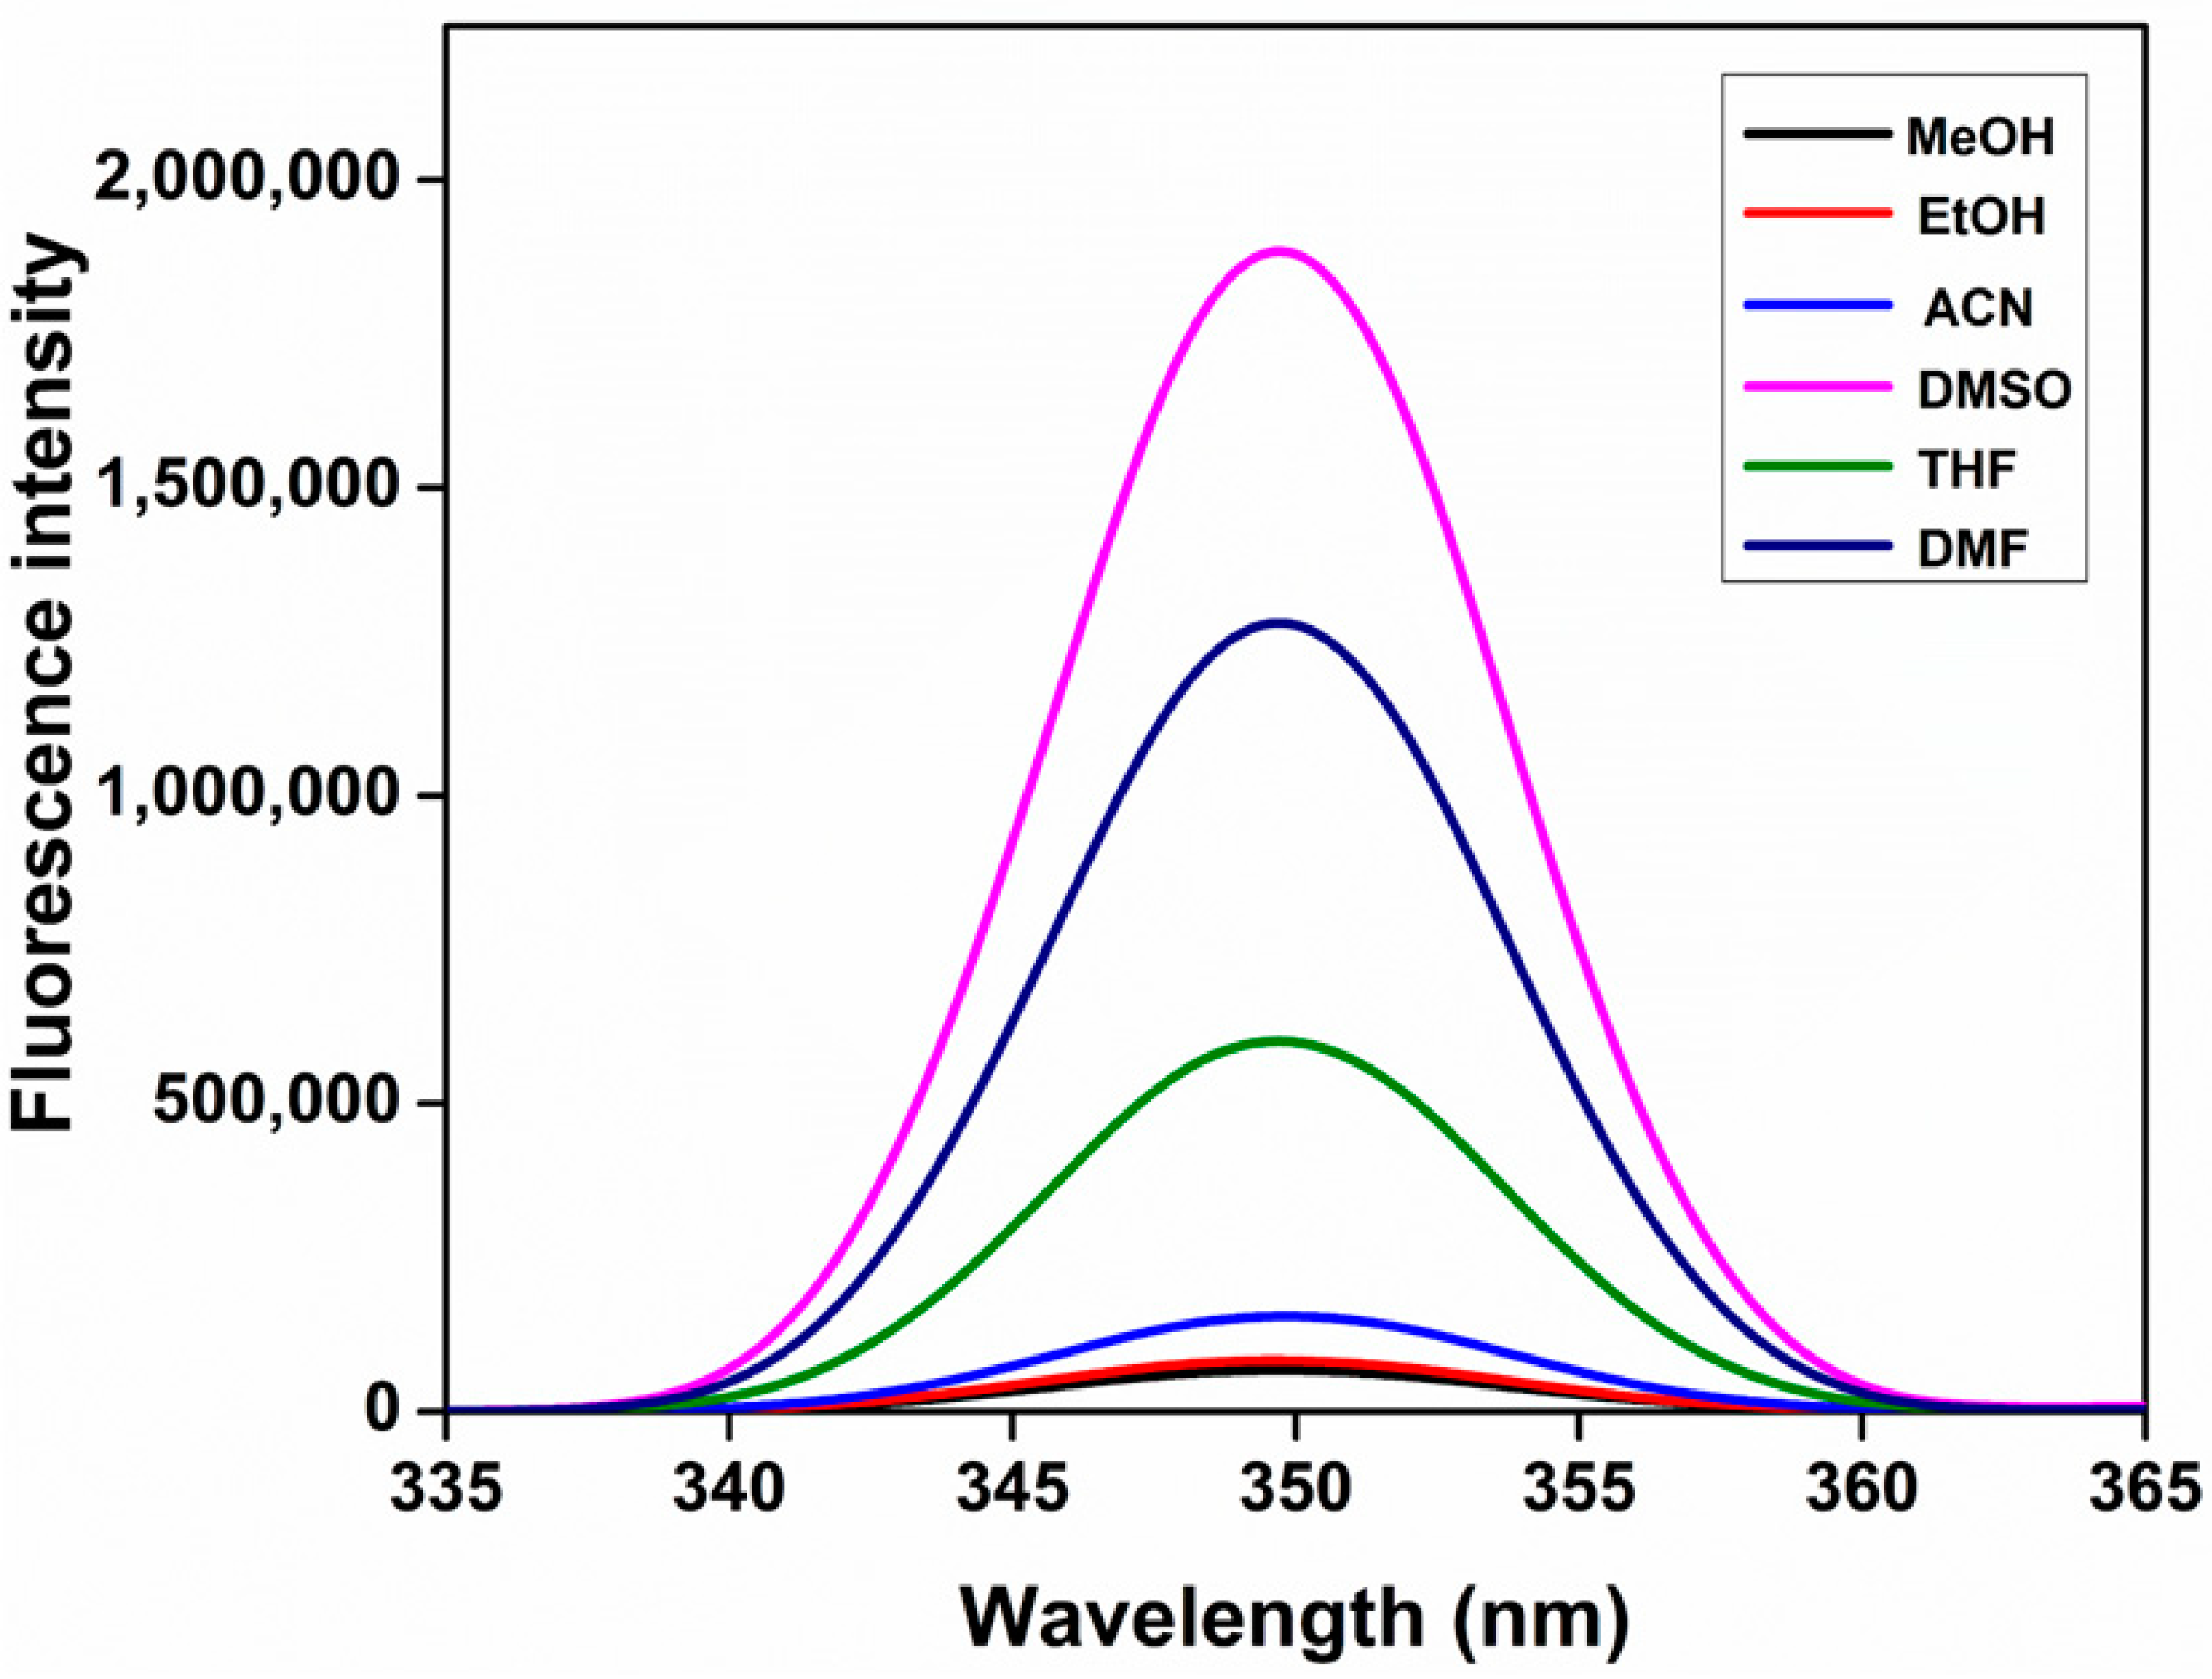
3.5. Solvent Effect
3.6. Stern–Volmer Analysis
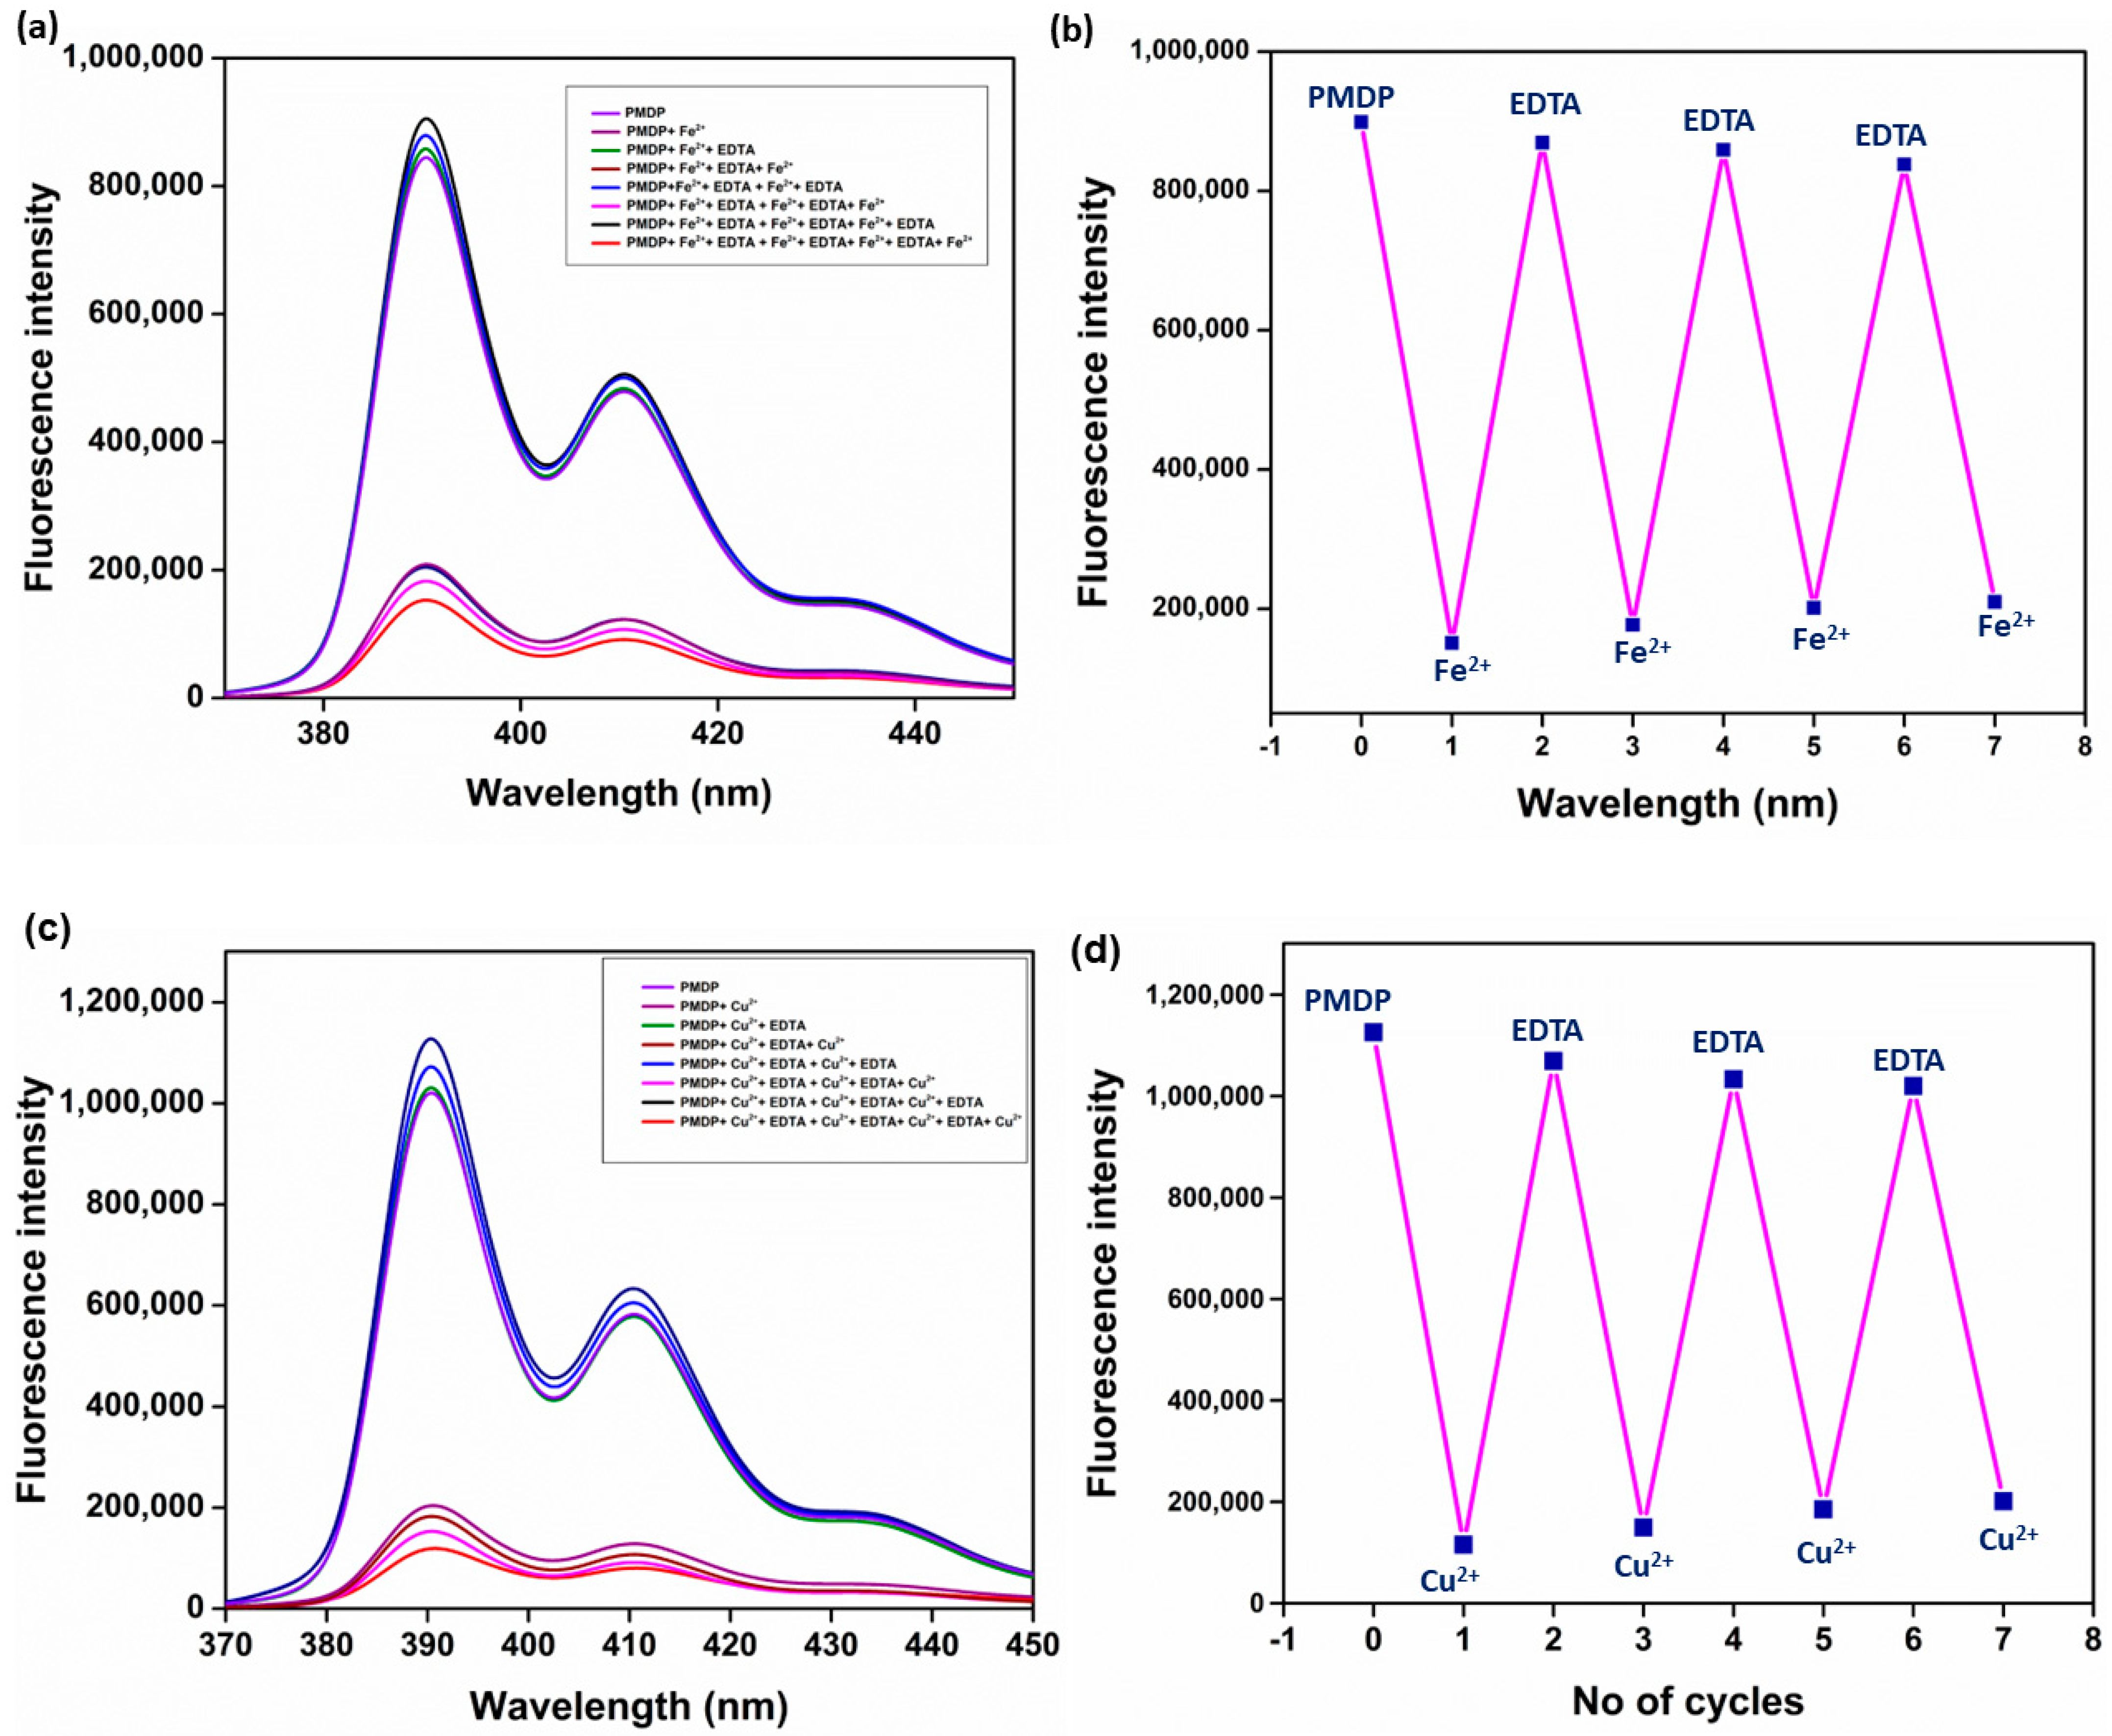
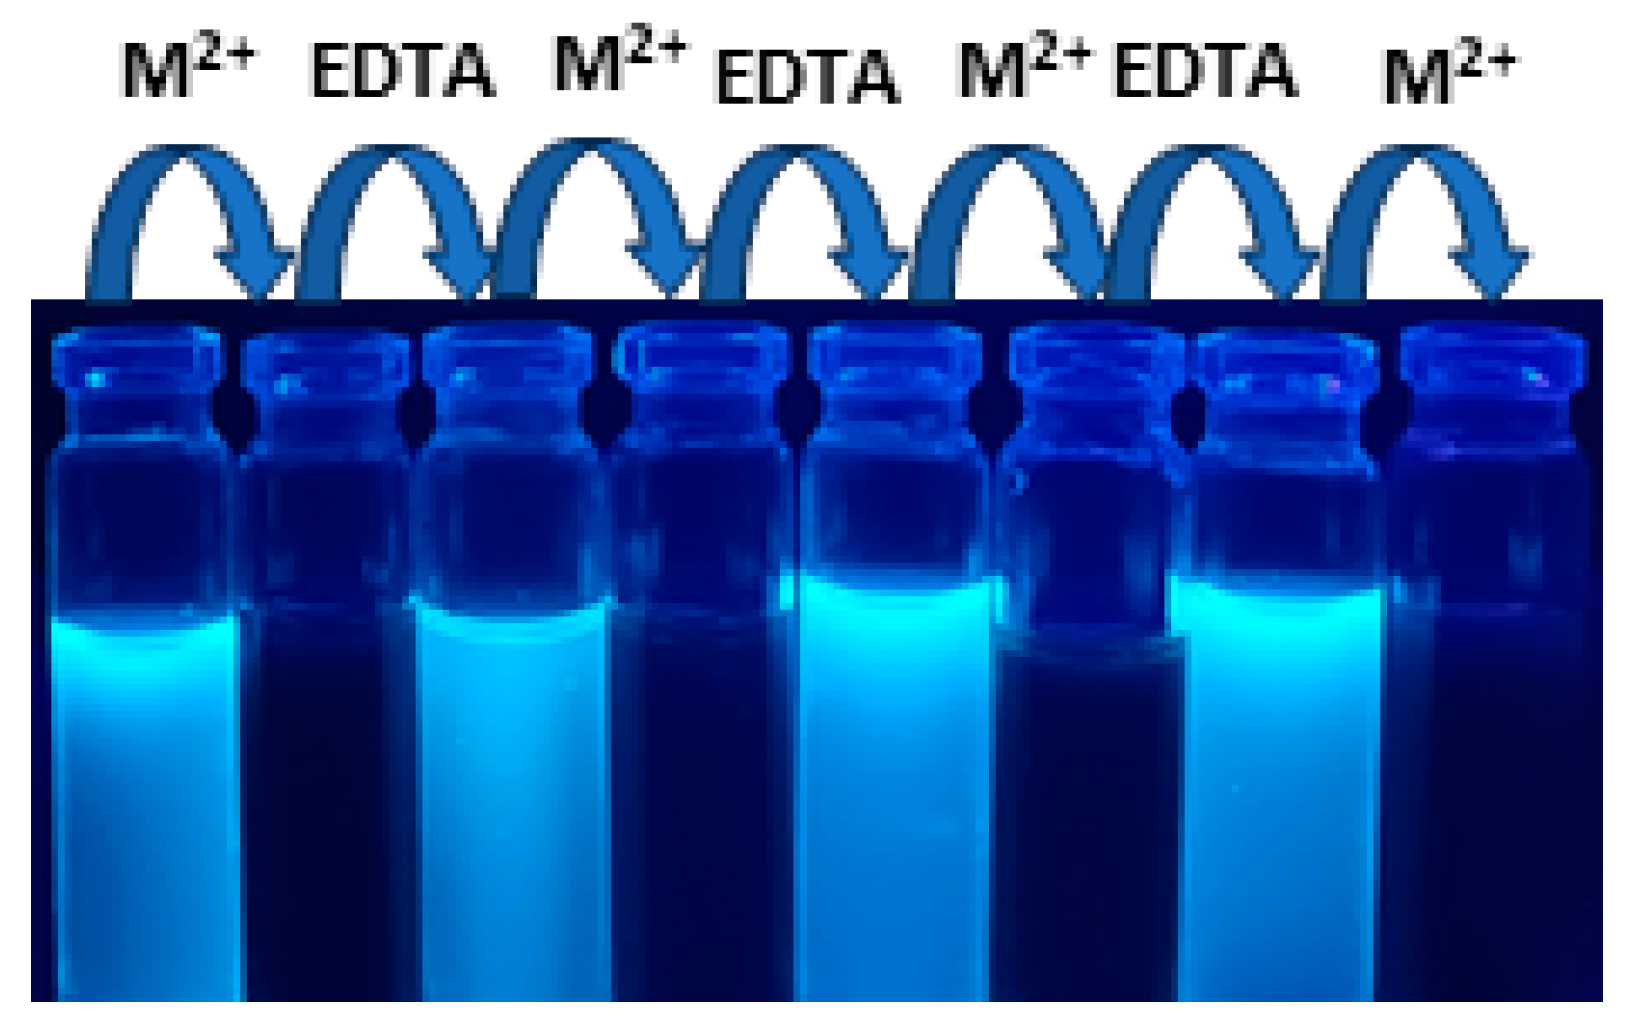
3.7. Reversible Nature of PMDP
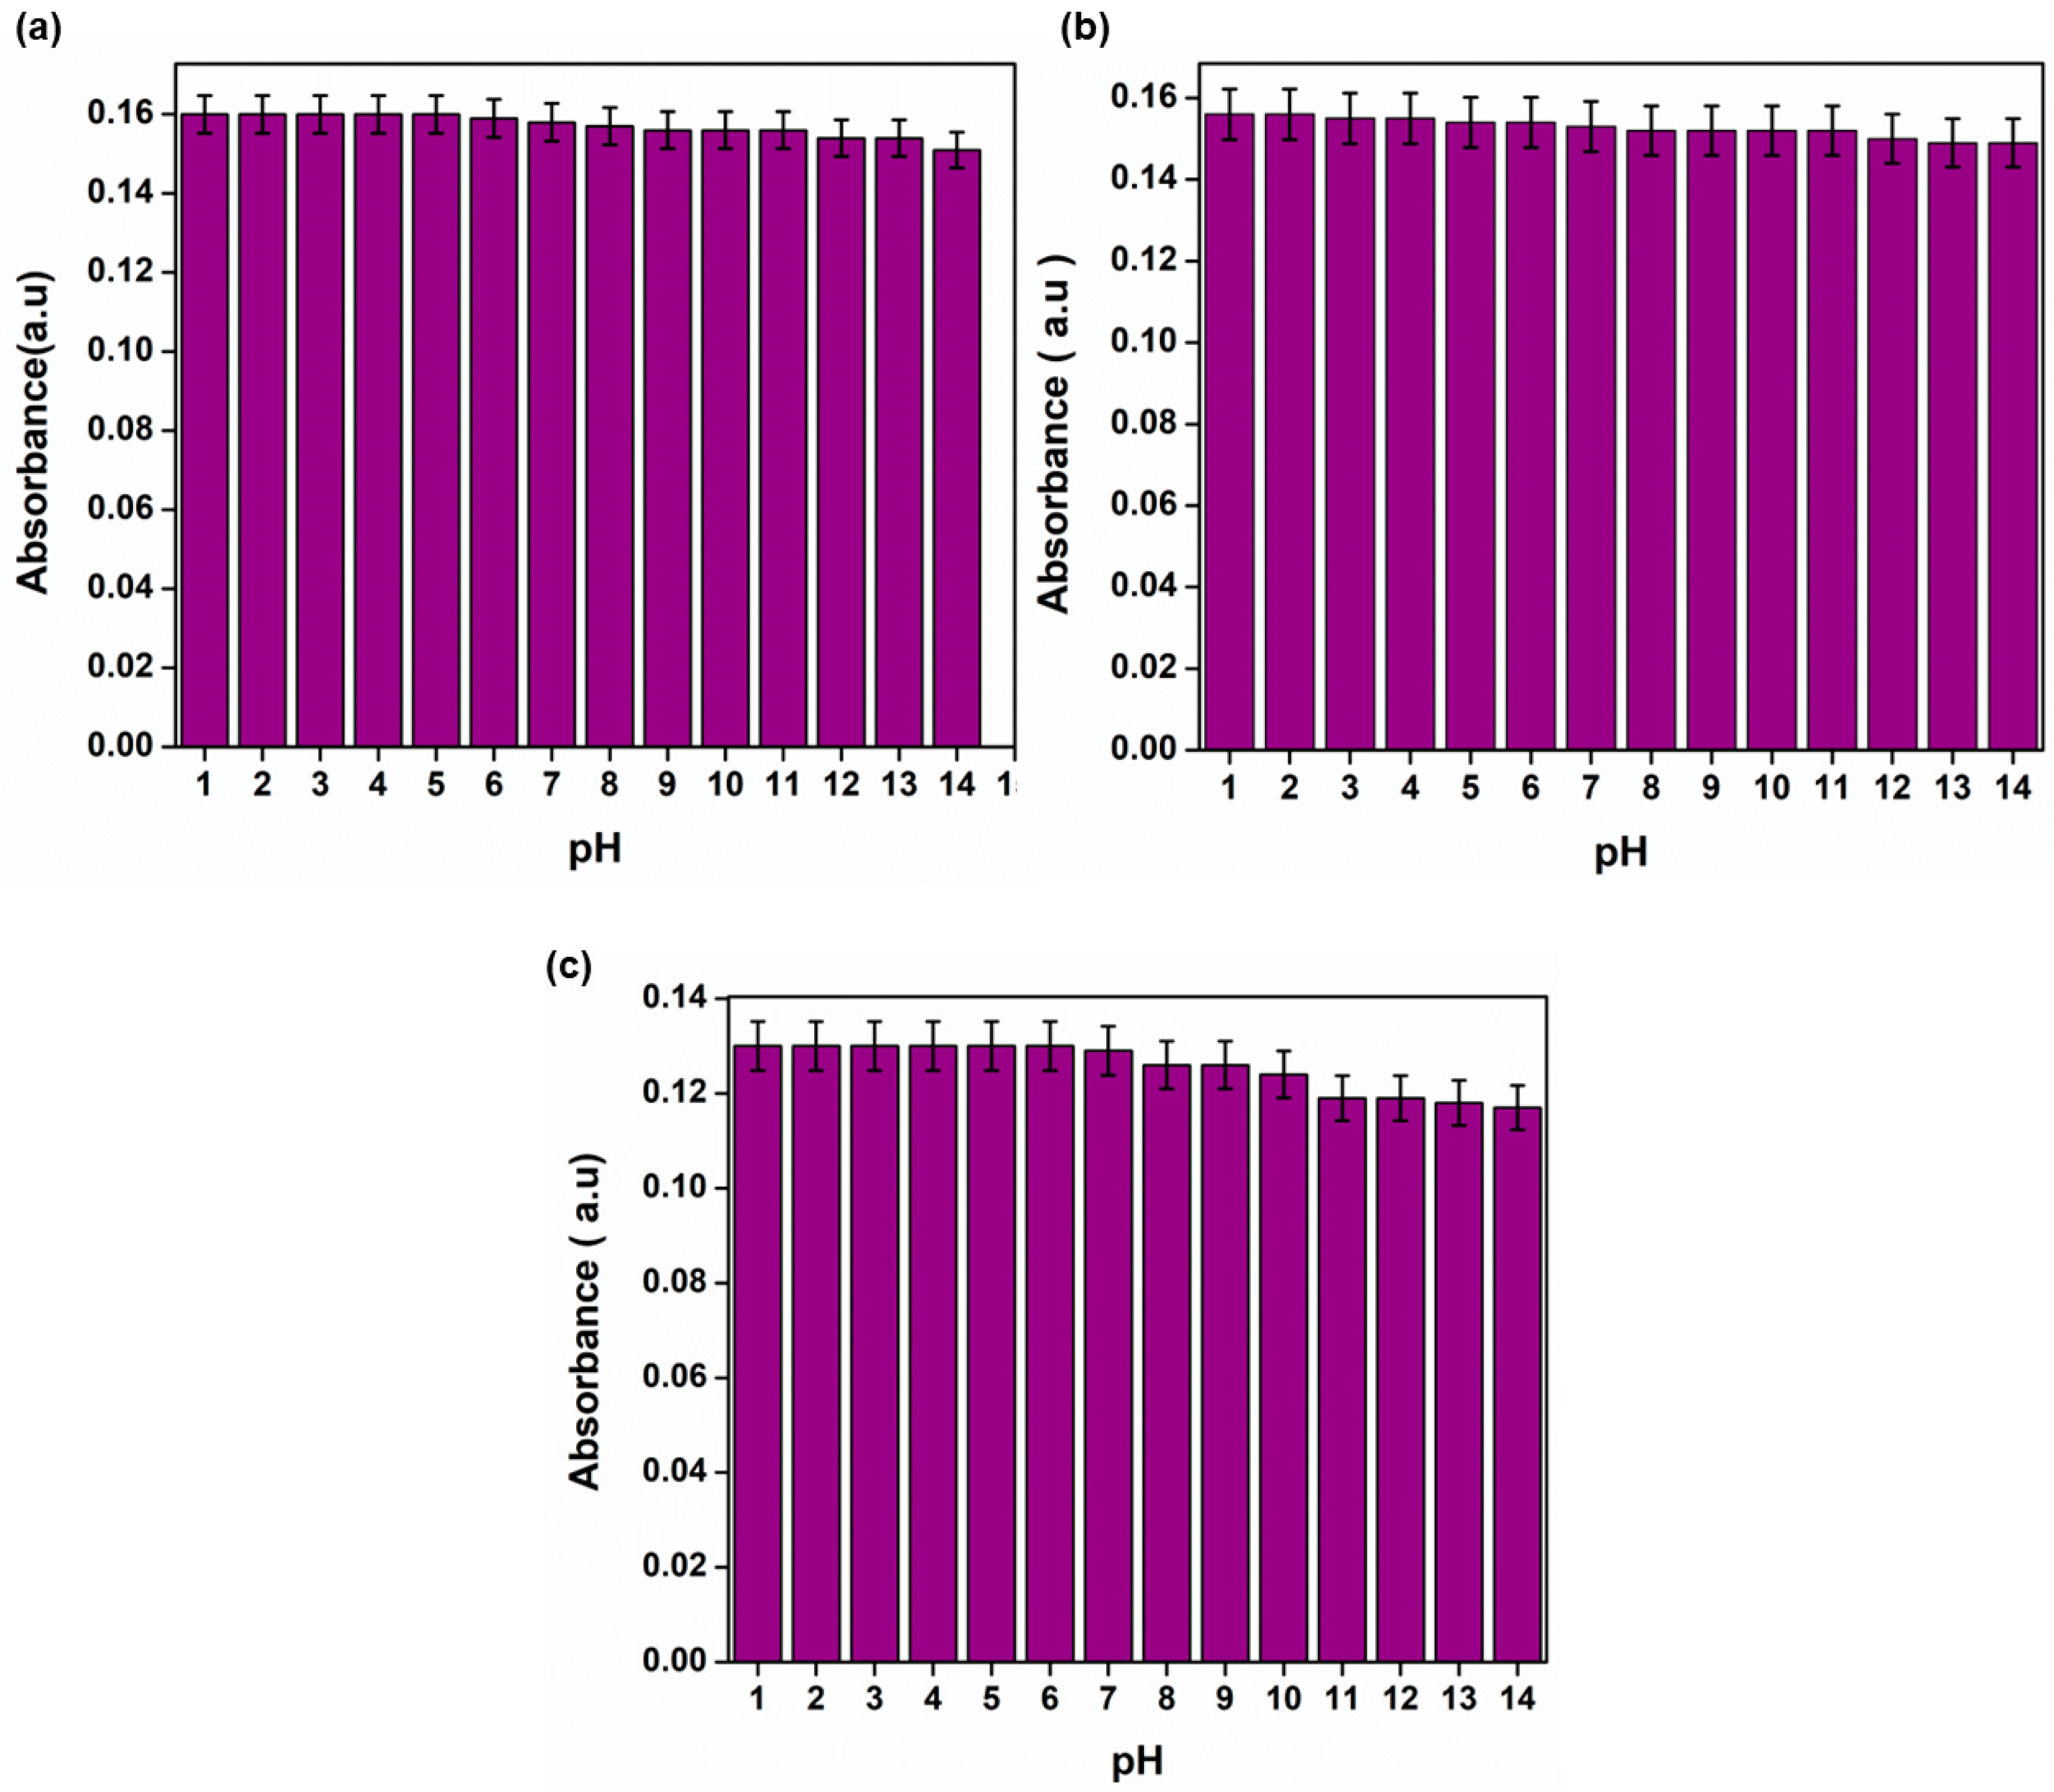
3.8. pH Effect
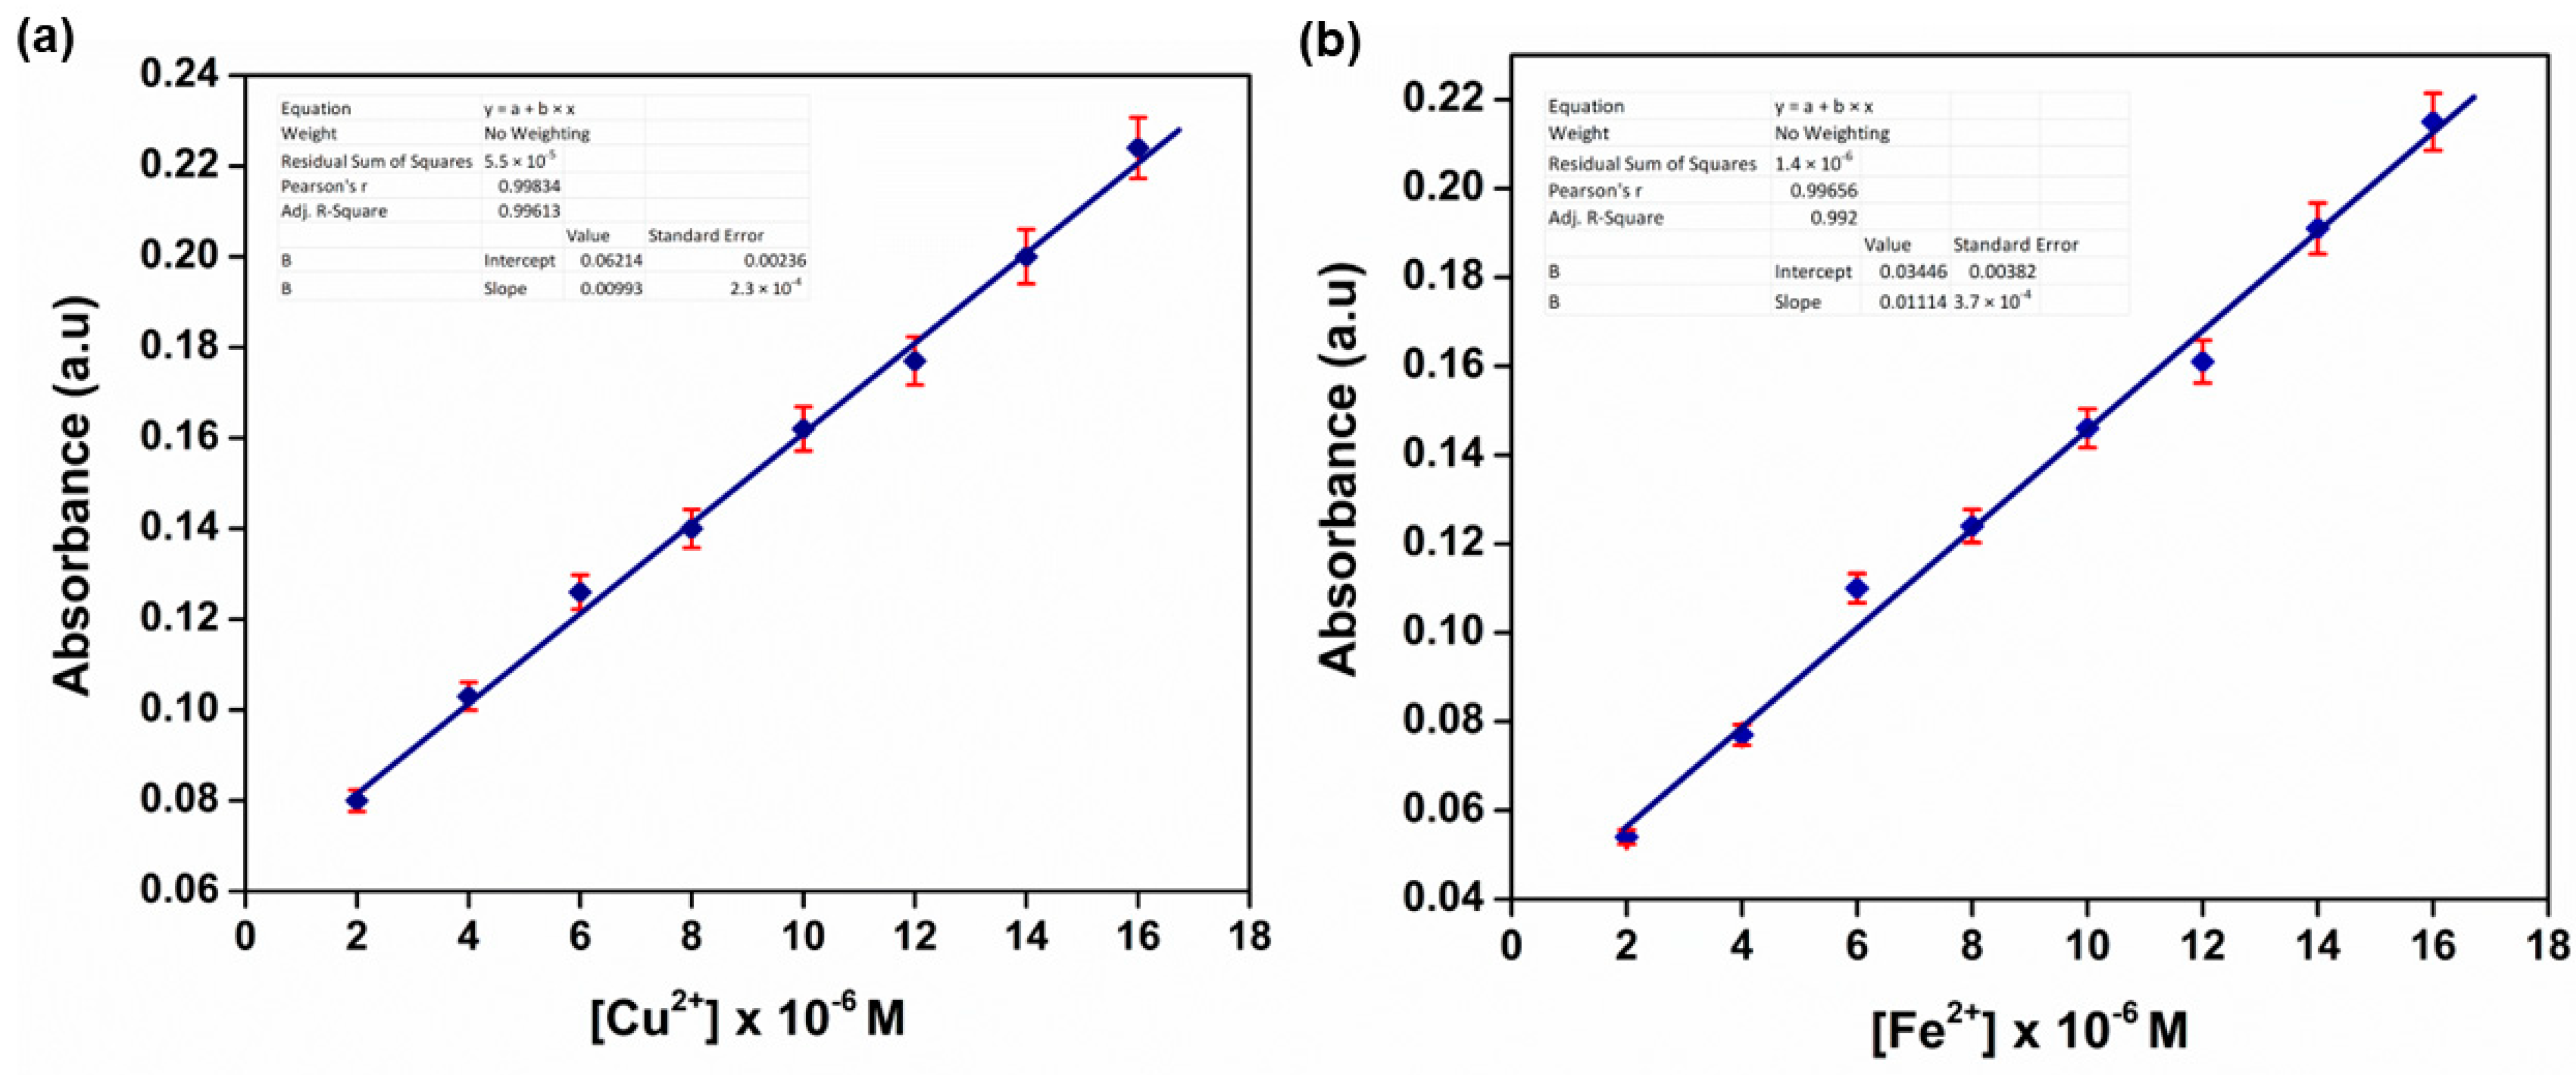
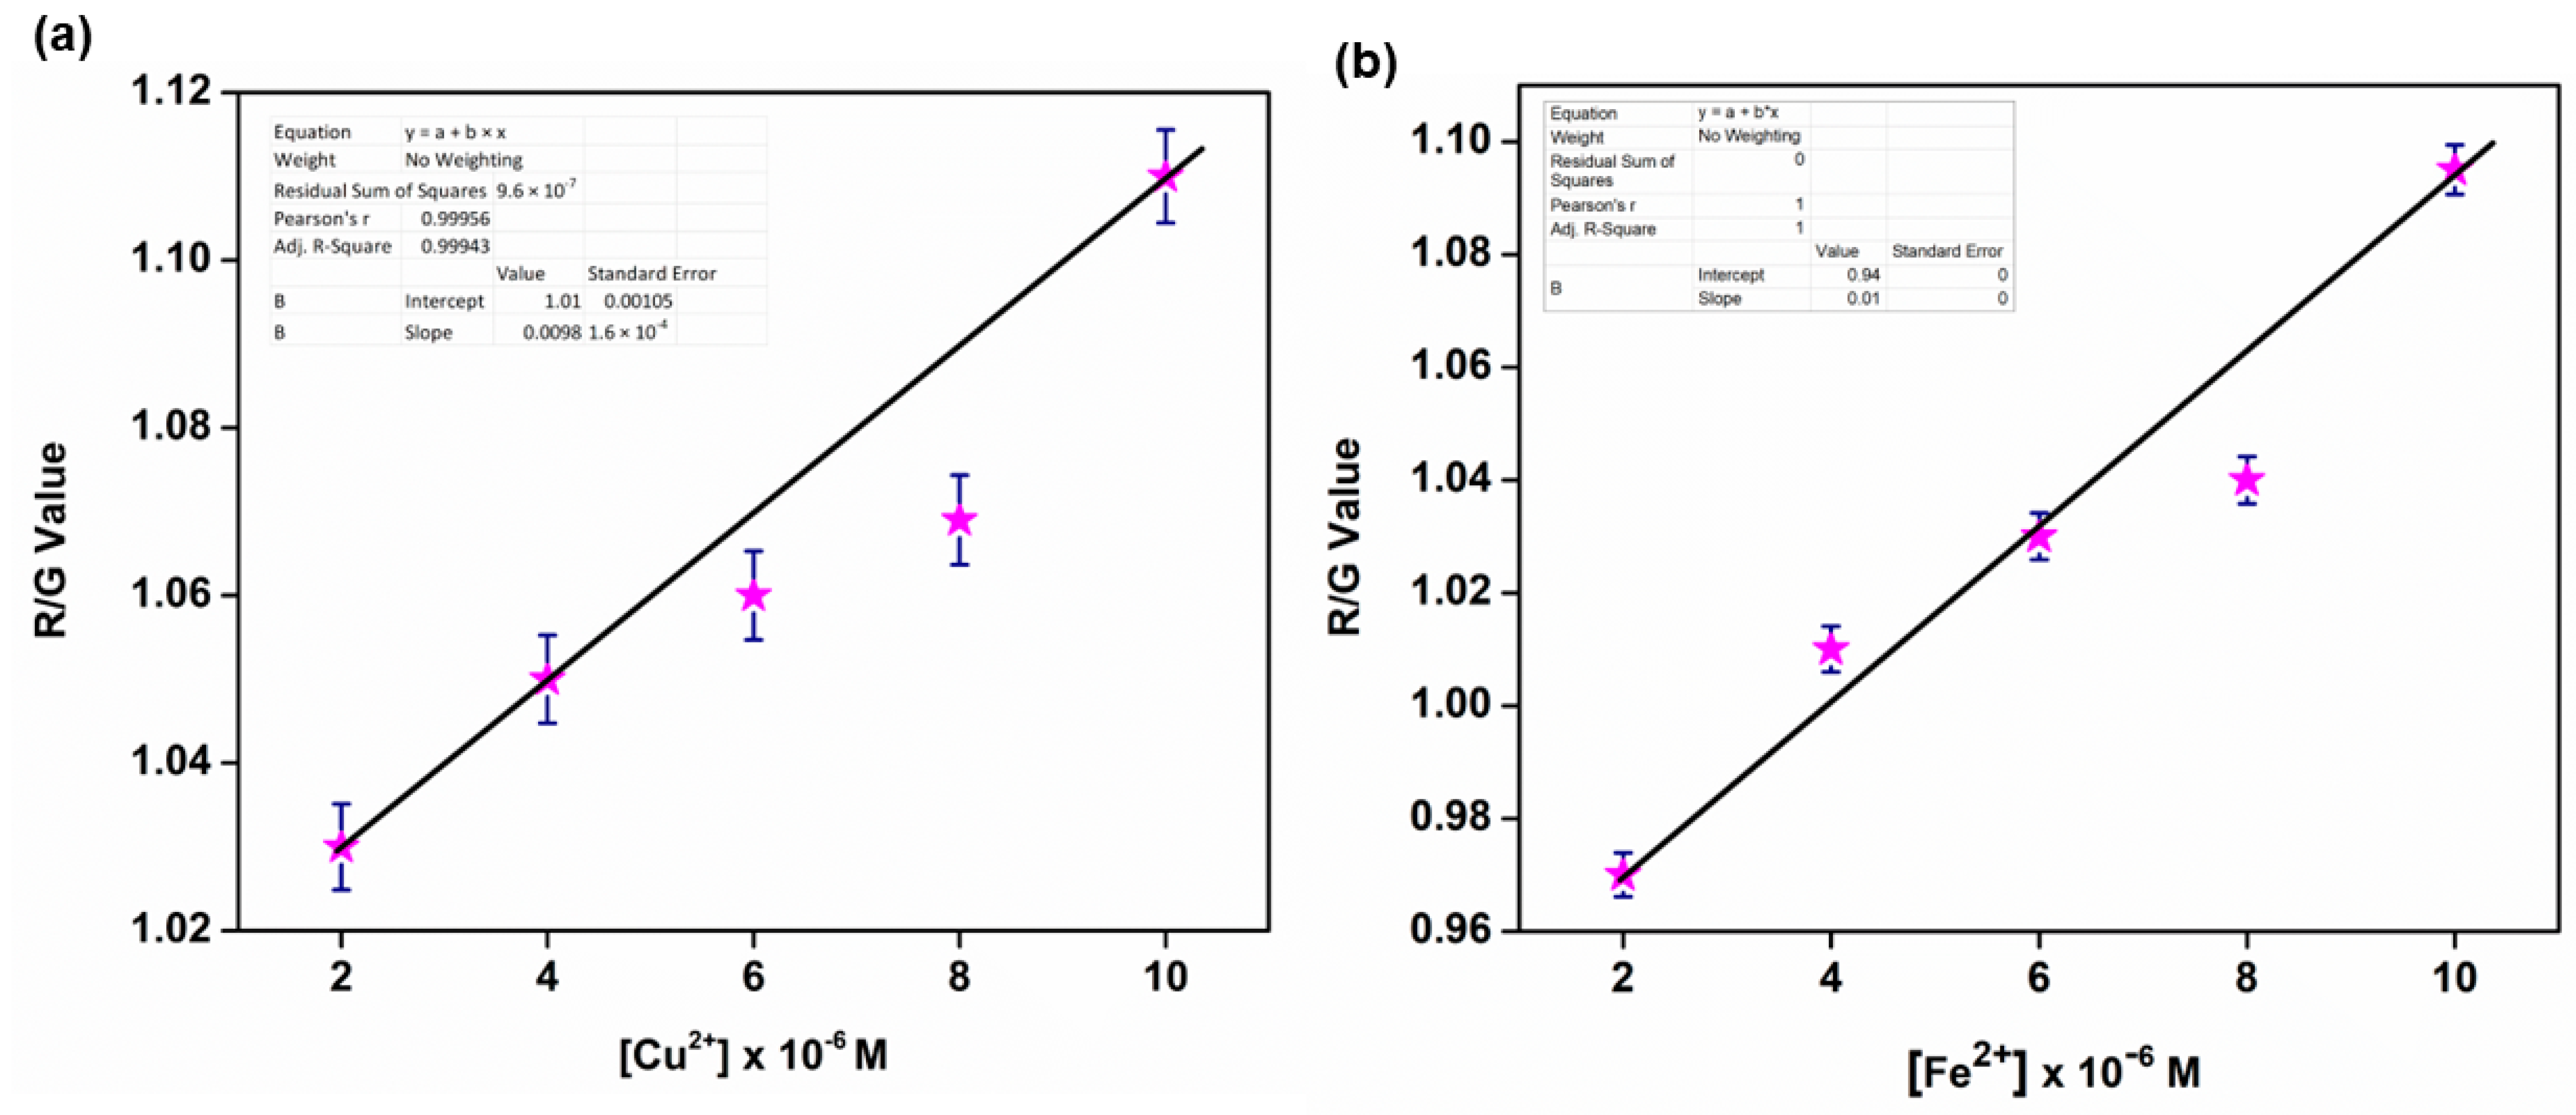
3.9. Limit of Detection (LOD) Investigation
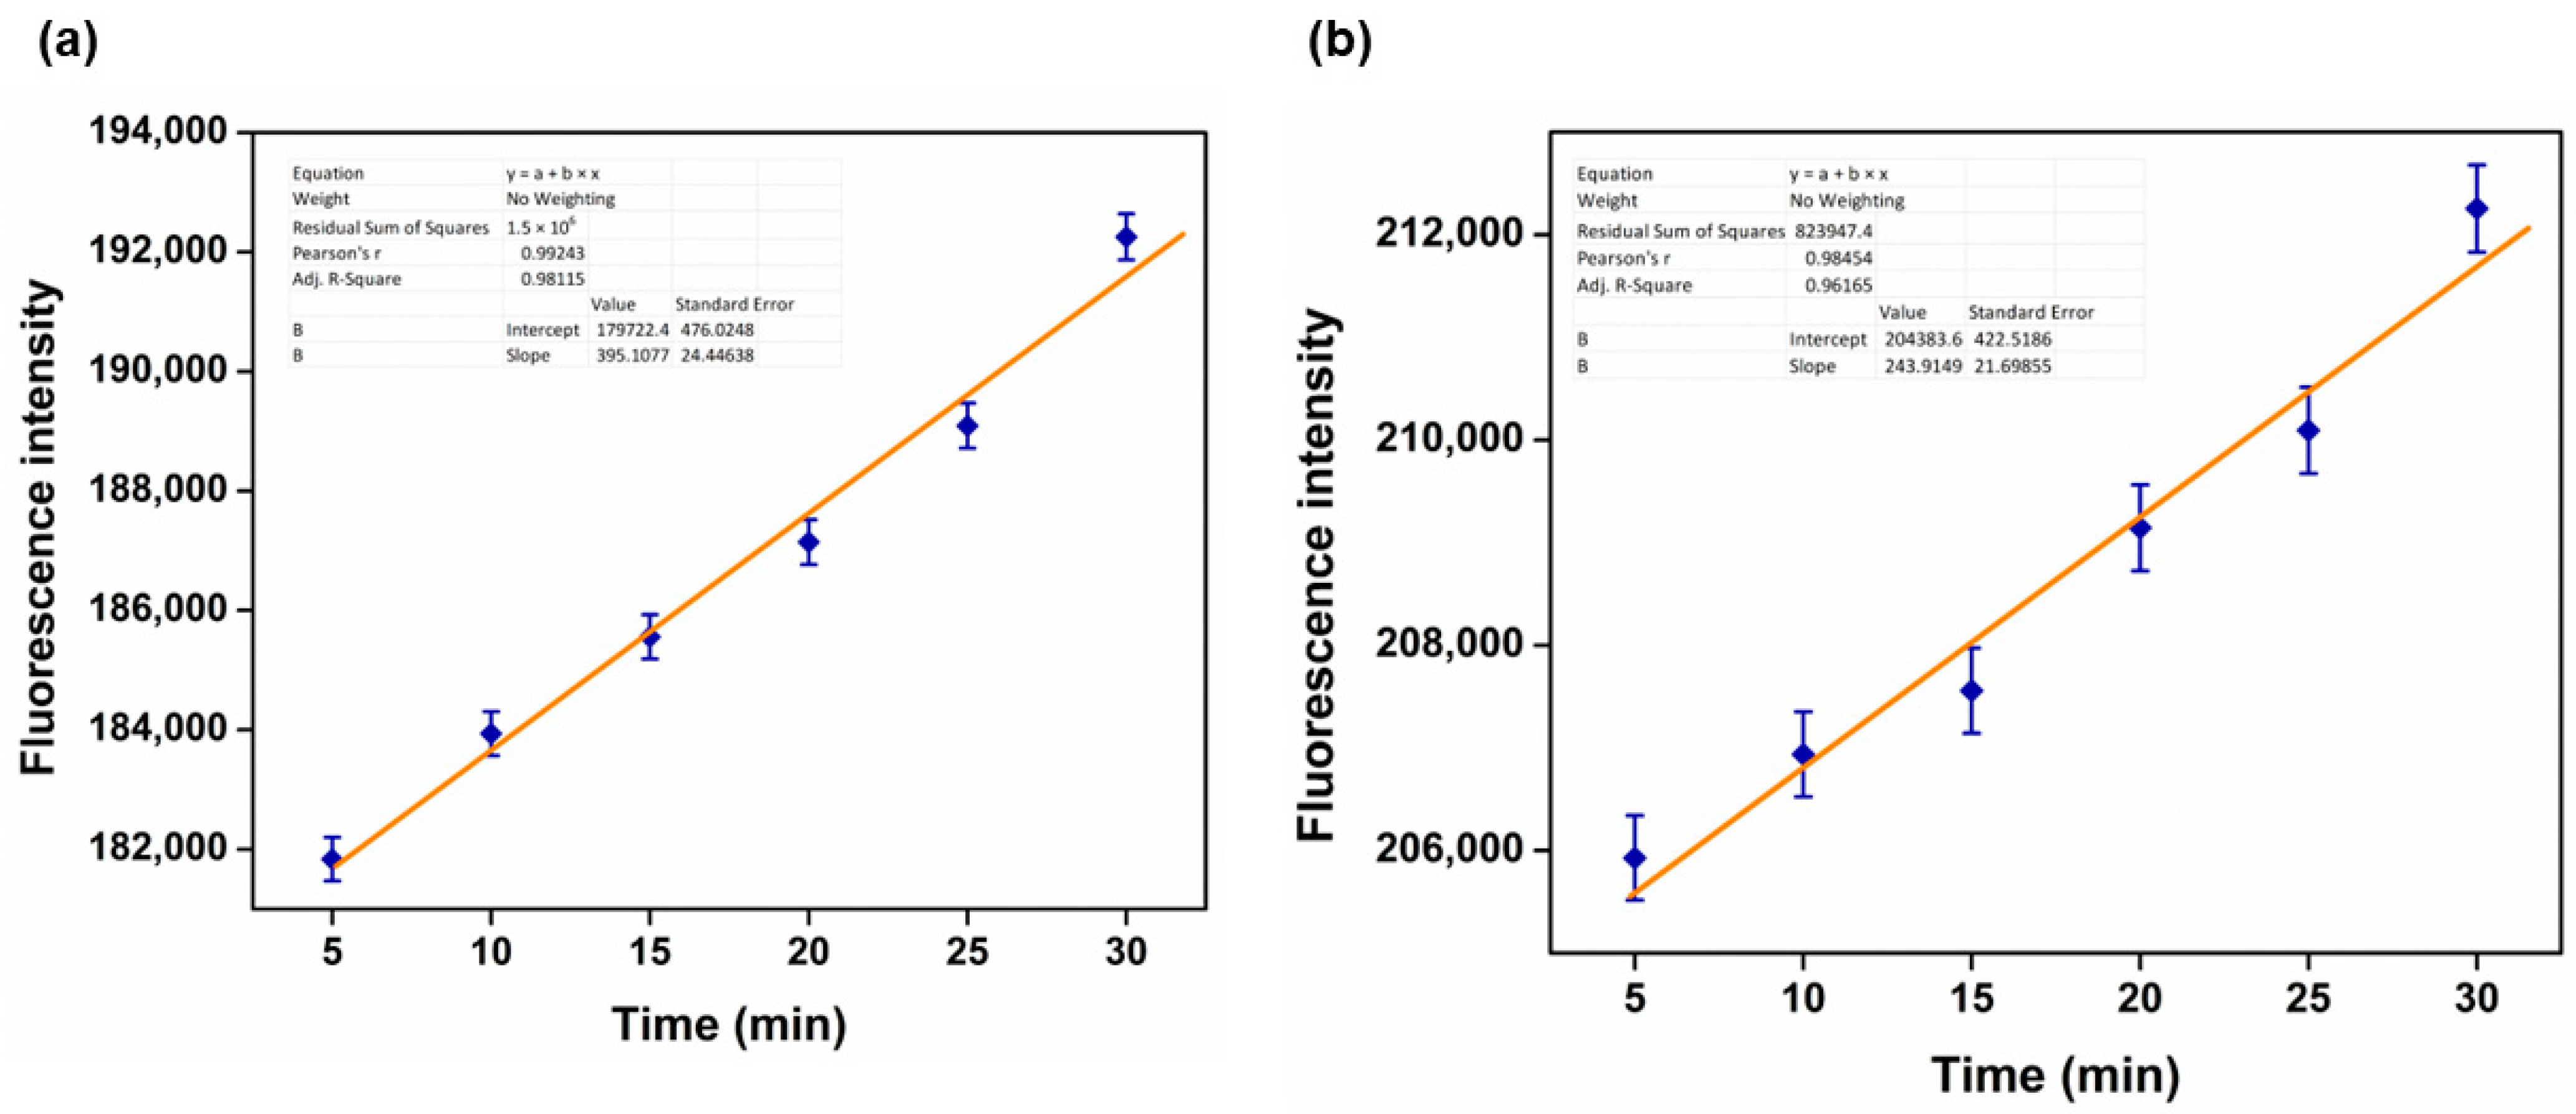
3.10. Kinetic Data Determaination
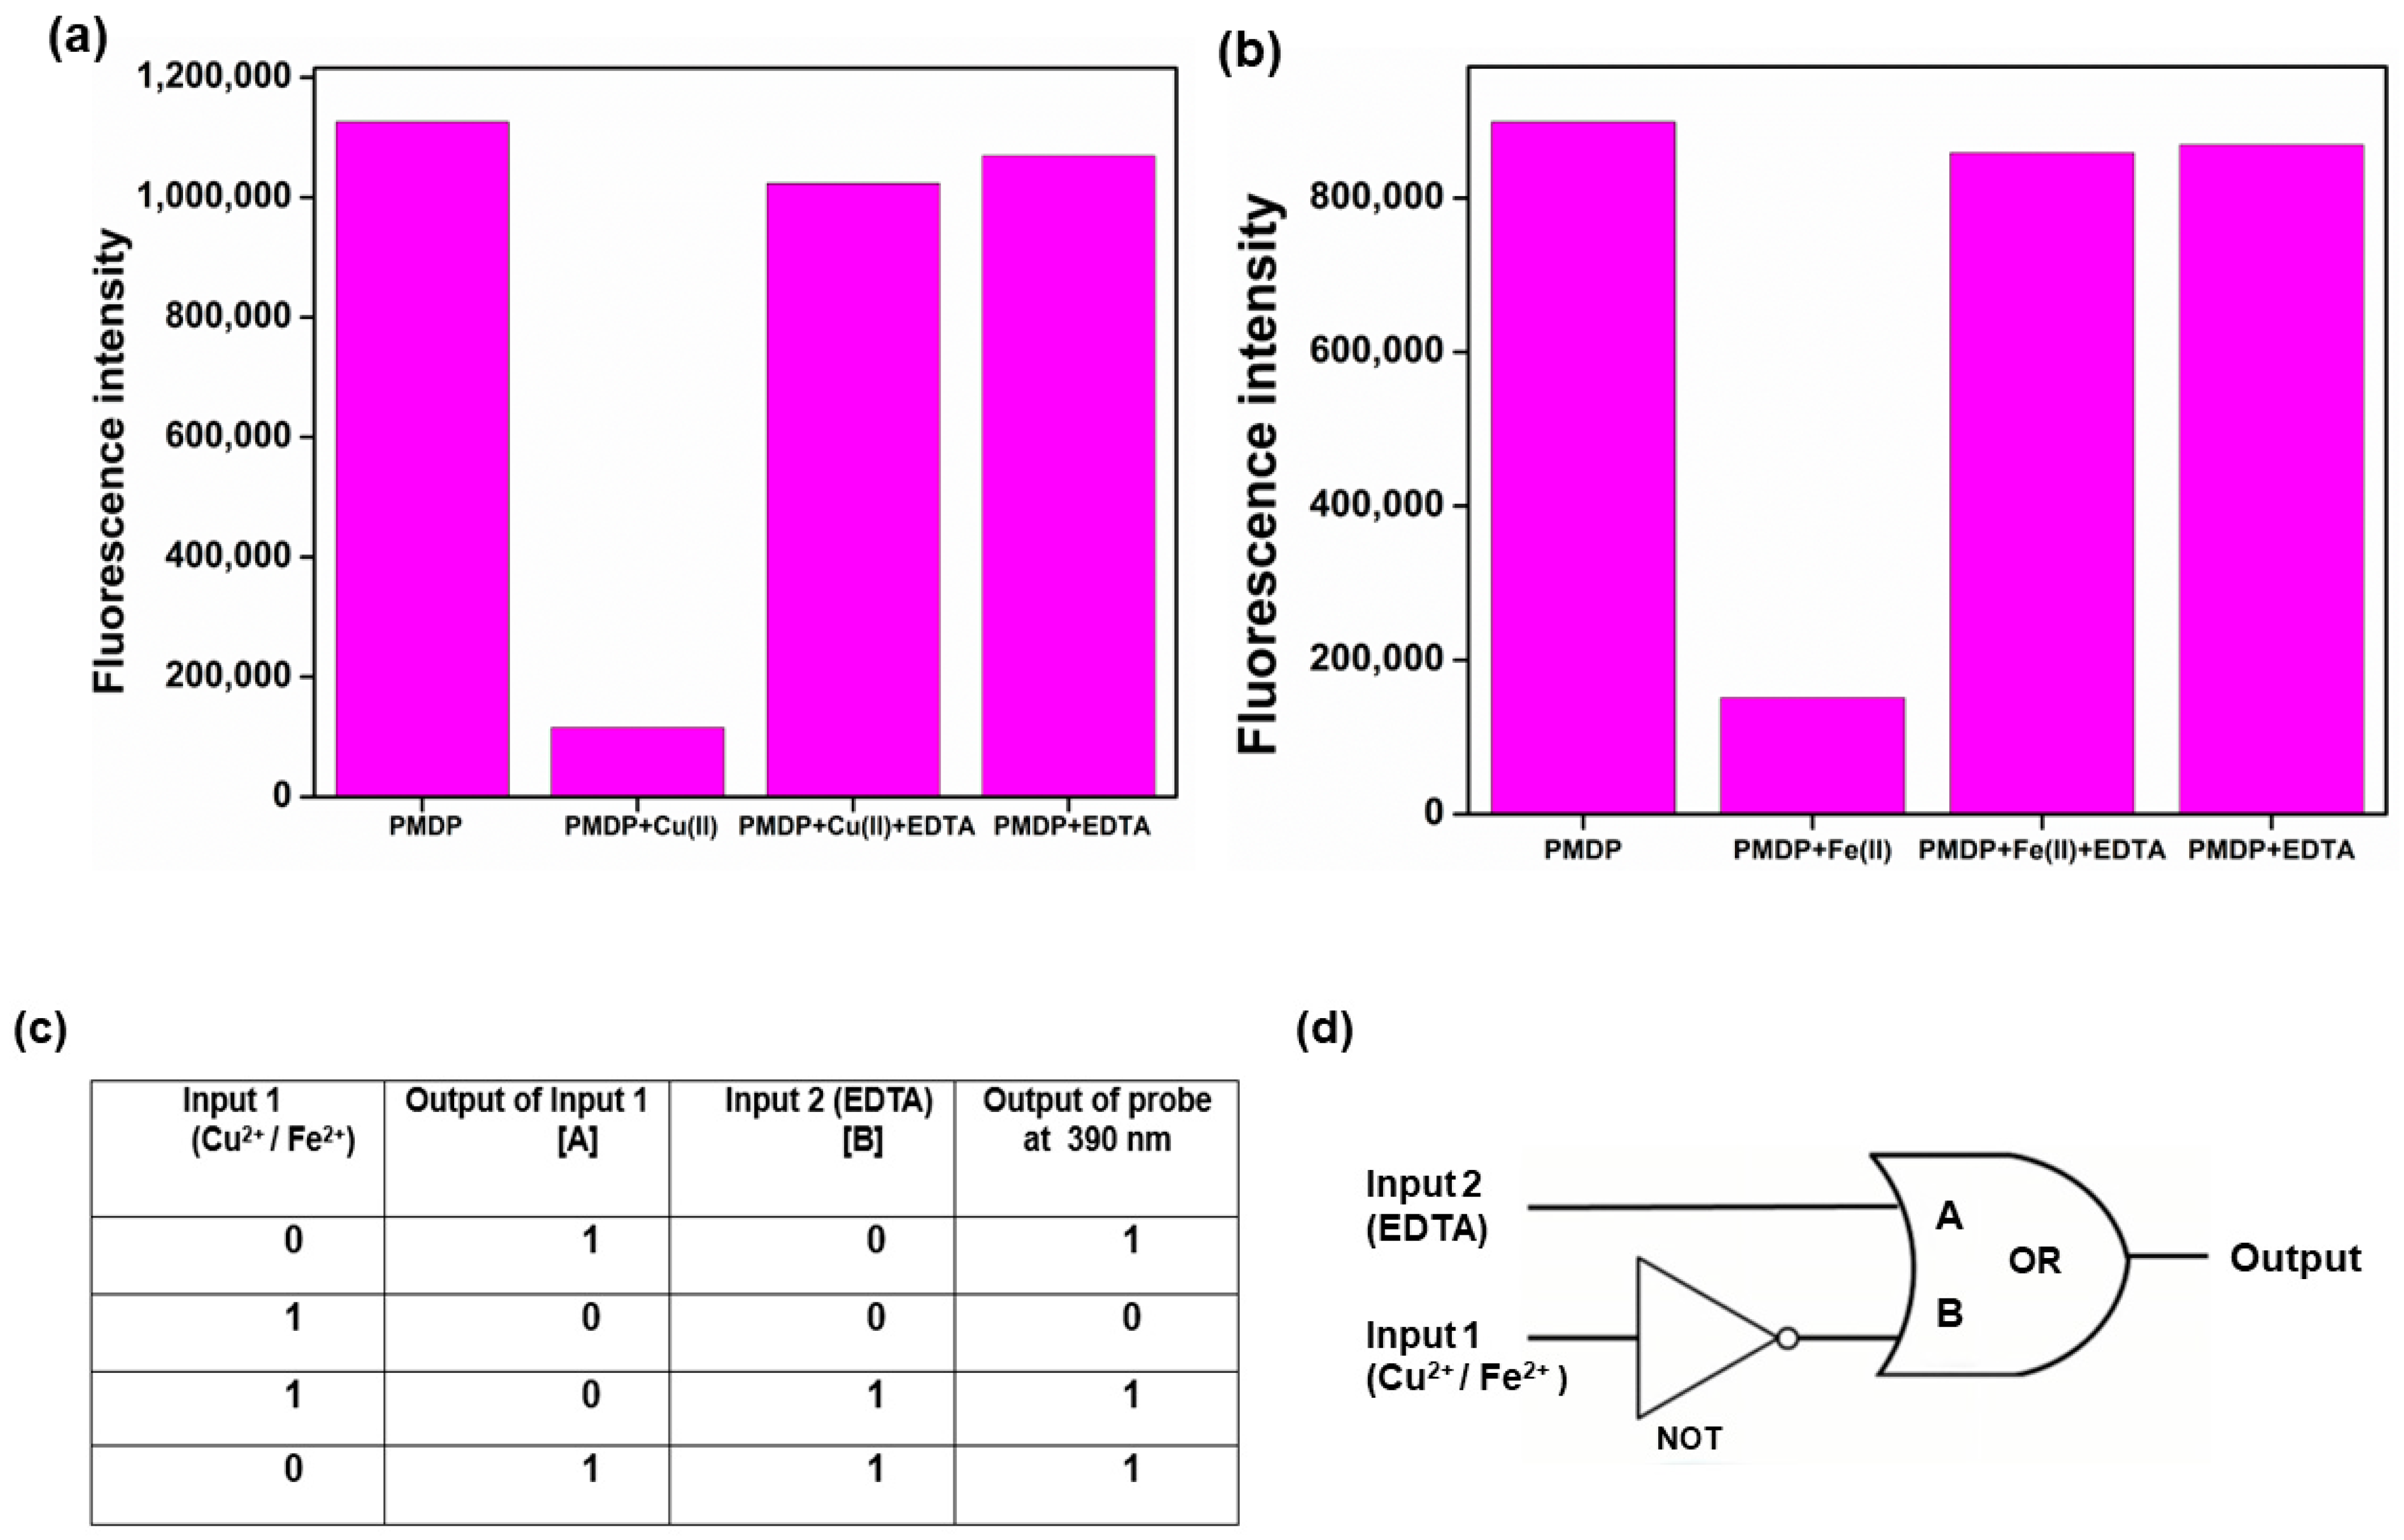
3.11. Logic Gate Construction
3.12. Real Water Sample Analysis
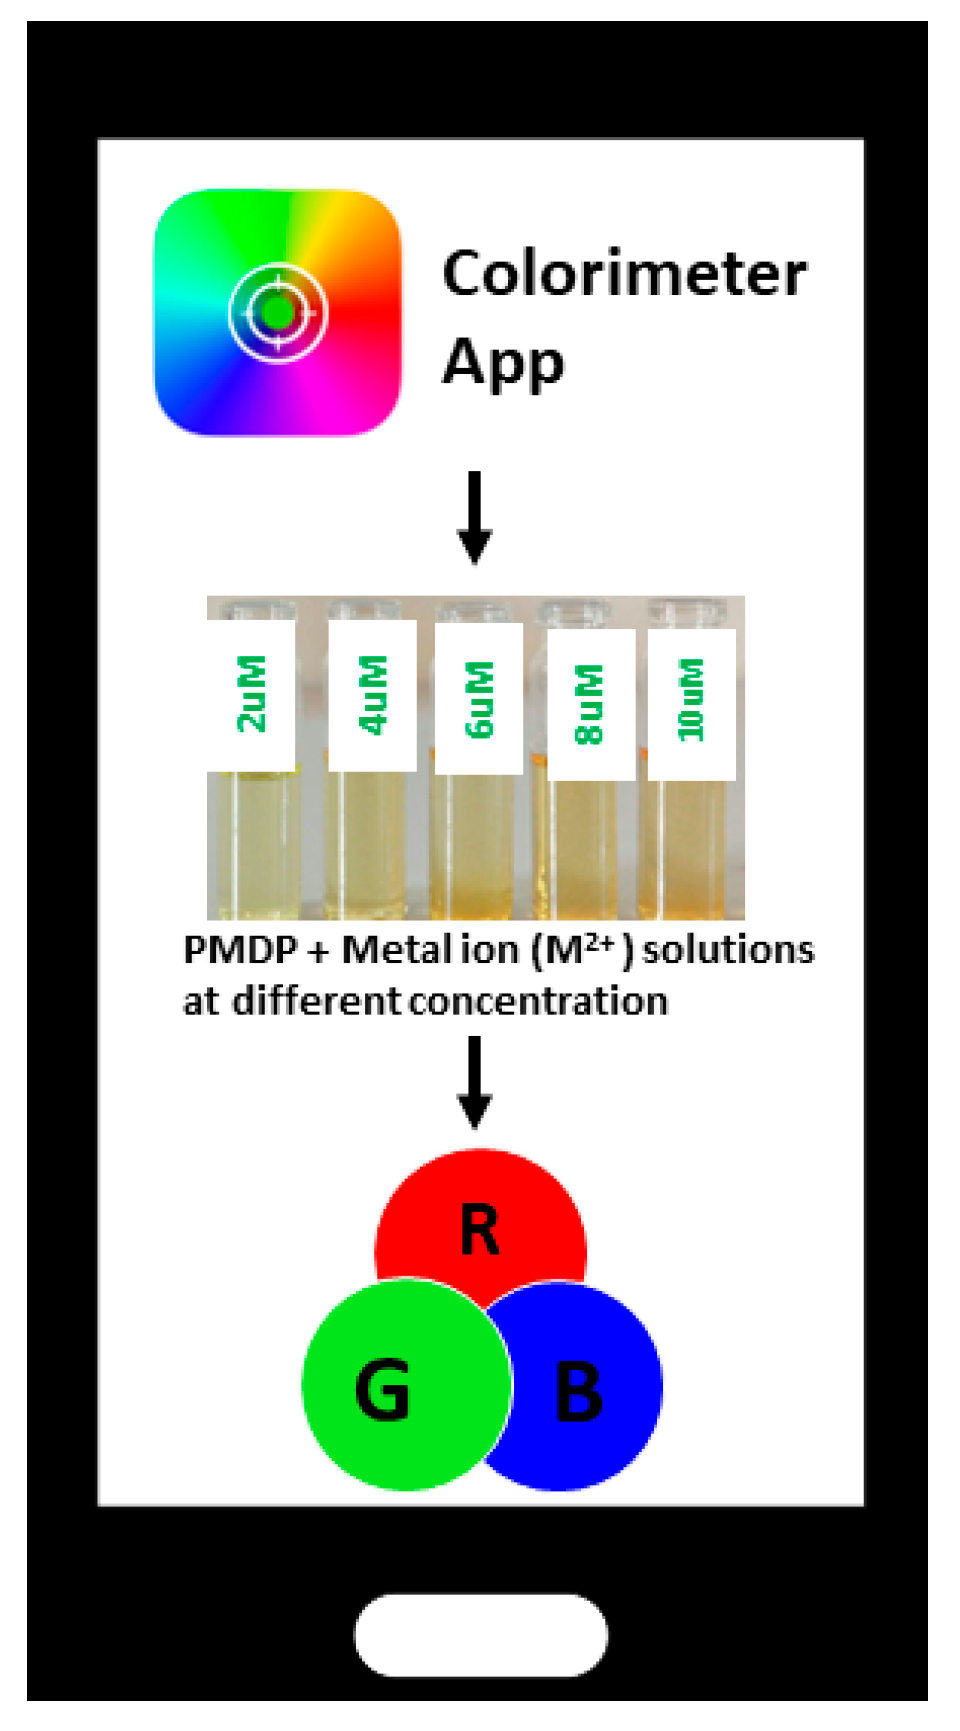
3.13. Smartphone Application
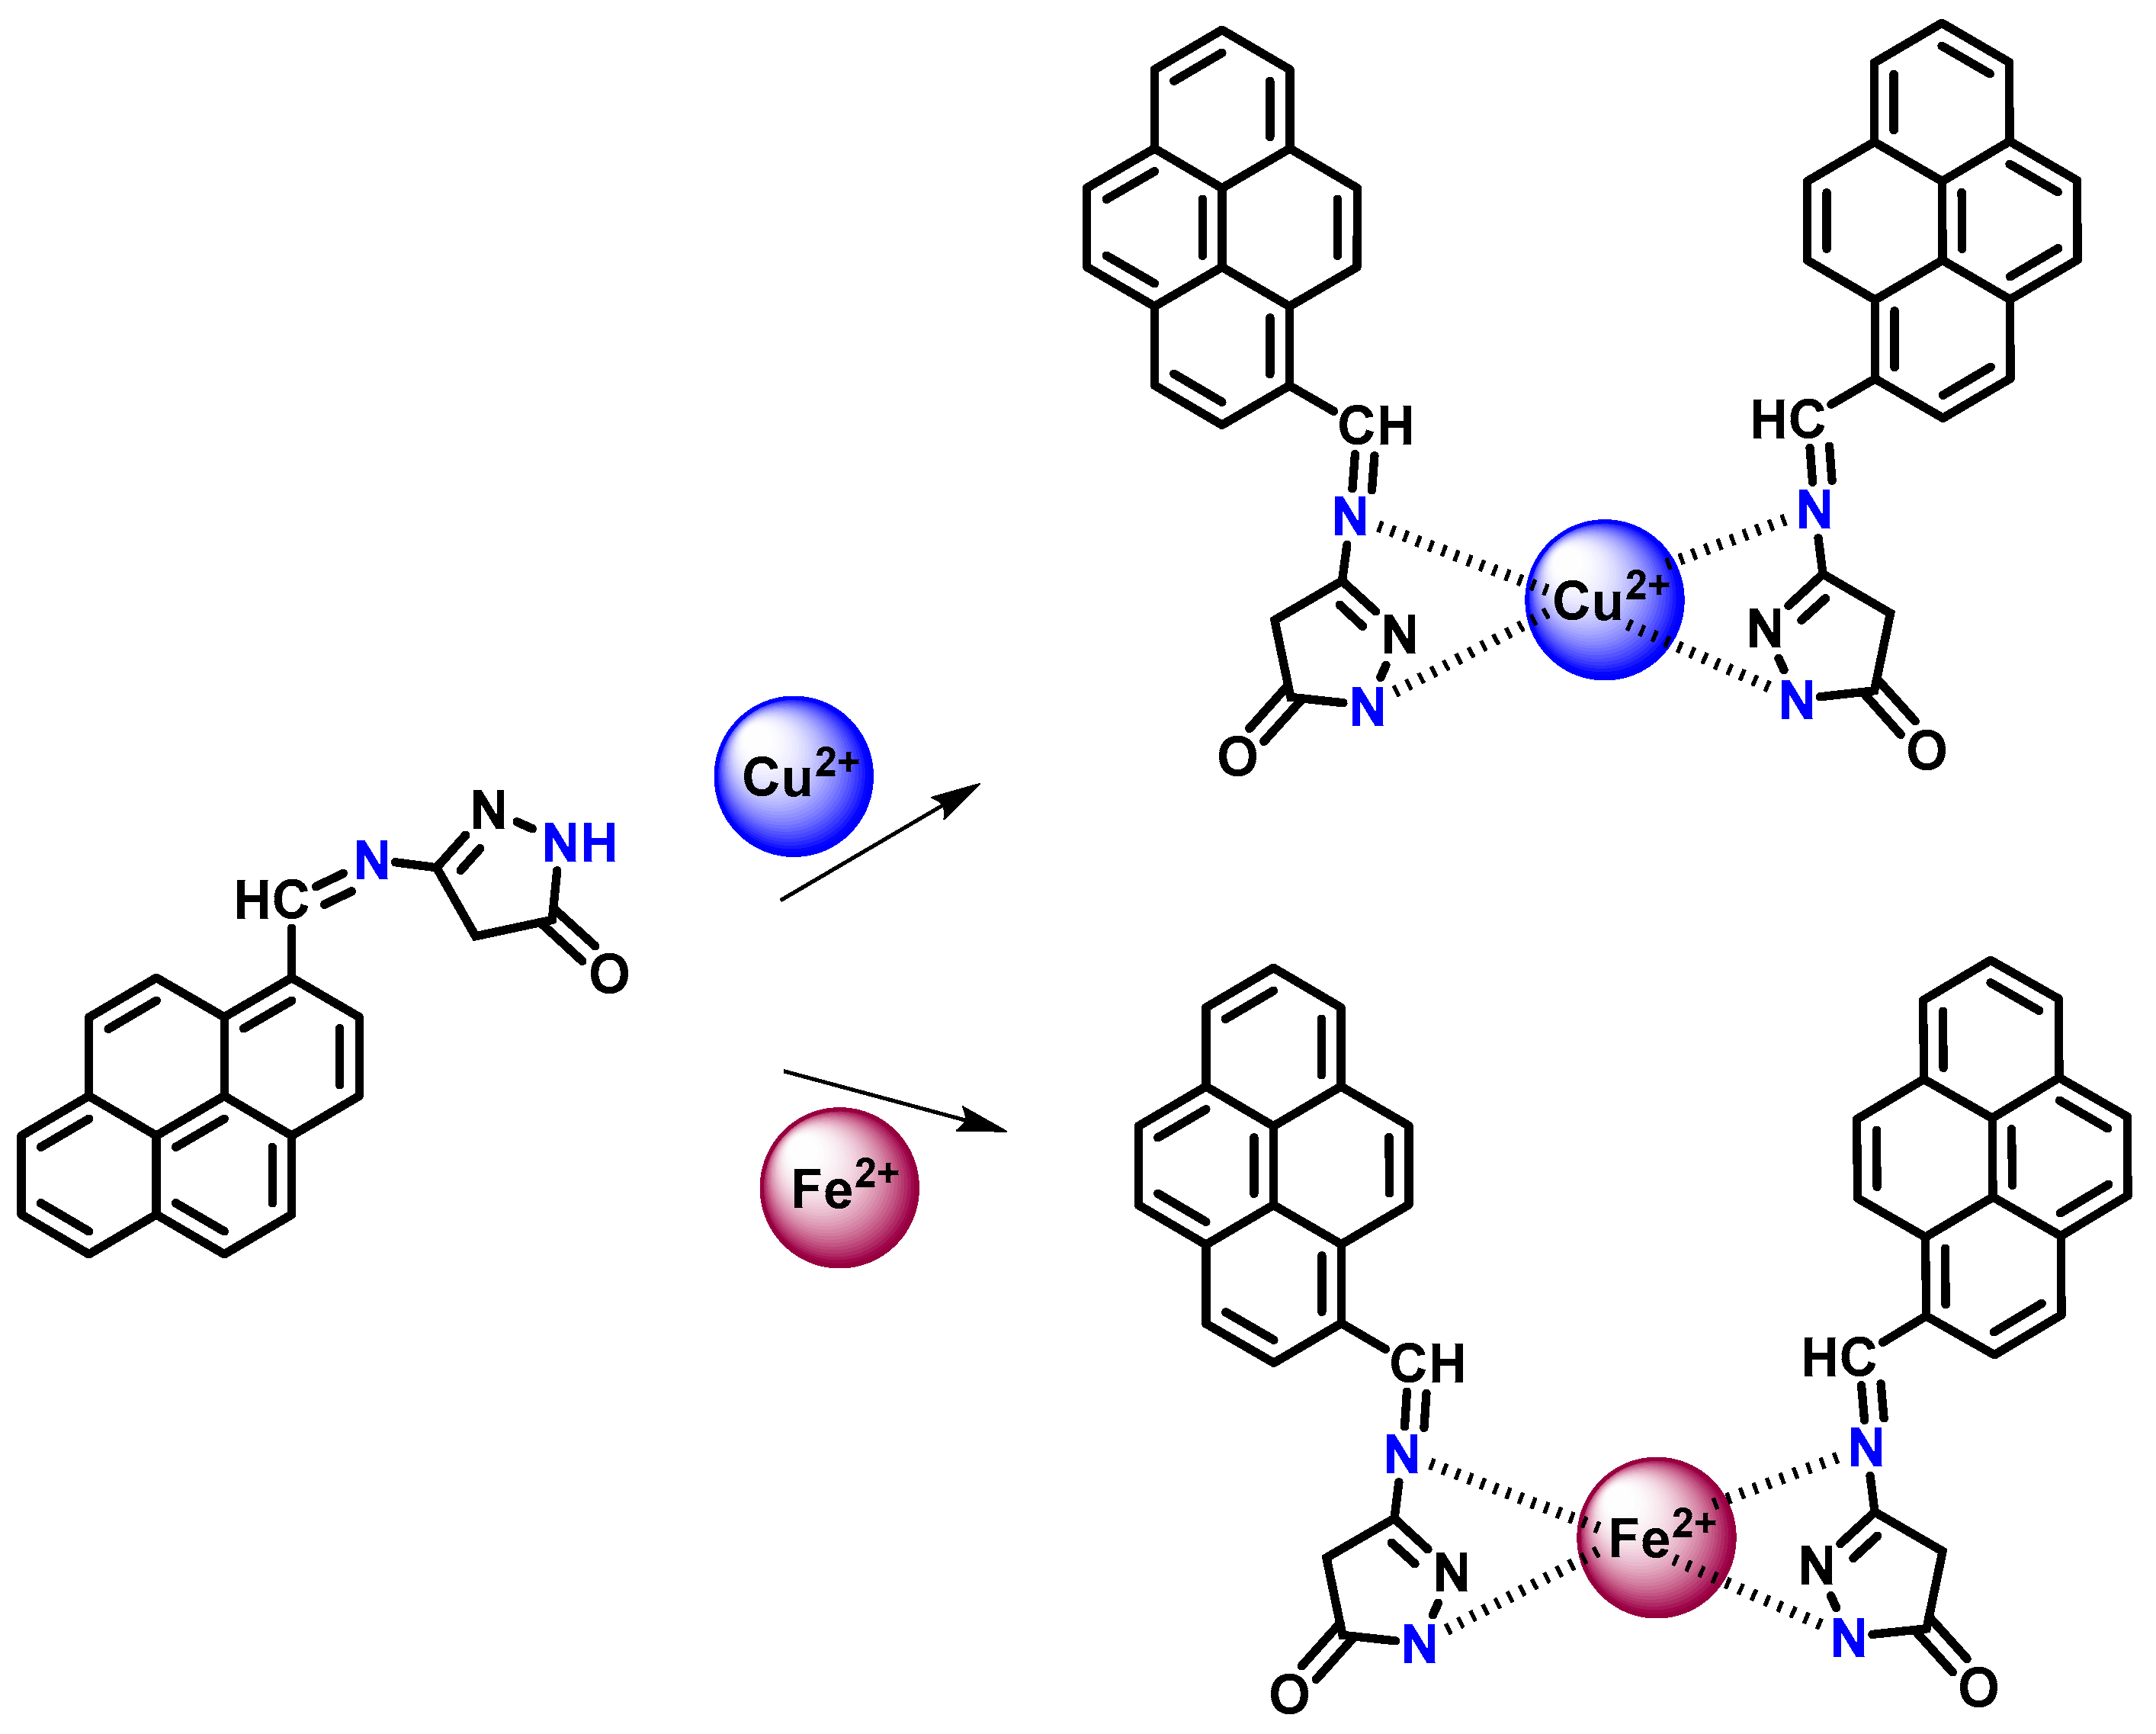
3.14. Sensing Mechanism
3.15. Cytotoxicity and Cell Imaging Studies
4. Conclusions
Supplementary Materials
Author Contributions
Funding
Data Availability Statement
Acknowledgments
Conflicts of Interest
References
- Wei, T.-B.; Zhang, P.; Shi, B.-B.; Chen, P.; Lin, Q.; Liu, J.; Zhang, Y.-M. A highly selective chemosensor for colorimetric detection of Fe3+ and fluorescence turn-on response of Zn2+. Dye. Pigment. 2013, 97, 297–302. [Google Scholar] [CrossRef]
- Paul, B.K.; Kar, S.; Guchhait, N. A Schiff base-derived new model compound for selective fluorescence sensing of Cu(II) and Zn(II) with ratiometric sensing potential: Synthesis, photophysics and mechanism of sensory action. J. Photochem. Photobiol. A Chem. 2011, 220, 153–163. [Google Scholar] [CrossRef]
- Jang, Y.K.; Nam, U.C.; Kwon, H.L.; Hwang, I.H.; Kim, C. A selective colorimetric and fluorescent chemosensor based-on naphthol for detection of Al3+ and Cu2+. Dye. Pigment. 2013, 99, 6–13. [Google Scholar] [CrossRef]
- Bravo, V.; Gil, S.; Costero, A.M.; Kneeteman, M.N.; Llaosa, U.; Mancini, P.M.E.; Ochando, L.E.; Parra, M. A new phenanthrene-based bis-oxime chemosensor for Fe(III) and Cr(III) discrimination. Tetrahedron 2012, 68, 4882–4887. [Google Scholar] [CrossRef]
- Lukatkin, A.; Egorova, I.; Michailova, I.; Malec, P.; Strzałka, K. Effect of copper on pro- and antioxidative reactions in radish (Raphanus sativus L.) in vitro and in vivo. J. Trace Elem. Med. Biol. 2014, 28, 80–86. [Google Scholar] [CrossRef] [PubMed]
- Pätsikkä, E.; Kairavuo, M.; Sersen, F.; Aro, E.-M.; Tyystjärvi, E. Excess Copper Predisposes Photosystem II to Photoinhibition in vivo by Outcompeting Iron and Causing Decrease in Leaf Chlorophyll. Plant Physiol. 2002, 129, 1359–1367. [Google Scholar] [CrossRef] [PubMed]
- Hane, F.T.; Hayes, R.; Lee, B.Y.; Leonenko, Z. Effect of copper and zinc on the single molecule self-affinity of Alzheimer’s amyloid-β peptides. PLoS ONE 2002, 11, e0147488. [Google Scholar] [CrossRef] [PubMed]
- Lee, S.A.; Lee, J.J.; Shin, J.W.; Min, K.S.; Kim, C. A colorimetric chemosensor for the sequential detection of copper(II) and cysteine. Dye. Pigment. 2015, 116, 131–138. [Google Scholar] [CrossRef]
- Shruthi, B.; Revanasiddappa, H.D.; Jayalakshmi, B.; Syed, A.; Elgorban, A.M.; Eswaramoorthy, R.; Amachawadi, R.G.; Shivamallu, C.; Kollur, S.P. Hydrobenzoic acid-based ‘Turn-Off’ fluorescent sensor for selective detection of Cu2+ ions: Chemical preparation, characterization and photophysical studies. Inorg. Chem. Commun. 2023, 150, 110467. [Google Scholar] [CrossRef]
- Divyashree, N.R.; Revanasiddappa, H.D.; Bhavya, N.R.; Mahendra, M.; Jayalakshmi, B.; Shivamallu, C.; Prasad Kollur, S. Azaneylylidene-based tetradentate Schiff base as a new “ON-OFF” fluorescent probe for the detection of Cu(II) ion: Synthesis, characterization and real sample analysis. Spectrochim. Acta Part A Mol. Biomol. Spectrosc. 2023, 292, 122435. [Google Scholar] [CrossRef]
- Bonda, D.J.; Lee, H.-G.; Blair, J.A.; Zhu, X.; Perry, G.; Smith, M.A. Role of metal dyshomeostasis in Alzheimer’s disease. Metallomics 2011, 3, 267–270. [Google Scholar] [CrossRef]
- Wang, L.; Yang, L.; Cao, D. A visual and fluorometric probe for Al(III) and Fe(III) using diketopyrrolopyrrole-based Schiff base. Sens. Actuators B Chem. 2014, 202, 949–958. [Google Scholar] [CrossRef]
- Bansod, B.; Kumar, T.; Thakur, R.; Rana, S.; Singh, I. A review on various electrochemical techniques for heavy metal ions detection with different sensing platforms. Biosens. Bioelectron. 2017, 94, 443–455. [Google Scholar] [CrossRef] [PubMed]
- Boulechfar, C.; Ferkous, H.; Delimi, A.; Djedouani, A.; Kahlouche, A.; Boublia, A.; Darwish, A.S.; Lemaoui, T.; Verma, R.; Benguerba, Y. Schiff bases and their metal Complexes: A review on the history, synthesis, and applications. Inorg. Chem. Commun. 2023, 150, 110451. [Google Scholar] [CrossRef]
- Mohan, M.; James, J.; Satyanarayan, M.N.; Trivedi, D.R. Functionalized pyrene-based AIEgens: Synthesis, photophysical characterization and density functional theory studies. Luminescence 2019, 34, 715. [Google Scholar] [CrossRef] [PubMed]
- Divyashree, N.R.; Revanasiddappa, H.D.; Yathirajan, H.S.; Bhavya, N.R.; Mahendra, M.; Muzaffar, I.; Chandan, S.; Raghavendra, G.A.; Shiva Prasad, K. Highly selective and sensitive fluorescent “TURN-ON” furan-based Schiff base for zinc(II) ion probing: Chemical synthesis, DFT studies, and X-ray crystal structure. New J. Chem. 2023, 47, 17420–17433. [Google Scholar] [CrossRef]
- Liu, B.; Zhuang, J.; Wei, G. Recent advances in the design of colorimetric sensors for environmental monitoring. Environ. Sci. Nano 2020, 7, 2195–2213. [Google Scholar] [CrossRef]
- Ayranci, R.; Karatas, E.; Ak, M. A new colorimetric sensor for Cu2+ detection based on s-triazine cored amino carbazole. Mater. Res. Express 2019, 6, 025504. [Google Scholar] [CrossRef]
- Khairnar, N.; Tayade, K.; Sahoo, S.K.; Bondhopadhyay, B.; Basu, A.; Singh, J.; Singh, N.; Gite, V.; Kuwar, A. A highly selective fluorescent ‘turn-on’chemosensor for Zn2+ based on a benzothiazole conjugate: Their applicability in live cell imaging and use of the resultant complex as a secondary sensor of CN−. Dalton Trans. 2015, 44, 2097–2102. [Google Scholar] [CrossRef]
- Shylaja, A.; Roja, S.S.; Priya, R.V.; Kumar, R.R. Four-Component Domino Synthesis of Pyrazolo [3,4-h]quinoline-3-carbonitriles: “Turn-Off” Fluorescent Chemosensor for Fe3+ Ions. J. Org. Chem. 2018, 83, 14084–14090. [Google Scholar] [CrossRef]
- Panchal, U.; Modi, K.; Dey, S.; Prajapati, U.; Patel, C.; Jain, V.K. A resorcinarene-based “turn-off” fluorescence sensor for 4-nitrotoluene: Insights from fluorescence and 1H NMR titration with computational approach. J. Lumin. 2017, 184, 74–82. [Google Scholar] [CrossRef]
- Bhalla, V.; Sharma, N.; Kumar, N.; Kumar, M. Rhodamine based fluorescence turn-on chemosensor for nanomolar detection of Fe3+ ions. Sens. Actuators B Chem. 2013, 178, 228–232. [Google Scholar] [CrossRef]
- Kumar, N.; Jung, U.; Jung, B.; Park, J.; Naushad, M. Zinc hydroxystannate/zinc-tin oxide heterojunctions for the UVC-assisted photocatalytic degradation of methyl orange and tetracycline. Environ. Pollut. 2023, 316, 120353. [Google Scholar] [CrossRef]
- Barmatov, E.; Hughes, T. Degradation of a schiff-base corrosion inhibitor by hydrolysis, and its effects on the inhibition efficiency for steel in hydrochloric acid. Mater. Chem. Phys. 2021, 257, 123758. [Google Scholar] [CrossRef]
- Yan, S.; Li, Y.; Yang, X.; Jia, X.; Xu, J.; Song, H. Photocatalytic H2O2 Generation Reaction with a Benchmark Rate at Air-Liquid-Solid Joint Interfaces. Adv. Mater. 2024, 36, 2307967. [Google Scholar] [CrossRef] [PubMed]
- Kumar, R.; Ravi, S.; Immanuel David, C.; Nandhakumar, R. A photo-induced electron transfer based reversible fluorescent chemosensor for specific detection of mercury (II) ions and its applications in logic gate, keypad lock and real samples. Arab. J. Chem. 2021, 14, 102911. [Google Scholar] [CrossRef]
- Kim, A.; Kim, S.; Kim, C. A conjugated Schiff base-based chemosensor for selectively detecting mercury ion. J. Chem. Sci. 2020, 132, 82. [Google Scholar] [CrossRef]
- Gupta, N.; Singhal, D.; Singh, A.K. Highly selective colorimetric and reversible fluorometric turn-off sensors based on the pyrimidine derivative: Mimicking logic gate operation and potential applications. New J. Chem. 2016, 40, 641–650. [Google Scholar] [CrossRef]
- Sharma, S.; Chayawan; Debnath, J.; Sundar Ghosh, K. Method for highly selective, ultrasensitive fluorimetric detection of Cu2+ and Al3+ by Schiff bases containing o-phenylenediamine and o-aminophenol. Methods 2023, 217, 27–35. [Google Scholar] [CrossRef]
- Sahoo, S.K.; Crisponi, G. Recent Advances on Iron(III) Selective Fluorescent Probes with Possible Applications in Bioimaging. Molecules 2019, 24, 3267. [Google Scholar] [CrossRef]
- Divyashree, N.R.; Revanasiddappa, H.D.; Jayalakshmi, B.; Iqbal, M.; Amachawadi, R.G.; Shivamallu, C.; Prasad Kollur, S. ‘Turn-ON’ furfurylamine-based fluorescent sensor for Cd2+ ion detection and its application in real water samples. Polyhedron 2023, 238, 116411. [Google Scholar] [CrossRef]
- Kathirvel, R.; Poongodi, M.; Vetriarasu, V.; Vivekanandan, K.E.; Selvakumar, K.; Al Obaid, S.; Pugazhendhi, A.; Venkatesan, G. Quinoline-quinoline Schiff-base as an effective chromogenic, fluorogenic, and smartphone assisted RGB detection of Pb2+ ion in near aqueous medium. Environ. Res. 2024, 250, 118530. [Google Scholar] [CrossRef]
- Manna, A.K.; Sahu, M.; Rout, K.; Das, U.K.; Patra, G.K. A highly selective novel multiple amide-based Schiff base optical chemosensor for rapid detection of Cu2+ and its applications in real sample analysis, molecular logic gate and smart phone. Microchem. J. 2020, 157, 104860. [Google Scholar] [CrossRef]
- Liu, S.; Wang, Y.-M.; Han, J. Fluorescent chemosensors for copper(II) ion: Structure, mechanism and application. J. Photochem. Photobiol. C Photochem. Rev. 2017, 32, 78. [Google Scholar] [CrossRef]
- Rasin, P.; Mathew, M.M.; Manakkadan, V.; Palakkeezhillam, V.N.V.; Sreekanth, A. A Highly Fluorescent Pyrene-Based Sensor for Selective Detection Of Fe3+ Ion in Aqueous Medium: Computational Investigations. J. Fluoresc. 2022, 32, 1229. [Google Scholar] [CrossRef]


Disclaimer/Publisher’s Note: The statements, opinions and data contained in all publications are solely those of the individual author(s) and contributor(s) and not of MDPI and/or the editor(s). MDPI and/or the editor(s) disclaim responsibility for any injury to people or property resulting from any ideas, methods, instructions or products referred to in the content. |
© 2024 by the authors. Licensee MDPI, Basel, Switzerland. This article is an open access article distributed under the terms and conditions of the Creative Commons Attribution (CC BY) license (https://creativecommons.org/licenses/by/4.0/).
Share and Cite
Gowda, B.G.; Iqbal, M.; Kollur, S.P. A “Turn-Off” Pyrene-Based Ligand as a Fluorescent Sensor for the Detection of Cu2+ and Fe2+ Ions: Synthesis and Application in Real Water Samples, Logic Gate Construction, and Bio-Imaging. Chemosensors 2024, 12, 91. https://doi.org/10.3390/chemosensors12060091
Gowda BG, Iqbal M, Kollur SP. A “Turn-Off” Pyrene-Based Ligand as a Fluorescent Sensor for the Detection of Cu2+ and Fe2+ Ions: Synthesis and Application in Real Water Samples, Logic Gate Construction, and Bio-Imaging. Chemosensors. 2024; 12(6):91. https://doi.org/10.3390/chemosensors12060091
Chicago/Turabian StyleGowda, Bhavana G., Muzaffar Iqbal, and Shiva Prasad Kollur. 2024. "A “Turn-Off” Pyrene-Based Ligand as a Fluorescent Sensor for the Detection of Cu2+ and Fe2+ Ions: Synthesis and Application in Real Water Samples, Logic Gate Construction, and Bio-Imaging" Chemosensors 12, no. 6: 91. https://doi.org/10.3390/chemosensors12060091
APA StyleGowda, B. G., Iqbal, M., & Kollur, S. P. (2024). A “Turn-Off” Pyrene-Based Ligand as a Fluorescent Sensor for the Detection of Cu2+ and Fe2+ Ions: Synthesis and Application in Real Water Samples, Logic Gate Construction, and Bio-Imaging. Chemosensors, 12(6), 91. https://doi.org/10.3390/chemosensors12060091