First Direct Gravimetric Detection of Perfluorooctane Sulfonic Acid (PFOS) Water Contaminants, Combination with Electrical Measurements on the Same Device—Proof of Concepts


 ,
,  ,
, 

 and
and
Abstract
1. Introduction
2. Materials and Methods
2.1. Materials
2.2. MOF Dispersion Preparation
2.3. The SAW Resonators Used
2.4. LB Film Preparation and PFOS Test Protocol
2.5. Other Instruments Used
3. Results and Discussions
4. Conclusions
Supplementary Materials
Author Contributions
Funding
Institutional Review Board Statement
Informed Consent Statement
Data Availability Statement
Acknowledgments
Conflicts of Interest
References
- Amin, M.; Sobhani, Z.; Liu, Y.; Dharmaraja, R.; Chadalavada, S.; Naidu, R.; Chalker, J.; Fang, C. Recent advances in the analysis of per- and polyfluoroalkyl substances (PFAS)—A review. Environ. Technol. Innov. 2020, 19, 100879. [Google Scholar] [CrossRef]
- Boiteux, V.; Dauchy, X.; Rosin, C.; Munoz, J.-F. National screening study on 10 perfluorinated compounds in raw and treated tap water in France. Arch. Environ. Contam. Toxicol. 2012, 63, 1–12. [Google Scholar] [CrossRef] [PubMed]
- Directive (EU) 2020/2184 of the European Parliament and of the Council of 16 December 2020 on the Quality of Water Intended for Human Consumption. Available online: https://eur-lex.europa.eu/eli/dir/2020/2184/oj (accessed on 15 April 2024).
- USA EPA. Drinking Water Health Advisories for PFOA and PFOS, 15 June 2022. Available online: https://www.epa.gov/sdwa/drinking-water-health-advisories-pfoa-and-pfos (accessed on 7 April 2024).
- Bell, E.; De Guise, S.; R McCutcheon, J.; Lei, Y.; Levin, M.; Li, B.; Rusling, J.; Lawrence, D.; Cavallari, J.; O’Connell, C.; et al. Exposure, health effects, sensing, and remediation of the emerging PFAS contaminants—Scientific challenges and potential research directions. Sci. Total Environ. 2021, 780, 146399. [Google Scholar] [CrossRef]
- Garg, S.; Kumar, P.; Greene, G.; Mishra, V.; Avisar, D.; Sharma, R.; Dumee, L. Nano-enabled sensing of per-/poly-fluoroalkyl substances (PFAS) from aqueous systems—A review. J. Environ. Manag. 2022, 308, 114655. [Google Scholar] [CrossRef] [PubMed]
- Tabar, F.; Lowdon, J.; Sichani, S.; Khorshid, M.; Cleij, T.; Diliën, H.; Eersels, K.; Wagner, P.; van Grinsven, B. An Overview on Recent Advances in Biomimetic Sensors for the Detection of Perfluoroalkyl Substances. Sensors 2024, 24, 130. [Google Scholar] [CrossRef]
- Petty, M. Molecular Electronics: From Principles to Practice; John Wiley & Sons Ltd.: Chichester, UK, 2007; ISBN 978-0-470-01307-6. [Google Scholar]
- Gaikar, P.; Sangale, S.; Wadhawa, G. The Langmuir-Blodgett method for metal oxide nanostructures. In Metal Oxides, Solution Methods for Metal Oxide Nanostructures; Mane, R., Jadhav, V., Al-Enizi, A., Eds.; Elsevier: Amsterdam, The Netherlands, 2023; pp. 369–392. ISBN 9780128243534. [Google Scholar] [CrossRef]
- Clark, R.; Dick, J. Towards deployable electrochemical sensors for per- and polyfluoroalkyl substances (PFAS). Chem. Commun. 2021, 57, 8121–8130. [Google Scholar] [CrossRef] [PubMed]
- Glasscott, M.; Vannoy, K.; Kazemi, R.; Verber, M.D.; Dick, J. μ-MIP: Molecularly imprinted polymer-modified microelectrodes for the ultrasensitive quantification of GenX (HFPO-DA) in river water. Environ. Sci. Technol. Lett. 2020, 7, 489–495. [Google Scholar] [CrossRef]
- Park, J.; Yang, K.; Choi, Y.; Choe, J. Novel ssDNA aptamer-based fluorescence sensor for perfluorooctanoic acid detection in water. Environ. Int. 2023, 158, 107000. [Google Scholar] [CrossRef]
- Howarth, A.; Liu, Y.; Li, P.; Li, Z.; Wang, T.; Hupp, J.; Farha, O. Chemical, thermal and mechanical stabilities of metal-organic frameworks. Nat. Rev. Mater. 2016, 1, 15018. [Google Scholar] [CrossRef]
- Ruiz, M.; Sua, A.; Tian, F. Covalent Attachment of Metal-Organic Framework Thin Films on Surfaces. In Encyclopedia of Interfacial Chemistry; Wandelt, K., Ed.; Elsevier: Amsterdam, The Netherlands, 2018; pp. 646–671. ISBN 9780128098943. [Google Scholar] [CrossRef]
- Zhang, Y.; Chang, C.-H. Metal-Organic Framework Thin Films: Fabrication, Modification, and Patterning. Processes 2020, 8, 377. [Google Scholar] [CrossRef]
- Crivello, C.; Sevim, S.; Graniel, O.; Franco, C.; Pané, S.; Puigmartí-Luis, J.; Muñoz-Rojas, D. Advanced technologies for the fabrication of MOF thin films. Mater. Horiz. 2021, 8, 168–178. [Google Scholar] [CrossRef] [PubMed]
- López, Y.; Viltres, H.; Gupta, N.; Acevedo-Peña, P.; Leyva, C.; Ghaffari, Y.; Gupta, A.; Kim, S.; Bae, J.; Kim, K. Transition metal-based metal-organic frameworks for environmental applications: A review. Environ. Chem. Lett. 2021, 19, 1295–1334. [Google Scholar] [CrossRef]
- Makiura, R. Creation of metal-organic framework nanosheets by the Langmuir-Blodgett technique. Coord. Chem. Rev. 2022, 46915, 214650. [Google Scholar] [CrossRef]
- Tsotsalas, M.; Umemura, A.; Kim, F.; Sakata, Y.; Reboul, J.; Kitagawa, S.; Furukawa, S. Crystal Morphology-Directed Framework Orientation in Porous Coordination Polymer Films and Freestanding Membranes via Langmuir-Blodgettry. J. Mater. Chem. 2012, 22, 10159–10165. [Google Scholar] [CrossRef]
- Makiura, R.; Motoyama, S.; Umemura, Y.; Yamanaka, H.; Sakata, O.; Kitagawa, H. Surface Nano-Architecture of a Metal-Organic Framework. Nat. Mater. 2010, 9, 565–571. [Google Scholar] [CrossRef] [PubMed]
- Makiura, R.; Kitagawa, H. Porous Porphyrin Nanoarchitectures on Surfaces. Eur. J. Inorg. Chem. 2010, 24, 3715–3724. [Google Scholar] [CrossRef]
- Benito, J.; Fenero, M.; Sorribas, S.; Zornoza, B.; Msayib, K.J.; McKeown, N.B.; Téllez, C.; Coronas, J.; Gascón, I. Fabrication of Ultrathin Films Containing the Metal Organic Framework Fe-MIL-88B-NH2 by the Langmuir–Blodgett Technique. Colloids Surf. A 2015, 470, 161–170. [Google Scholar] [CrossRef]
- Seoane, B.; Coronas, J.; Gascon, I.; Benavides, M.E.; Karvan, O.; Caro, J.; Kapteijn, F.; Gascon, J. Metal-Organic Framework Based Mixed Matrix Membranes: A Solution for Highly Efficient CO2 Capture. Chem. Soc. Rev. 2015, 44, 2421–2454. [Google Scholar] [CrossRef] [PubMed]
- Betard, A.; Fischer, R. Metal-Organic Framework Thin Films: From Fundamentals to Applications. Chem. Rev. 2012, 112, 1055–1083. [Google Scholar] [CrossRef]
- Demessence, A.; Horcajada, P.; Serre, C.; Boissiere, C.; Grosso, D.; Sanchez, C.; Fereya, G. Elaboration and properties of hierarchically structured optical thin films of MIL-101(Cr). Chem. Commun. 2009, 7149–7151. [Google Scholar] [CrossRef]
- Benito, J.; Sorribas, S.; Lucas, I.; Coronas, J.; Gascon, I. Langmuir–Blodgett Films of the Metal-Organic Framework MIL-101(Cr): Preparation, Characterization, and CO2 Adsorption Study Using a QCM-Based Setup. ACS Appl. Mater. Interfaces 2016, 8, 16486–16492. [Google Scholar] [CrossRef] [PubMed]
- Haghighi, E.; Zeinali, S. Nanoporous MIL-101(Cr) as a sensing layer coated on a quartz crystal microbalance (QCM) nanosensor to detect volatile organic compounds (VOCs). RSC Adv. 2019, 9, 24460. [Google Scholar] [CrossRef] [PubMed]
- Xie, D.; Wang, R.; Fu, J.; Zhao, Z.; Li, M. AuNPs@MIL-101 (Cr) as a SERS-Active Substrate for Sensitive Detection of VOCs. Front. Bioeng. Biotechnol. 2022, 10, 921693. [Google Scholar] [CrossRef] [PubMed]
- Shen, Y.; Tissot, A.; Serre, C. Recent progress on MOF-based optical sensors for VOC sensing. Chem. Sci. 2022, 13, 13978. [Google Scholar] [CrossRef] [PubMed]
- Mousavi, S.; Zeinali, S. VOC s detection using resistive gas nanosensor based on MIL-101(Cr) as a metal-organic framework. Sens. Actuators A Phys. 2022, 346, 113810. [Google Scholar] [CrossRef]
- Li, Z.; Hu, J.; Xiao, Y.; Zha, Q.; Zeng, L.; Zhu, M. Surfactant assisted Cr-metal organic framework for the detection of bisphenol A in dust from E-waste recycling area. Anal. Chim. Acta 2021, 1146, 174–183. [Google Scholar] [CrossRef]
- Haghighi, E.; Zeinali, S. Formaldehyde detection using quartz crystal microbalance (QCM) nanosensor coated by nanoporous MIL-101(Cr) film. Microporous Mesoporous Mat. 2020, 300, 110065. [Google Scholar] [CrossRef]
- Wang, Q.; Shi, Z.; Wang, Z.; Zhao, Y.; Li, J.; Hu, H.; Bai, Y.; Xu, Z.; Hui, Z.; Wang, L. Rapid simultaneous adsorption and SERS detection of acid orange II using versatile gold nanoparticles decorated NH2-MIL-101(Cr). Anal. Chim. Acta 2020, 1129, 126–135. [Google Scholar] [CrossRef]
- Zhang, J.; Sun, L.; Chen, C.; Liu, M.; Dong, W.; Guo, W.; Ruan, S. High performance humidity sensor based on metal organic framework MIL-101(Cr) nanoparticles. J. Alloys Compd. 2017, 695, 520–525. [Google Scholar] [CrossRef]
- Wu, M.; Ma, Z.; Fan, Y.; Wu, Y.; An, Z.; Zhao, H.; Liu, Y.; Xu, J. Materials Design, Sensing Performance and Mechanism of Anhydrous Hydrogen Fluoride Gas Sensor Based on Amino-Functionalized MIL-101(Cr) for New Energy Vehicles. Coatings 2022, 12, 260. [Google Scholar] [CrossRef]
- Zhong, X.; Zhang, M.; Guo, L.; Xie, Y.; Luo, R.; Chen, W.; Cheng, F.; Wang, L. A dual-signal self-checking photoelectrochemical immunosensor based on the sole composite of MIL-101(Cr) and CdSe quantum dots for the detection of α-fetoprotein. Biosens. Bioelectron. 2021, 189, 113389. [Google Scholar] [CrossRef] [PubMed]
- Liu, K.; Zhang, S.; Hu, X.; Zhang, K.; Roy, A.; Yu, G. Understanding the adsorption of PFOA on MIL-101 (Cr)-based anionic-exchange metal-organic frameworks: Comparing DFT calculations with aqueous sorption experiments. Environ. Sci. Technol. 2015, 49, 8657–8665. [Google Scholar] [CrossRef]
- Chatterjee, S.; Motkuri, R.K.; Basuray, S.; Cheng, Y.H. Fluidic Impedance Platform for In-situ Detection and Quantification of PFAS in Groundwater. International Patent Application No. WO 2020/236435, 26 November 2020. [Google Scholar]
- Cheng, Y.; Barpaga, D.; Soltis, J.; Shutthanandan, V.; Kargupta, R.; Han, K.; McGrail, B.; Motkuri, R.; Basuray, S.; Chatterjee, S. Metal−Organic Framework-Based Microfluidic Impedance Sensor Platform for Ultrasensitive Detection of Perfluorooctanesulfonate. ACS Appl. Mater. Interfaces 2020, 12, 10503–10514. [Google Scholar] [CrossRef]
- Zhang, J.; Zhang, X.; Wei, X.; Xue, Y.; Wan, H.; Wang, P. Recent advances in acoustic wave biosensors for the detection of disease-related biomarkers: A review. Anal. Chim. Acta 2021, 1164, 338321. [Google Scholar] [CrossRef]
- Mujahid, A.; Afzal, A.; Dickert, F. An Overview of High Frequency Acoustic Sensors—QCMs, SAWs and FBARs—Chemical and Biochemical Applications. Sensors 2019, 19, 4395. [Google Scholar] [CrossRef]
- Balcerzak, A.; Kiełczyński, P.; Szalewski, M.; Wieja, K. SAW Sensor with Langmuir-Blodgett Layer for Detection of Benzene and its Derivatives. Arch. Acoust. 2021, 46, 25–30. [Google Scholar] [CrossRef]
- Liang, R.; Wang, S.; Lu, Y.; Yan, G.; He, Z.; Xia, Y.; Liang, Z.; Wu, L. Assembling Ultrafine SnO2 Nanoparticles on MIL-101(Cr) Octahedrons for Efficient Fuel Photocatalytic Denitrification. Molecules 2021, 26, 7566. [Google Scholar] [CrossRef] [PubMed]
- Avramov, I.; Stahl, U. On the Mass Sensitivity of Rayleigh Surface Acoustic Wave (RSAW) Resonators. In Proceedings of the 40th International Spring Seminar on Electronics Technology (ISSE), Sofia, Bulgaria, 10–14 May 2017; pp. 1–6. [Google Scholar] [CrossRef]
- Avramov, I.; Länge, K.; Rupp, S.; Rapp, B.; Rapp, M. Polymer coating behaviour of Rayleigh-SAW resonators with gold electrode structure for gas sensor applications. IEEE Trans. Ultrason. Ferroelectr. Freq. Control 2007, 57, 157–166. [Google Scholar] [CrossRef]
- Avramov, I. The Quartz Surface Microbalance—A Possible Candidate for Rapid Respiratory Virus Detection. In Proceedings of the IEEE International Symposium on Applications of Ferroelectrics (ISAF), Sydney, Australia, 16–21 May 2021. [Google Scholar] [CrossRef]
- Avramov, I.; Ivanov, G. Layer by Layer Optimization of Langmuir–Blodgett Films for Surface Acoustic Wave (SAW) Based Sensors for Volatile Organic Compounds (VOC) Detection. Coatings 2022, 12, 669. [Google Scholar] [CrossRef]
- Lee, J.; Kim, C.; Liu, C.; Wong, M.; Cápiro, N.; Pennell, K.; Fortner, J. Ultra-high capacity, multifunctional nanoscale sorbents for PFOA and PFOS treatment. NPJ Clean Water 2023, 6, 62. [Google Scholar] [CrossRef]
- Wightman, R.M. Detection Technologies. Probing Cellular Chemistry in Biological Systems with Microelectrodes. Science 2006, 311, 1570. [Google Scholar] [CrossRef]
- Ding, S.; Mosher, C.; Lee, X.Y.; Das, S.R.; Cargill, A.A.; Tang, X.; Chen, B.; McLamore, E.S.; Gomes, C.; Hostetter, J.M.; et al. Rapid and label-free detection of interferon gamma via an electrochemical aptasensor comprising a ternary surface monolayer on a gold interdigitated electrode array. ACS Sens. 2017, 2, 210. [Google Scholar] [CrossRef]
- McEwen, G.D.; Chen, F.; Zhou, A. Immobilization, Hybridization, and Oxidation of Synthetic DNA on Gold Surface: Electron Transfer Investigated by Electrochemistry and Scanning Tunneling Microscopy. Anal. Chim. Acta 2009, 643, 26. [Google Scholar] [CrossRef]
- Jia, Y.; Qian, J.; Pan, B. Dual-functionalized MIL-101 (Cr) for the selective enrichment and ultrasensitive analysis of trace per-and poly-fluoroalkyl substances. Anal. Chem. 2021, 93, 11116–11122. [Google Scholar] [CrossRef]
- Nirschl, M. (PocketVNA, Rohrdorf, Germany). Personal communication, 2024.
- Q-Sense Explorer Specifications. Available online: https://www.biolinscientific.com/qsense/instrument/qsense-explorer#specifications (accessed on 19 May 2024).
- Alassi, A.; Benammar, M.; Brett, D. Quartz Crystal Microbalance Electronic Interfacing Systems: A Review. Sensors 2017, 17, 2799. [Google Scholar] [CrossRef]
- Montagut, Y.J.; García, J.V.; Jiménez, Y.; March, C.; Montoya, A.; Arnau, A. Frequency-shift vs. phase-shift characterization of in-liquid quartz crystal microbalance applications. Rev. Sci. Instrum. 2011, 82, 064702. [Google Scholar] [CrossRef]
- Schmitt, R.F.; Allen, J.W.; Wright, R. Rapid design of SAW oscillator electronics for sensor applications. Sens. Actuators B 2001, 76, 80. [Google Scholar] [CrossRef]
- Zou, M.; Dong, M.; Zhao, T. Advances in Metal-Organic Frameworks MIL-101(Cr). Int. J. Mol. Sci. 2022, 23, 9396. [Google Scholar] [CrossRef]
- Radjenovic, J.; Duinslaeger, N.; Avval, S.S.; Chaplin, B.P. Facing the Challenge of Poly- and Perfluoroalkyl Substances in Water: Is Electrochemical Oxidation the Answer? Environ. Sci. Technol. 2020, 54, 14815. [Google Scholar] [CrossRef]
- Tian, Q.; Chen, S.; Shi, M.; Gao, T.; Zhang, M.; Liao, C.; Li, X.; Dong, Q.; Wang, C. Fluorine-functionalized MOF modified GCE for highly sensitive electrochemical detection of persistent pollutant perfluorooctanoic acid. Sens. Actuators B 2024, 404, 135309. [Google Scholar] [CrossRef]
- Dalapati, R.; Hunter, M.; Mostakim, S.K.; Yang, X. Fluorescence Turn-on Detection of Perfluorooctanoic Acid (PFOA) by Perylene Diimide-Based Metal–Organic Framework. ACS Appl. Mater. Interfaces 2024. [Google Scholar] [CrossRef]
- Suwannakot, P.; Lisi, F.; Ahmed, E.; Liang, K.; Babarao, R.; Gooding, J.J.; Donald, W.A. Metal–Organic Framework-Enhanced Solid-Phase Microextraction Mass Spectrometry for the Direct and Rapid Detection of Perfluorooctanoic Acid in Environmental Water Samples. Anal. Chem. 2020, 92, 6900. [Google Scholar] [CrossRef] [PubMed]
- Chen, B.; Yang, Z.; Qu, X.; Zheng, S.; Yin, D.; Fu, H. Screening and Discrimination of Perfluoroalkyl Substances in Aqueous Solution Using a Luminescent Metal–Organic Framework Sensor Array. ACS Appl. Mater. Interfaces 2021, 13, 47706. [Google Scholar] [CrossRef] [PubMed]
- Khan, R.; Uygun, Z.O.; Andreescu, D.; Andreescu, S. Sensitive Detection of Perfluoroalkyl Substances Using MXene–AgNP-Based Electrochemical Sensors. ACS Sens. 2024. [Google Scholar] [CrossRef] [PubMed]
- Lu, D.; Zhu, D.Z.; Gan, H.; Yao, Z.; Luo, J.; Yu, S.; Kurup, P. An ultra-sensitive molecularly imprinted polymer (MIP) and gold nanostars (AuNS) modified voltammetric sensor for facile detection of perfluorooctance sulfonate (PFOS) in drinking water. Sens. Actuators B 2022, 352, 131055. [Google Scholar] [CrossRef]


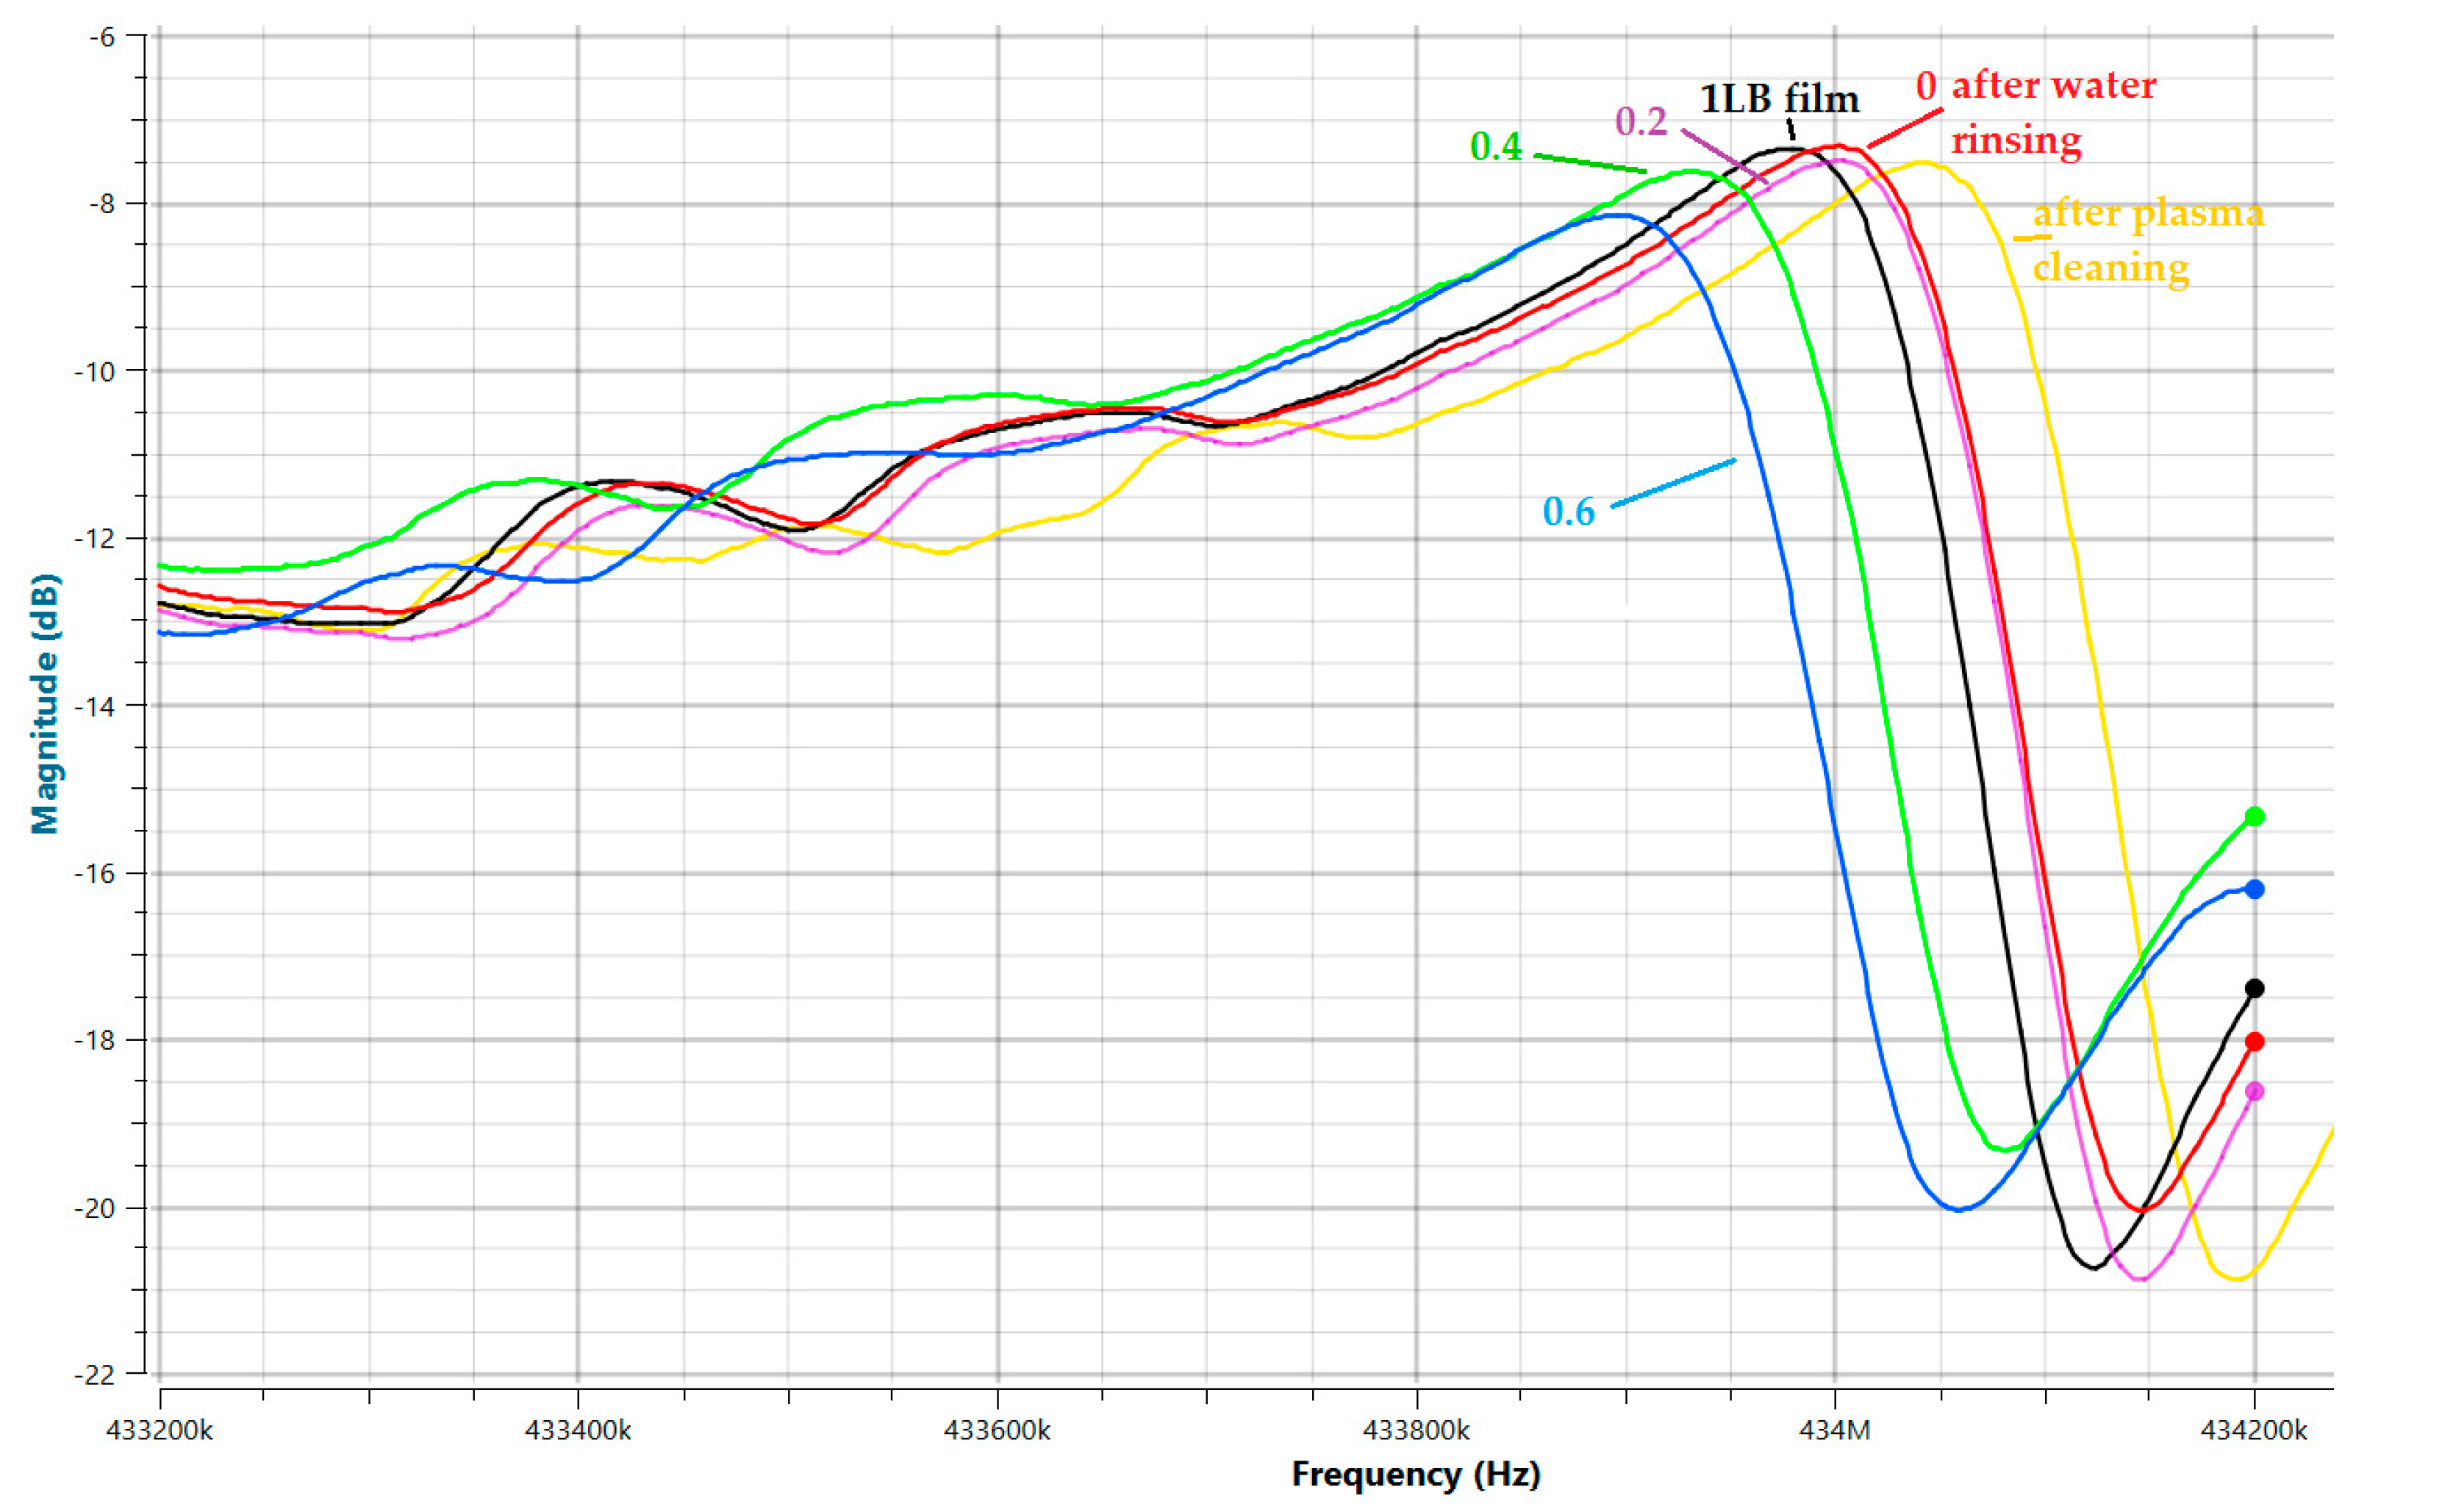
| Resonance Frequency f0 [MHz] | Frequency Shift ∆f [kHz] | Loaded Mass [ng] m = ∆f/43.5 | Group Delay τg [µs] | Loaded QL-Factor QL = π fo τg | |
|---|---|---|---|---|---|
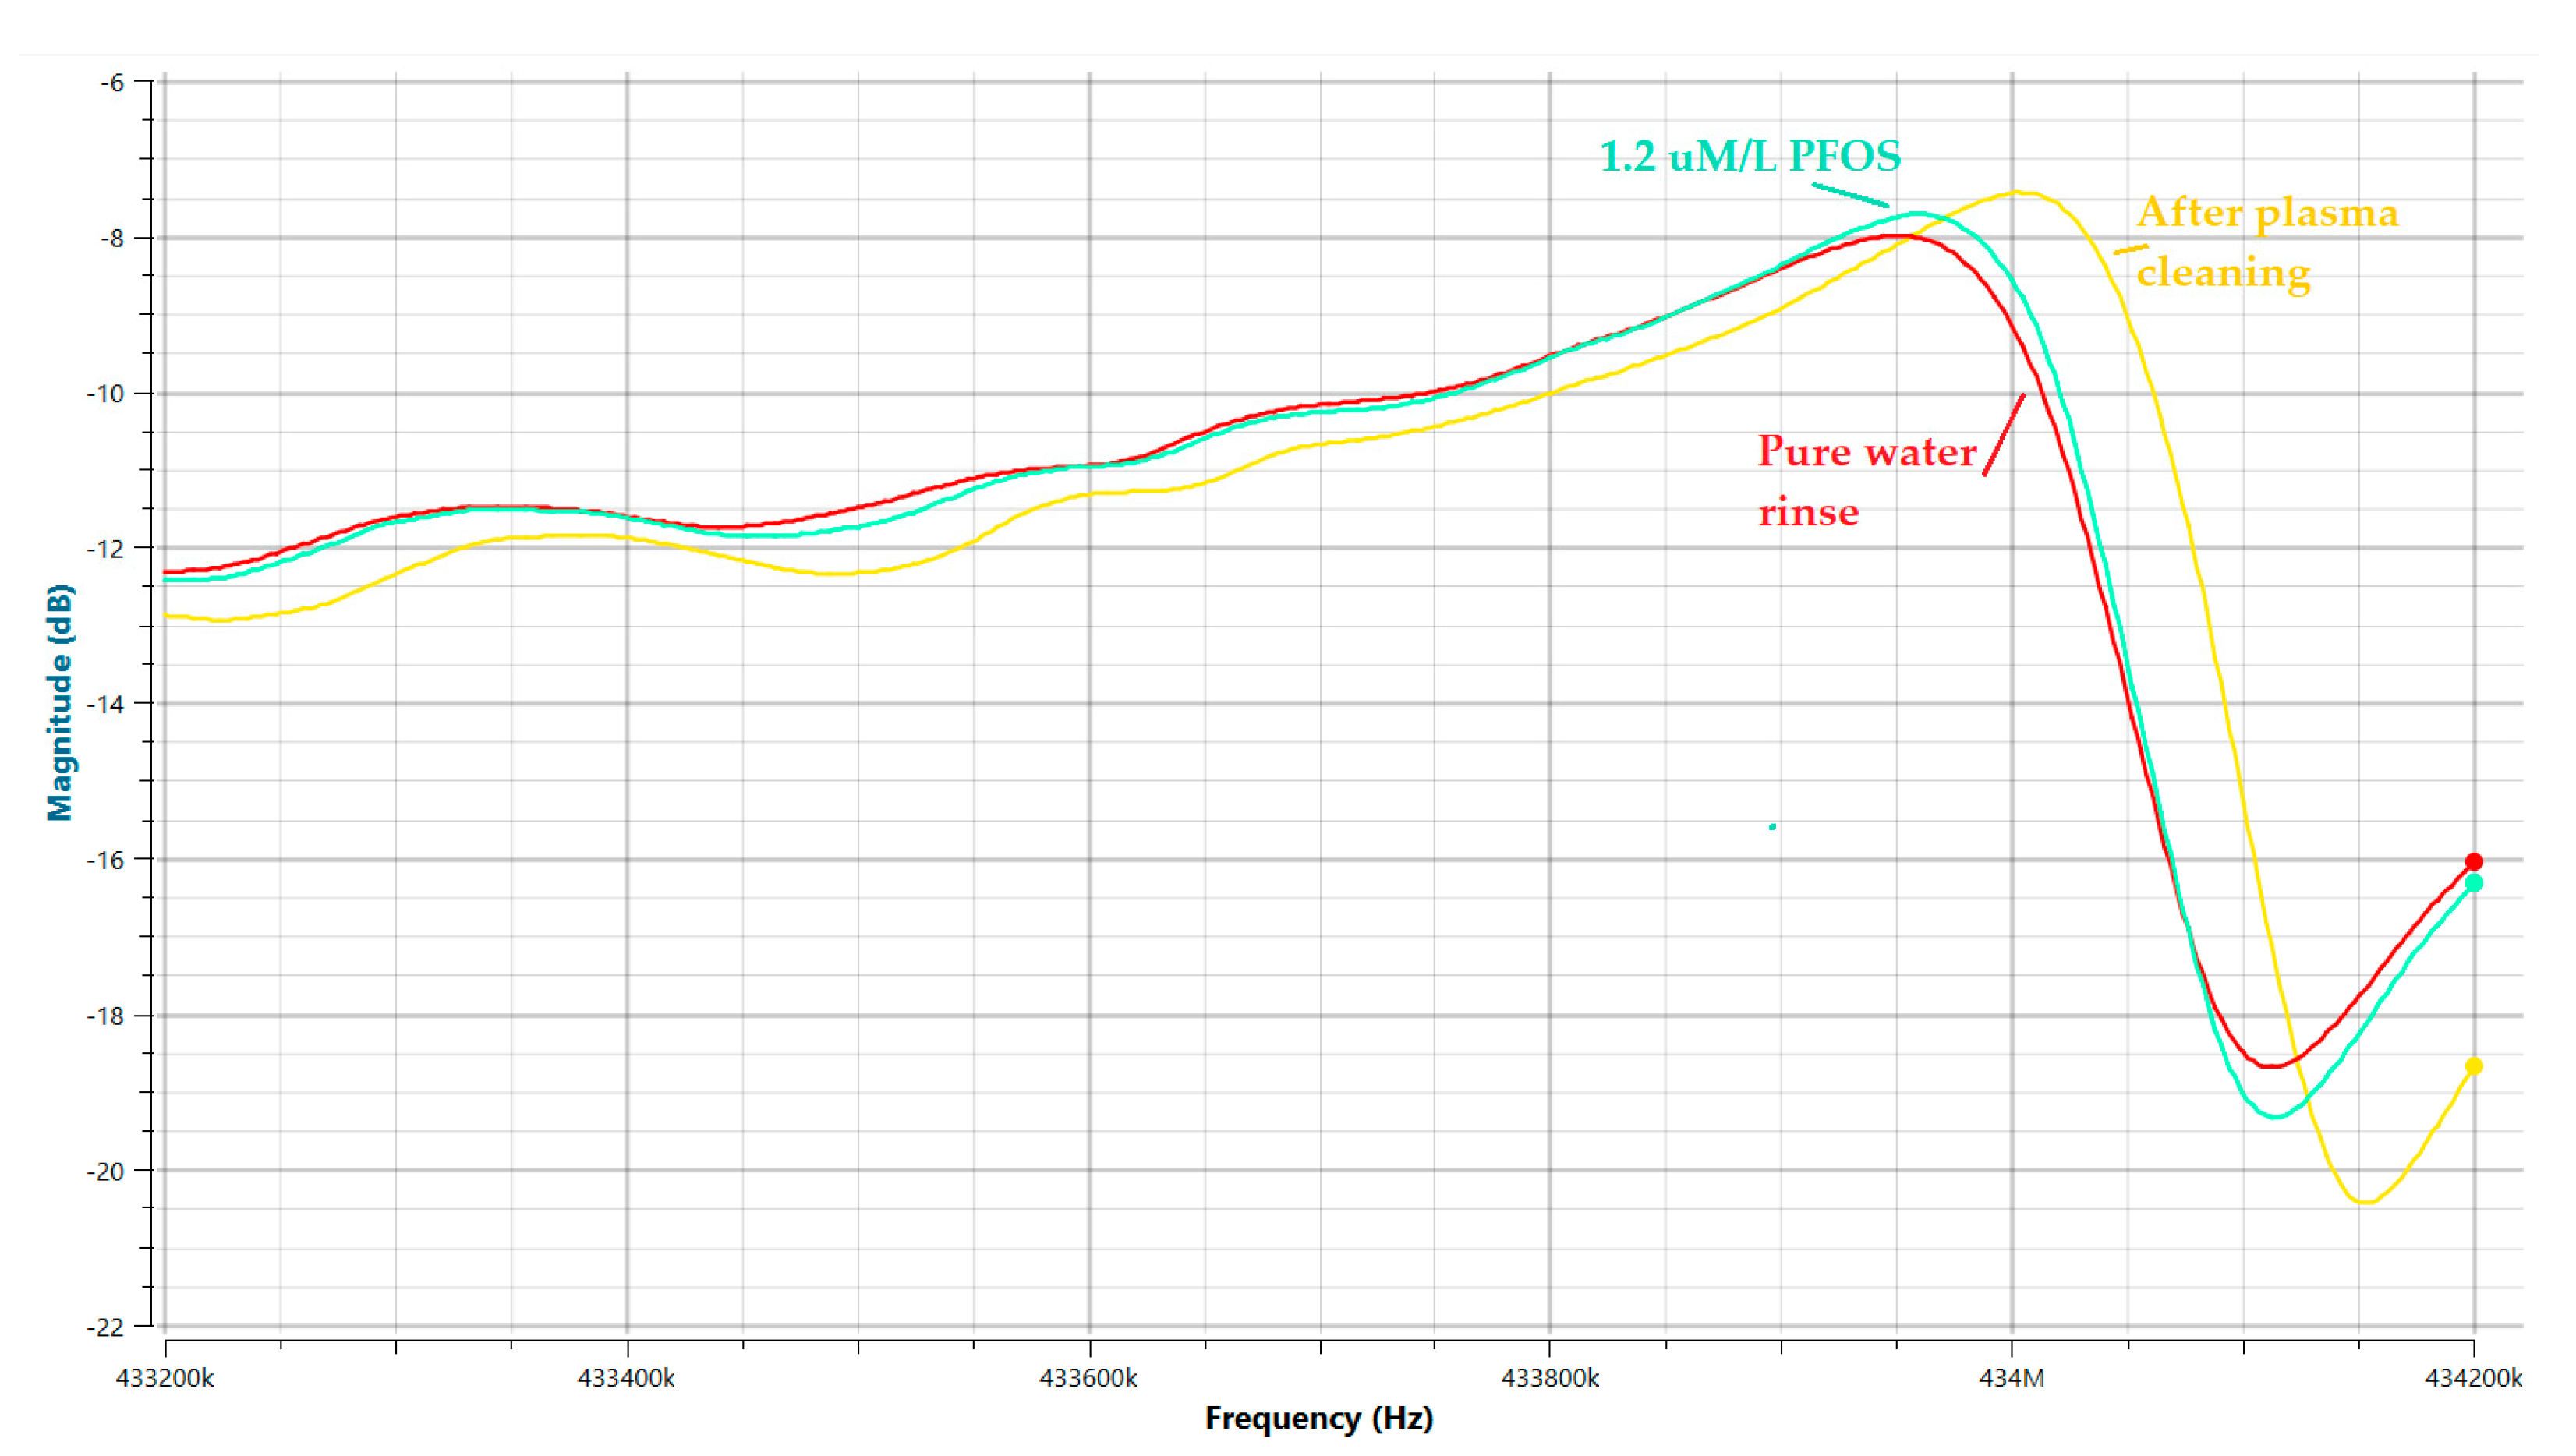
| After plasma | 434.042 | 0 | 0 | 2.10 | 2862 |
| 1 LB film | 433.981 | −61 | 1.40 | 2.06 | 2807 |
| Water1—pure | 434.003 | +22 | 0.51 | 2.10 | 2862 |
| Water2 + 0.2 µmol/L PFOS | 434.001 | −2 | 0.046 | 2.04 | 2781 |
| Water3 + 0.4 µmol/L PFOS | 433.936 | −65 | 1.49 | 1.80 | 2453 |
| Water4 + 0.6 µmol/L PFOS | 433.898 | −38 | 0.87 | 1.75 | 2384 |
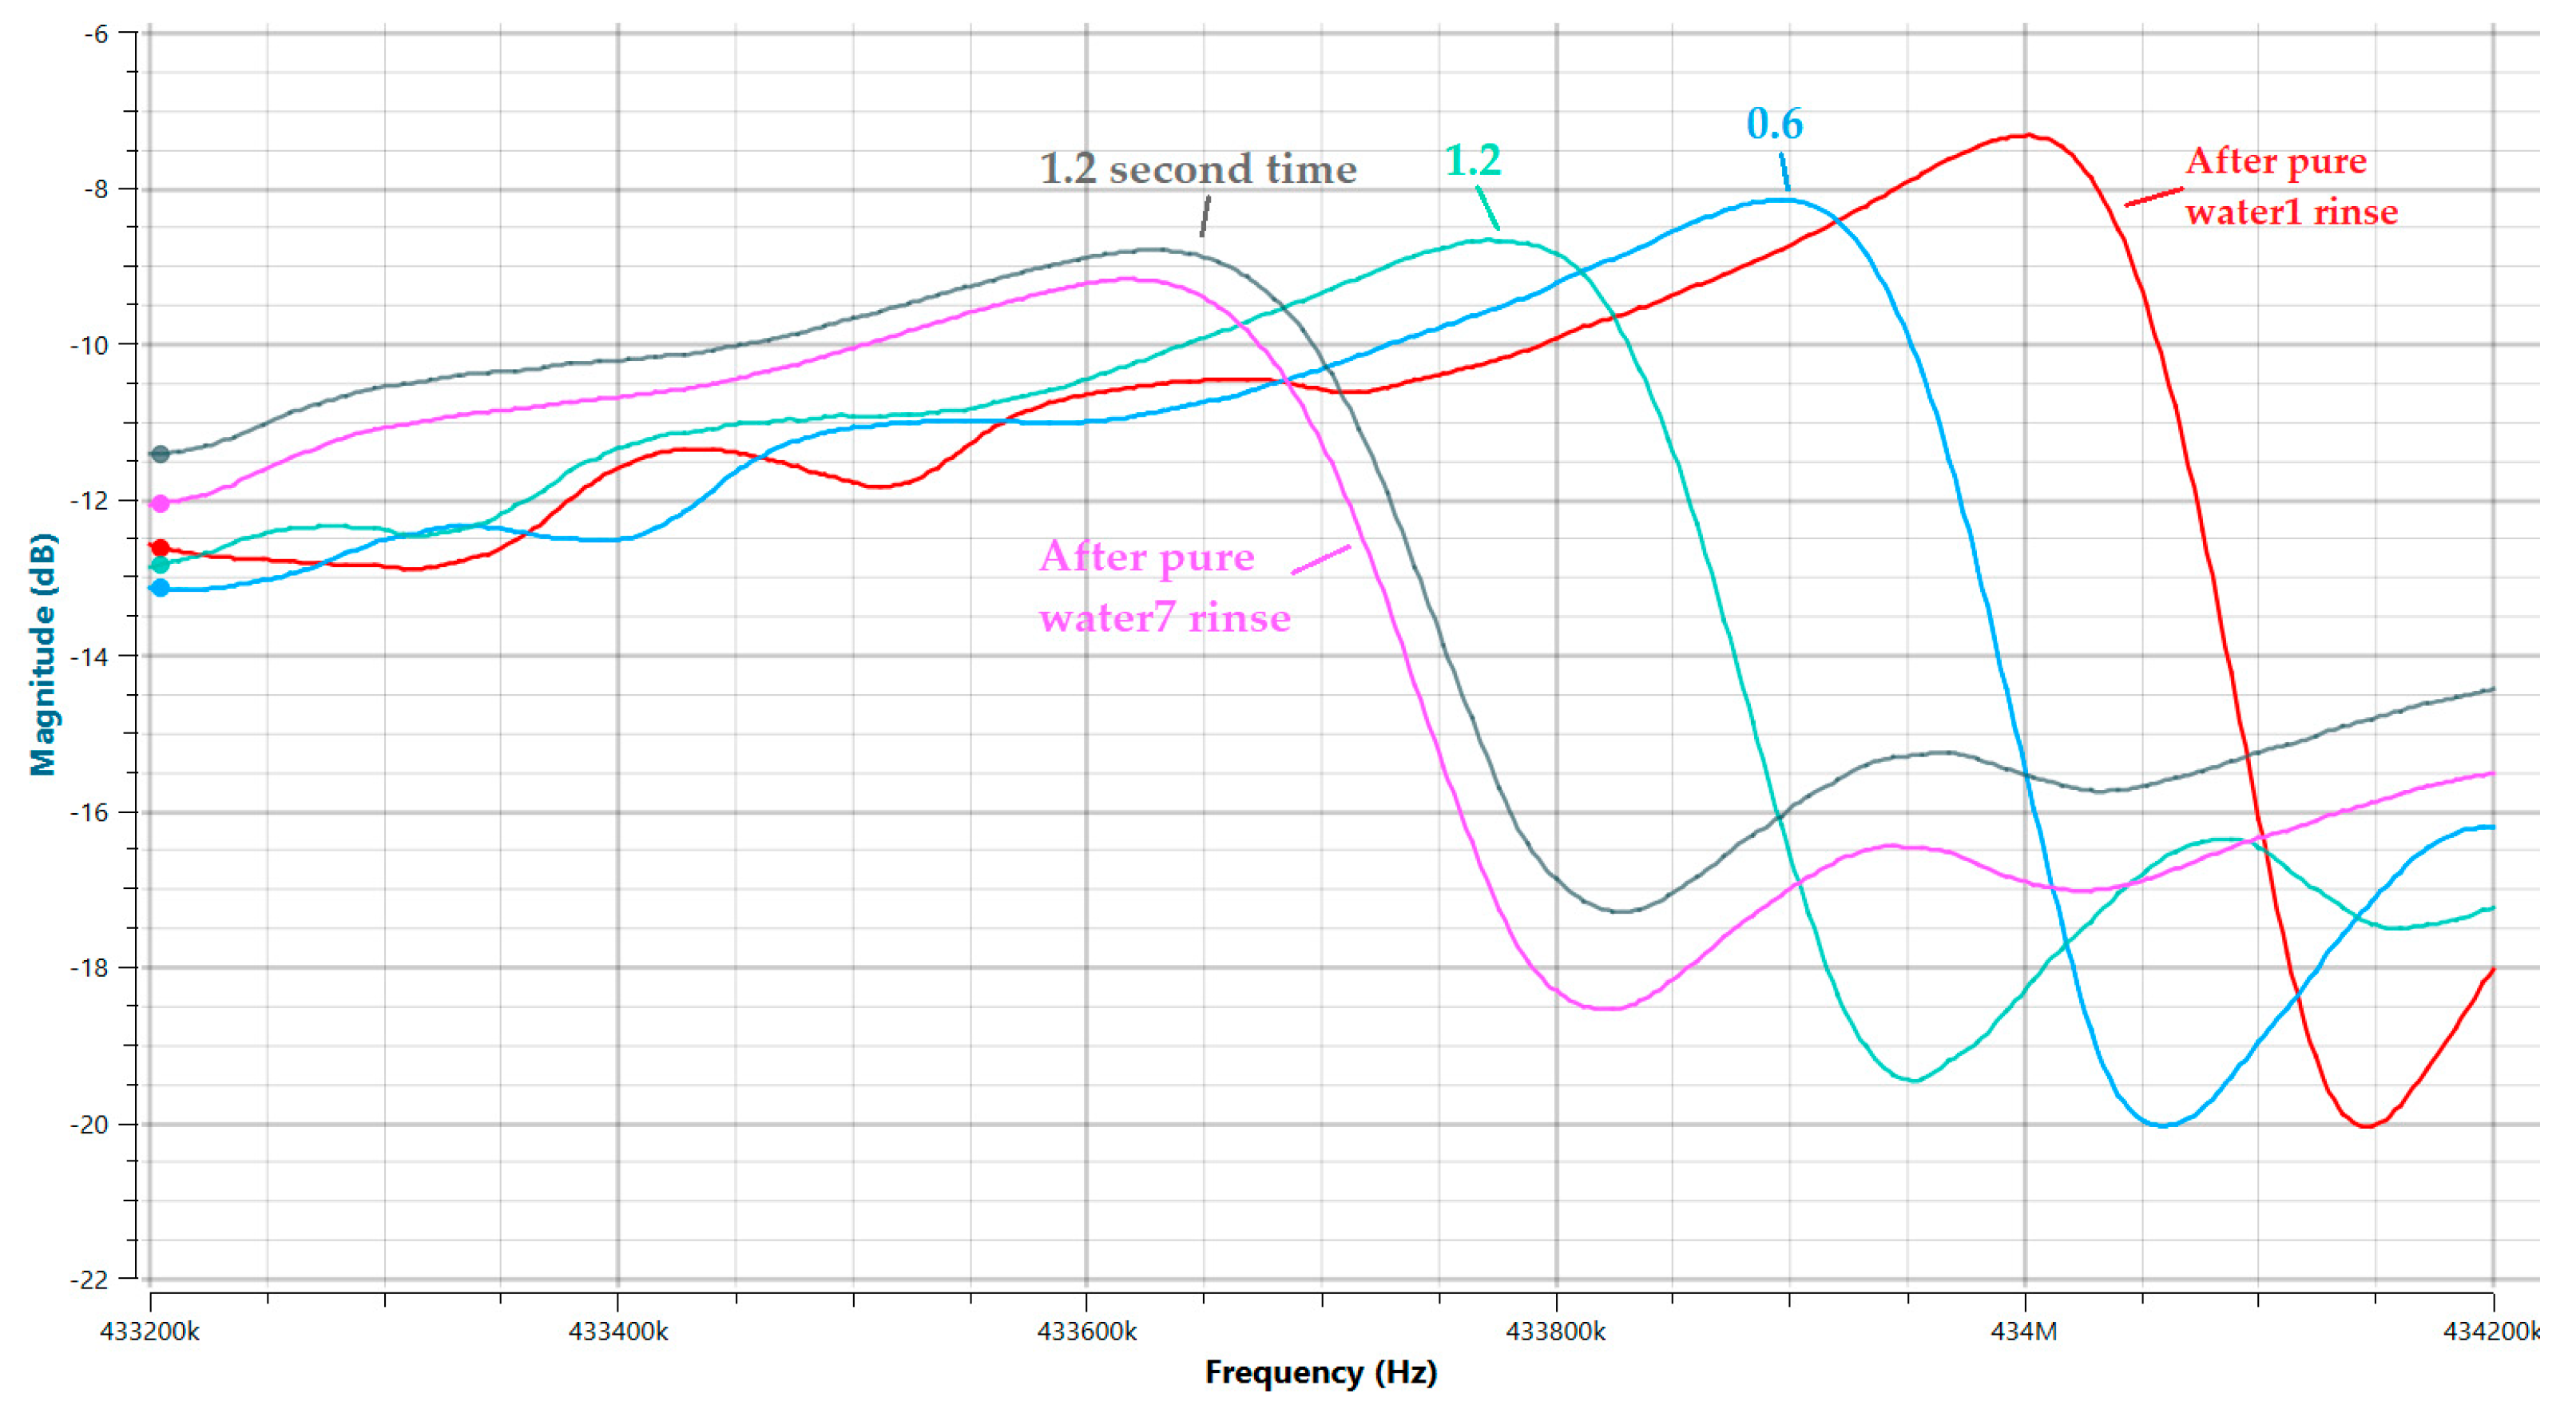
| Water5 + 1.2 µmol/L PFOS | 433.780 | −118 | 2.71 | 1.54 | 2097 |
| Water6 + 1.2 µmol/L PFOS again | 433.636 | −144 | 3.24 | 1.09 | 1484 |
| Water7—pure | 433.626 | −10 | 0.23 | 1.05 | 1430 |
| Water8 + 1.2 µmol/L dodecyl sulfate | 433.620 | −6 | 0.14 | 0.64 | 872 |
Disclaimer/Publisher’s Note: The statements, opinions and data contained in all publications are solely those of the individual author(s) and contributor(s) and not of MDPI and/or the editor(s). MDPI and/or the editor(s) disclaim responsibility for any injury to people or property resulting from any ideas, methods, instructions or products referred to in the content. |
© 2024 by the authors. Licensee MDPI, Basel, Switzerland. This article is an open access article distributed under the terms and conditions of the Creative Commons Attribution (CC BY) license (https://creativecommons.org/licenses/by/4.0/).
Share and Cite
Ivanov, G.R.; Venelinov, T.; Marinov, Y.G.; Hadjichristov, G.B.; Terfort, A.; David, M.; Florescu, M.; Karakuş, S. First Direct Gravimetric Detection of Perfluorooctane Sulfonic Acid (PFOS) Water Contaminants, Combination with Electrical Measurements on the Same Device—Proof of Concepts. Chemosensors 2024, 12, 116. https://doi.org/10.3390/chemosensors12070116
Ivanov GR, Venelinov T, Marinov YG, Hadjichristov GB, Terfort A, David M, Florescu M, Karakuş S. First Direct Gravimetric Detection of Perfluorooctane Sulfonic Acid (PFOS) Water Contaminants, Combination with Electrical Measurements on the Same Device—Proof of Concepts. Chemosensors. 2024; 12(7):116. https://doi.org/10.3390/chemosensors12070116
Chicago/Turabian StyleIvanov, George R., Tony Venelinov, Yordan G. Marinov, Georgi B. Hadjichristov, Andreas Terfort, Melinda David, Monica Florescu, and Selcan Karakuş. 2024. "First Direct Gravimetric Detection of Perfluorooctane Sulfonic Acid (PFOS) Water Contaminants, Combination with Electrical Measurements on the Same Device—Proof of Concepts" Chemosensors 12, no. 7: 116. https://doi.org/10.3390/chemosensors12070116
APA StyleIvanov, G. R., Venelinov, T., Marinov, Y. G., Hadjichristov, G. B., Terfort, A., David, M., Florescu, M., & Karakuş, S. (2024). First Direct Gravimetric Detection of Perfluorooctane Sulfonic Acid (PFOS) Water Contaminants, Combination with Electrical Measurements on the Same Device—Proof of Concepts. Chemosensors, 12(7), 116. https://doi.org/10.3390/chemosensors12070116