Article

SERS Substrate Based on Ag Nanoparticles@Layered Double Hydroxide@graphene Oxide and Au@Ag Core–Shell Nanoparticles for Detection of Two Taste and Odor Compounds

by
Zhixiong Lao
1,
Mingmin Zhong
2,
Yin Liang
3,
Jianrong Tan
1,
Xiaoyan Liang
1,
Wucheng Xie
4,
Yong Liang
2,* and
Jun Wang
5,*
1
Foshan Gaoming Water Supply Co., Ltd., Foshan 528000, China
2
School of Chemistry, South China Normal University, Guangzhou 510631, China
3
China GDE Engineering Co., Ltd., Guangzhou 511447, China
4
School of Environment and Chemical Engineering, Foshan University, Foshan 528000, China
5
College of Marine Sciences, South China Agricultural University, Guangzhou 510642, China
*
Authors to whom correspondence should be addressed.
Chemosensors 2024, 12(7), 137; https://doi.org/10.3390/chemosensors12070137
Submission received: 17 May 2024 / Revised: 1 July 2024 / Accepted: 3 July 2024 / Published: 11 July 2024

Abstract

:
Sulfide organics and phenols are ubiquitous in freshwater lakes all over the world. As two taste and odor (T and O) compounds, they are harmful to the environment and human body. The existing detection methods for T and O compounds mainly include sensory analysis and gas-phase mass spectrometry, which are cumbersome and time-consuming. Herein, a method for the simultaneous and rapid detection of two T and O compounds (methyl sulfide and 2,4-di-tert-butylphenol) based on surface-enhanced Raman spectroscopy (SERS) is firstly developed. The SERS substrate was prepared by coating Ag nanoparticles (Ag NPs), layered double hydroxide (LDH), and graphene oxide (GO) on the surface of an Ag-coated Au nanoparticle (Au@Ag NP) substrate. Under optimal conditions, this SERS substrate possessed low detection limits of 1.53 ppm for methyl sulfide and 0.39 ppm for 2,4-di-tert-butylphenol. In addition, it took only 20 min to complete the detection using this method, without complex sample pretreatment. Furthermore, it was successfully applied to simultaneously detect methyl sulfide and 2,4-di-tert-butylphenol in actual water samples and had good application prospects for the rapid detection of T and O compounds in water.

1. Introduction

Taste and odor (T and O) compounds are common in freshwater lakes all over the world [1]. Solving the problem is an important issue that requires global efforts. In recent years, geosmin, 2-methyliso-borneol [2], β-cyclocitral [3], phenols [4], and sulfide organics [5] have all been studied. Sulfide organics and phenols are more harmful than the others. Sulfide is a toxic substance that can produce unpleasant smells, such as garlic-like or fishy odors [6]. Excessive inhalation of sulfide has deleterious effects on the human respiratory system. Phenols have been listed as carcinogenic monocyclic aromatic hydrocarbons and must be monitored [7]. In addition, phenol-containing wastewater can pollute the air, water, soil, and food if it is discharged directly or irrigated on farmland without treatment. Therefore, detecting sulfide organics and phenols in water is particularly necessary.
At present, detection methods of T and O compounds mainly include sensory gas chromatography (GC) [8] and GC-mass spectrometry (GC-MS) [9]. Both of these approaches have several disadvantages. Sensory assessment requires a long period of time to train specialized analytes at the early stage. GC-MS has good selectivity and high accuracy, but it is extremely time-consuming and requires tedious sample pretreatment [10]. Therefore, to realize the efficient and rapid detection of T and O compounds, it is necessary to develop new detection methods.
Surface-enhanced Raman spectroscopy (SERS) is a relatively new rapid detection method [11]. A greatly enhanced Raman scattering signal can be obtained by adsorbing analytes onto nano-metallic materials with rough surfaces. With the rapid development of nanomaterials, SERS technology has shown great application value. It can be used not only for the detection of pesticides [12], antibiotics [13], and hormones [14], but also for volatile substances [15] and other environmental pollutants. However, there have been few reports on the detection of T and O compounds using SERS technology.
Raman substrates with different morphologies and compositions will exhibit different SERS performances, thereby affecting the detection ability of SERS [16]. Nano-Au and nano-Ag are the nanomaterials most commonly used as Raman substrates. The former is easier to synthesize, and its morphology is easier to control, while the latter has stronger Raman sensitivity. To enable the application of SERS technology in the rapid detection of T and O compounds in water, this work initially prepared Ag-coated Au nanoparticles (Au@Ag NPs) as a Raman substrate. Meanwhile, it was found that, as volatile organic substances (VOCs), the T and O compounds would easily overflow from the material surface when they were adsorbed by the metal substrate. This may be caused by the open system on the surface of the metal substrate. Therefore, it is necessary to develop a type of nanomaterial with a strong retention ability to achieve a more efficient enrichment of T and O compounds.
Different structures of layered double hydroxide (LDH) can be found by adding different amounts of acidic solution [17]. With its unique lamellar structure and hollow cage, the material effectively increases VOCs’ flow resistance, thereby improving the preservation of the substances [18]. By integrating it with carbon nanomaterials, researchers have significantly improved the efficiency of this enrichment. For example, Mina et al. developed CoZnAl-LDH/graphene oxide (GO) composites, which demonstrated a notable removal ratio for methylene blue [19].
Based on the above background, this study first used SERS technology to simultaneously detect two kinds of T and O compounds, i.e., sulfides and phenols. As their representatives, methyl sulfide (MS) and 2,4-di-tert-butylphenol (DTBP) were regarded as the analytic targets. In this study, an analysis method based on a novel SERS substrate for the efficient enrichment of T and O compound targets and signal enhancement was developed, which can achieve the rapid and simultaneous detection of the targets in water. The whole preparation process of the SERS substrate is shown in Figure 1. First, Au@Ag NPs were prepared and were attached to a slide, acting as plasmonic nano-antenna. The antenna layer was then covered with the composite of Ag NPs@CoNi-layered double hydroxide (LDH)@GO, which can efficiently preserve T and O compounds. The samples, after incubating them with the prepared SERS substrate, could be simply and rapidly determined by SERS. The detection conditions were optimized, and the proposed method was applied to the simultaneous detection of MS and DTBP in actual water samples. This method would have good application prospects in the rapid detection of T and O compounds in water.

2. Experimental Section

2.1. Materials

Chloroauric acid, Ag nitrate, ascorbic acid, cobaltous nitrate hexahydrate (Co (NO3)2·6H2O), and MS were purchased from Macklin Biochemical Co., Ltd. (Shanghai, China). Nickel nitrate hexahydrate (Ni (NO3)2·6H2O), trisodium citrate, polyvinyl pyrrolidone (PVP), ethylene glycol, 2-mthylimidazole, and ethanol were obtained from Aladdin Chemistry Co., Ltd. (Shanghai, China). GO dispersion was purchased from Fugui Co., Ltd. (Shanghai, China). DTBP was manufactured by Kangrun Medical Technology Co., Ltd. (Zhongshan, China). The actual odor water sample was provided by Gaoming Water Co., Ltd. (Foshan, China).

2.2. Apparatus and Equipment

The main instruments and equipment used in this work are listed in Table S1 in the Supplementary Information File.

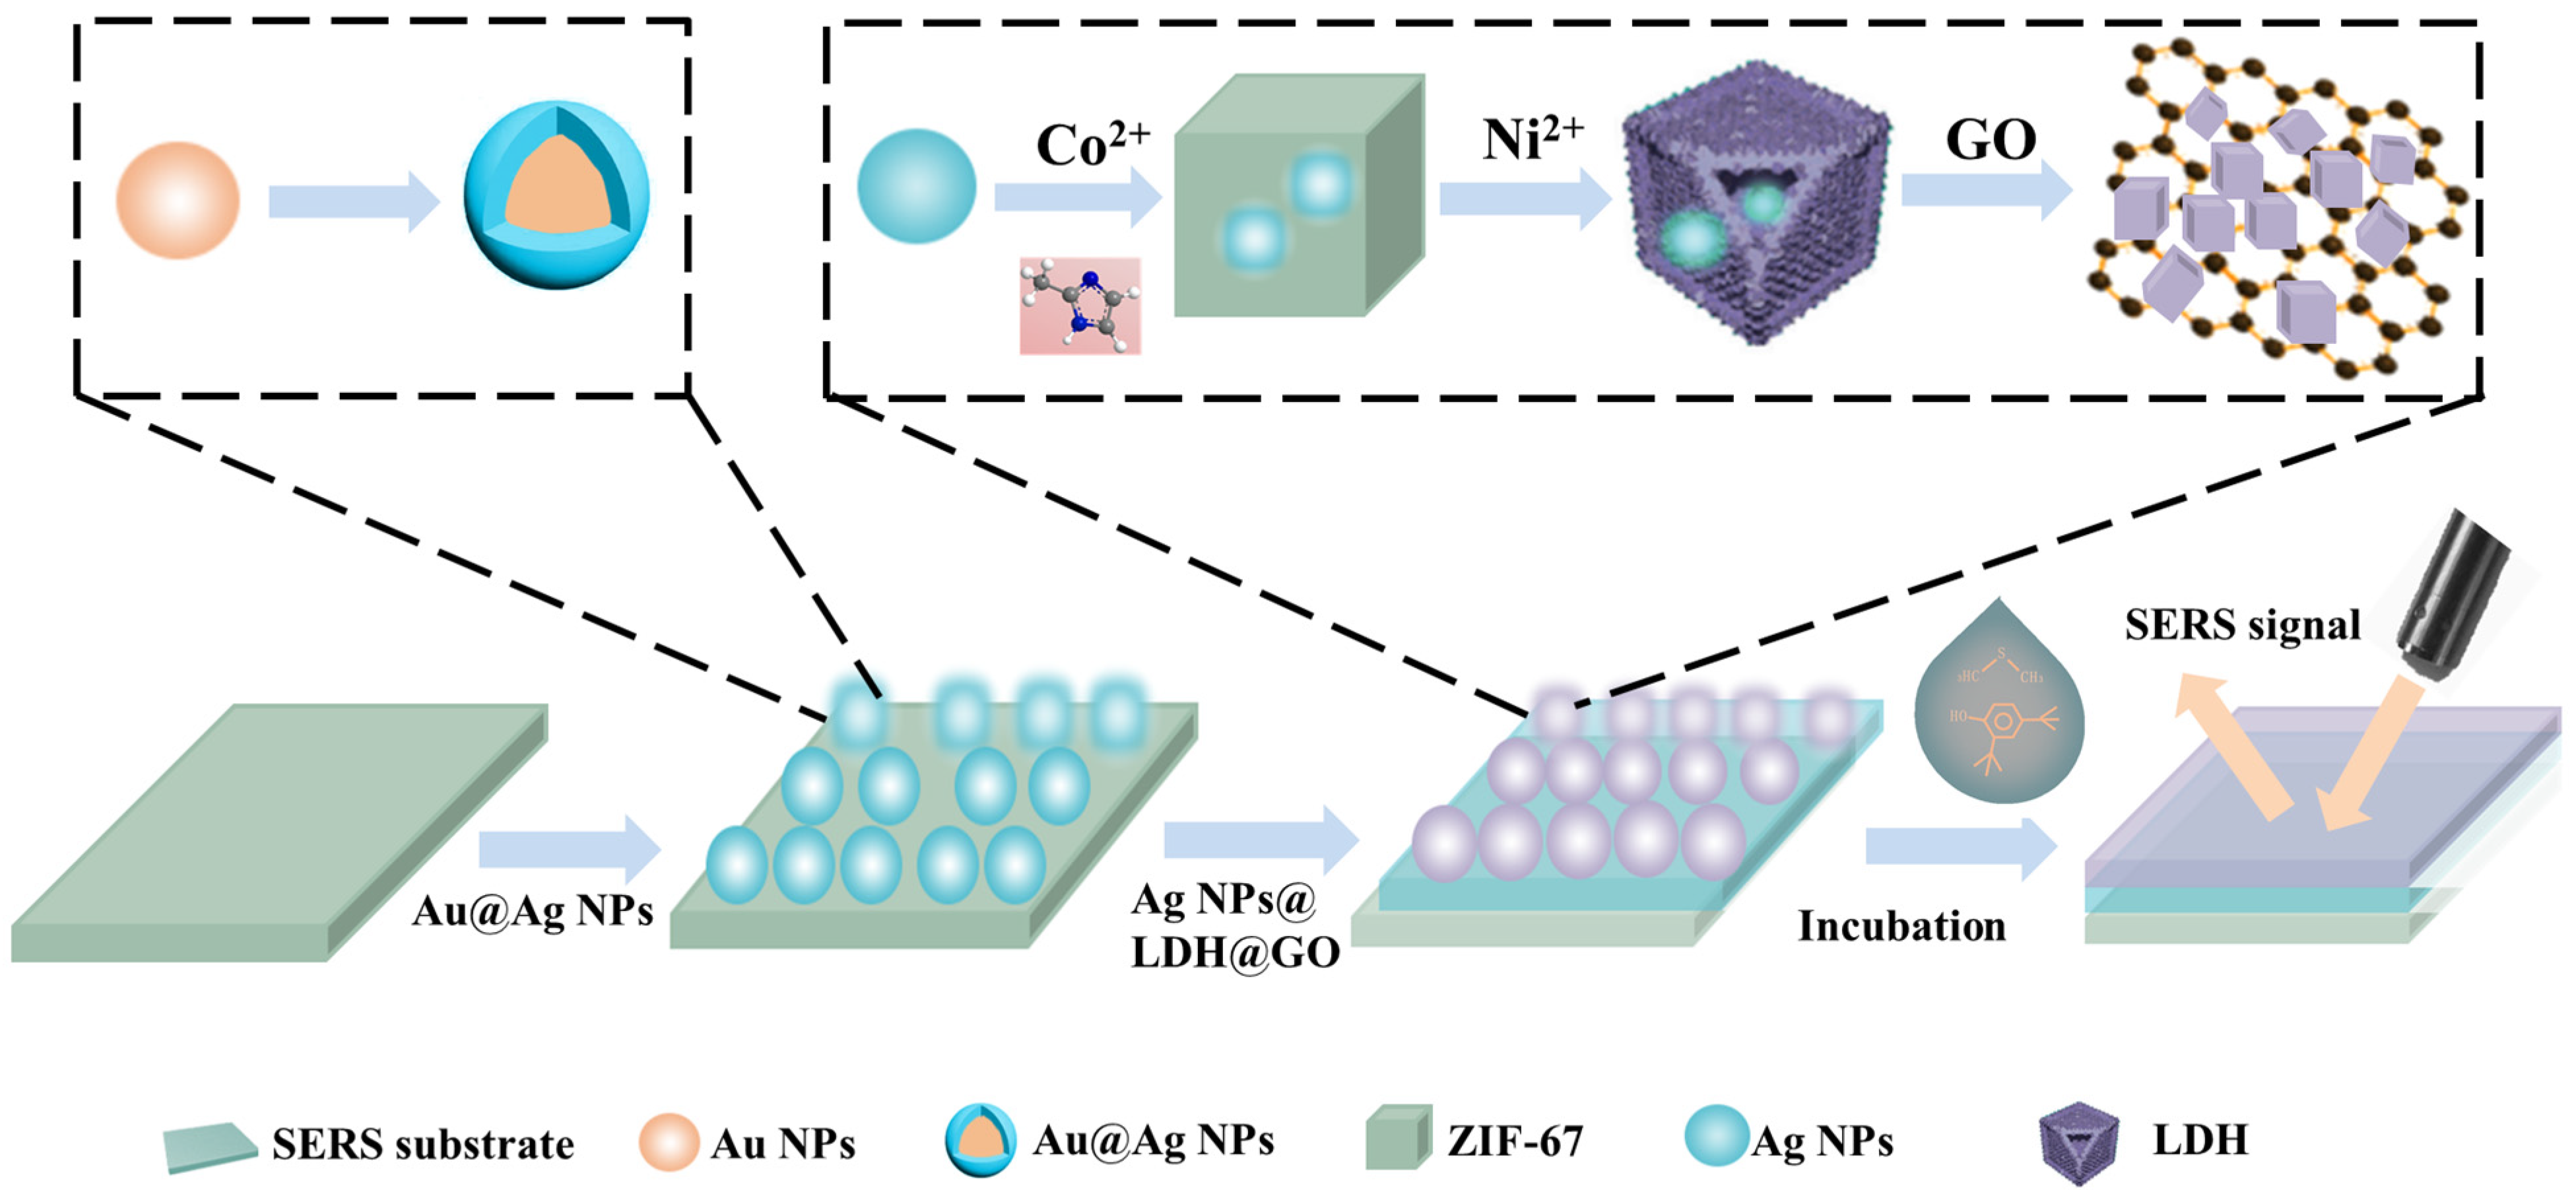
2.3. Preparation of Core–Shell Au@Ag NPs

Au NPs were prepared by the citrate reduction process. Briefly, an aqueous solution of chloroauric acid (1 g/L, 4.75 mL) was added to 60 mL of distilled water. The solution was placed in a 120 °C water bath under agitation. The aqueous trisodium citrate (1%, 0.5 mL) was then quickly added. Heating was stopped when the solution turned a consistent red color, and it was then set aside for further preparation.
To prepare the Au@Ag NPs, 6 mL of Au NPs was added to a solution of trisodium citrate (1%, 120 μL). The solution was then mixed on a vortex oscillator for 10 min. Subsequently, ascorbic acid (5 mM, 560 μL) was added drop by drop, followed by an equal volume of Ag nitrate. After the addition of these drops, the oscillator treatment was continued for 20 min. The Au@Ag NPs with a core–shell structure could finally be obtained. Different amounts of ascorbic acid and Ag nitrate were used to change the thickness of the Ag shell. The Au@Ag NPs, with the addition of 480, 640, 720 and 800 μL of ascorbic acid and Ag nitrate, were also synthesized in this experiment.

2.4. Synthesis of Ag NPs

Ag NPs were prepared by a liquid-phase method. Briefly, 0.3 g of PVP was dissolved in a flask containing 17 mL of ethylene glycol, which was then heated in an oil bath at 160 °C under agitation. A mixed solution of Ag nitrate and ethylene glycol (36.5 mg/L, 3 mL) was slowly prepared. Heating was continued for 30 min, and the mixed solution was then centrifuged for 10 min at a frequency of 9000 rpm/min. After washing the precipitate with methanol twice, the Ag NPs could be obtained. Finally, the Ag NPs were preserved in 20 mL of ethanol.

2.5. Fabrication of Ag NPs@LDH@GO

First, 908 mg of 2-methylimidazole was dissolved in 10 mL of the aforementioned ethanol solution, containing 10 mg of AgNPs via a 30 min ultrasound treatment. A solution containing 58 mg of Co (NO3)2·6H2O and 5 mL of ethanol was then mixed with the former solution via agitation for 1.5 h. The sediment was collected by centrifugation for 5 min at a frequency of 8000 rpm/min. Afterwards, the product was dried at 40 °C for 10 h to obtain Ag NPs@ZIF-67.
Next, 20 mg of Ag NPs@ZIF-67 was dispersed in 10 mL of ethanol with 60 mg Ni (NO3)2·6H2O. The mixed solution was then heated in an 85 °C water bath for 1 h under agitation. The precipitation was collected by centrifugation (8000 rpm/min, 5 min) and placed in a vacuum drying oven for 10 h at 40 °C. After this, Ag NPs@LDH was obtained.
In total, 10 mg of Ag NPs@LDH was dispersed in 5 mL of ethanol, followed by an addition of GO dispersion (2 mg/mL, 500 μL) under agitation. The mixture was then stirred vigorously in a 60 °C water bath for 2 h. Subsequently, the Ag NPs@LDH@GO was collected by centrifugation (8000 rpm/min, 5 min) and redistributed in 5 mL of ethanol.

2.6. Preparation of SERS Substrate and the Process of SERS Detection

A mold with circular holes (diameter 2 mm, depth 0.3 mm) was placed on a clean slide, and an ethanol solution of Au@Ag NPs, prepared in step 2.3, was then dripped into the circular holes using a precision syringe until the holes were completely filled. The ethanol was evaporated, and the Au@Ag NPs were dried on the holes as the first layer. Subsequently, the Ag NPs@LDH@GO solution was uniformly dripped onto the dried Au@Ag NP substrate using a precision syringe, ensuring even coverage across the surface until the holes were completely filled. After natural drying, the mold was carefully removed, and the compound SERS substrate was obtained.
The SERS substrate and a standard solution of analytes were placed in a closed container and incubated in a water bath. In this case, the substrate had to be fully submerged in the solution. The SERS base was then taken out and detected using the confocal micro-Raman spectrometer immediately. The wavelength was set at 785 nm, the acquisition time was 10 s, the laser power was 0.5 mW, and the measurement was accumulative and based on two iterations. The error bar was obtained by three parallel tests.

2.7. Optimization of the SERS Detection Conditions

A mixed ethanol solution of MS (2.5 mL/L) and DTBP (18.5 mg/L) was configured to optimize the SERS detection conditions.
Five groups of mixed solution were each placed with the SERS substrate in a closed chamber individually. The pH values of five solutions were adjusted to 5, 6, 7, 8, and 9, respectively. The incubation was then carried out under 25 °C for 10 min. The SERS detection was conducted.
The incubation heating temperature was set at 25 °C, and the pH value of the solution was adjusted to 8. The SERS signal was then detected after the mixed solution was incubated with the same SERS substrate for 5, 10, 15, 20, 25, and 30 min.
The pH value of the solution was set to 8 for 20 min, and the five groups of analyte solutions with the SERS substrate were placed together under the temperatures of 20 °C, 25 °C, 30 °C, 35 °C, and 40 °C for incubation, respectively. The SERS test was then conducted.

2.8. Determination of the Standard Solutions of MS and DTBP

MS and DTBP were dissolved in ethanol, respectively, to make stock solutions at a concentration of 0.25 mg/mL. The two solutions were then diluted to obtain standard solutions of different series concentrations (MS: 0.05, 0.1, 1, 2, 4, 9, and 11 mL/L; DTBP: 1, 2, 8, 20, 30, and 40 mg/L), which were then incubated with the SERS substrate for SERS detection, and the data for each were measured three times in parallel. The selection of different concentration ranges was based on the analyte contents in the actual odor water sample. According to the SERS spectrum of standard solutions, a standard curve of characteristic peak intensity (Y) and analyte concentration (X) was drawn.
The limit of detection (LOD) can be calculated from the minimum measurable value XL. According to the definition of the International Union of Pure and Applied Chemistry, the calculation formula of XL is as follows [20]:
XL = KSbi + Xbi
Sbi and Xbi represent the standard deviation and mean values of the Raman strength of the blank samples, respectively. K, which is set as 3 in this paper, is the value selected according to the confidence degree.

2.9. Determination of MS and DTBP in Actual Water Samples

The actual odor water samples were first detected using GC. The detection results showed that MS and DTBP both existed in the water at concentrations of 0.36 mL/L and 16.80 mg/L, respectively.
Subsequently, the water sample was incubated with the SERS substrate for 20 min under an incubation temperature of 30 °C and a pH value of 8, followed by SERS detection. According to the SERS standard curve, the contents of MS and DTBP in the water sample could be calculated and compared with the GC detection results, respectively. The recoveries of MS and DTBP could also be obtained.

3. Results and Discussion

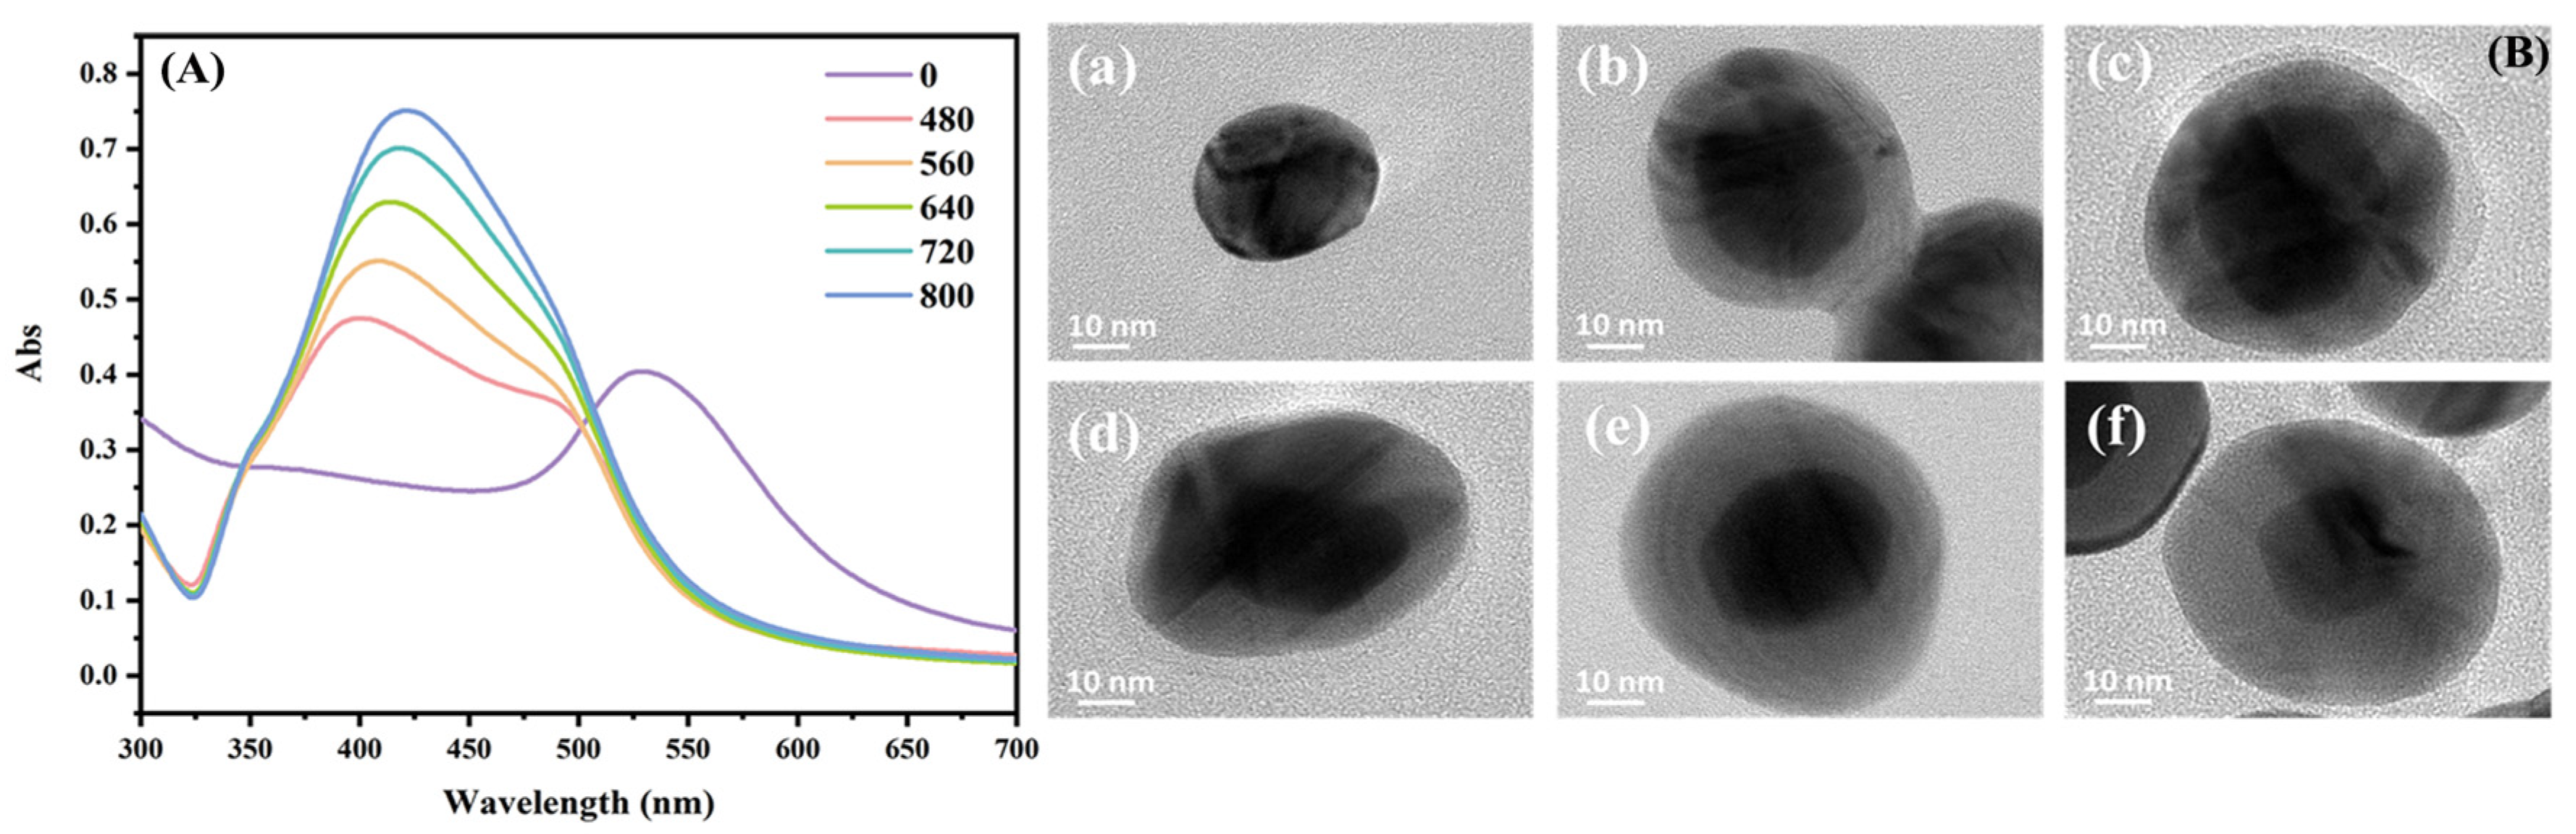
3.1. Characterization of Materials

In order to verify the successful formation of Au@Ag NPs, the ultraviolet (UV) detection of Au NPs and five Au@Ag NPs with different additions of Ag nitrate were carried out first. Figure 2A shows that the Au NPs had an absorption peak at about 525 nm. When the Ag nitrate was added to the Au NPs, a new peak appeared at about 400 nm, which corresponded to the Ag shell, demonstrating that the Au@Ag NPs had been successfully synthesized. Furthermore, the UV-vis absorption spectra peak of Ag exhibited a red shift from 400 to 420 nm with an increase in the addition of Ag nitrate, which indicated that the more Ag nitrate added, the thicker the Ag shell would be. When the amount of Ag nitrate reached 720 μL, the peak of the Au NPs was entirely covered. This was because the Ag shell was thick enough that the incident light could not penetrate the Ag shell and reach the surface of the core Au NPs.
Figure 2B is the TEM image of Au NPs in different Ag thicknesses. The core–shell structure of Au@Ag NPs can be clearly observed in the image. The black area represents the Au NPs and the gray area was its Ag shell. It was also observed that the size of the synthesized Au NPs was about 35 nm. Furthermore, the thickness of the Ag layer in the Au@Ag NPs reached values of approximately 8, 9.5, 12, 14, and 17 nm as the amount of Ag nitrate increased from 480 to 800 μL.
Figure 3b shows the high-resolution TEM image of the Ag shell of Figure 3a. According to the measurement, the interplanar spacing of the Ag layer on the surface of the Au NPs is 0.234 nm. This was similar to the lattice constant of the (111) crystal face of Ag in the face-centered cubic lattice structure, indicating that the Ag grew along the (111) direction. Figure 3c shows that the Ag NPs’ sizes are greater than 100 nm. Figure 3e shows that the Ag NPs@LDH was a composite material with a layered nanocage wrapped around the central Ag NPs. The space inside the hollow LDH was able to accommodate two–three Ag NPs. When the Ag NPs@LDH was recombined with GO, it was observed that the Ag NPs@LDH was wrapped by GO, blurring the boundary of the nanocages (Figure 3f).
The XRD data are shown in Figure S1 from the Supplementary Information. The result of the Au NPs appeared to be the same as that of the Au@Ag NPs, with five diffraction peaks corresponding to five crystal planes, indicating that Au and Ag had similar lattice constants. The Ag NPs@LDH@GO had eight diffraction peaks in the XRD spectrum, and five were attributed to the Ag NPs. Their positions were consistent with the five crystal planes discussed above, but had higher intensity, indicating that Ag NPs synthesized in Ag NPs@LDH@GO had higher crystallinity. The other three diffraction peaks belonged to the three crystal planes of LDH, while the diffraction peaks of GO were obscured by the (003) plane of LDH but could not be observed in the image.

3.2. Comparison of SERS Performance of Au@Ag NPs with Different Sizes

In this work, MS was used as the target molecule to compare the SERS detection performance of Au@Ag NPs with different Ag shell thicknesses. Five Au@Ag NPs of different sizes were prepared as SERS substrates, respectively, and incubated in an ethanol solution with 5 mL/L MS. The SERS detection was then carried out, and the results are shown in Figure 4A. The SERS spectrogram of MS only has a Raman peak at 689 cm−1, corresponding to the stretching vibration peak of C-S. When the thickness of Ag was increased from 8 to 17 nm, the Raman intensity of MS also increased. Since the coupling strength between the core and shell reached a maximum when the thickness of the metal shell was between 5 and 10 nm [21], Au@Ag NPs with a Ag thickness of 9.5 nm were selected as the underlying material for the SERS substrate.
The Raman spectra of Au@Ag NPs/Ag NPs@LDH@GO, ethanol, MS, DTBP, and a mixed ethanol solution of MS and DTBP, are shown in Figure 4B. Figure 4B(d,e) show that MS only exhibited a weak peak at 689 cm−1, while DTBP had obvious Raman peaks at 670, 832, 1126, 1205, 1283, 1330, 1402, and 1452 cm−1 (the attributions of which can be seen in Table S2 in the Supplementary Information). It can also be observed from Figure 4B(a) that the Au@Ag NPs/Ag NPs@LDH@GO exhibited two weak peaks belonging to GO in the range of 1200–1600 cm−1 in the Raman spectra, indicating that the material had a low background signal in the Raman spectrum and could be used as the base for SERS.
In order to further verify the feasibility of Au@Ag NPs/Ag NPs@LDH@GO as a SERS substrate for the detection of two analytes, a mixed solution containing 10 mL/L of MS and 10 mg/L of DTBP in ethanol was used as a detection object. A comparison of the SERS performances of different SERS substrates was studied, and the results are shown in Figure 4C.
We can observe from Figure 4B(c) that the peaks belonging to the DTBP and MS would disappear in the solution, while the peaks of the ethanol solvent persisted. However, Figure 4C reveals that when the mixed solution was incubated and detected by the SERS substrates, the Raman signals of the two analytes were enhanced to different degrees; among them, the MS still had only one signal peak at 689 cm−1, while the intensity of the peak of DTBP was greatly enhanced at 1330 cm−1. Therefore, the peaks at 689 cm−1 and 1330 cm−1 can be selected as the characteristic peaks of MS and DTBP, respectively.
According to the comparison of the data in Figure 4C, when the Au@Ag NPs were used as a SERS substrate, the signals of DTBP and MS were comparatively weak. This may be because the surfaces of the Au@Ag NPs were open systems, and the analytes that combined on the surface would escape easily due to their volatile nature. When Ag NPs@LDH was used as the substrate, the Ag NPs could be agglomerated to a certain extent, due to the presence of LDH, which was able to provide dense hot spots. Meanwhile, LDH could increase the acquisition and retention capacity of analytes, making Ag NPs@LDH exhibit a more remarkable SERS effect and activity. The signal of the two analytes was further enhanced after a layer of Ag NPs @LDH was compounded on the surface of the Au@Ag NPs, which may be due to the interaction between the Au@Ag NPs in the bottom layer and the Ag NPs’ encapsulation in the LDH. To further enhance the signal strength of the analyte, Ag NP @LDH was coated with a layer of GO. As shown by the Raman spectrum, the strength of the characteristic peak of the analyte was indeed enhanced when the Au@Ag NPs/Ag NPs @LDH@GO were used as the SERS substrate, which may be caused by the formation of a new interface of Ag NPs @LDH with GO.

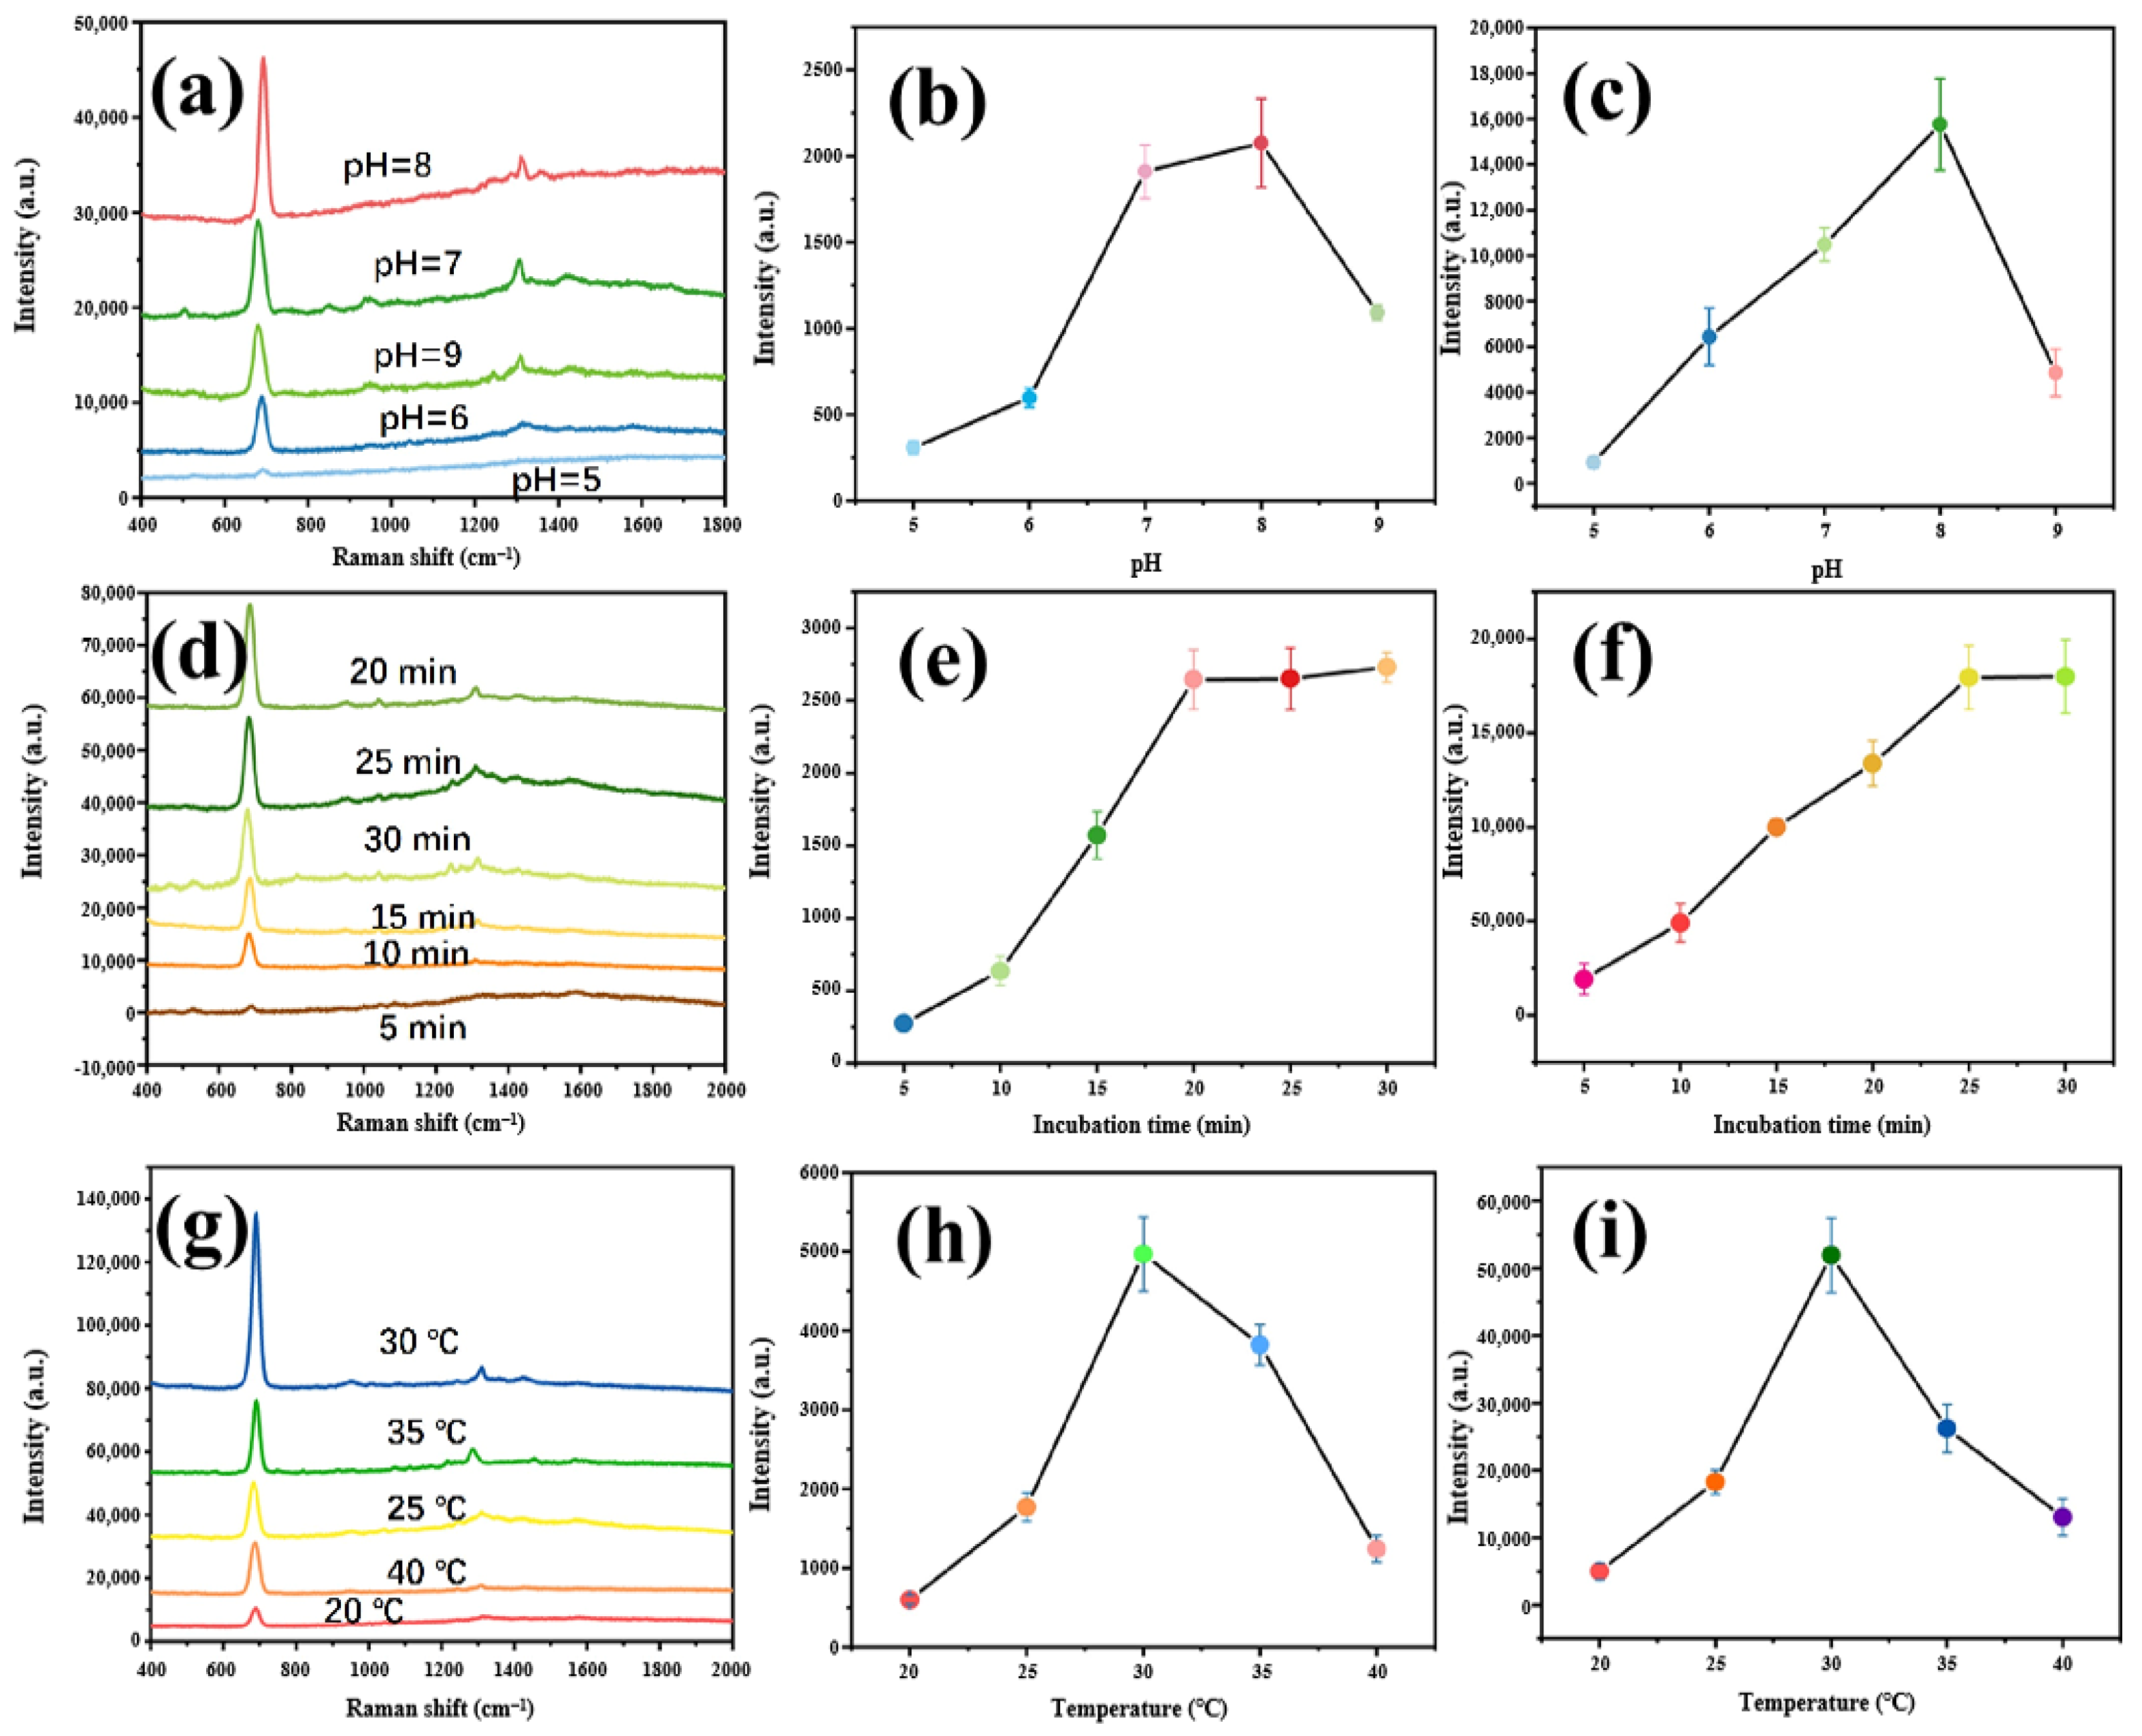
3.3. Influence of Incubation Conditions on SERS Effect of the Substrate

It has been shown that temperature, solution pH value, and incubation time can all impact the detection effect of the SERS substrate, the results of which are shown in Figure 5. As can be seen from Figure 5a–c, when the pH value of the solution was 8, the SERS substrate presented a better effect for the analyses. However, when the solution was basic, with a value exceeding 8, the performance of the substrate would decrease. This may be due to the relationship between pH value and Ag stability. In addition, the Ag NPs were more stable in a neutral or weakly alkaline environment. Therefore, in this work, the substrate had the highest detection ability in a weakly alkaline environment at pH 8.
According to Figure 5e,f, the Raman intensity of the analytes increased with longer incubation time, essentially reaching a stable state at 20 min. Therefore, 20 min was regarded as the optimal incubation time.
Figure 5g,h show that the best detection ability of the SERS substrate was when the incubation temperature was 30 °C. This may be because proper heating could cause a change in the molecular movement and could increase the probability of the binding of the analytes with the SERS substrate. As the temperature continues to rise, the analytes might escape, thus decreasing the SERS intensity.

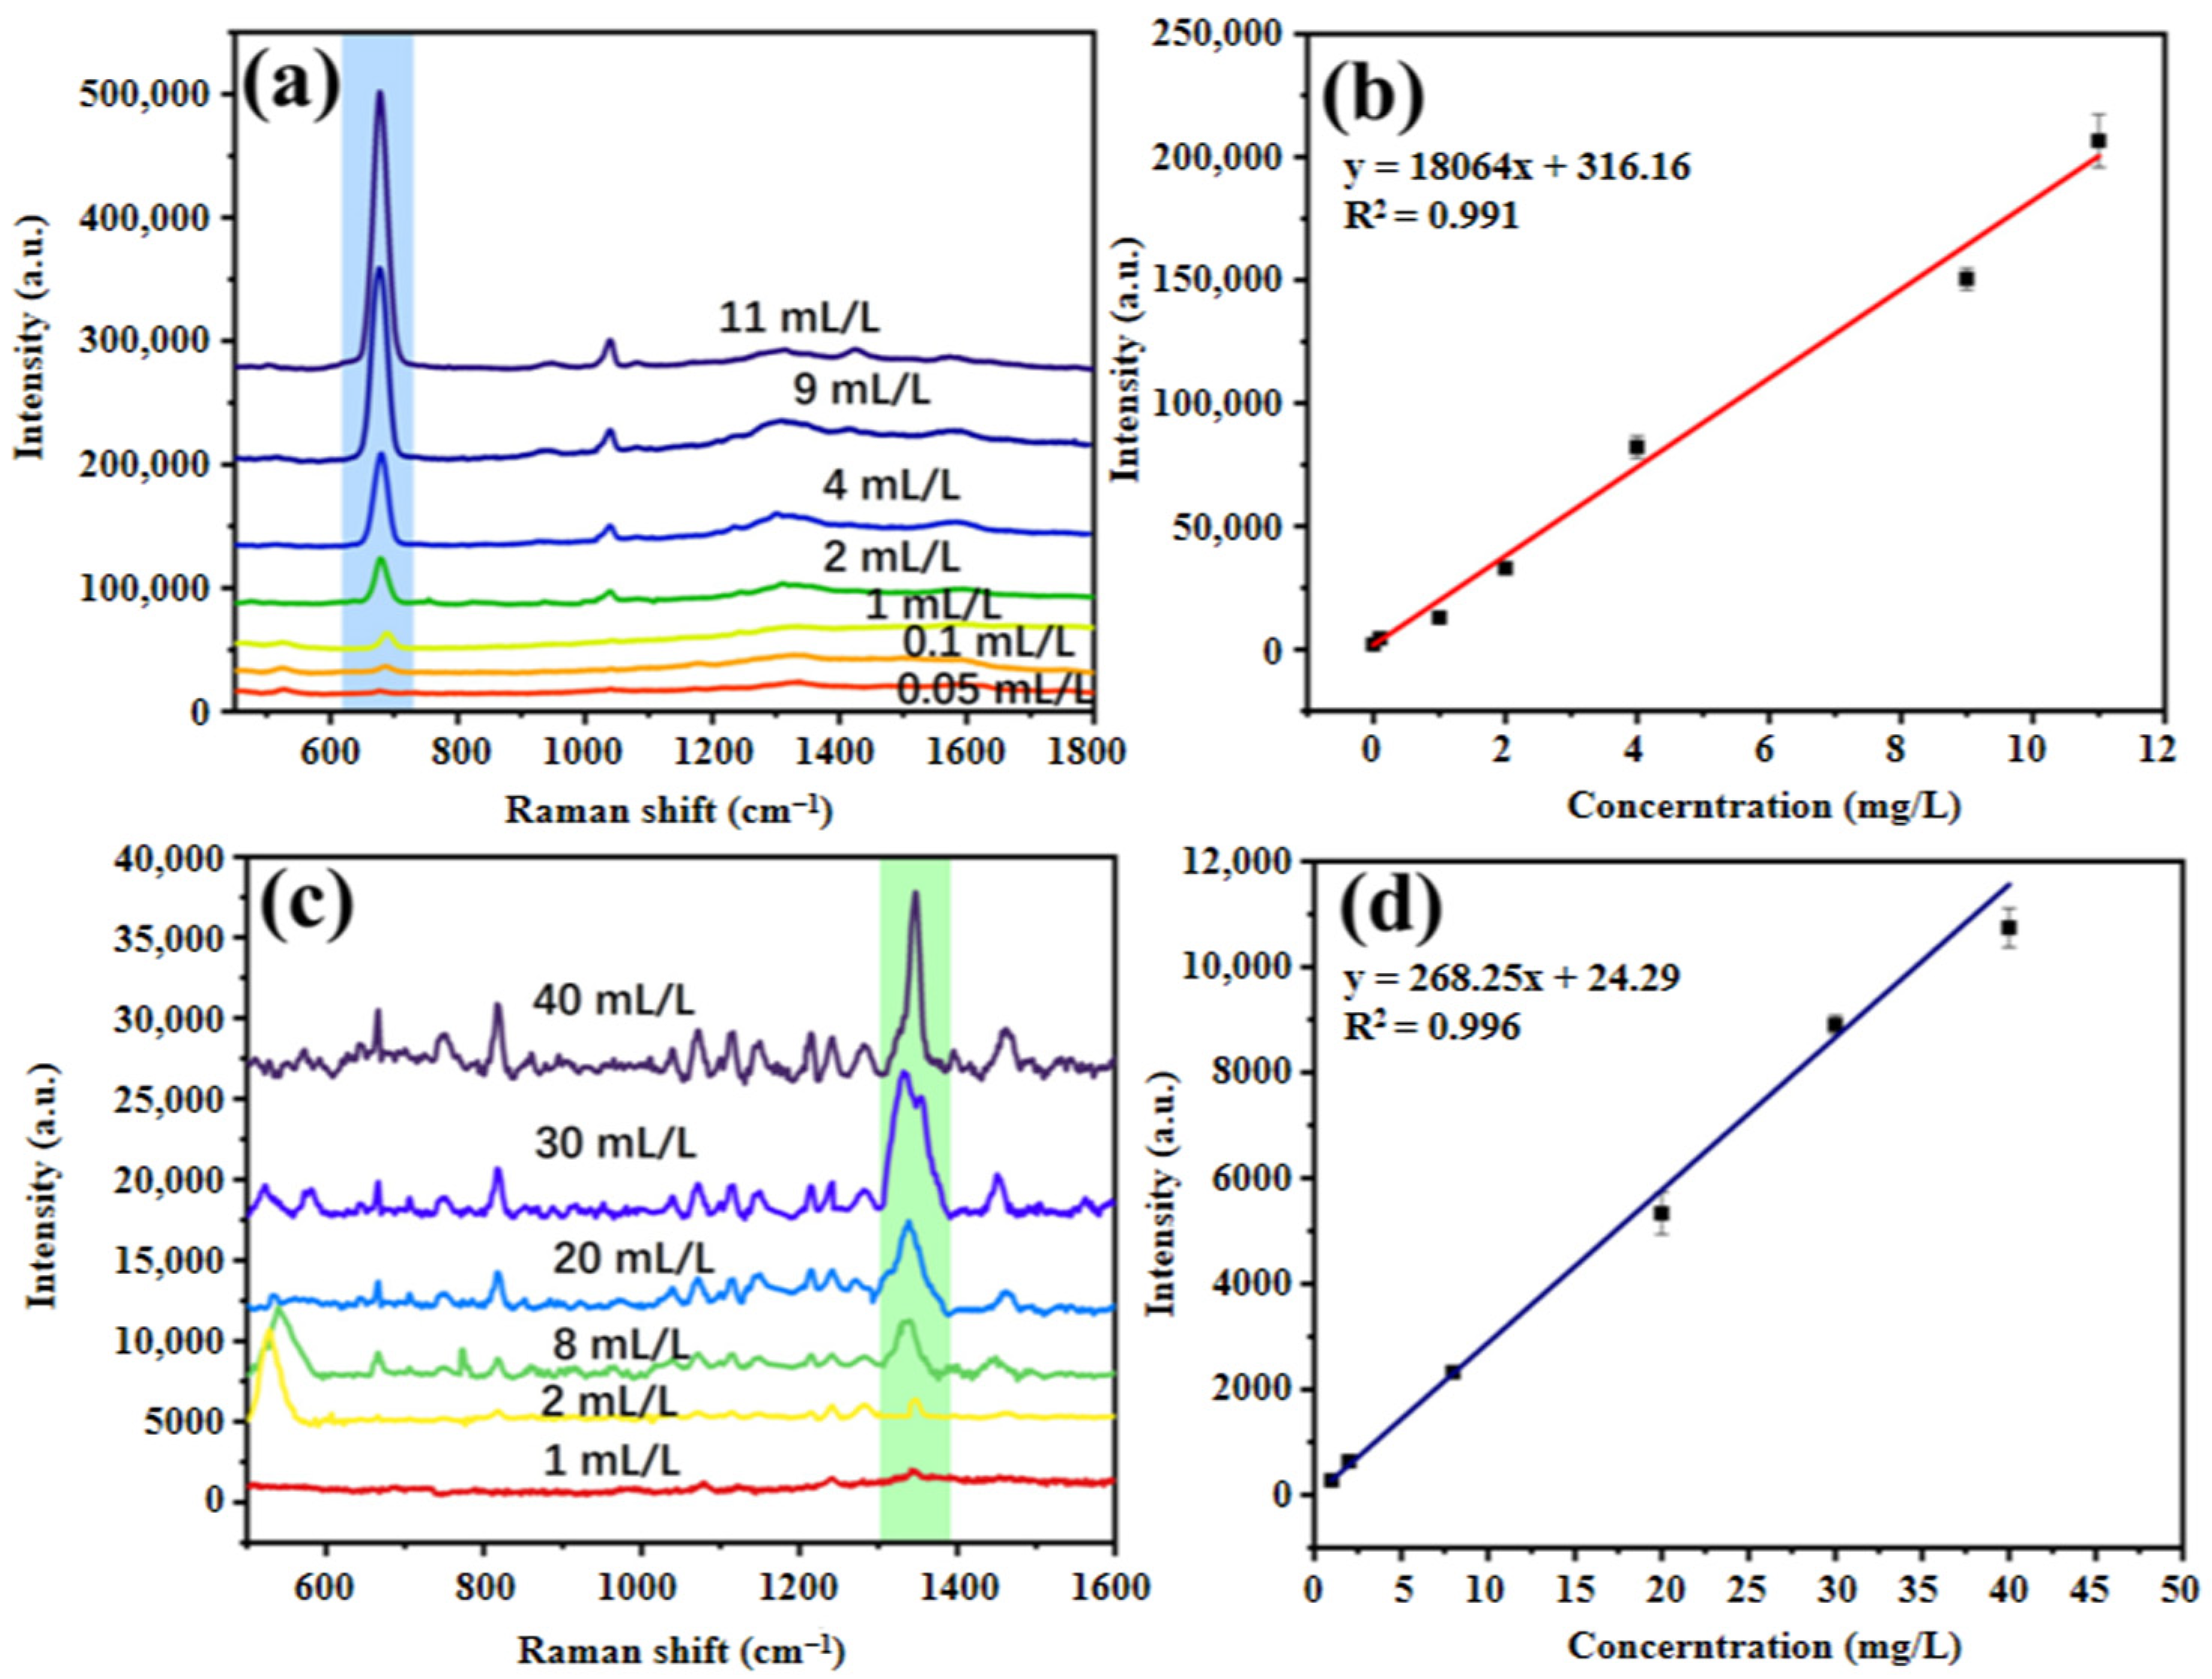
3.4. Drawing of Standard Curve for Analytes

The Raman peaks at the displacements of 689 cm−1 and 1330 cm−1 were selected as the characteristic peaks of MS and DTBP, respectively. According to the SERS spectra of the standard solutions of analytes in a series of concentrations, the relationship curve between the characteristic peak intensity (Y) and the concentration of the analyte (X) is drawn in Figure 6. In addition, the LODs of MS and DTBP were 1.53 ppm and 0.39 ppm, respectively, by the calculation using Equation (1). The specific calculation details are shown in Table S3 in the Supplementary Information.
We further evaluated the SERS performance of the prepared Au@Ag/Ag@LDH@GO substrate. The Enhancement Factor (EF) [22] is considered a reliable metric for assessing the Raman enhancement effect of a substrate. We chose a standard solution of 4-nitrothiophenol (4-NP) to evaluate the enhancement effect of the composite substrate, Au@Ag/Ag@LDH@GO (Figure S2 in the Supplementary Information). Here, we deposited 20 µL of a 10−2 M 4-NP solution onto a smooth glass slide and dried it at 60 °C for 2 h to prepare the substrate for measuring the normal Raman spectrum. We then deposited 20 µL of a 10−12 M 4-NP solution onto the Au@Ag/Ag@LDH@GO substrate, incubated it for 30 min, and measured its SERS characteristic spectrum at 1338 cm−1. The EF was calculated using the following formula [23]:
EF = (ISERS/CSERS)/(INR/CNR)
where ISERS and INR are the Raman peak intensities of 4-NP in the SERS and normal Raman spectra, respectively, and CSERS and CNR are the concentrations of 4-NP used in the SERS (10−12 M) and normal Raman (10−2 M) measurements, respectively. The EF value for the main peak of 4-NP at 1338 cm−1 was calculated to be 1.26 × 10¹⁰.

3.5. Simultaneous Detection of Two Analytes in Actual Water Samples

The SERS substrate was incubated with the odor water sample, and the results can be seen in Figure 7. According to the SERS spectra, both MS (689 cm−1) and DTBP (1330 cm−1) were observed in the water sample.
The concentrations of these two compounds were calculated to be 0.37 mL/L and 16.31 mg/L using the standard curve, respectively. Compared with the results obtained using GC (Figure 7b and Table S4 in the Supplementary Information), the satisfactory recovery of MS and DTBP could be obtained as 103% and 97%, respectively, indicating that this proposed method had high accuracy in the rapid detection of MS and DTBP in actual water.

4. Conclusions

This paper developed a quick and simultaneous detection method for T and O compounds in water using Au@Ag NPs/Ag NPs@LDH@GO as a SERS substrate. This method is extremely simple to use without sample pretreatment. Specifically, the SERS substrate showed the highest detection sensitivity and lowest detection limits at a pH of 8, an incubation time of 20 min, and an incubation temperature of 30 °C, with detection limits of 1.53 ppm for MS and 0.39 ppm for DTBP.
This method not only offers high sensitivity and selectivity, it also enables rapid detection without the need for complex sample pretreatment, with the entire process taking only 20 min. Additionally, the method was successfully applied to the simultaneous detection of MS and DTBP in real water samples, demonstrating its potential for the on-site detection of T and O compounds in water environments.

Supplementary Materials

The following are available online at https://www.mdpi.com/article/10.3390/chemosensors12070137/s1. Figure S1: The XRD patterns of Ag NPs, Au@Ag NPs, and Ag NPs@LDH@GO; Table S1: Instruments and equipment used in this experiment; Table S2. The assignments of Raman shift from analytes; Table S3. Calculation of Xbi, Sbi, and LOD; Table S4. A comparison of the proposed SERS method with the GC method for measuring the analytes in the actual water samples. Figure S2. Comparison of normal Raman and SERS spectra of 4-NP on the glass substrate (10−2 M) and the Au@Au NPs/Ag NPs@LDH@GO SERS substrate (10−2 M).

Author Contributions

Conceptualization, M.Z.; methodology, Z.L., Y.L. (Yong Liang) and J.W.; software, M.Z. and X.L.; validation, J.T.; formal analysis, Z.L.; investigation, Y.L. (Yin Liang), X.L., Y.L. (Yong Liang) and J.W.; resources, J.T.; data curation, Y.L. (Yin Liang), W.X. and J.W.; writing—original draft preparation, Z.L.; writing—review and editing, Y.L. (Yin Liang), W.X., Y.L. (Yong Liang) and J.W. All authors have read and agreed to the published version of the manuscript.

Funding

This work gratefully received support from the National Natural Science Foundation of China (21505026, 21275057, and 51478196), the Science and Technology Planning Project of Guangdong Province (2017A020212003 and 2016A020215020). This study received funding from the Scientific Research Project of Gaoming Water Supply Co., Ltd. of the Foshan Water Industry Group (No. GS2018010106A), the funder had the following involvement with the study: design, analysis, interpretation of data, the writing of this article.

Data Availability Statement

Data is contained within the article or Supplementary Material.

Acknowledgments

We thank Gaoming Water Supply Co., Ltd. (Foshan, China) for providing us with the actual odorous water samples.

Conflicts of Interest

Author Zhixiong Lao, Jianrong Tan and Xiaoyan Liang were employed by the company Foshan Gaoming Water Supply Co., Ltd. Author Yin Liang were employed by the company China GDE Engineering Co., Ltd. The remaining authors declare that the research was conducted in the absence of any commercial or financial relationships that could be construed as a potential conflict of interest.

References

  1. Jahnichen, S.; Jaschke, K.; Wieland, F.; Packroff, G.; Benndorf, J. Spatio-temporal distribution of cell-bound and dissolved geosmin in Wahnbach Reservoir: Causes and potential odour nuisances in raw water. Water Res. 2011, 45, 4973–4982. [Google Scholar] [CrossRef] [PubMed]
  2. Su, M.; Yu, J.; Zhang, J.; Chen, H.; An, W.; Vogt, R.D.; Andersen, T.; Jia, D.; Wang, J.; Yang, M. MIB-producing cyanobacteria (Planktothrix sp.) in a drinking water reservoir: Distribution and odor producing potential. Water Res. 2015, 68, 444–453. [Google Scholar]
  3. Kim, T.; Kim, T.K.; Zoh, K.D. Degradation kinetics and pathways of β-cyclocitral and β-ionone during UV photolysis and UV/chlorination reactions. J. Environ. Manag. 2019, 239, 8–16. [Google Scholar] [CrossRef] [PubMed]
  4. Guo, Q.; Li, X.; Yu, J.W.; Zhang, H.; Zhang, Y.; Yang, M.; Lu, N.; Zhang, D. Comprehensive two-dimensional gas chromatography with time-of-flight mass spectrometry for the screening of potent swampy/septic odor-causing compounds in two drinking water sources in China. Anal. Methods 2015, 7, 2458–2468. [Google Scholar] [CrossRef]
  5. Yu, C.; Shi, C.; Ji, M.; Xu, X.; Zhang, Z.; Ma, J.; Wang, G. Taste and odor compounds associated with aquatic plants in Taihu Lake: Distribution and producing potential. Environ. Sci. Pollut. Res. 2019, 26, 34510–34520. [Google Scholar] [CrossRef] [PubMed]
  6. Huang, H.; Xu, X.; Shi, C.; Liu, X.; Wang, G. Response of Taste and Odor Compounds to Elevated Cyanobacteria Biomass and Temperature. Bull. Environ. Contam. Toxicol. 2018, 101, 272–278. [Google Scholar]
  7. Li, S.; Xie, S.; Wei, Q.; Zeng, T.; Rong, L. Phenolic Wastewater Treatment via Catalytic Gasification. Pol. J. Environ. Stud. 2015, 24, 1147–1151. [Google Scholar] [CrossRef]
  8. Quintana, J.; Hernandez, A.; Ventura, F.; Devesa, R.; Boleda, M.R. Identification of 3-(trifluoromethyl)phenol as the malodorous compound in a pollution incident in the water supply in Catalonia (NE Spain). Environ. Sci. Pollut. Res. 2019, 26, 16076–16084. [Google Scholar] [CrossRef] [PubMed]
  9. Zhang, H.; Ma, P.; Shu, J.; Yang, B.; Huang, J. Rapid detection of taste and odor compounds in water using the newly invented chemi-ionization technique coupled with time-of-flight mass spectrometry. Anal. Chim. Acta 2018, 1035, 119–128. [Google Scholar] [CrossRef]
  10. Ioime, P.; Piva, E.; Pozzebon, M.; Pascali, J.P. Automated sample preparation and analysis by gas chromatography tandem mass spectrometry (GC-MS/MS) for the determination of 3-and 2-monochloropropanediol (MCPD) esters and glycidol esters in edible oils. J. Chromatogr. A 2021, 1650, 462253. [Google Scholar] [CrossRef]
  11. Xu, D.; Muhammad, M.; Chu, L.; Sun, Q.; Shen, C.; Huang, Q. SERS Approach to Probe the Adsorption Process of Trace Volatile Benzaldehyde on Layered Double Hydroxide Material. Anal. Chem. 2021, 93, 8228–8237. [Google Scholar] [CrossRef] [PubMed]
  12. Pang, S.; Yang, T.X.; He, L.L. Review of surface enhanced Raman spectroscopic (SERS) detection of synthetic chemical pesticides. Trends Anal. Chem. 2016, 85, 73–82. [Google Scholar] [CrossRef]
  13. Qu, L.L.; Liu, Y.Y.; Liu, M.K.; Yang, G.H.; Li, D.W.; Li, H.T. Highly Reproducible Ag NPS/CNT-Intercalated GO Membranes for Enrichment and SERS Detection of Antibiotics. ACS Appl. Mater. Interfaces 2016, 8, 28180–28186. [Google Scholar] [CrossRef] [PubMed]
  14. Gjergjizi, B.; Cogun, F.; Yildirim, E.; Eryilmaz, M.; Selbes, Y.; Saglam, N.; Tamer, U. SERS-based ultrafast and sensitive detection of luteinizing hormone in human serum using a passive microchip. Sens. Actuators B Chem. 2018, 269, 314–321. [Google Scholar] [CrossRef]
  15. Muhammad, M.; Shao, C.-S.; Bashir, M.A.; Yu, X.; Wu, Y.; Zhan, J.; Zhang, L.; Huang, Q. Application of Aptamer-SERS Nanotags for Unveiling the PD-L1 Immunomarker Progression Correlated to the Cell Metabolic Bioprocess. Anal. Chem. 2024, 6, 6236–6244. [Google Scholar] [CrossRef] [PubMed]
  16. Wang, K.; Sun, D.; Pu, H.; Wei, Q. Shell thickness-dependent Au@Ag nanoparticals aggregates for high-performance SERS applications. Talanta 2019, 195, 506–515. [Google Scholar] [CrossRef] [PubMed]
  17. Liu, D.; Wan, J.; Pang, G. Hollow Metal-Organic-Framework Micro/ Nanostructures and their Derivatives: Emerging Multifunctional Materials. Adv. Mater. 2019, 31, 1803291. [Google Scholar] [CrossRef]
  18. He, P.; Yu, X.; Luo, X. Carbon-Incorporated Nickel-Cobalt Mixed Metal Phosphide Nanoboxes with Enhanced Electrocatalytic Activity for Oxygen Evolution. Angew. Chem. Int. Ed. 2017, 56, 3897–3900. [Google Scholar] [CrossRef]
  19. Sharifi-Bonab, M.; Aber, S.; Salari, D.; Khodam, A. Synthesis of CoZnAl-layered double hydroxide/graphene oxide nanocomposite for the removal of methylene blue: Kinetic, thermodynamic, and isotherm studies. Environ. Prog. Sustain. 2019, 39, e13316. [Google Scholar] [CrossRef]
  20. Chen, Z.; Cheng, F.; Nan, D.; Yang, Y.; Zhong, L.; Ma, Z.; Hao, L.; Wang, Q. Plasmonic nanorod arrays of a two-segment dimer and a coaxial cable with 1 nm gap for large field confinement and enhancement. Nanoscale 2015, 7, 2862–2868. [Google Scholar]
  21. Thomsen, V.; Schatzlein, D.; Mercuro, D. Limits of detection in spectroscopy. Spectroscopy 2003, 18, 112–118. [Google Scholar]
  22. Jena, T.; Choudhary, G.; Hossain, M.T.; Nath, U.; Sarma, M.; Giri, P.K. Salt-Catalyzed Directed Growth of Bilayer Palladium Diselenide (PdSe2) Dendrites and Pd Nanoparticle-Decorated PdSe2-Pd2Se3 Junction Exhibiting Very High Surface Enhanced Raman Scattering Sensitivity. Chem. Mater. 2024, 36, 5922–5934. [Google Scholar] [CrossRef]
  23. Kumar, K.M.A.; Kumar, E.A.; Wang, T.-J.; Kokulnathan, T.; Chang, Y.-H. Ultrasensitive and Reusable SERS Substrates Based on Ag-Photodecorated Mn2O3 Microspheres for Nitrofurazone Detection. ACS Sustain. Chem. Eng. 2023, 11, 15808–15817. [Google Scholar] [CrossRef]
Figure 1. The synthesis process of the SERS substrate.
Chemosensors 12 00137 g001
Figure 2. (A) UV-vis absorption spectra of Au@Ag NPs with different additions of Ag nitrate (μL), and (B) the TEM images of Au@Ag NPs with different amounts of Ag nitrate ((af): 0, 480, 560, 640, 720, and 800 μL, respectively).
Chemosensors 12 00137 g002
Figure 3. The TEM images of (a) Au@Ag NPs, (c) Ag NPs, (d) GO, (e) Ag NPs@LDH, and (f) Ag NPs@LDH@GO. (b) High-resolution TEM images of the Ag shell in Au@Ag NPs.
Chemosensors 12 00137 g003
Figure 4. (A) SERS spectra of 5 mL/L MS detected on different Au@Ag NPs (a–e: Au@Ag NPs with Ag thicknesses of 8, 9.5, 12, 14, and 17 nm, respectively). (B) (a) Au@Ag NPs/Ag NPs@LDH@GO, (b) ethanol, (c) the mixed ethanol solution of DTBP and MS, (d) MS, and (e) DTBP. (C) MS and DTBP on the SERS substrates of Au@Ag NPs, Ag NPs@LDH, Au@Ag NPs/Ag NPs@LDH, and Au@Au NPs/Ag NPs@LDH@GO.
Chemosensors 12 00137 g004
Figure 5. (a) the Raman intensity of MS (5 mL/L) and DTBP (18.5 mg/mL) of different pH values, (b) the Raman intensity of MS (5 mL/L) in pH 5–9, (c) the Raman intensity of DTBP (18.5 mg/mL) in pH 5–9, (d) the Raman intensity of MS (5 mL/L) and DTBP (18.5 mg/mL) of different incubation times, (e) the Raman intensity of MS (5 mL/L) for 5–30 incubation time, (f) the Raman intensity of DTBP (18.5 mg/mL) for 5–30 incubation time, (g) the Raman intensity of MS (5 mL/L) and DTBP (18.5 mg/mL) of different temperatures, (h) the Raman intensity of MS (5 mL/L) at 20–40 °C, and (i) the Raman intensity of DTBP (18.5 mg/mL) at 20–40 °C.
Chemosensors 12 00137 g005
Figure 6. Standard curves of (a,b) MS and (c,d) DTBP. The colored sections in the figure (a,c) are the characteristic peaks of MS and DTBP.
Chemosensors 12 00137 g006
Figure 7. (a) The SERS spectrum of the actual water sample and (b) the GC results of the actual water sample. The colored sections in the figure (a,b) are the characteristic peaks of MS and DTBP, respectively.
Chemosensors 12 00137 g007
Disclaimer/Publisher’s Note: The statements, opinions and data contained in all publications are solely those of the individual author(s) and contributor(s) and not of MDPI and/or the editor(s). MDPI and/or the editor(s) disclaim responsibility for any injury to people or property resulting from any ideas, methods, instructions or products referred to in the content.

