Machine Learning-Assisted Raman Spectroscopy and SERS for Bacterial Pathogen Detection: Clinical, Food Safety, and Environmental Applications

 , , , , , and
Abstract
:1. Introduction
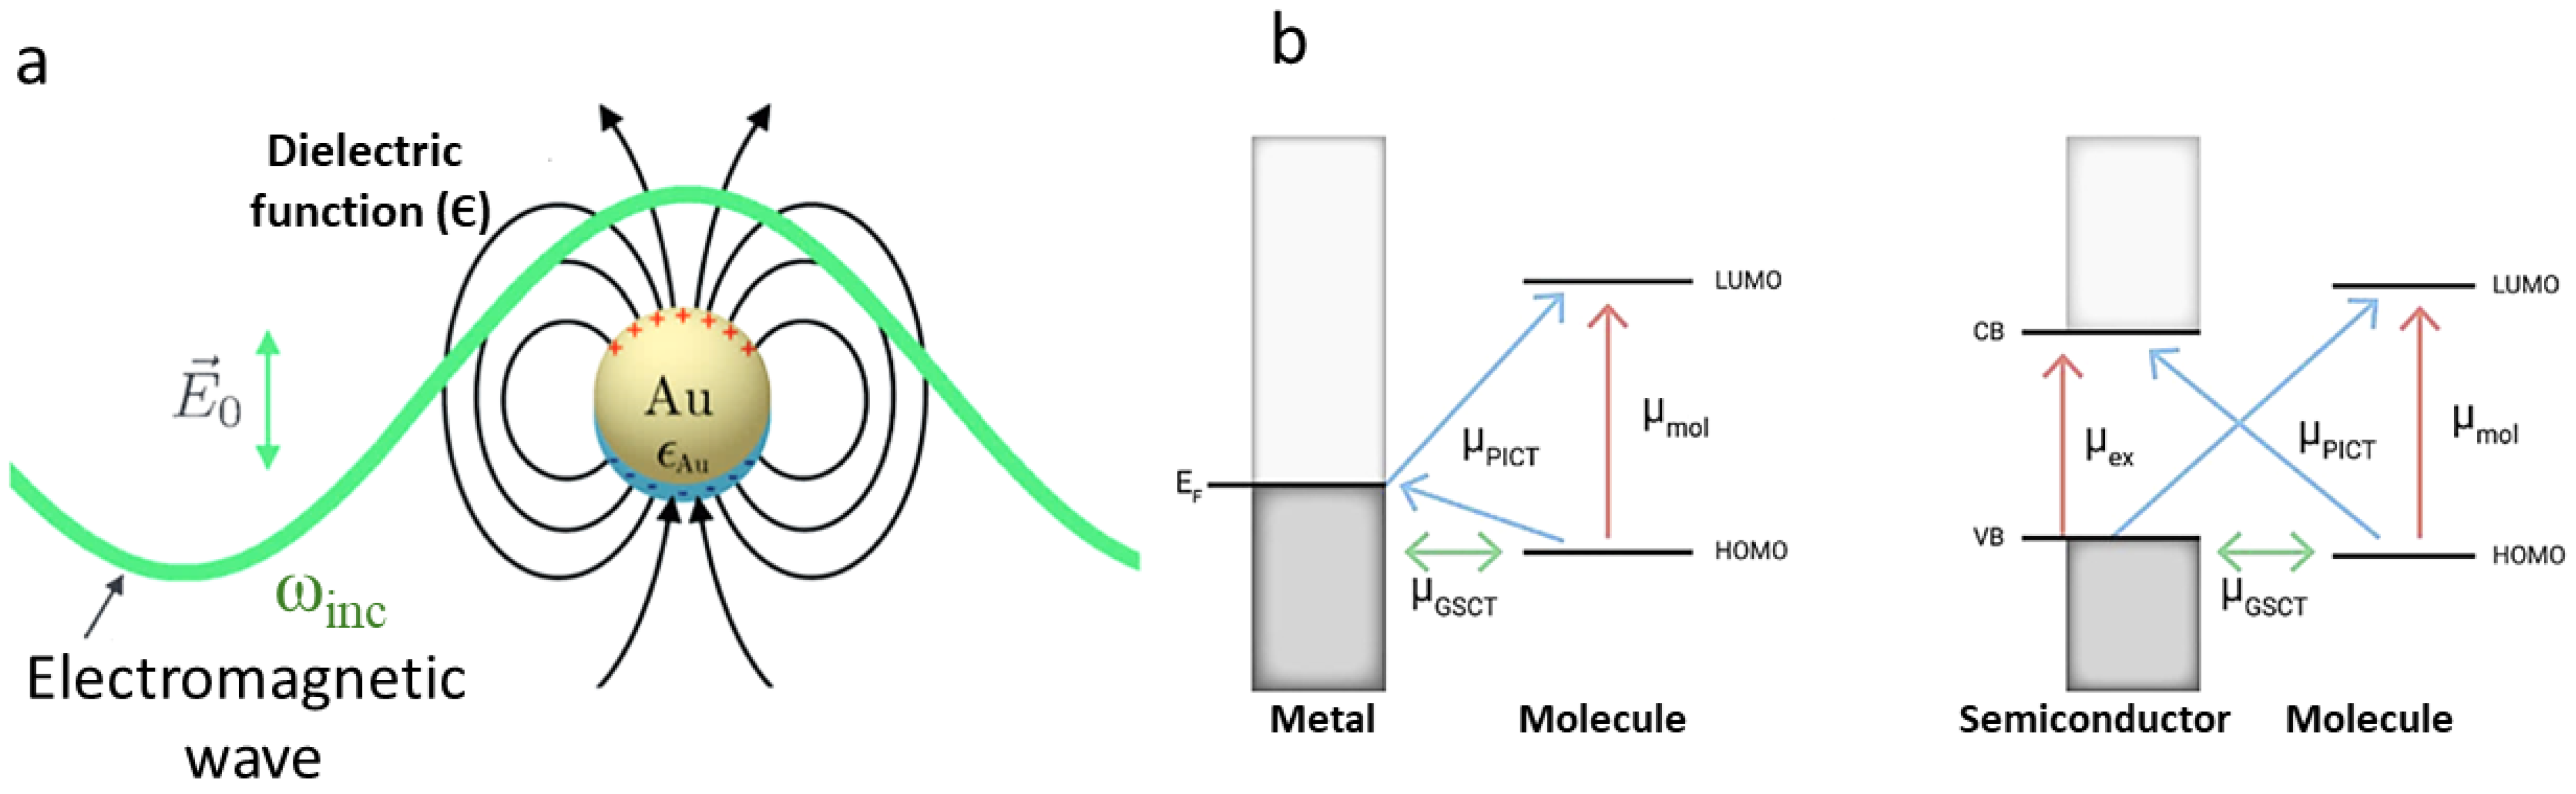
2. Raman and SERS: Fundamentals and Signal Enhancement
3. ML Techniques for Raman Spectroscopy: Traditional ML, CNNs, and Other Deep Learning Techniques
3.1. Unsupervised Machine Learning
3.2. Supervised Machine Learning
3.2.1. Traditional Machine Learning
3.2.2. Deep Learning (DL)
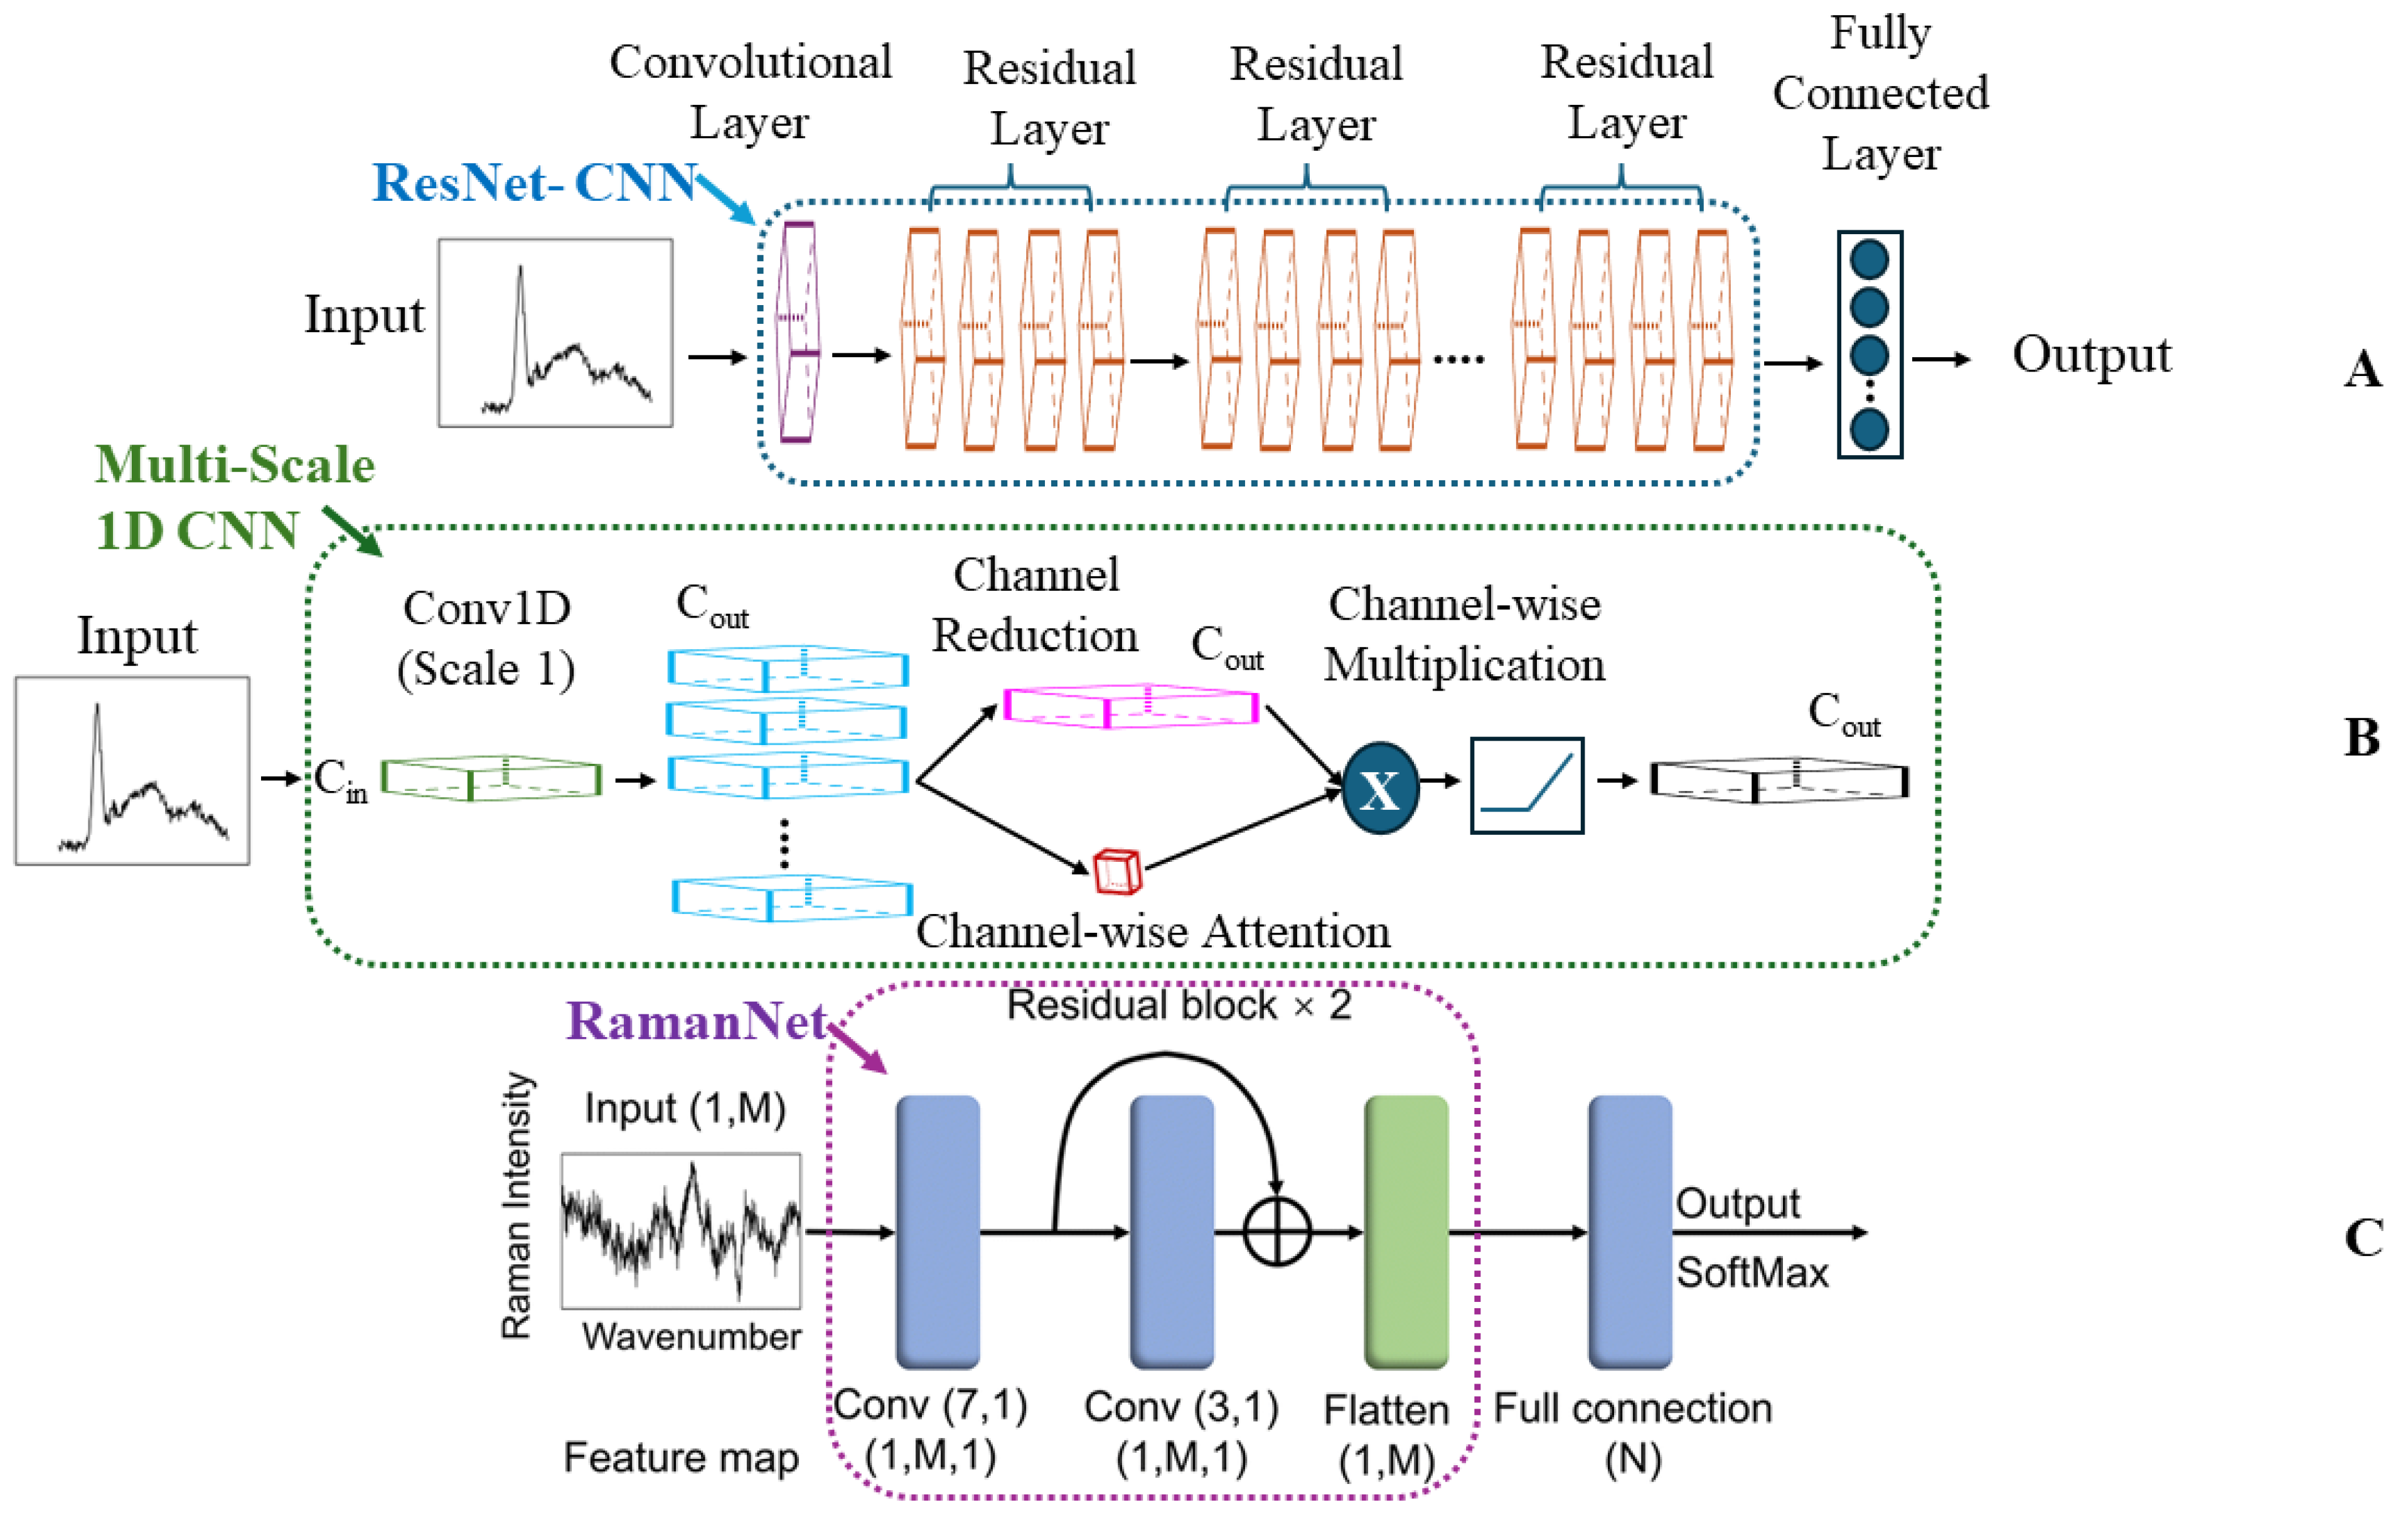
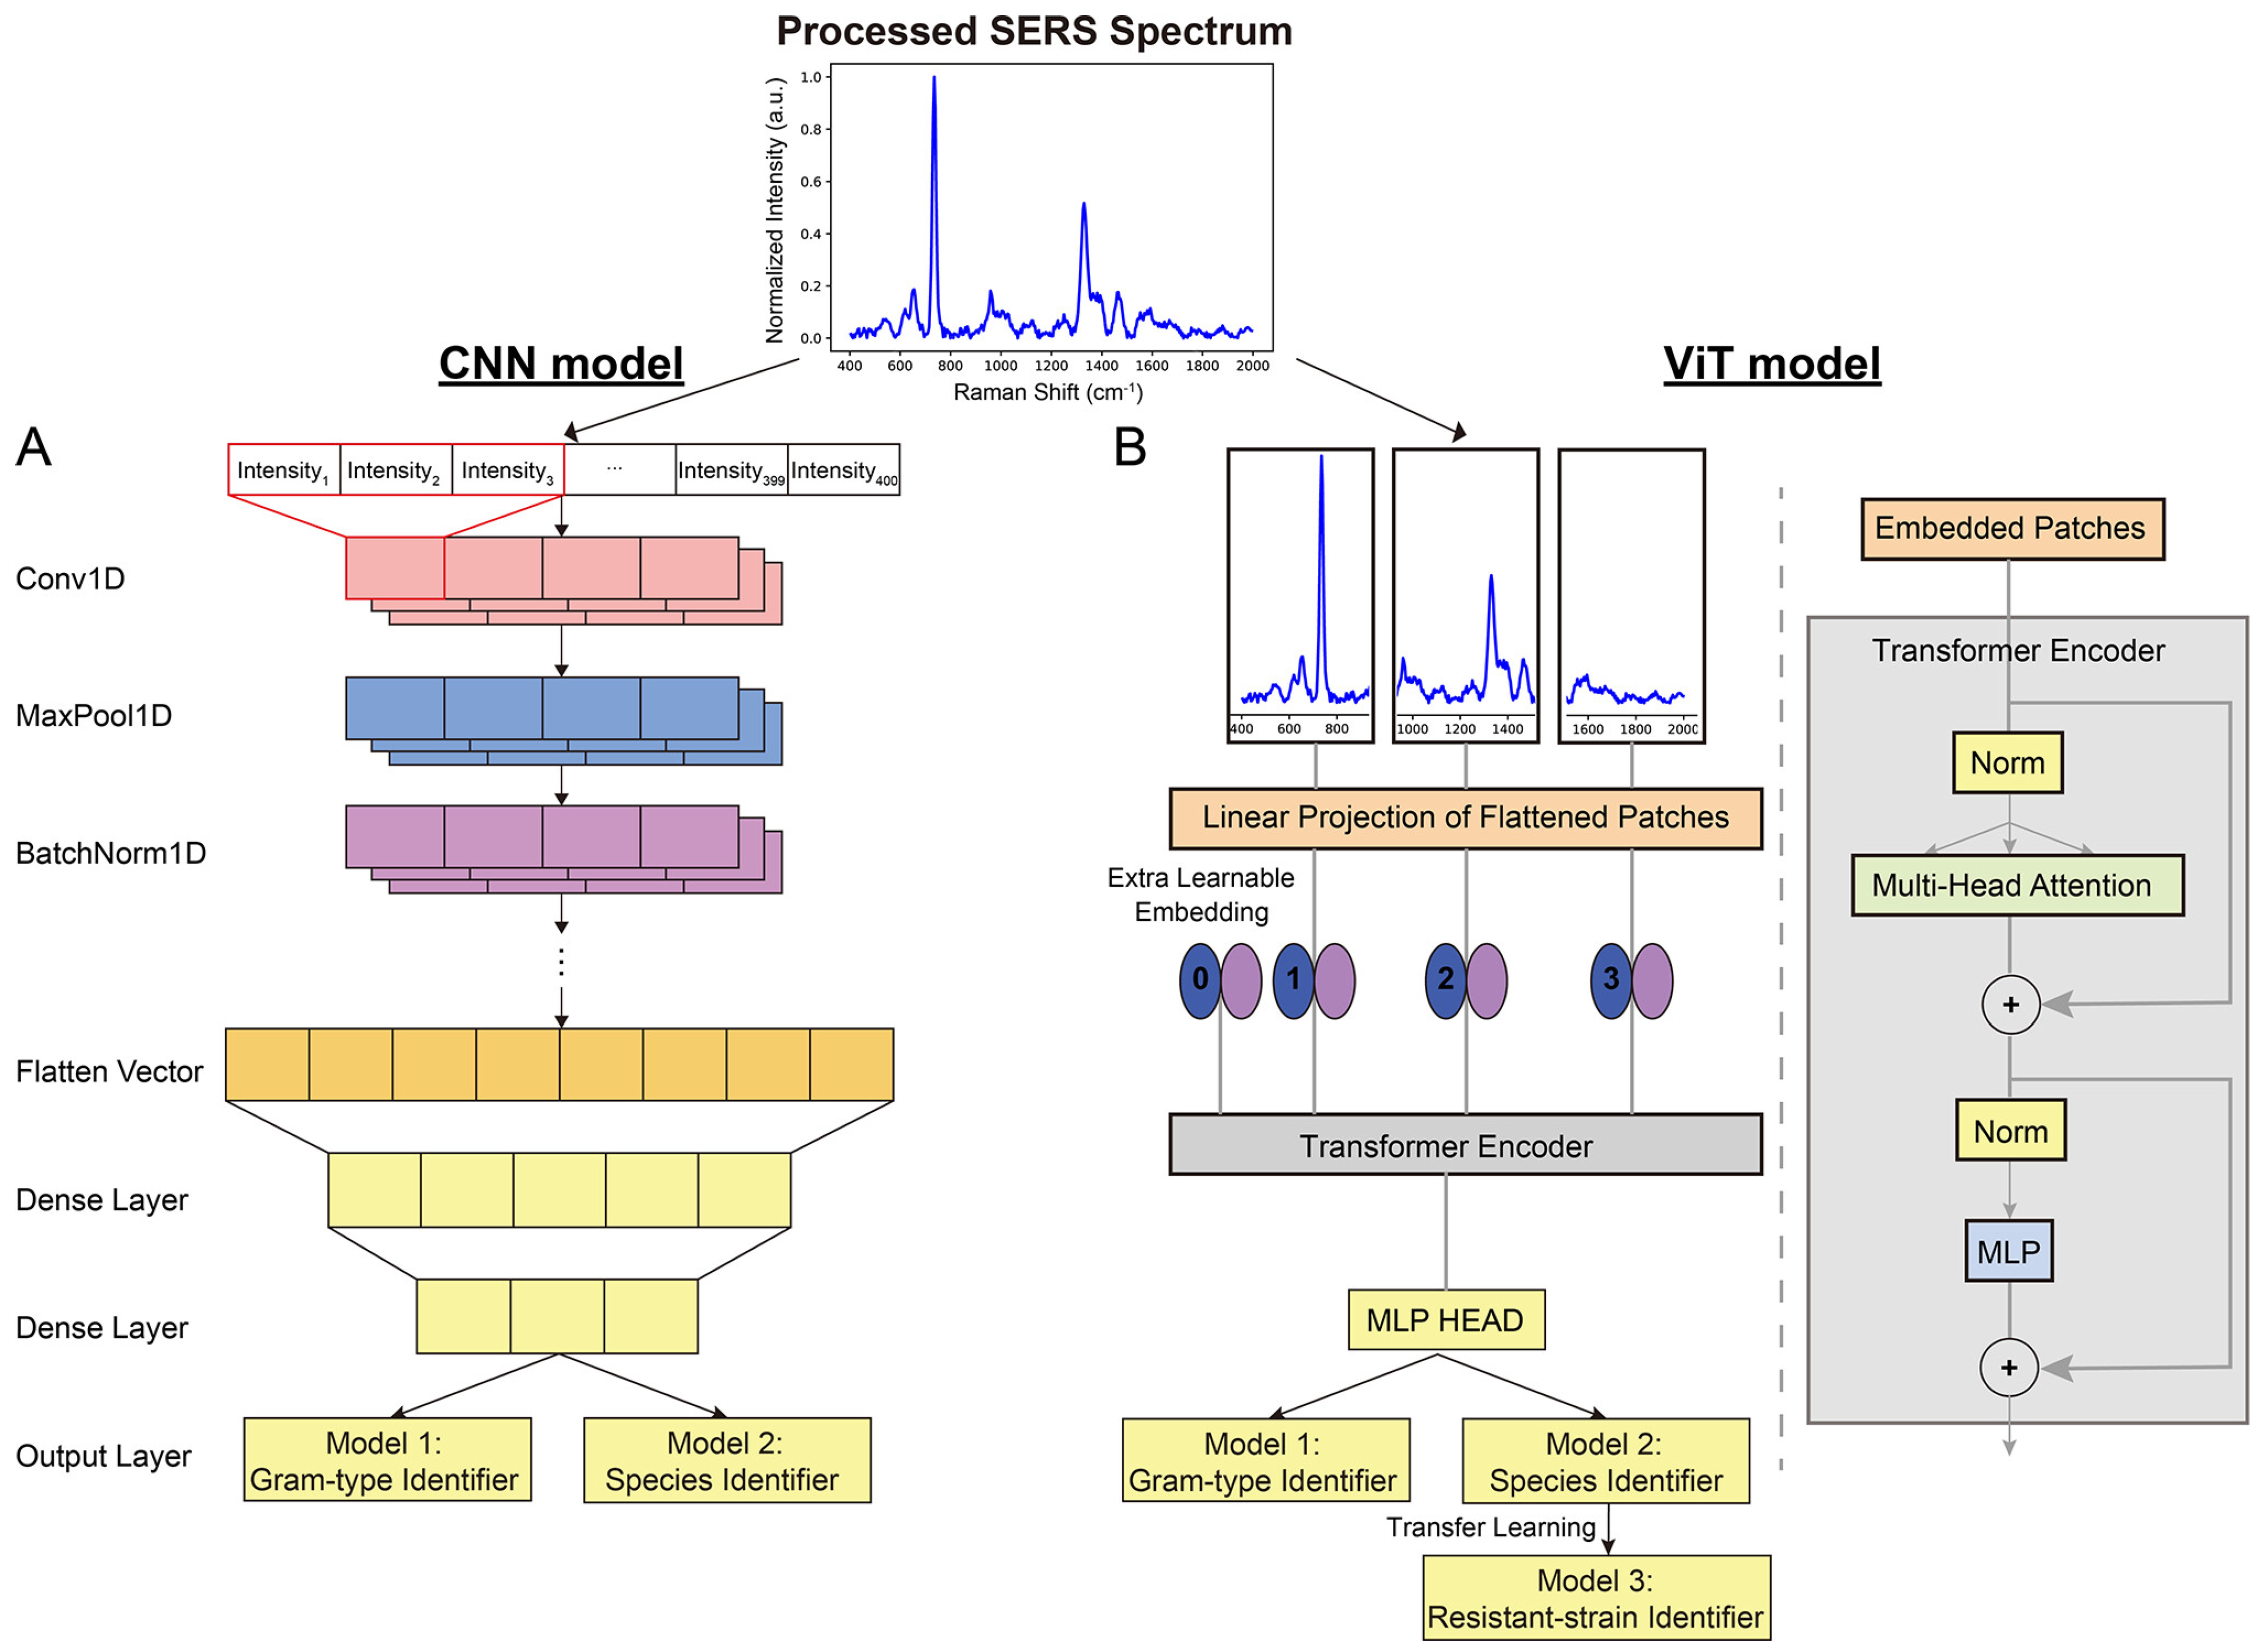
Convolutional Neural Networks (CNNs)
Other Deep Learning (ODL)
4. Three Case Studies Based on Modern Trends in ML-Enabled Raman Detection of Bacterial Pathogens
4.1. Case Study I: Decoding Bacterial Identity with CNNs
4.1.1. CNNs: Addressing Clinical Complexity in Bacterial Detection
4.1.2. RamanNet and Data Augmentation: Balancing Accuracy and Efficiency in Bacterial Detection
4.1.3. A Comparative Analysis of CNN-Based Raman Approaches for Bacterial Diagnostics
4.2. Case Study II: Enhancing Bacterial Detection by SERS
4.2.1. SERS: Unlocking Precision in Clinical Diagnostics
4.2.2. SERS: A Transformative Toolkit for Microbiology
4.2.3. Comparison of SERS-ML Approaches
4.3. Case Study III: Tackling Data Challenges and Expanding Raman Spectroscopy with ODL Techniques
4.3.1. Expanding Raman’s Reach with Limited Data
4.3.2. Beyond Bacteria: ODL Tackles Diverse Raman Applications
4.3.3. A Comparative Analysis of ODL Techniques for Raman-Based Bacterial Analysis
5. Limitations and Future Directions
- Data challenges: The development of robust, accurate models often depends on substantial, well-curated, and harmonized datasets. Initiatives for multi-institutional data sharing through accessible repositories with standardized metadata are essential to address smaller dataset limitations. Exploration of techniques like transfer learning and data augmentation also holds promise.
- Standardization: The lack of standardized protocols for sample preparation, spectral acquisition, and data analysis hinders reproducibility and clinical translation. Establishing best practices and guidelines will ensure reliable results across different laboratories and applications.
- Limited focus on quantification: Our review reveals a predominant focus on classification tasks in pathogen detection, highlighting an opportunity for further research into regression-based approaches for quantifying bacterial load. The study by Yan et al., as highlighted in Case Study II, demonstrates the potential of machine learning to accurately predict bacterial concentration using SERS, underscoring a promising avenue for future exploration.
- Explainable AI: While certain deep learning models deliver exceptional results, achieving a clear understanding of their decision-making processes remains a challenge. Developing explainable AI techniques, such as Grad-CAM, is vital for building trust in ML–Raman solutions, especially within the clinical context.
- Open questions: The case studies examined highlight exciting open questions for future research. These include the development of ODL architectures specifically tailored for Raman spectroscopy, computationally efficient models for real-time applications, and the pursuit of spectral biomarkers for early disease detection.
- Multimodal analysis: Integrating Raman spectroscopy with complementary techniques like microfluidics and mass spectrometry paves the way for comprehensive analysis. This offers richer insights into bacterial phenotypes, antibiotic resistance mechanisms, and single-cell dynamics—areas crucial for combating the AMR crisis.
- Harnessing GenAI’s potential: The integration of cutting-edge generative AI (GenAI) models holds significant promise for Raman spectroscopy and microbiology. These models can further enhance data generation, aid in spectral interpretation, and potentially uncover novel biological insights.
- Cross-field collaboration: Fostering interdisciplinary collaboration between experts in Raman spectroscopy, machine learning, and microbiology is paramount. By combining diverse knowledge and expertise, researchers can develop innovative ML–Raman solutions tailored to address specific biological challenges and clinical needs.
6. Conclusions
- Rapid point-of-care diagnostics: Clinicians, equipped with portable, ML-powered Raman devices, can swiftly identify the cause of an infection and determine the most effective antibiotic, preventing needless delays and improving patient outcomes.
- Precision-guided food safety: Rapid ML-SERS-based tests screen food production lines for harmful bacteria, overcoming adaptability challenges to safeguard consumers and prevent costly outbreaks.
- Decoding the microbial world: Researchers harness the power of ML and Raman to unlock insights into complex bacterial communities, unraveling the mysteries of microbial ecosystems and their impact on the environment and human health.
Author Contributions
Funding
Institutional Review Board Statement
Informed Consent Statement
Acknowledgments
Conflicts of Interest
Appendix A. Technical Details of SERS Enhancement Mechanisms
Appendix B

| Sample Type | Specific Bacteria | Algorithm Category | Accuracy Metric | Input (No. of Spectra) | Raman Parameters | Ref. |
|---|---|---|---|---|---|---|
| Pure bacterial cultures | E. coli (2 strains), Shigella spp. (8 strains) | CNN | 99.64% | 1600 | Excitation: 784.56 nm, 25 mW grating: 600 L/mm, spectral range: 400–2300 cm−1, exposure = 60 s, objective = 100× | [87] |
| Clinical isolates + AgNPs | 30 species, 9 genera | CNN | CNN: 99.80% (genus), 98.37% (species) | 17,149 | Excitation: 785 nm, 20 mW, spectral range: 65–2800 cm−1, exposure = 5 s | [96] |
| Pure cultures | 30 isolates, 15 species | CNN | 84.7 ± 0.3% (isolate), 97 ± 0.3% (treatment ID) | ≈60,000 | N/A | [100] |
| K. pneumoniae clinical isolates | K. pneumoniae (71 strains) | CNN | >94% for antibiotic resistance genes | 7455 | Excitation: 785 nm, 150 mW, grating: 1200 L/mm, spectral range: 390.79–1552.14 cm−1, objective = 50× | [101] |
| N/A | N/A | CNN | 86.7% (isolate), 92.7% (MRSA/MSSA) | Paper 10 data | N/A | [89] |
| Genomic DNA isolates | Brucella spp., Bacillus spp. | CNN | CNN: 96.33% | 843 | Excitation: 785 nm, 30 mW, grating: 600 L/mm, spectral range: 600–1700 cm−1, exposure = 60 s, objective = 100× | [85] |
| Pure bacterial cultures + AuNPs | S. Enteritidis, S. Typhimurium, S. Paratyphi | CNN | 97% | 1854 | Excitation: 785 nm, 5 mW, spectral range: 550–1676 cm−1, exposure = 2 s | [62] |
| Individual microbes and cells on Teflon | 12 species (Gram +ve and −ve) + fungi | CNN | 95–100% | ≈6000 per organism | Excitation: 532 nm, 20 mW | [102] |
| Bacteria, archaea, yeast under various conditions | 14 species | CNN | 95.64 ± 5.46% | >4200 (train) 1400 (test) | Excitation: 785 nm, <16 mW, grating: 600 L/mm, spectral range: 600–1800 cm−1, exposure = 60–90 s, objective = 100× | [103] |
| Lab-prepared isolates | S. aureus (MRSA/MSSA pair) + yeast | CNN | 82% (isolate), 97% (treatment), 89% (MRSA/MSSA) | 72,000 | Excitation: 633 nm, 13.17 mW, grating: 300 L/mm, spectral range: 381.98–1792.4 cm−1, background: poly fit (5) | [18] |
| Mixed bacterial cultures | E. coli, S. aureus, S. typhimurium | Traditional ML | ANN: R2 > 0.95, RMSE < 0.06 | N/A | N/A | [84] |
| Bacterial cultures | 6 distinct species | Traditional ML | >98% | 100 per species | Excitation: 532 nm, 0.3–0.4 mW, spectral range: 400–1800 cm−1, objective = 20× | [60] |
| Clinical isolates, some cultured | 12 species (Gram +ve/−ve) + 2 fungi | Traditional ML | RF: 90.73% (species ID), 99.92% (antibiotic resistance) | >300 per species (train), 80 per species (test) | Integration time = 60–90 s | [91] |
| Clinical isolates on aluminum | 9 species (Gram +ve/−ve) | Traditional ML | Simple filter: 92% (1 s/cell), DAE: 84% (0.1 s/cell) | ≈11,141 | Excitation: 532 nm, 7 mW, grating: 1200 L/mm, spectral range: 280–2186 cm−1, exposure = 0.01, 0.1, 1, 10, or 15 s, objective = 100× | [137] |
| Clinical isolates + AgNPs | 117 S. aureus strains | Traditional ML | DBSCAN: 0.9733, Rand index, CNN: 98.21% Accuracy | 2752 | Excitation: 785 nm, spectral range: 519.56–1800.8 cm−1, exposure = 20 s | [90] |
| Bacterial cultures on silver-coated slides | 30 species, 7 genera | Traditional ML | 86.23 ± 0.92% (all, single model); 87.1–95.8% (hierarchical) | 15,890 | Excitation: 532 nm, 5 mW, grating: 300 L/mm, spectral range: 400–1800 cm−1, objective = 20× | [19] |
| Single prokaryotic cells | 3 bacteria, 3 archaea | Traditional ML | >98% | 40 per species | N/A | [86] |
| Pure cultures on silicon wafer | E. coli ATCC 8739 | Traditional ML | N/A | N/A | Excitation: 532 nm, 8 mW, spectral range: 650–3300 cm−1, exposure = 0.033 s, background: poly fit (6) | [138] |
| Bacterial isolates + AgNPs | S. aureus (MRSA/MSSA), L. pneumophila | Traditional ML | 97.8 ± 0.63% (kNN) | 230 | Excitation: 785 nm, 3 mW, spectral range: 550–1700 cm−1, exposure = 1 s, objective = 50× | [114] |
| Milk, beef | E. coli O157:H7 (and others) | Traditional ML | Limit of detection: 6.94 × 101 CFU/mL, Recovery 86–128% | 2700 | Excitation: 633 nm, grating: 300 L/mm, exposure = 2 s, objective = 50× | [52] |
| Heat-inactivated bacterial cells | B. mallei, B. pseudomallei, other Burkholderia spp. | Traditional ML | 95.5% sensitivity (core group), 83.4% sensitivity (others) | ≈ 200 per strain | Excitation: 532 nm, 7 mW, grating: 920 L/mm, spectral range: 15–3275 cm−1, exposure = 5 s, objective = 100× | [139] |
| Bacteria from blood cultures | 8 common species | Other deep learning | 99.3% Gram type, 97.56% species, 98.5% MRSA/MSSA | 11,774 | Excitation: 632.8 nm, objective = 20× | [59] |
| Clinical isolates + AgNO3 | A. xylosoxidans, B. cepacian, C. indologenes, + 12 others | Other deep learning | CNN: 99.86% | ≈6950 | Excitation: 785 nm, 20 mW, spectral range: 519.56–1800.81 cm−1, exposure = 5 s | [115] |
| Extracellular vesicles (EVs) | 6 bacterial species | Other deep learning | >96% (Gram/species), 93% (strain), 87% (physiological) | 4335 | Excitation: 532 nm, 5 mW, grating: 300 L/mm, spectral range: 800–1800 & 2700–3200 cm−1, exposure = 9 s, objective = 100× | [98] |
| Clinical isolates | ESKAPE pathogens | Other deep learning | 99.99% (training), 98.66% (validation) | >160 per species | Excitation: 633 nm, grating: 1200 L/mm, spectral range: 600–1700 cm−1, exposure = 20 s, objective = 100× | [129] |
| Single bacterial cells (deep-sea) | 5 deep-sea strains | Other deep learning | 99.8 ± 0.2% | Initial: 300 per strain (augmented) | Excitation: 785 nm, grating: 1800 L/mm | [122] |
| Partially covered CaF2 surfaces | 15 bacterial/non-bacterial classes, incl. MR/MS | Other deep learning | 96% (15 classes), 95.6% (MR/MS) | 5200 per species | Excitation: 785 nm, 60 mW, grating: 950 L/mm, spectral range: 700–1600 cm−1 | [130] |
| N/A | N/A | Other deep learning | 86.3% (species-level), 97.84% (empiric treatment), 95% (antibiotic resistance) | Paper 10 data | N/A | [131] |
| Clinical isolates + AgNPs | S. aureus (19 MRSA, 1 MSSA) | Other deep learning | 97.66% accuracy, 99.2% specificity, 96.1% sensitivity | ≈1699 per isolate | Excitation: 785 nm, 3 mW, grating: 1200 L/mm, spectral range: 550–1700 cm−1, exposure = 1 s, objective: 100× | [108] |
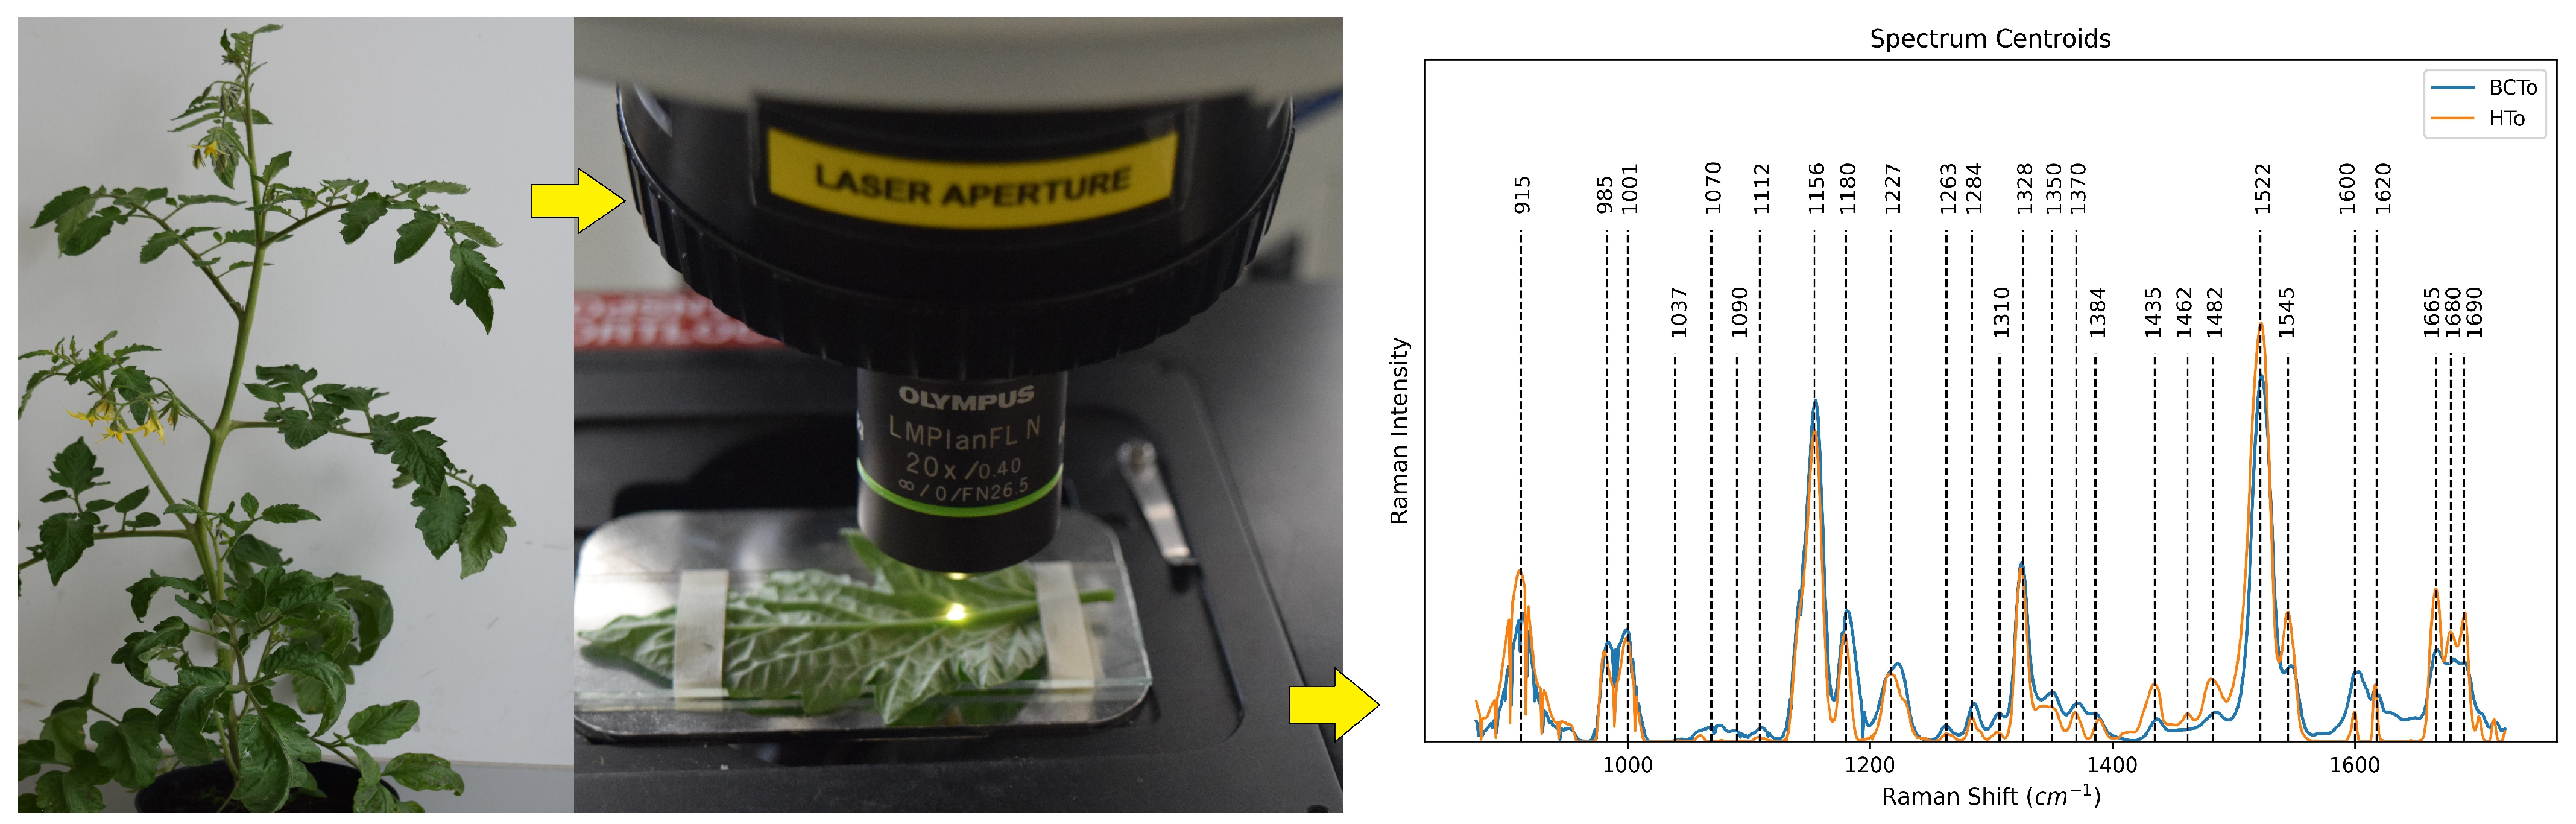
| Tomato plant leaves | C. michiganensis subsp. michiganensis | Other deep learning | PCA + MLP: 99% Acc, 95% Spec, PCA + LDA: 97% Acc, 88% Spec | 177 (infected), 120 (healthy) | Excitation: 785 nm, 20 mW, grating: 1200 L/mm, spectral range: 800–1800 cm−1 exposure = 10 s, objective = 20× | [126] |
| Pure bacterial cultures (intestinal pathogens) | 8 strains from Urechis unicinctus | Other deep learning | 94% isolation-level accuracy | 150 per strain | Excitation: 785 nm, grating: 600 L/mm, spectral range: 600–1800 cm−1, exposure = 60 s, objective = 100× | [132] |
| Pure bacterial cultures | S. hominis, V. alginolyticus, B. licheniformis | Other deep learning | N/A | 100 per strain | Grating: 1200 L/mm, exposure = 60 s, objective = 100× | [88] |
References
- Fleischmann, C.; Scherag, A.; Adhikari, N.K.; Hartog, C.S.; Tsaganos, T.; Schlattmann, P.; Angus, D.C.; Reinhart, K. Assessment of global incidence and mortality of hospital-treated sepsis current estimates and limitations. Am. J. Respir. Crit. Care Med. 2016, 193, 259–272. [Google Scholar] [CrossRef] [PubMed]
- DeAntonio, R.; Yarzabal, J.P.; Cruz, J.P.; Schmidt, J.E.; Kleijnen, J. Epidemiology of community-acquired pneumonia and implications for vaccination of children living in developing and newly industrialized countries: A systematic literature review. Hum. Vaccines Immunother. 2016, 12, 2422–2440. [Google Scholar] [CrossRef]
- Estimating the Burden of Foodborne Diseases. Available online: https://www.who.int/activities/estimating-the-burden-of-foodborne-diseases (accessed on 9 April 2024).
- Torio, C.M.; Moore, B.J. National Inpatient Hospital Costs: The Most Expensive Conditions by Payer, 2013. In Healthcare Cost and Utilization Project (HCUP) Statistical Briefs; Agency for Healthcare Research and Quality: Rockville, MD, USA, 2016. [Google Scholar]
- Fleming-Dutra, K.E.; Hersh, A.L.; Shapiro, D.J.; Bartoces, M.; Enns, E.A.; File, T.M.; Finkelstein, J.A.; Gerber, J.S.; Hyun, D.Y.; Linder, J.A.; et al. Prevalence of Inappropriate Antibiotic Prescriptions among US Ambulatory Care Visits, 2010–2011. JAMA 2016, 315, 1864–1873. [Google Scholar] [CrossRef] [PubMed]
- No Time to Wait: Securing the Future from Drug-Resistant Infections. Available online: https://www.who.int/publications/i/item/no-time-to-wait-securing-the-future-from-drug-resistant-infections (accessed on 19 April 2024).
- Järvinen, A.K.; Laakso, S.; Piiparinen, P.; Aittakorpi, A.; Lindfors, M.; Huopaniemi, L.; Piiparinen, H.; Mäki, M. Rapid identification of bacterial pathogens using a PCR- and microarray-based assay. BMC Microbiol. 2009, 9, 161. [Google Scholar] [CrossRef]
- Abram, T.J.; Cherukury, H.; Ou, C.Y.; Vu, T.; Toledano, M.; Li, Y.; Grunwald, J.T.; Toosky, M.N.; Tifrea, D.F.; Slepenkin, A.; et al. Rapid bacterial detection and antibiotic susceptibility testing in whole blood using one-step, high throughput blood digital PCR. Lab Chip 2020, 20, 477–489. [Google Scholar] [CrossRef]
- Strommenger, B.; Kettlitz, C.; Werner, G.; Witte, W. Multiplex PCR assay for simultaneous detection of nine clinically relevant antibiotic resistance genes in Staphylococcus aureus. J. Clin. Microbiol. 2003, 41, 4089–4094. [Google Scholar] [CrossRef] [PubMed]
- Shih, C.M.; Chang, C.L.; Hsu, M.Y.; Lin, J.Y.; Kuan, C.M.; Wang, H.K.; Huang, C.T.; Chung, M.C.; Huang, K.C.; Hsu, C.E.; et al. Paper-based ELISA to rapidly detect Escherichia coli. Talanta 2015, 145, 2–5. [Google Scholar] [CrossRef] [PubMed]
- Febo, T.D.; Schirone, M.; Visciano, P.; Portanti, O.; Armillotta, G.; Persiani, T.; Giannatale, E.D.; Tittarelli, M.; Luciani, M. Development of a Capture ELISA for Rapid Detection of Salmonella enterica in Food Samples. Food Anal. Methods 2019, 12, 322–330. [Google Scholar] [CrossRef]
- Baltekin, Ö.; Boucharin, A.; Tano, E.; Andersson, D.I.; Elf, J. Antibiotic susceptibility testing in less than 30 min using direct single-cell imaging. Proc. Natl. Acad. Sci. USA 2017, 114, 9170–9175. [Google Scholar] [CrossRef] [PubMed]
- Singhal, N.; Kumar, M.; Kanaujia, P.K.; Virdi, J.S. MALDI-TOF mass spectrometry: An emerging technology for microbial identification and diagnosis. Front. Microbiol. 2015, 6, 144398. [Google Scholar] [CrossRef]
- Sloan, A.; Wang, G.; Cheng, K. Traditional approaches versus mass spectrometry in bacterial identification and typing. Clin. Chim. Acta 2017, 473, 180–185. [Google Scholar] [CrossRef] [PubMed]
- Lee, K.S.; Landry, Z.; Pereira, F.C.; Wagner, M.; Berry, D.; Huang, W.E.; Taylor, G.T.; Kneipp, J.; Popp, J.; Zhang, M.; et al. Raman microspectroscopy for microbiology. Nat. Rev. Methods Prim. 2021, 1, 80. [Google Scholar] [CrossRef]
- Butler, H.J.; Ashton, L.; Bird, B.; Cinque, G.; Curtis, K.; Dorney, J.; Esmonde-White, K.; Fullwood, N.J.; Gardner, B.; Martin-Hirsch, P.L.; et al. Using Raman spectroscopy to characterize biological materials. Nat. Protoc. 2016, 11, 664–687. [Google Scholar] [CrossRef] [PubMed]
- Wang, P.; Sun, Y.; Li, X.; Wang, L.; Xu, Y.; He, L.; Li, G. Recent advances in dual recognition based surface enhanced Raman scattering for pathogenic bacteria detection: A review. Anal. Chim. Acta 2021, 1157, 338279. [Google Scholar] [CrossRef] [PubMed]
- Ho, C.S.; Jean, N.; Hogan, C.A.; Blackmon, L.; Jeffrey, S.S.; Holodniy, M.; Banaei, N.; Saleh, A.A.; Ermon, S.; Dionne, J. Rapid identification of pathogenic bacteria using Raman spectroscopy and deep learning. Nat. Commun. 2019, 10, 4927. [Google Scholar] [CrossRef]
- Yan, S.; Wang, S.; Qiu, J.; Li, M.; Li, D.; Xu, D.; Li, D.; Liu, Q. Raman spectroscopy combined with machine learning for rapid detection of food-borne pathogens at the single-cell level. Talanta 2021, 226, 122195. [Google Scholar] [CrossRef] [PubMed]
- Graf, A.A.; Ogilvie, S.P.; Wood, H.J.; Brown, C.J.; Tripathi, M.; King, A.A.; Dalton, A.B.; Large, M.J. Raman Metrics for Molybdenum Disulfide and Graphene Enable Statistical Mapping of Nanosheet Populations. Chem. Mater. 2020, 32, 6213–6221. [Google Scholar] [CrossRef]
- Jordan, M.I.; Mitchell, T.M. Machine learning: Trends, perspectives, and prospects. Science 2015, 349, 255–260. [Google Scholar] [CrossRef] [PubMed]
- Sikder, R.; Zhang, T.; Ye, T. Predicting THM Formation and Revealing Its Contributors in Drinking Water Treatment Using Machine Learning. ACS ES T Water 2024, 4, 899–912. [Google Scholar] [CrossRef]
- Rahman, M.H.U.; Bommanapally, V.; Abeyrathna, D.; Ashaduzzman, M.; Tripathi, M.; Zahan, M.; Subramaniam, M.; Gadhamshetty, V. Machine Learning-Assisted Optical Detection of Multilayer Hexagonal Boron Nitride for Enhanced Characterization and Analysis. In Proceedings of the 2023 IEEE International Conference on Bioinformatics and Biomedicine (BIBM), Istanbul, Turkiye, 5–8 December 2023; pp. 4506–4508. [Google Scholar] [CrossRef]
- Rahman, M.H.U.; Dip, B.; Gurung, S.; Jasthi, B.K.; Gnimpieba, E.Z.; Gadhamshetty, V. Automated Crack Detection in 2D Hexagonal Boron Nitride Coatings Using Machine Learning. Coatings 2024, 14, 726. [Google Scholar] [CrossRef]
- Udupa, R.; Yegneswaran, P.P.; Lukose, J.; Chidangil, S. Utilization of Raman spectroscopy for identification and characterization of fungal pathogens. Fungal Biol. Rev. 2024, 47, 100339. [Google Scholar] [CrossRef]
- Usman, M.; Tang, J.W.; Li, F.; Lai, J.X.; Liu, Q.H.; Liu, W.; Wang, L. Recent advances in surface enhanced Raman spectroscopy for bacterial pathogen identifications. J. Adv. Res. 2023, 51, 91–107. [Google Scholar] [CrossRef]
- Rodriguez, L.; Zhang, Z.; Wang, D. Recent advances of Raman spectroscopy for the analysis of bacteria. Anal. Sci. Adv. 2023, 4, 81–95. [Google Scholar] [CrossRef]
- Liu, L.; Ma, W.; Wang, X.; Li, S. Recent Progress of Surface-Enhanced Raman Spectroscopy for Bacteria Detection. Biosensors 2023, 13, 350. [Google Scholar] [CrossRef] [PubMed]
- Zhu, A.; Ali, S.; Jiao, T.; Wang, Z.; Ouyang, Q.; Chen, Q. Advances in surface-enhanced Raman spectroscopy technology for detection of foodborne pathogens. Compr. Rev. Food Sci. Food Saf. 2023, 22, 1466–1494. [Google Scholar] [CrossRef] [PubMed]
- Wu, L.; Tang, X.; Wu, T.; Zeng, W.; Zhu, X.; Hu, B.; Zhang, S. A review on current progress of Raman-based techniques in food safety: From normal Raman spectroscopy to SESORS. Food Res. Int. 2023, 169, 112944. [Google Scholar] [CrossRef]
- Jayan, H.; Pu, H.; Sun, D.W. Recent developments in Raman spectral analysis of microbial single cells: Techniques and applications. Crit. Rev. Food Sci. Nutr. 2022, 62, 4294–4308. [Google Scholar] [CrossRef] [PubMed]
- Rebrosova, K.; Samek, O.; Kizovsky, M.; Bernatova, S.; Hola, V.; Ruzicka, F. Raman Spectroscopy—A Novel Method for Identification and Characterization of Microbes on a Single-Cell Level in Clinical Settings. Front. Cell. Infect. Microbiol. 2022, 12, 866463. [Google Scholar] [CrossRef]
- Wang, L.; Liu, W.; Tang, J.W.; Wang, J.J.; Liu, Q.H.; Wen, P.B.; Wang, M.M.; Pan, Y.C.; Gu, B.; Zhang, X. Applications of Raman Spectroscopy in Bacterial Infections: Principles, Advantages, and Shortcomings. Front. Microbiol. 2021, 12, 683580. [Google Scholar] [CrossRef]
- Berry, M.E.; Kearns, H.; Graham, D.; Faulds, K. Surface enhanced Raman scattering for the multiplexed detection of pathogenic microorganisms: Towards point-of-use applications. Analyst 2021, 146, 6084–6101. [Google Scholar] [CrossRef]
- Ahmad, W.; Wang, J.; Li, H.; Jiao, T.; Chen, Q. Trends in the bacterial recognition patterns used in surface enhanced Raman spectroscopy. TrAC Trends Anal. Chem. 2021, 142, 116310. [Google Scholar] [CrossRef]
- Akanny, E.; Bonhommé, A.; Bessueille, F.; Bourgeois, S.; Bordes, C. Surface enhanced Raman spectroscopy for bacteria analysis: A review. Appl. Spectrosc. Rev. 2021, 56, 380–422. [Google Scholar] [CrossRef]
- Chen, H.; Das, A.; Bi, L.; Choi, N.; Moon, J.I.; Wu, Y.; Park, S.; Choo, J. Recent advances in surface-enhanced Raman scattering-based microdevices for point-of-care diagnosis of viruses and bacteria. Nanoscale 2020, 12, 21560–21570. [Google Scholar] [CrossRef] [PubMed]
- Chisanga, M.; Linton, D.; Muhamadali, H.; Ellis, D.I.; Kimber, R.L.; Mironov, A.; Goodacre, R. Rapid differentiation of Campylobacter jejuni cell wall mutants using Raman spectroscopy, SERS and mass spectrometry combined with chemometrics. Analyst 2020, 145, 1236–1249. [Google Scholar] [CrossRef]
- Wu, Y.; Gadsden, S.A. Machine learning algorithms in microbial classification: A comparative analysis. Front. Artif. Intell. 2023, 6, 1200994. [Google Scholar] [CrossRef]
- Kotwal, S.; Rani, P.; Arif, T.; Manhas, J.; Sharma, S. Automated Bacterial Classifications Using Machine Learning Based Computational Techniques: Architectures, Challenges and Open Research Issues. Arch. Comput. Methods Eng. 2022, 29, 2469–2490. [Google Scholar] [CrossRef]
- Zhang, Y.; Jiang, H.; Ye, T.; Juhas, M. Deep Learning for Imaging and Detection of Microorganisms. Trends Microbiol. 2021, 29, 569–572. [Google Scholar] [CrossRef]
- Rani, P.; Kotwal, S.; Manhas, J.; Sharma, V.; Sharma, S. Machine Learning and Deep Learning Based Computational Approaches in Automatic Microorganisms Image Recognition: Methodologies, Challenges, and Developments. Arch. Comput. Methods Eng. 2021, 29, 1801–1837. [Google Scholar] [CrossRef] [PubMed]
- Goodswen, S.J.; Barratt, J.L.; Kennedy, P.J.; Kaufer, A.; Calarco, L.; Ellis, J.T. Machine learning and applications in microbiology. FEMS Microbiol. Rev. 2021, 45, fuab015. [Google Scholar] [CrossRef]
- Nami, Y.; Imeni, N.; Panahi, B. Application of machine learning in bacteriophage research. BMC Microbiol. 2021, 21, 193. [Google Scholar] [CrossRef]
- Anahtar, M.N.; Yang, J.H.; Kanjilal, S. Applications of Machine Learning to the Problem of Antimicrobial Resistance: An Emerging Model for Translational Research. J. Clin. Microbiol. 2021, 59. [Google Scholar] [CrossRef] [PubMed]
- Peiffer-Smadja, N.; Dellière, S.; Rodriguez, C.; Birgand, G.; Lescure, F.X.; Fourati, S.; Ruppé, E. Machine learning in the clinical microbiology laboratory: Has the time come for routine practice? Clin. Microbiol. Infect. 2020, 26, 1300–1309. [Google Scholar] [CrossRef] [PubMed]
- Weis, C.V.; Jutzeler, C.R.; Borgwardt, K. Machine learning for microbial identification and antimicrobial susceptibility testing on MALDI-TOF mass spectra: A systematic review. Clin. Microbiol. Infect. 2020, 26, 1310–1317. [Google Scholar] [CrossRef] [PubMed]
- Qu, K.; Guo, F.; Liu, X.; Lin, Y.; Zou, Q. Application of machine learning in microbiology. Front. Microbiol. 2019, 10, 451710. [Google Scholar] [CrossRef] [PubMed]
- Rathnayake, R.A.; Zhao, Z.; McLaughlin, N.; Li, W.; Yan, Y.; Chen, L.L.; Xie, Q.; Wu, C.D.; Mathew, M.T.; Wang, R.R. Machine learning enabled multiplex detection of periodontal pathogens by surface-enhanced Raman spectroscopy. Int. J. Biol. Macromol. 2024, 257, 128773. [Google Scholar] [CrossRef] [PubMed]
- Liu, C.Y.; Han, Y.Y.; Shih, P.H.; Lian, W.N.; Wang, H.H.; Lin, C.H.; Hsueh, P.R.; Wang, J.K.; Wang, Y.L. Rapid bacterial antibiotic susceptibility test based on simple surface-enhanced Raman spectroscopic biomarkers. Sci. Rep. 2016, 6, 23375. [Google Scholar] [CrossRef]
- Lu, X.; Samuelson, D.R.; Xu, Y.; Zhang, H.; Wang, S.; Rasco, B.A.; Xu, J.; Konkel, M.E. Detecting and tracking nosocomial methicillin-resistant Staphylococcus aureus using a microfluidic SERS biosensor. Anal. Chem. 2013, 85, 2320–2327. [Google Scholar] [CrossRef] [PubMed]
- Yan, S.; Liu, C.; Fang, S.; Ma, J.; Qiu, J.; Xu, D.; Li, L.; Yu, J.; Li, D.; Liu, Q. SERS-based lateral flow assay combined with machine learning for highly sensitive quantitative analysis of Escherichia coli O157:H7. Anal. Bioanal. Chem. 2020, 412, 7881–7890. [Google Scholar] [CrossRef] [PubMed]
- Cheong, Y.; Kim, Y.J.; Kang, H.; Choi, S.; Lee, H.J. Rapid label-free identification of Klebsiella pneumoniae antibiotic resistant strains by the drop-coating deposition surface-enhanced Raman scattering method. Spectrochim. Acta. Part A Mol. Biomol. Spectrosc. 2017, 183, 53–59. [Google Scholar] [CrossRef]
- Li, J.; Wang, C.; Shi, L.; Shao, L.; Fu, P.; Wang, K.; Xiao, R.; Wang, S.; Gu, B. Rapid identification and antibiotic susceptibility test of pathogens in blood based on magnetic separation and surface-enhanced Raman scattering. Microchim. Acta 2019, 186, 475. [Google Scholar] [CrossRef]
- Wu, X.; Xu, C.; Tripp, R.A.; Huang, Y.W.; Zhao, Y. Detection and differentiation of foodborne pathogenic bacteria in mung bean sprouts using field deployable label-free SERS devices. Analyst 2013, 138, 3005–3012. [Google Scholar] [CrossRef] [PubMed]
- Kumar, A.; Islam, M.R.; Zughaier, S.M.; Chen, X.; Zhao, Y. Precision classification and quantitative analysis of bacteria biomarkers via surface-enhanced Raman spectroscopy and machine learning. Spectrochim. Acta Part A Mol. Biomol. Spectrosc. 2024, 320, 124627. [Google Scholar] [CrossRef] [PubMed]
- Tang, J.W.; Yuan, Q.; Wen, X.R.; Usman, M.; Tay, A.C.Y.; Wang, L.; Wang, C.L. Label-free surface-enhanced Raman spectroscopy coupled with machine learning algorithms in pathogenic microbial identification: Current trends, challenges, and perspectives. Interdiscip. Med. 2024, e20230060. [Google Scholar] [CrossRef]
- Jarvis, R.M.; Goodacre, R. Discrimination of bacteria using surface-enhanced Raman spectroscopy. Anal. Chem. 2004, 76, 40–47. [Google Scholar] [CrossRef] [PubMed]
- Tseng, Y.M.; Chen, K.L.; Chao, P.H.; Han, Y.Y.; Huang, N.T. Deep Learning-Assisted Surface-Enhanced Raman Scattering for Rapid Bacterial Identification. ACS Appl. Mater. Interfaces 2023, 15, 26398–26406. [Google Scholar] [CrossRef] [PubMed]
- Leong, S.X.; Tan, E.X.; Han, X.; Luhung, I.; Aung, N.W.; Nguyen, L.B.T.; Tan, S.Y.; Li, H.; Phang, I.Y.; Schuster, S.; et al. Surface-Enhanced Raman Scattering-Based Surface Chemotaxonomy: Combining Bacteria Extracellular Matrices and Machine Learning for Rapid and Universal Species Identification. ACS Nano 2023, 17, 23132–23143. [Google Scholar] [CrossRef] [PubMed]
- Sun, J.; Xu, X.; Feng, S.; Zhang, H.; Xu, L.; Jiang, H.; Sun, B.; Meng, Y.; Chen, W. Rapid identification of salmonella serovars by using Raman spectroscopy and machine learning algorithm. Talanta 2023, 253, 123807. [Google Scholar] [CrossRef] [PubMed]
- Ding, J.; Lin, Q.; Zhang, J.; Young, G.M.; Jiang, C.; Zhong, Y.; Zhang, J. Rapid identification of pathogens by using surface-enhanced Raman spectroscopy and multi-scale convolutional neural network. Anal. Bioanal. Chem. 2021, 413, 3801–3811. [Google Scholar] [CrossRef] [PubMed]
- Wang, W.; Wang, X.; Huang, Y.; Zhao, Y.; Fang, X.; Cong, Y.; Tang, Z.; Chen, L.; Zhong, J.; Li, R.; et al. Raman spectrum combined with deep learning for precise recognition of Carbapenem-resistant Enterobacteriaceae. Anal. Bioanal. Chem. 2024, 416, 2465–2478. [Google Scholar] [CrossRef]
- Al-Shaebi, Z.; Ciloglu, F.U.; Nasser, M.; Kahraman, M.; Aydin, O. Staphylococcus Aureus-Related antibiotic resistance detection using synergy of Surface-Enhanced Raman spectroscopy and deep learning. Biomed. Signal Process. Control 2024, 91, 105933. [Google Scholar] [CrossRef]
- Qi, Y.; Hu, D.; Jiang, Y.; Wu, Z.; Zheng, M.; Chen, E.X.; Liang, Y.; Sadi, M.A.; Zhang, K.; Chen, Y.P. Recent Progresses in Machine Learning Assisted Raman Spectroscopy. Adv. Opt. Mater. 2023, 11, 2203104. [Google Scholar] [CrossRef]
- Rahman, M.H.U.; Tripathi, M.; Dalton, A.; Subramaniam, M.; Talluri, S.N.; Jasthi, B.K.; Gadhamshetty, V. Machine Learning-Guided Optical and Raman Spectroscopy Characterization of 2D Materials. In Machine Learning in 2D Materials Science; CRC Press: Boca Raton, FL, USA, 2023; pp. 163–177. [Google Scholar] [CrossRef]
- Zhou, H.; Xu, L.; Ren, Z.; Zhu, J.; Lee, C. Machine learning-augmented surface-enhanced spectroscopy toward next-generation molecular diagnostics. Nanoscale Adv. 2023, 5, 538–570. [Google Scholar] [CrossRef] [PubMed]
- Luo, R.; Popp, J.; Bocklitz, T. Deep Learning for Raman Spectroscopy: A Review. Analytica 2022, 3, 287–301. [Google Scholar] [CrossRef]
- Pan, L.; Zhang, P.; Daengngam, C.; Peng, S.; Chongcheawchamnan, M. A review of artificial intelligence methods combined with Raman spectroscopy to identify the composition of substances. J. Raman Spectrosc. 2022, 53, 6–19. [Google Scholar] [CrossRef]
- Ralbovsky, N.M.; Lednev, I.K. Towards development of a novel universal medical diagnostic method: Raman spectroscopy and machine learning. Chem. Soc. Rev. 2020, 49, 7428–7453. [Google Scholar] [CrossRef] [PubMed]
- Lussier, F.; Thibault, V.; Charron, B.; Wallace, G.Q.; Masson, J.F. Deep learning and artificial intelligence methods for Raman and surface-enhanced Raman scattering. TrAC Trends Anal. Chem. 2020, 124, 115796. [Google Scholar] [CrossRef]
- Monteiro, J.M.; Fernandes, P.B.; Vaz, F.; Pereira, A.R.; Tavares, A.C.; Ferreira, M.T.; Pereira, P.M.; Veiga, H.; Kuru, E.; Vannieuwenhze, M.S.; et al. Cell shape dynamics during the staphylococcal cell cycle. Nat. Commun. 2015, 6, 8055. [Google Scholar] [CrossRef] [PubMed]
- Cook, G.M.; Berney, M.; Gebhard, S.; Heinemann, M.; Cox, R.A.; Danilchanka, O.; Niederweis, M. Physiology of Mycobacteria. Adv. Microb. Physiol. 2009, 55, 81–182, 318–319. [Google Scholar] [CrossRef] [PubMed]
- Raman, C.V.; Krishnan, K.S. A New Type of Secondary Radiation. Nature 1928, 121, 501–502. [Google Scholar] [CrossRef]
- Han, X.X.; Rodriguez, R.S.; Haynes, C.L.; Ozaki, Y.; Zhao, B. Surface-enhanced Raman spectroscopy. Nat. Rev. Methods Prim. 2022, 1, 87. [Google Scholar] [CrossRef]
- Stiles, P.L.; Dieringer, J.A.; Shah, N.C.; Duyne, R.P.V. Surface-enhanced Raman spectroscopy. Annu. Rev. Anal. Chem. 2008, 1, 601–626. [Google Scholar] [CrossRef]
- Ding, S.Y.; Yi, J.; Li, J.F.; Ren, B.; Wu, D.Y.; Panneerselvam, R.; Tian, Z.Q. Nanostructure-based plasmon-enhanced Raman spectroscopy for surface analysis of materials. Nat. Rev. Mater. 2016, 1, 16021. [Google Scholar] [CrossRef]
- Willets, K.A.; Duyne, R.P.V. Localized surface plasmon resonance spectroscopy and sensing. Annu. Rev. Phys. Chem. 2007, 58, 267–297. [Google Scholar] [CrossRef]
- Hutter, E.; Fendler, J.H. Exploitation of Localized Surface Plasmon Resonance. Adv. Mater. 2004, 16, 1685–1706. [Google Scholar] [CrossRef]
- Schlücker, S.; Schlücker, S. Surface-Enhanced Raman Spectroscopy: Concepts and Chemical Applications. Angew. Chem. Int. Ed. 2014, 53, 4756–4795. [Google Scholar] [CrossRef]
- Pérez-Jiménez, A.I.; Lyu, D.; Lu, Z.; Liu, G.; Ren, B. Surface-enhanced Raman spectroscopy: Benefits, trade-offs and future developments. Chem. Sci. 2020, 11, 4563–4577. [Google Scholar] [CrossRef] [PubMed]
- Ru, E.C.L.; Etchegoin, P.G. Quantifying SERS enhancements. MRS Bull. 2013, 38, 631–640. [Google Scholar] [CrossRef]
- Halas, N.J.; Lal, S.; Chang, W.S.; Link, S.; Nordlander, P. Plasmons in strongly coupled metallic nanostructures. Chem. Rev. 2011, 111, 3913–3961. [Google Scholar] [CrossRef] [PubMed]
- Zhao, Y.; Zhang, Z.; Ning, Y.; Miao, P.; Li, Z.; Wang, H. Simultaneous quantitative analysis of Escherichia coli, Staphylococcus aureus and Salmonella typhimurium using surface-enhanced Raman spectroscopy coupled with partial least squares regression and artificial neural networks. Spectrochim. Acta. Part A Mol. Biomol. Spectrosc. 2023, 293, 122510. [Google Scholar] [CrossRef]
- Sil, S.; Mukherjee, R.; Kumbhar, D.; Reghu, D.; Shrungar, D.; Kumar, N.S.; Singh, U.K.; Umapathy, S. Raman spectroscopy and artificial intelligence open up accurate detection of pathogens from DNA-based sub-species level classification. J. Raman Spectrosc. 2021, 52, 2648–2659. [Google Scholar] [CrossRef]
- Kanno, N.; Kato, S.; Ohkuma, M.; Matsui, M.; Iwasaki, W.; Shigeto, S. Machine learning-assisted single-cell Raman fingerprinting for in situ and nondestructive classification of prokaryotes. iScience 2021, 24, 102975. [Google Scholar] [CrossRef] [PubMed]
- Liu, W.; Tang, J.W.; Mou, J.Y.; Lyu, J.W.; Di, Y.W.; Liao, Y.L.; Luo, Y.F.; Li, Z.K.; Wu, X.; Wang, L. Rapid discrimination of Shigella spp. and Escherichia coli via label-free surface enhanced Raman spectroscopy coupled with machine learning algorithms. Front. Microbiol. 2023, 14, 1101357. [Google Scholar] [CrossRef] [PubMed]
- Yu, S.; Li, H.; Li, X.; Fu, Y.V.; Liu, F. Classification of pathogens by Raman spectroscopy combined with generative adversarial networks. Sci. Total Environ. 2020, 726, 138477. [Google Scholar] [CrossRef] [PubMed]
- Deng, L.; Zhong, Y.; Wang, M.; Zheng, X.; Zhang, J. Scale-Adaptive Deep Model for Bacterial Raman Spectra Identification. IEEE J. Biomed. Health Inform. 2022, 26, 369–378. [Google Scholar] [CrossRef] [PubMed]
- Tang, J.W.; Liu, Q.H.; Yin, X.C.; Pan, Y.C.; Wen, P.B.; Liu, X.; Kang, X.X.; Gu, B.; Zhu, Z.B.; Wang, L. Comparative Analysis of Machine Learning Algorithms on Surface Enhanced Raman Spectra of Clinical Staphylococcus Species. Front. Microbiol. 2021, 12, 696921. [Google Scholar] [CrossRef] [PubMed]
- Lu, W.; Li, H.; Qiu, H.; Wang, L.; Feng, J.; Fu, Y.V. Identification of pathogens and detection of antibiotic susceptibility at single-cell resolution by Raman spectroscopy combined with machine learning. Front. Microbiol. 2023, 13, 1076965. [Google Scholar] [CrossRef] [PubMed]
- Gu, J.; Wang, Z.; Kuen, J.; Ma, L.; Shahroudy, A.; Shuai, B.; Liu, T.; Wang, X.; Wang, G.; Cai, J.; et al. Recent advances in convolutional neural networks. Pattern Recognit. 2018, 77, 354–377. [Google Scholar] [CrossRef]
- Tewes, T.J.; Kerst, M.; Pavlov, S.; Huth, M.A.; Hansen, U.; Bockmühl, D.P. Unveiling the efficacy of a bulk Raman spectra-based model in predicting single cell Raman spectra of microorganisms. Heliyon 2024, 10, e27824. [Google Scholar] [CrossRef] [PubMed]
- Hu, J.; He, L.; Wang, G.; Liu, L.; Wang, Y.; Song, J.; Qu, J.; Peng, X.; Yuan, Y. Rapid and accurate identification of marine bacteria spores at a single-cell resolution by laser tweezers Raman spectroscopy and deep learning. J. Biophotonics 2024, 17, e202300510. [Google Scholar] [CrossRef] [PubMed]
- Contreras, J.; Mostafapour, S.; Popp, J.; Bocklitz, T. Siamese Networks for Clinically Relevant Bacteria Classification Based on Raman Spectroscopy. Molecules 2024, 29, 1061. [Google Scholar] [CrossRef]
- Wang, L.; Tang, J.W.; Li, F.; Usman, M.; Wu, C.Y.; Liu, Q.H.; Kang, H.Q.; Liu, W.; Gu, B. Identification of Bacterial Pathogens at Genus and Species Levels through Combination of Raman Spectrometry and Deep-Learning Algorithms. Microbiol. Spectr. 2022, 10, e02580-22. [Google Scholar] [CrossRef] [PubMed]
- Alzubaidi, L.; Zhang, J.; Humaidi, A.J.; Al-Dujaili, A.; Duan, Y.; Al-Shamma, O.; Santamaría, J.; Fadhel, M.A.; Al-Amidie, M.; Farhan, L. Review of deep learning: Concepts, CNN architectures, challenges, applications, future directions. J. Big Data 2021, 8, 53. [Google Scholar] [CrossRef] [PubMed]
- Qin, Y.F.; Lu, X.Y.; Shi, Z.; Huang, Q.S.; Wang, X.; Ren, B.; Cui, L. Deep Learning-Enabled Raman Spectroscopic Identification of Pathogen-Derived Extracellular Vesicles and the Biogenesis Process. Anal. Chem. 2022, 94, 12416–12426. [Google Scholar] [CrossRef] [PubMed]
- Basodi, S.; Ji, C.; Zhang, H.; Pan, Y. Gradient amplification: An efficient way to train deep neural networks. Big Data Min. Anal. 2020, 3, 196–207. [Google Scholar] [CrossRef]
- Zhou, B.; Tong, Y.K.; Zhang, R.; Ye, A. RamanNet: A lightweight convolutional neural network for bacterial identification based on Raman spectra. RSC Adv. 2022, 12, 26463–26469. [Google Scholar] [CrossRef] [PubMed]
- Lu, J.; Chen, J.; Liu, C.; Zeng, Y.; Sun, Q.; Li, J.; Shen, Z.; Chen, S.; Zhang, R. Identification of antibiotic resistance and virulence-encoding factors in Klebsiella pneumoniae by Raman spectroscopy and deep learning. Microb. Biotechnol. 2022, 15, 1270–1280. [Google Scholar] [CrossRef] [PubMed]
- Maruthamuthu, M.K.; Raffiee, A.H.; Oliveira, D.M.D.; Ardekani, A.M.; Verma, M.S. Raman spectra-based deep learning: A tool to identify microbial contamination. MicrobiologyOpen 2020, 9, e1122. [Google Scholar] [CrossRef]
- Lu, W.; Chen, X.; Wang, L.; Li, H.; Fu, Y.V. Combination of an Artificial Intelligence Approach and Laser Tweezers Raman Spectroscopy for Microbial Identification. Anal. Chem. 2020, 92, 6288–6296. [Google Scholar] [CrossRef]
- Guidotti, R.; Monreale, A.; Ruggieri, S.; Turini, F.; Giannotti, F.; Pedreschi, D. A Survey of Methods for Explaining Black Box Models. ACM Comput. Surv. (CSUR) 2018, 51, 93. [Google Scholar] [CrossRef]
- Zhang, Q.; Wu, Y.N.; Zhu, S.C. Interpretable Convolutional Neural Networks. In Proceedings of the IEEE Computer Society Conference on Computer Vision and Pattern Recognition, Salt Lake City, UT, USA, 18–23 June 2018; pp. 8827–8836. [Google Scholar] [CrossRef]
- Selvaraju, R.R.; Cogswell, M.; Das, A.; Vedantam, R.; Parikh, D.; Batra, D. Grad-CAM: Visual Explanations from Deep Networks via Gradient-Based Localization. Int. J. Comput. Vis. 2020, 128, 336–359. [Google Scholar] [CrossRef]
- Zhang, X.; Xu, J.; Yang, J.; Chen, L.; Zhou, H.; Liu, X.; Li, H.; Lin, T.; Ying, Y. Understanding the learning mechanism of convolutional neural networks in spectral analysis. Anal. Chim. Acta 2020, 1119, 41–51. [Google Scholar] [CrossRef] [PubMed]
- Ciloglu, F.U.; Caliskan, A.; Saridag, A.M.; Kilic, I.H.; Tokmakci, M.; Kahraman, M.; Aydin, O. Drug-resistant Staphylococcus aureus bacteria detection by combining surface-enhanced Raman spectroscopy (SERS) and deep learning techniques. Sci. Rep. 2021, 11, 18444. [Google Scholar] [CrossRef] [PubMed]
- Tong, S.Y.; Davis, J.S.; Eichenberger, E.; Holland, T.L.; Fowler, V.G. Staphylococcus aureus infections: Epidemiology, pathophysiology, clinical manifestations, and management. Clin. Microbiol. Rev. 2015, 28, 603–661. [Google Scholar] [CrossRef] [PubMed]
- Walter, A.; März, A.; Schumacher, W.; Rösch, P.; Popp, J. Towards a fast, high specific and reliable discrimination of bacteria on strain level by means of SERS in a microfluidic device. Lab Chip 2011, 11, 1013–1021. [Google Scholar] [CrossRef] [PubMed]
- Zhou, H.; Yang, D.; Ivleva, N.P.; Mircescu, N.E.; Niessner, R.; Haisch, C. SERS detection of bacteria in water by in situ coating with Ag nanoparticles. Anal. Chem. 2014, 86, 1525–1533. [Google Scholar] [CrossRef]
- Schuster, K.C.; Reese, I.; Urlaub, E.; Gapes, J.R.; Lendl, B. Multidimensional information on the chemical composition of single bacterial cells by confocal Raman microspectroscopy. Anal. Chem. 2000, 72, 5529–5534. [Google Scholar] [CrossRef] [PubMed]
- García, A.B.; Viñuela-Prieto, J.M.; López-González, L.; Candel, F.J. Correlation between resistance mechanisms in Staphylococcus aureus and cell wall and septum thickening. Infect. Drug Resist. 2017, 10, 353–356. [Google Scholar] [CrossRef]
- Ciloglu, F.U.; Saridag, A.M.; Kilic, I.H.; Tokmakci, M.; Kahraman, M.; Aydin, O. Identification of methicillin-resistant Staphylococcus aureus bacteria using surface-enhanced Raman spectroscopy and machine learning techniques. Analyst 2020, 145, 7559–7570. [Google Scholar] [CrossRef]
- Tang, J.W.; Li, J.Q.; Yin, X.C.; Xu, W.W.; Pan, Y.C.; Liu, Q.H.; Gu, B.; Zhang, X.; Wang, L. Rapid Discrimination of Clinically Important Pathogens through Machine Learning Analysis of Surface Enhanced Raman Spectra. Front. Microbiol. 2022, 13, 843417. [Google Scholar] [CrossRef]
- Gautam, R.; Vanga, S.; Ariese, F.; Umapathy, S. Review of multidimensional data processing approaches for Raman and infrared spectroscopy. EPJ Tech. Instrum. 2015, 2, 8. [Google Scholar] [CrossRef]
- Byrne, H.J.; Knief, P.; Keating, M.E.; Bonnier, F. Spectral pre and post processing for infrared and Raman spectroscopy of biological tissues and cells. Chem. Soc. Rev. 2016, 45, 1865–1878. [Google Scholar] [CrossRef] [PubMed]
- Boardman, A.K.; Wong, W.S.; Premasiri, W.R.; Ziegler, L.D.; Lee, J.C.; Miljkovic, M.; Klapperich, C.M.; Sharon, A.; Sauer-Budge, A.F. Rapid detection of bacteria from blood with surface-enhanced Raman spectroscopy. Anal. Chem. 2016, 88, 8026–8035. [Google Scholar] [CrossRef] [PubMed]
- Sivanesan, A.; Witkowska, E.; Adamkiewicz, W.; Dziewit, Ł.; Kamińska, A.; Waluk, J. Nanostructured silver–gold bimetallic SERS substrates for selective identification of bacteria in human blood. Analyst 2014, 139, 1037–1043. [Google Scholar] [CrossRef] [PubMed]
- Premasiri, W.R.; Gebregziabher, Y.; Ziegler, L.D. On the difference between surface-enhanced raman scattering (SERS) spectra of cell growth media and whole bacterial cells. Appl. Spectrosc. 2011, 65, 493–499. [Google Scholar] [CrossRef] [PubMed]
- Auner, G.W.; Koya, S.K.; Huang, C.; Broadbent, B.; Trexler, M.; Auner, Z.; Elias, A.; Mehne, K.C.; Brusatori, M.A. Applications of Raman spectroscopy in cancer diagnosis. Cancer Metastasis Rev. 2018, 37, 691–717. [Google Scholar] [CrossRef] [PubMed]
- Liu, B.; Liu, K.; Wang, N.; Ta, K.; Liang, P.; Yin, H.; Li, B. Laser tweezers Raman spectroscopy combined with deep learning to classify marine bacteria. Talanta 2022, 244, 123383. [Google Scholar] [CrossRef]
- Kong, J.L.; Dong, L.Q.; Wang, Q.Q.; Wei, K.; Xiangli, W.T.; Teng, G.E.; Liu, W.W.; Cui, X.T. Extending the spectral database of laser-induced breakdown spectroscopy with generative adversarial nets. Opt. Express 2019, 27, 6958–6969. [Google Scholar] [CrossRef]
- Goodfellow, I.J.; Pouget-Abadie, J.; Mirza, M.; Xu, B.; Warde-Farley, D.; Ozair, S.; Courville, A.; Bengio, Y. Generative Adversarial Networks. Sci. Robot. 2014, 3, 2672–2680. [Google Scholar] [CrossRef]
- Karras, T.; Aila, T.; Laine, S.; Lehtinen, J. Progressive Growing of GANs for Improved Quality, Stability, and Variation. In Proceedings of the 6th International Conference on Learning Representations, ICLR 2018—Conference Track Proceedings, Vancouver, BC, Canada, 30 April–3 May 2018. [Google Scholar] [CrossRef]
- Vallejo-Pérez, M.R.; Sosa-Herrera, J.A.; Navarro-Contreras, H.R.; Álvarez Preciado, L.G.; Rodríguez-Vázquez, Á.G.; Lara-Ávila, J.P.; Potosí, L.; de la Cruz, E.P.; de Graciano Sánchez, S.; Potosí, S.L. Raman Spectroscopy and Machine-Learning for Early Detection of Bacterial Canker of Tomato: The Asymptomatic Disease Condition. Plants 2021, 10, 1542. [Google Scholar] [CrossRef]
- Kaparakis-Liaskos, M.; Ferrero, R.L. Immune modulation by bacterial outer membrane vesicles. Nat. Rev. Immunol. 2015, 15, 375–387. [Google Scholar] [CrossRef]
- Woo, S.; Park, J.; Lee, J.Y.; Kweon, I.S. CBAM: Convolutional block attention module. In Lecture Notes in Computer Science (Including Subseries Lecture Notes in Artificial Intelligence and Lecture Notes in Bioinformatics); Springer: Cham, Switzerland, 2018; Volume 11211 LNCS, pp. 3–19. [Google Scholar] [CrossRef]
- Singh, S.; Kumbhar, D.; Reghu, D.; Venugopal, S.J.; Rekha, P.T.; Mohandas, S.; Rao, S.; Rangaiah, A.; Chunchanur, S.K.; Saini, D.K.; et al. Culture-Independent Raman Spectroscopic Identification of Bacterial Pathogens from Clinical Samples Using Deep Transfer Learning. Anal. Chem. 2022, 94, 14745–14754. [Google Scholar] [CrossRef] [PubMed]
- Thomsen, B.L.; Christensen, J.B.; Rodenko, O.; Usenov, I.; Grønnemose, R.B.; Andersen, T.E.; Lassen, M. Accurate and fast identification of minimally prepared bacteria phenotypes using Raman spectroscopy assisted by machine learning. Sci. Rep. 2022, 12, 16436. [Google Scholar] [CrossRef] [PubMed]
- Al-Shaebi, Z.; Ciloglu, F.U.; Nasser, M.; Aydin, O. Highly Accurate Identification of Bacteria’s Antibiotic Resistance Based on Raman Spectroscopy and U-Net Deep Learning Algorithms. ACS Omega 2022, 7, 29443–29451. [Google Scholar] [CrossRef]
- Yu, S.; Li, X.; Lu, W.; Li, H.; Fu, Y.V.; Liu, F. Analysis of Raman Spectra by Using Deep Learning Methods in the Identification of Marine Pathogens. Anal. Chem. 2021, 93, 11089–11098. [Google Scholar] [CrossRef]
- Kelly, K.L.; Coronado, E.; Zhao, L.L.; Schatz, G.C. The optical properties of metal nanoparticles: The influence of size, shape, and dielectric environment. J. Phys. Chem. B 2003, 107, 668–677. [Google Scholar] [CrossRef]
- Cong, S.; Liu, X.; Jiang, Y.; Zhang, W.; Zhao, Z. Surface Enhanced Raman Scattering Revealed by Interfacial Charge-Transfer Transitions. Innovation 2020, 1, 100051. [Google Scholar] [CrossRef]
- Jensen, L.; Aikens, C.M.; Schatz, G.C. Electronic structure methods for studying surface-enhanced Raman scattering. Chem. Soc. Rev. 2008, 37, 1061–1073. [Google Scholar] [CrossRef]
- McFarland, A.D.; Young, M.A.; Dieringer, J.A.; Duyne, R.P.V. Wavelength-scanned surface-enhanced Raman excitation spectroscopy. J. Phys. Chem. B 2005, 109, 11279–11285. [Google Scholar] [CrossRef]
- Xu, J.; Yi, X.; Jin, G.; Peng, D.; Fan, G.; Xu, X.; Chen, X.; Yin, H.; Cooper, J.M.; Huang, W.E. High-Speed Diagnosis of Bacterial Pathogens at the Single Cell Level by Raman Microspectroscopy with Machine Learning Filters and Denoising Autoencoders. ACS Chem. Biol. 2022, 17, 376–385. [Google Scholar] [CrossRef] [PubMed]
- Barzan, G.; Sacco, A.; Mandrile, L.; Giovannozzi, A.M.; Portesi, C.; Rossi, A.M. Hyperspectral chemical imaging of single bacterial cell structure by raman spectroscopy and machine learning. Appl. Sci. 2021, 11, 3409. [Google Scholar] [CrossRef]
- Moawad, A.A.; Silge, A.; Bocklitz, T.; Fischer, K.; Rösch, P.; Roesler, U.; Elschner, M.C.; Popp, J.; Neubauer, H. A Machine Learning-Based Raman Spectroscopic Assay for the Identification of Burkholderia mallei and Related Species. Molecules 2019, 24, 4516. [Google Scholar] [CrossRef] [PubMed]


| Techniques | Strengths | Weaknesses | Ideal Applications | Key References for Pathogen Detection |
|---|---|---|---|---|
| Unsupervised ML | ||||
| PCA, K-means, hierarchical clustering, DBSCAN, etc. 1 | (1) No need for labeled data. (2) Automatic identification of groups or clusters. (3) Useful for exploratory data analysis. | (1) Limited ability to handle complex data structures. (2) Sensitive to initialization and parameter settings. (3) Difficult to interpret clusters in high-dimensional spaces. | (1) Preliminary analysis for bacterial identification. (2) Exploratory data analysis. (3) Clustering of bacterial spectra. | (1) PCA and hierarchical clustering for discriminating Raman DNA signatures of B. anthracis from B. cereus and B. thuringiensis [85]. |
| Supervised ML | ||||
| Traditional methods: SVM, RF, DT, KNN, ensemble methods, etc. 2 | (1) Effective for smaller datasets. (2) Computationally efficient. (3) Interpretable models. | (1) Limited ability to capture complex non-linear relationships. (2) Performance depends on feature selection and data quality. (3) Potential overfitting or underfitting issues. | (1) Rapid clinical diagnostics. (2) Analysis of mixed bacterial samples. (3) Bacterial identification and discrimination. | (1) RF for accurate classification of bacteria and archaea, identifying key biomolecules [86]. (2) RF for analysis of bacterial extracellular matrices (ECMs) [60]. |
| CNN 3 | (1) Handles complex spectral data. (2) Automatic feature extraction. (3) Effective for classification tasks. | (1) Requires large, labeled datasets. (2) Computationally intensive. (3) Black-box models (low interpretability). | (1) Clinical diagnostics (rapid, complex samples). (2) Precise identification (antibiotic resistance). (3) Single-cell analysis and microbial ecology research. | (1) CNN for identifying bacterial isolates and predicting antibiotic treatments [18]. (2) CNN to distinguish between closely related Shigella spp. and E. coli strains [87]. |
| ODL methods: ViT, aNN, ResNet, GANs, etc. 4 | (1) Effective for complex data and limited datasets. (2) Robust to complex samples and real-world noise. (3) Can handle sequential data and long-range dependencies. | (1) Computationally intensive. (2) Needs careful validation on diverse datasets. (3) Requires domain expertise to select the right ODL method. | (1) Analysis of complex clinical samples. (2) Analysis of rare/hard-to-culture samples. (3) Microbial ecology/strain-level analysis. | (1) ViT for rapid antibiotic resistance classification in clinical settings [59]. (2) GANs to enhance datasets for rare deep-sea bacteria analysis [88]. |
| Challenge Addressed | Accuracy Metric | Key Insight | SERS (Y/N) | Ref. |
|---|---|---|---|---|
| Differentiating closely related pathogens | 99.64% | SERS + CNN for Shigella/E. coli differentiation | Y | [87] |
| Clinical application, complex samples | CNN: 99.80% (genus), 98.37% (species) | SERS + CNN for clinical pathogens | Y | [96] |
| CNN complexity, computational resources | 84.7 ± 0.3% (isolate), 97 ± 0.3% (treatment ID) | RamanNet: simplified CNN | N | [100] |
| Urgent diagnostics for resistant/hypervirulent strains | >94% for antibiotic resistance genes | Raman–CNN for K. pneumoniae diagnostics | N | [101] |
| Accuracy limitations of existing methods | 86.7% (isolate), 92.7% (MRSA/MSSA) | Multiscale DL for ID | N | [89] |
| Identifying closely related pathogens beyond whole-cell analysis | CNN: 96.33% | DNA-based Raman + CNN | N | [85] |
| Limited spectral variation between serovars | 97% | SERS + multiscale CNN for Salmonella serovars | Y | [62] |
| Microbial contamination, complex matrices | 95–100% | CNN for diverse bacterial ID | N | [102] |
| Microbial complexity, single-cell analysis | 95.64 ± 5.46% | Single-cell ID with Raman + ConvNet | N | [103] |
| Subtle spectral differences, antibiotic resistance | 82% (isolate), 97% (treatment), 89% (MRSA/MSSA) | Successful MRSA/MSSA distinction | N | [18] |
| Challenge Addressed | Sample Type | Key Insight | Algorithm Category | SERS Substrate | Input (No. of Spectra) | Ref. |
|---|---|---|---|---|---|---|
| Differentiating closely related pathogens | Pure bacterial cultures | SERS + CNN for Shigella/E. coli differentiation | CNN | AgNPs | 1600 | [87] |
| Clinical application, complex samples | Clinical isolates | SERS + CNN for clinical pathogens | CNN | AgNPs | 17,149 | [96] |
| Limited spectral variation between serovars | Pure bacterial cultures | SERS + multiscale CNN for Salmonella serovars | CNN | AuNPs | 1854 | [62] |
| Analysis of mixed bacterial samples | Mixed bacterial cultures | SERS + ANN for mixed bacteria analysis | Traditional ML | Au@Ag@SiO2 | N/A | [84] |
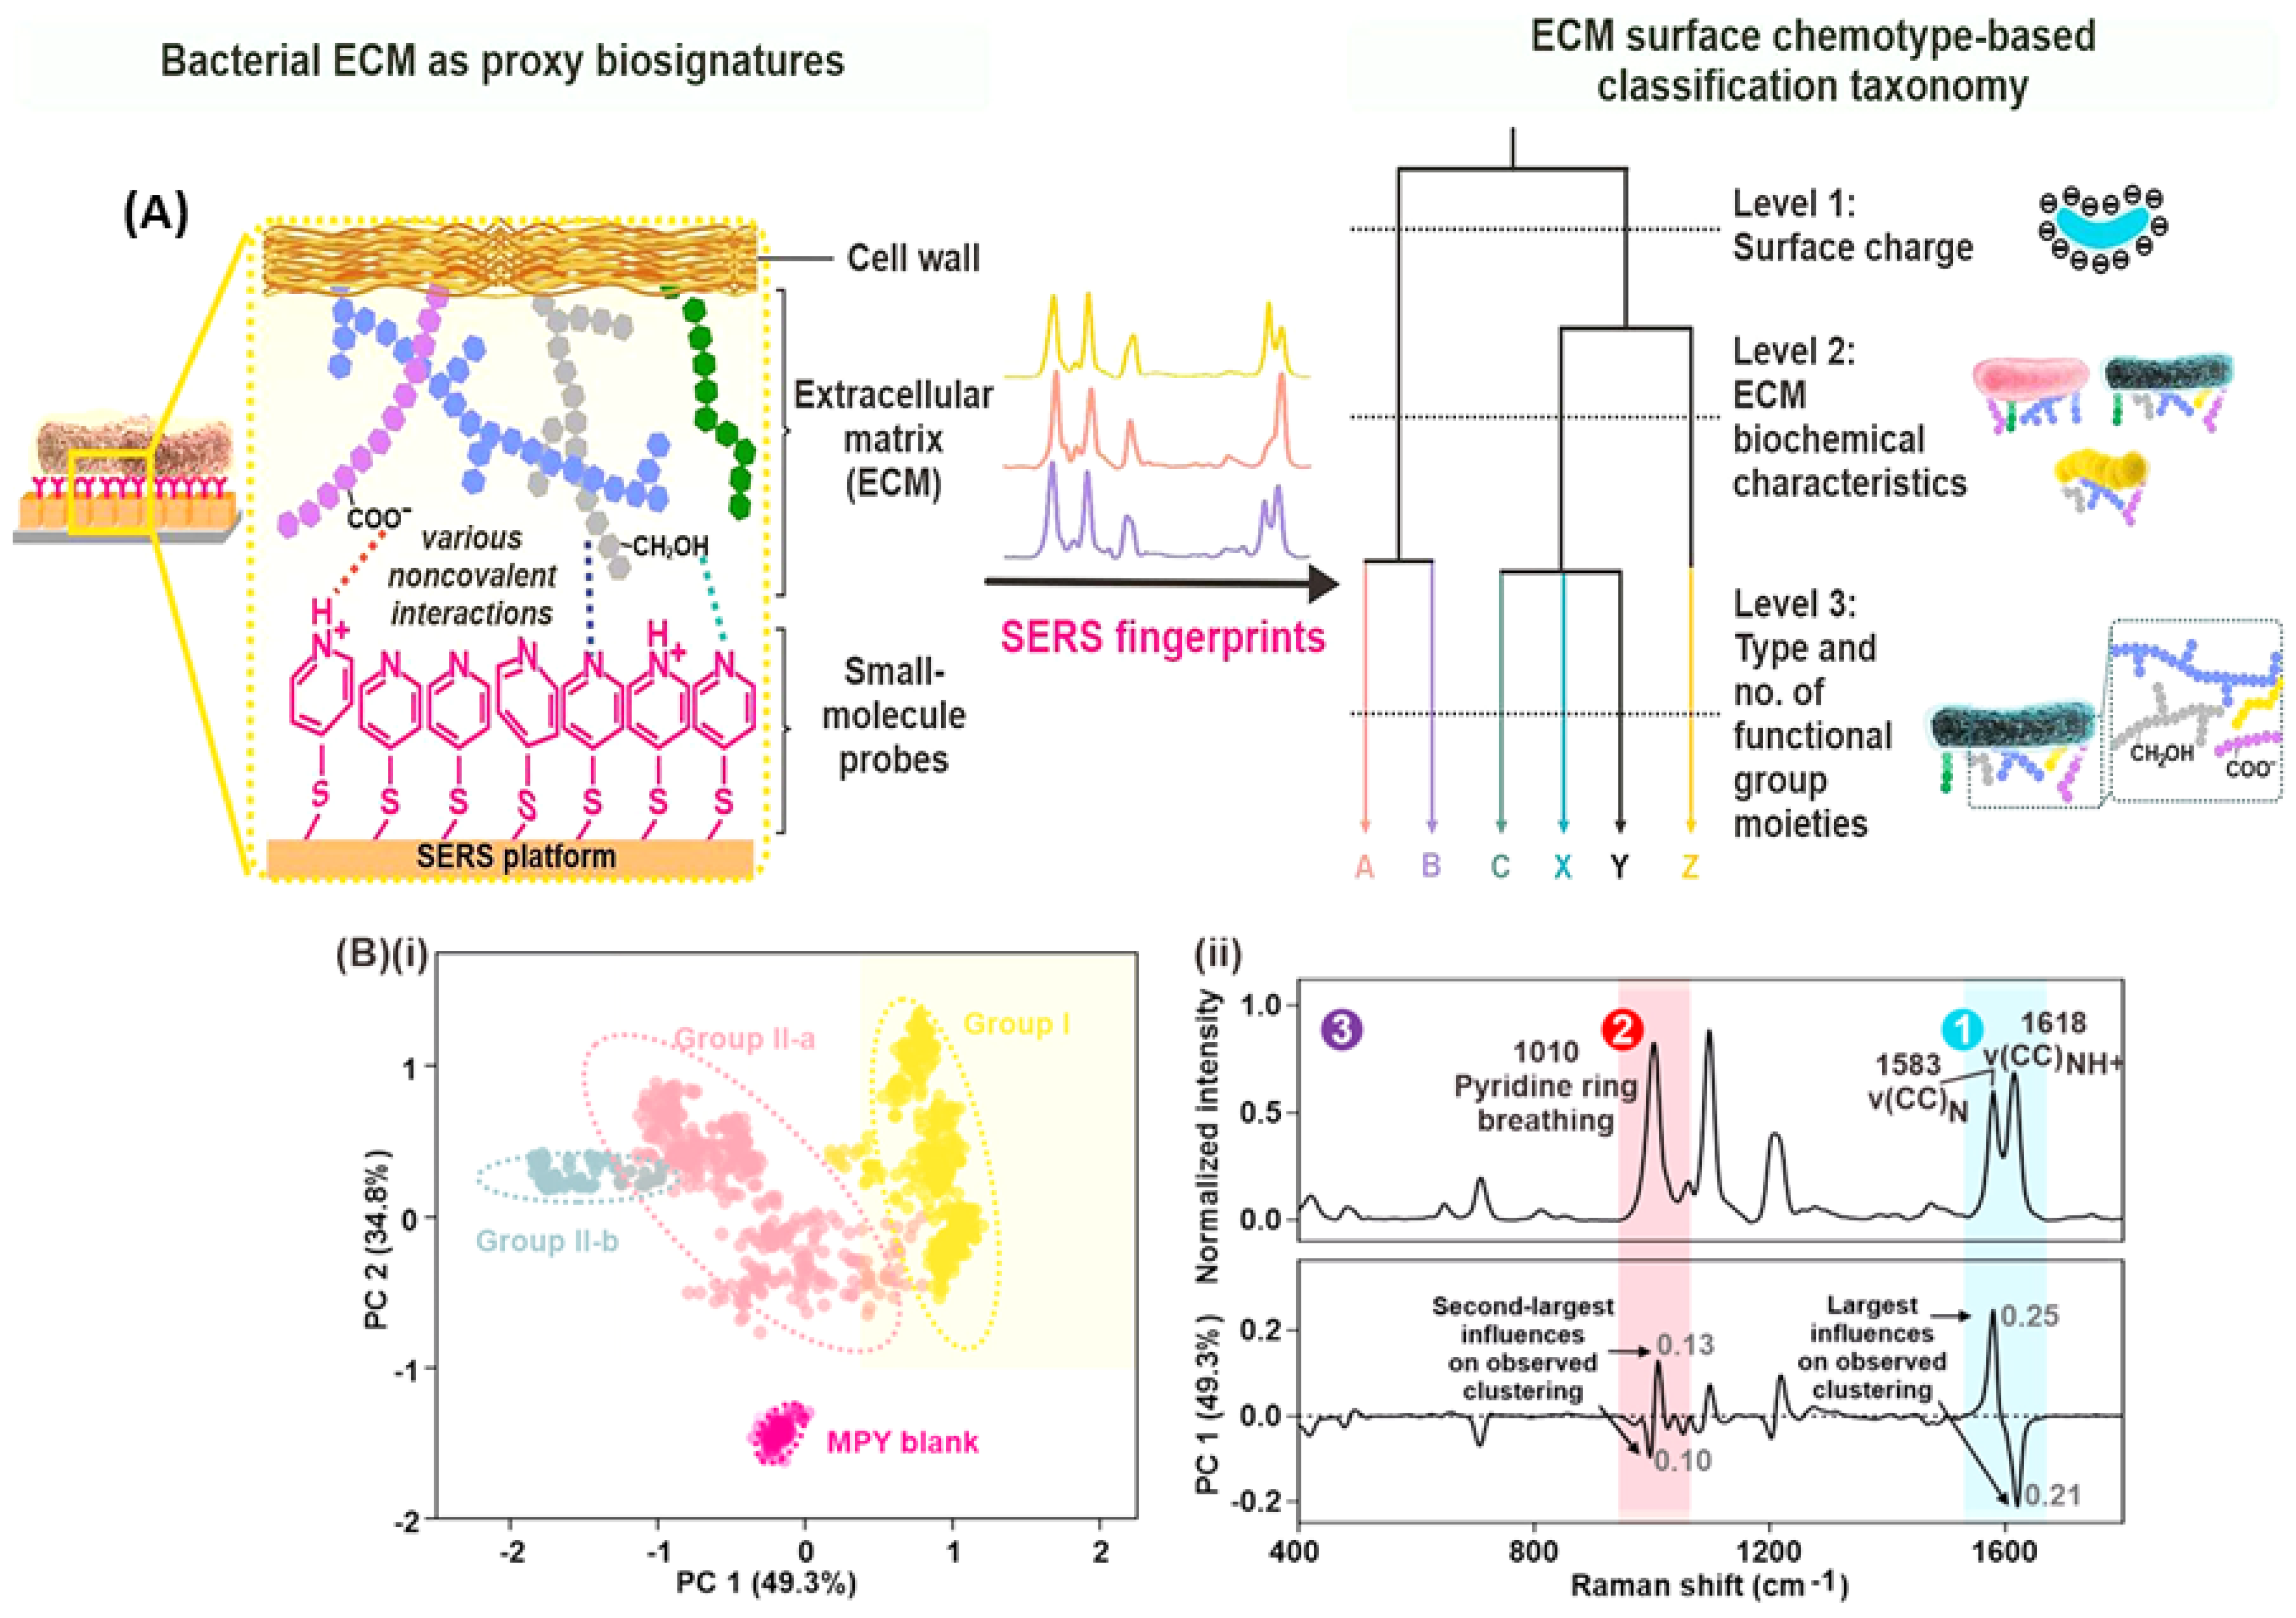
| Point-of-need ID, alternative taxonomy, complex ECMs | Bacterial cultures | SERS-based chemotaxonomy | Traditional ML | Ag Nanocubes | 100/species | [60] |
| Algorithm selection, real-world complexity | Clinical isolates | Algorithms classify Staphylococcus via SERS | Traditional ML | AgNPs | 2752 | [90] |
| Visual analysis limitations, rapid diagnostics | Bacterial isolates | SERS + ML reveals MRSA/MSSA biomarkers | Traditional ML | AgNPs | 230 | [114] |
| Food safety, early detection, quantitative analysis | Milk, beef | SERS-LFA + XGBR for E. coli detection | Traditional ML | AuDTNB@Ag | 2700 | [52] |
| Clinical sample complexity, antibiotic resistance, limited data | Bacteria from blood cultures | ViT for SERS, clinical focus | ODL | AgNPs | 11,774 | [59] |
| Spectral consistency, clinical complexity | Clinical isolates | SERS + ML for pathogen classification | ODL | AgNO3 | ≈6950 | [115] |
| Subtle differences, need for rapid methods | Clinical isolates | SAE-DNN for MRSA/MSSA in SERS | ODL | AgNPs | ≈1699/ isolate | [108] |
| ODL Technique | Challenge Solved | Key Insight | Clinical Potential? | Ref. |
|---|---|---|---|---|
| Vision transformer (ViT) | Accurately identifies bacteria and antibiotic resistance in complex blood cultures | ViT-based SERS accurately determines antibiotic resistance and classifies clinical pathogens | Y | [59] |
| CNN, recurrent neural network (RNN) variants | Variability and noise in clinical samples | SERS with deep learning enables robust classification of clinical bacterial isolates | Y | [115] |
| Attention neural network (aNN) | Analyzing complex biological samples (bacterial EVs) | Raman with aNN identifies EVs, discovers biomarkers, and reveals EV biogenesis insights | Y | [98] |
| Residual network (ResNet) | Limited datasets and complexity of clinical samples | ResNet deep learning accurately classifies ESKAPE pathogens in clinical samples | Y | [129] |
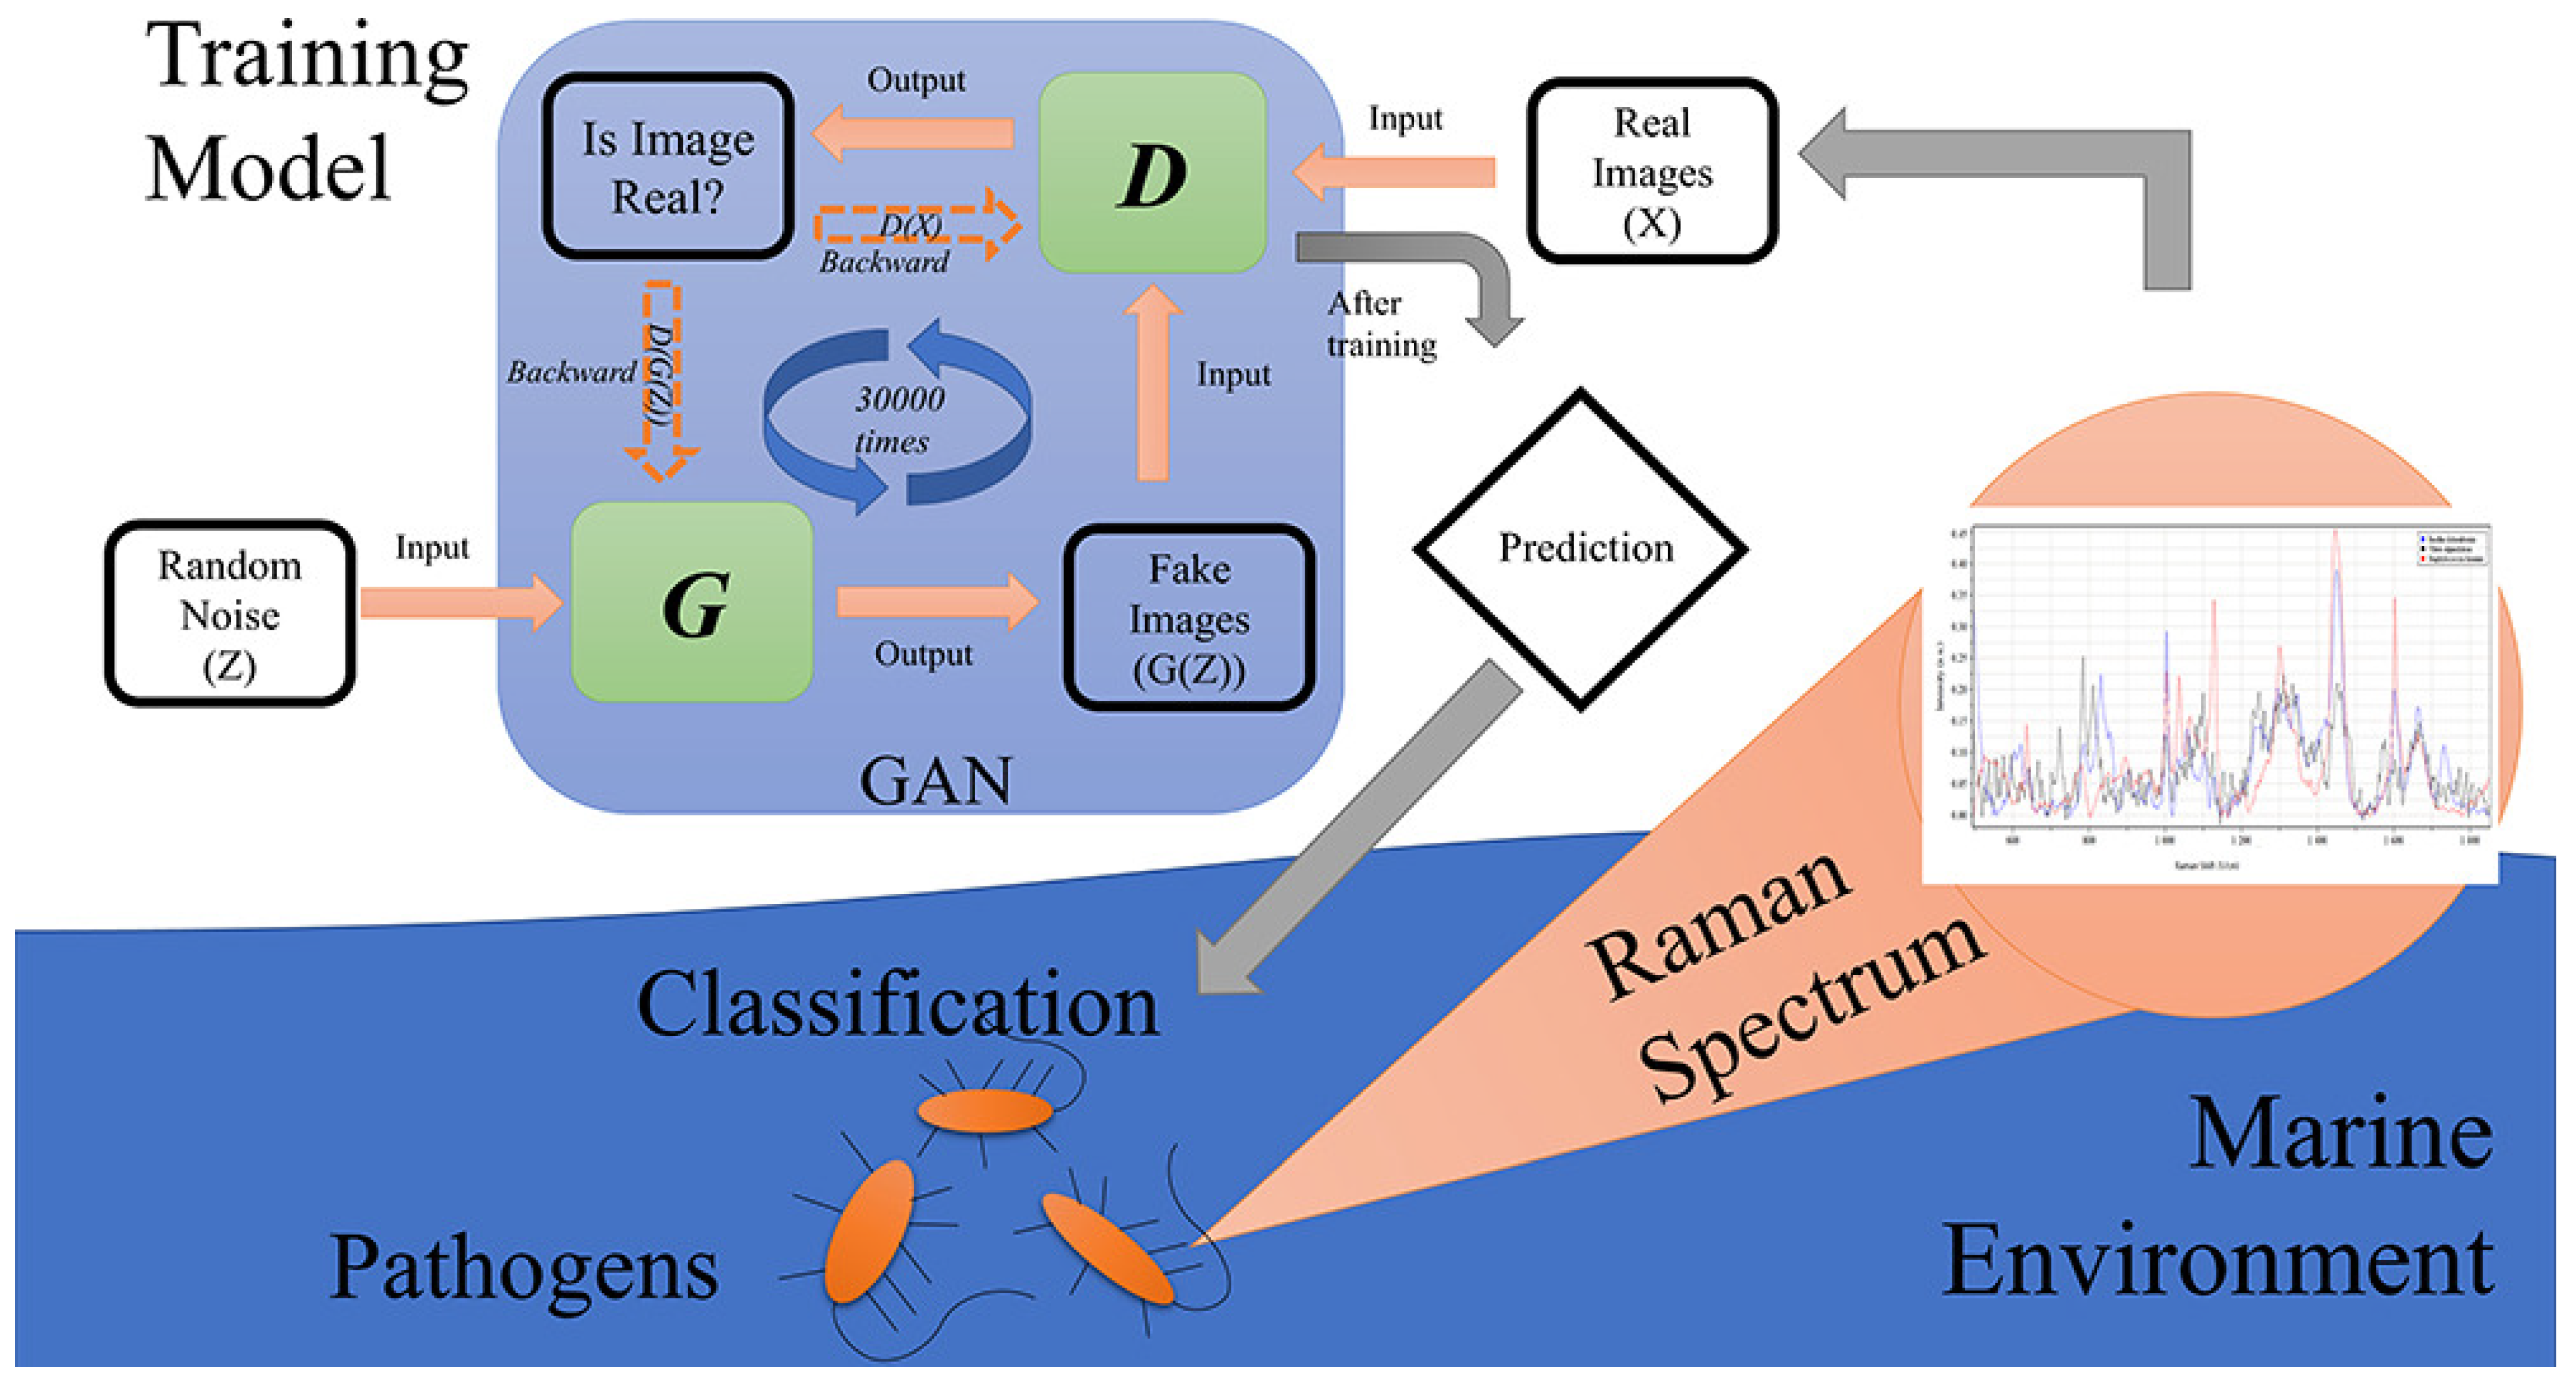
| Progressive growing GAN (PGGAN) + ResNet | Limited and noisy spectral data (marine environment) | Raman, PGGANs, and ResNet accurately classify marine pathogens, overcoming data limitations | Promising | [122] |
| Spectral transformer (ST) | Computational efficiency, handling sample variability, antibiotic resistance detection | Spectral transformers offer comparable accuracy with faster training and superior handling of sample variation for antibiotic resistance studies | Y | [130] |
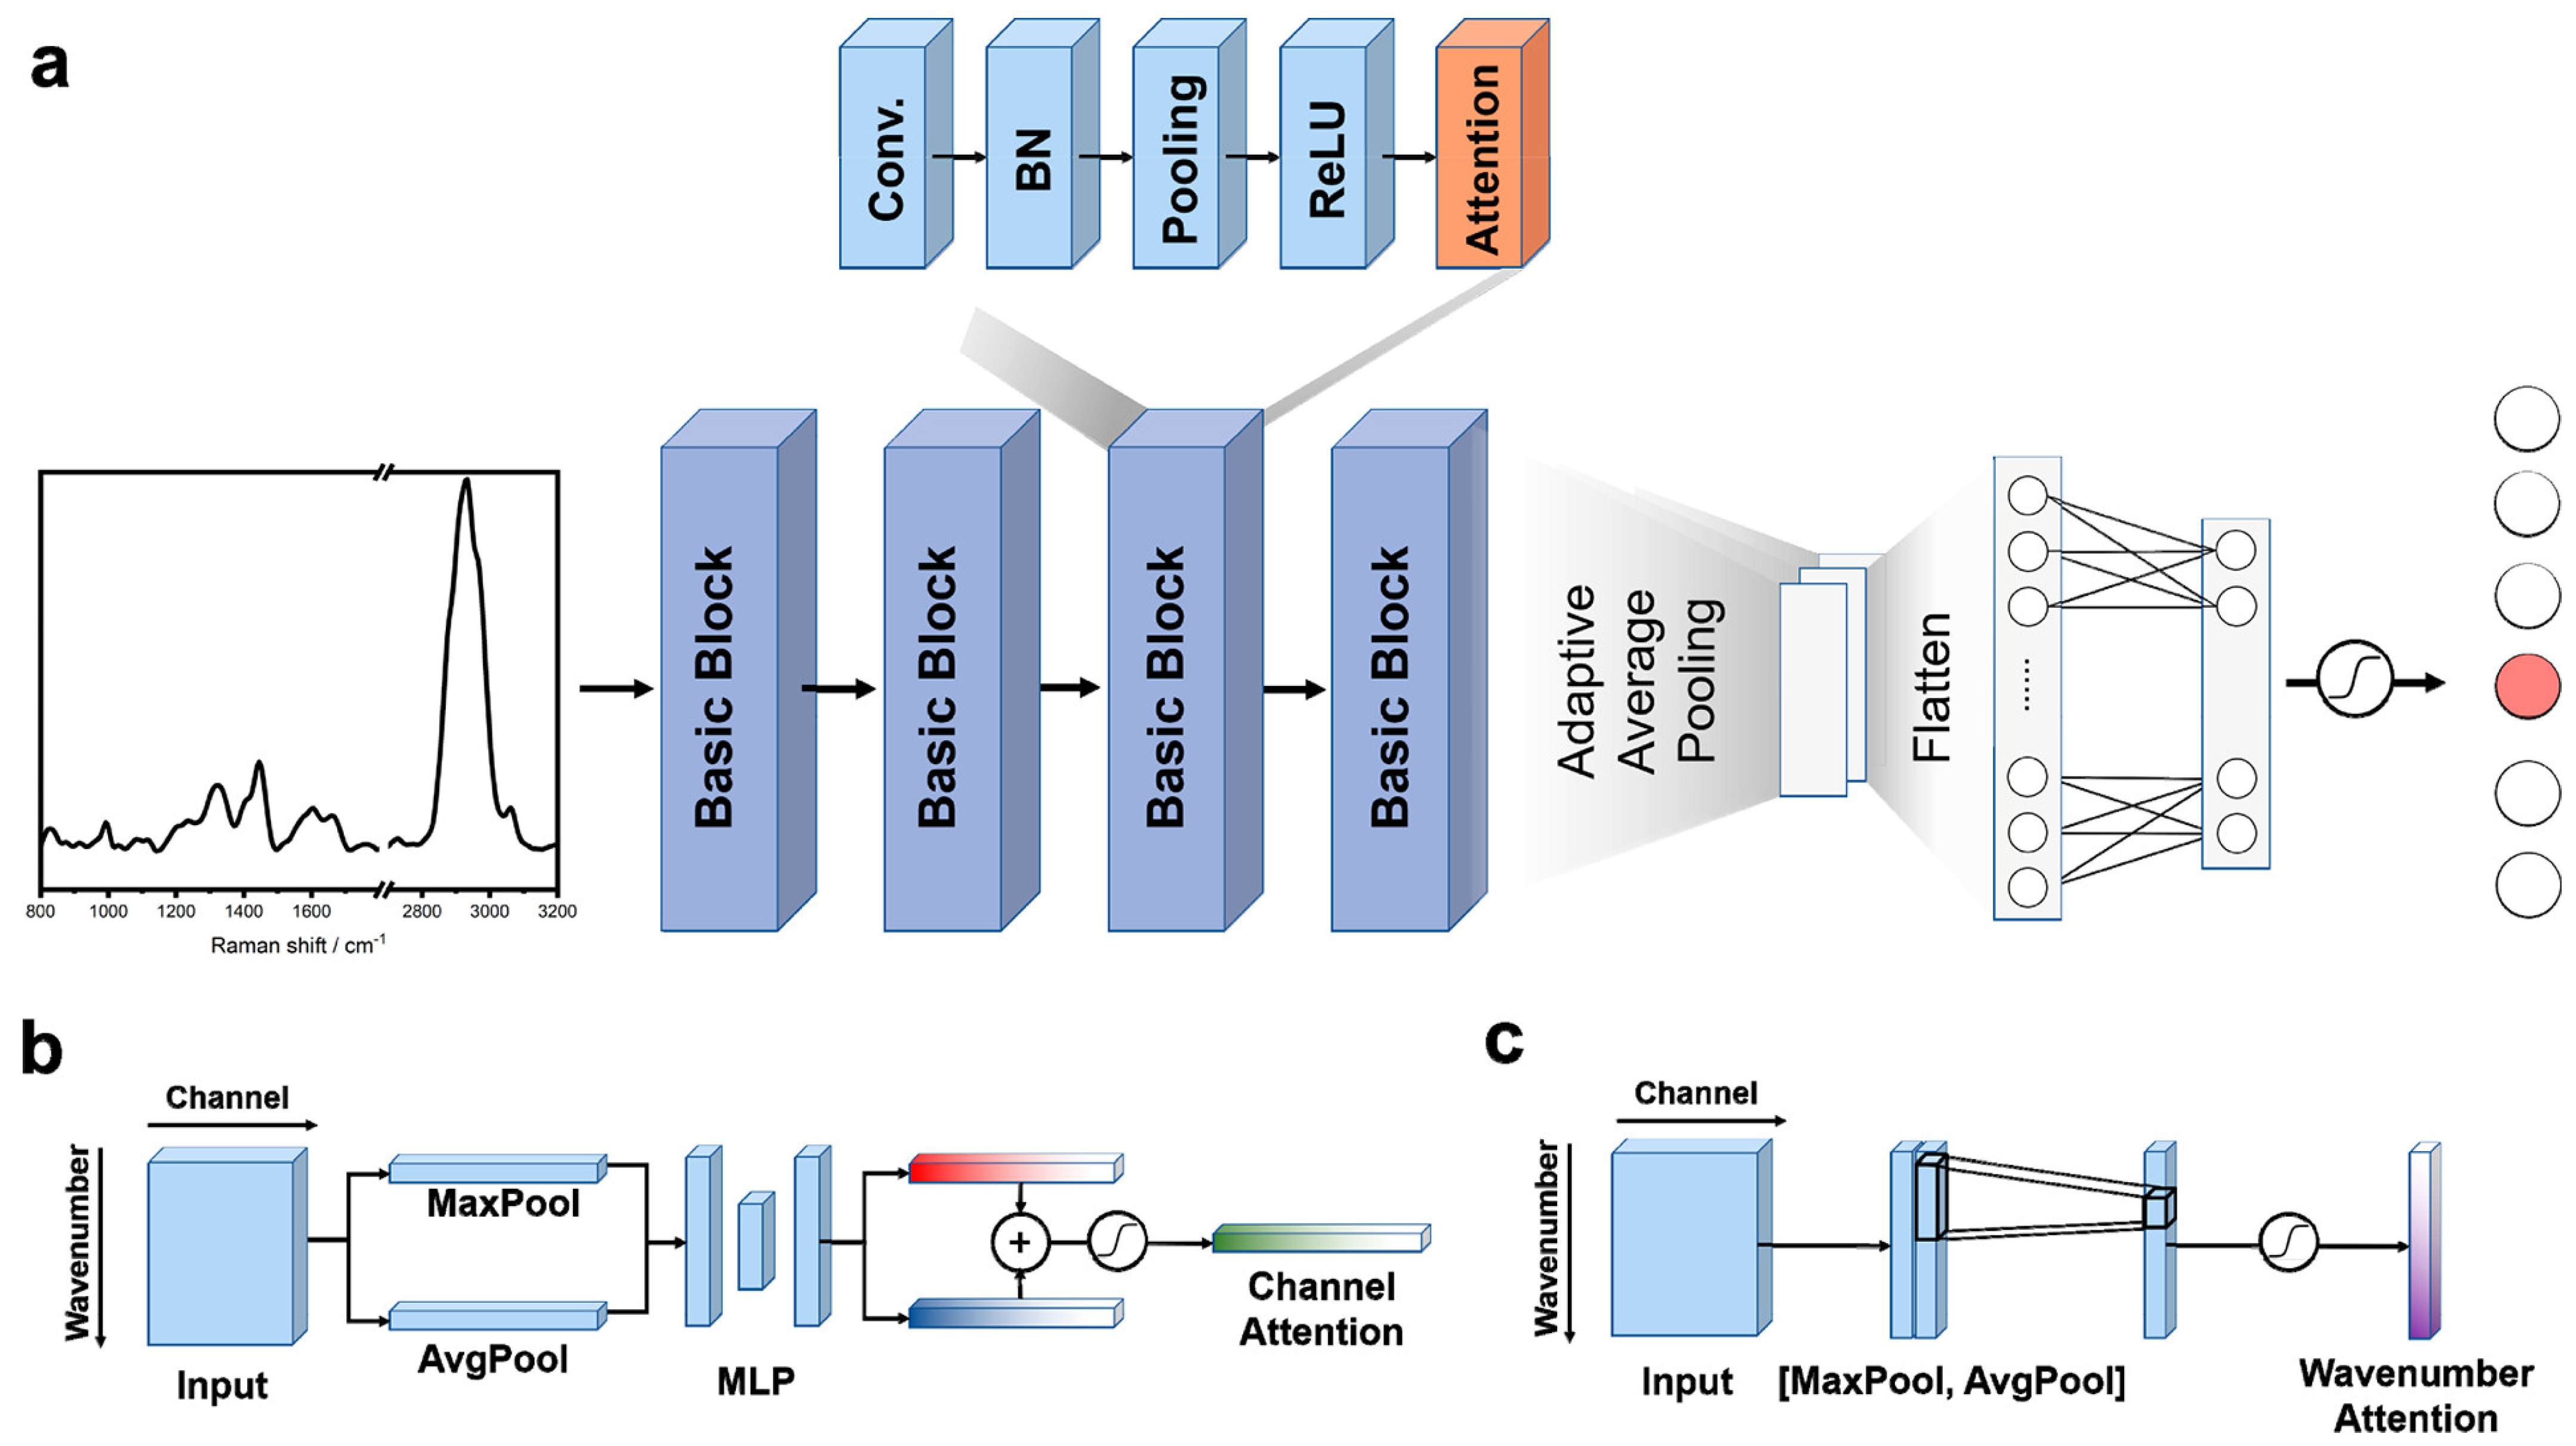
| U-Net | Information loss during deep learning training, classification of antibiotic resistance | U-Net improves Raman-based antibiotic resistance classification by reducing information loss | Y | [131] |
| Stacked autoencoder–deep neural network (SAE-DNN) | Detecting subtle spectral differences for antibiotic resistance determination | SERS with SAE-DNNs accurately distinguishes antibiotic resistance profiles (MRSA vs. MSSA) | Y | [108] |
| Multilayer perceptron (MLP) | Early disease detection (presymptomatic) in plants | Raman spectroscopy with MLP enables early plant disease detection prior to visible symptoms | Promising | [126] |
| Long short-term memory (LSTM) | Accurate bacteria classification at the strain level, analysis of complex spectral data | LSTM deep learning differentiates bacterial strains and extracts subtle spectral information | Promising | [132] |
| Generative adversarial network (GAN) | Limited and/or noisy spectral data | Raman with GANs and deep learning accurately classifies pathogens despite spectral challenges | Promising | [88] |
Disclaimer/Publisher’s Note: The statements, opinions and data contained in all publications are solely those of the individual author(s) and contributor(s) and not of MDPI and/or the editor(s). MDPI and/or the editor(s) disclaim responsibility for any injury to people or property resulting from any ideas, methods, instructions or products referred to in the content. |
© 2024 by the authors. Licensee MDPI, Basel, Switzerland. This article is an open access article distributed under the terms and conditions of the Creative Commons Attribution (CC BY) license (https://creativecommons.org/licenses/by/4.0/).
Share and Cite
Rahman, M.H.-U.; Sikder, R.; Tripathi, M.; Zahan, M.; Ye, T.; Gnimpieba Z., E.; Jasthi, B.K.; Dalton, A.B.; Gadhamshetty, V. Machine Learning-Assisted Raman Spectroscopy and SERS for Bacterial Pathogen Detection: Clinical, Food Safety, and Environmental Applications. Chemosensors 2024, 12, 140. https://doi.org/10.3390/chemosensors12070140
Rahman MH-U, Sikder R, Tripathi M, Zahan M, Ye T, Gnimpieba Z. E, Jasthi BK, Dalton AB, Gadhamshetty V. Machine Learning-Assisted Raman Spectroscopy and SERS for Bacterial Pathogen Detection: Clinical, Food Safety, and Environmental Applications. Chemosensors. 2024; 12(7):140. https://doi.org/10.3390/chemosensors12070140
Chicago/Turabian StyleRahman, Md Hasan-Ur, Rabbi Sikder, Manoj Tripathi, Mahzuzah Zahan, Tao Ye, Etienne Gnimpieba Z., Bharat K. Jasthi, Alan B. Dalton, and Venkataramana Gadhamshetty. 2024. "Machine Learning-Assisted Raman Spectroscopy and SERS for Bacterial Pathogen Detection: Clinical, Food Safety, and Environmental Applications" Chemosensors 12, no. 7: 140. https://doi.org/10.3390/chemosensors12070140