Article

Plasmonic Optical Fiber Sensors and Molecularly Imprinted Polymers for Glyphosate Detection at an Ultra-Wide Range

by
Luca Pasquale Renzullo
1,
Ines Tavoletta
1,
Giancarla Alberti
2,
Luigi Zeni
1,
Maria Pesavento
2 and
Nunzio Cennamo
1,*
1
Department of Engineering, University of Campania Luigi Vanvitelli, Via Roma 29, 81031 Aversa, Italy
2
Department of Chemistry, University of Pavia, Via Taramelli 12, 27100 Pavia, Italy
*
Author to whom correspondence should be addressed.
Chemosensors 2024, 12(7), 142; https://doi.org/10.3390/chemosensors12070142
Submission received: 24 May 2024 / Revised: 10 July 2024 / Accepted: 15 July 2024 / Published: 17 July 2024

Abstract

:
In this study, a surface plasmon resonance (SPR) sensor based on modified plastic optical fibers (POFs) was combined with a specific molecularly imprinted polymer (MIP), used as a synthetic receptor, for glyphosate (GLY) determination in aqueous solutions. Since GLY is a non-selective herbicide associated with severe environmental and health problems, detecting glyphosate in environmental and biological samples remains challenging. The selective interaction between the MIP layer and GLY is monitored by exploiting the SPR phenomenon at the POF’s gold surface. Experimental results show that in about ten minutes and by dropping microliter volume samples, the presented optical–chemical sensor can quantify up to three orders of magnitude of GLY concentrations, from nanomolar to micromolar, due to a thin MIP layer over the SPR surface. The developed optical–chemical sensor presents a detection limit of about 1 nM and can be used for onsite GLY measurements. Moreover, the experimental analysis demonstrated the high selectivity of the proposed POF-based chemical sensor.

1. Introduction

Glyphosate [GLY] is the most widely sold non-selective, broad-spectrum herbicide on the market today for crop protection. Agricultural plants commonly treated with GLY include cotton, soybeans, nuts, rice, maize, grapevine, and cereals [1,2,3]. GLY application to plants intended for human and animal consumption may contain GLY residues in the food chain [2]. In particular, GLY can be found in beverages and foods of plant origin [4], in meat and fish [5], honey [6], wine, beer [7], and even in tea, which is the most consumed drink in the world after water [8,9].
Chemically, GLY is an amino phosphonic analog of the amino acid glycine. Its zwitterionic form is present in commercial herbicide formulations with adjuvants and surfactants that enhance its activity. The covalent bond between carbon and phosphorus atoms, characteristic of organophosphates, provides GLY with chemical and physical properties. These properties include the tendency to interact with metals and soil organic matter, thus persisting in the environment [10]. Its main environmental degradation product, aminomethylphosphonic acid (AMPA), is even more water-soluble than GLY, increasing its chances of being found in both groundwater and surface water [11].
GLY acts by being absorbed from the green parts of plants and translocated both to the vegetative apexes and to the roots. There, it blocks the activity of 5-enolpyruvylshikimate-3-phosphate (EPSP) synthase, an enzyme essential for plant respiration. It is also present in certain micro-organisms and involved in the production of three aromatic amino acids crucial for protein synthesis [12].
Additionally, GLY is considered a risk factor for humans and the environment. Chronic exposure to this compound is associated with many diseases, including heart disease, multiple sclerosis, and depression [13]. Commercial formulations of GLY have been imputed for necrosis in three different types of human cell cultures [14]. In vitro and in vivo studies have also shown the carcinogenicity and genotoxicity of GLY on human and animal cells [15,16,17,18], but there is heated debate over the published results.
For these reasons, GLY is subject to various restrictions, if not outright bans [19]. The European Commission (EU) established the maximum residue limit (MRL) of GLY for potable water below the 0.1 μg/L limit [20].
Peculiar characteristics of GLY, such as its lack of chromophore or fluorophore groups, the absence of absorption in the ultraviolet region, its low ionization, low volatility, and high solubility in water, make it difficult to monitor in real matrices. One speaks of the ‘glyphosate paradox’ since despite being the most widely used herbicide worldwide, it is also one of the most difficult to detect [21].
Traditional analytical techniques to determine GLY include predominantly chromatographic methods [21,22]. These instrumental procedures are highly sensitive and require time-consuming sample preparation procedures, specialized personnel, and expensive equipment [21]. Furthermore, these methods do not provide real-time results and are confined to the laboratory bench. Colorimetric and spectrophotometric techniques used for GLY quantification in water and food samples show the same restrictions [23,24].
The development of simple, portable, reliable, and low-cost instruments for GLY detection is an urgent challenge. To this end, the development of plastic optical fiber (POF)-based sensors, especially those that exploit the surface plasmon resonance (SPR) phenomenon as a sensing principle, ensures fast detection of different analytes with high sensitivity [25]. The plasmonic surface of this kind of sensor can be covered with recognition elements, such as a bioreceptor or a synthetic recognition element (i.e., a molecularly imprinted polymer (MIP)) [25,26,27,28]. MIPs offer significant advantages over bioreceptors since they require easier, quicker, and cheaper preparation, and their chemical and physical characteristics ensure higher stability [29]. Due to their low solubility in porogenic solvents and low number of suitable functional monomers, there are currently few studies where GLY is used as a template for MIP-based sensor preparation, such as in [30,31]. Only one work reports the production of an SPR sensor for GLY detection as realized by the deposition of a molecularly imprinted electropolymerized polypyrrole (eMIP) film on a gold chip/electrode [32].
Alberti et al. [33] recently proposed an unconventional SPR sensor system based on two POF-based chips connected in series for ultra-low GLY detection (in the pM–nM range). The peculiarity of the GLY sensor system in [33] is its innovative detection method, which uses the MIP to fill three micro-holes drilled on a D-shaped POF. The chemical chip directs light toward the SPR–POF probe with the plasmonic surface in contact with a fixed refractive index (water). When MIP–GLY binding occurs, the refractive index variation in the POF core changes the propagated light and, thus, the SPR resonance conditions [33].
This work proposes an optical–chemical sensor based on a conventional SPR method, where the MIP layer is in contact with the SPR surface [25].
The pre-polymeric mixture of the MIP used in this study was the same as that in [33]. However, in this study, a thin MIP layer was built directly on the SPR-POF sensitive surface with the idea of making the MIP’s high-affinity binding sites accessible. Detection of this kind of site is possible due to the high sensitivity of the optical device and the proximity of the site to the plasmonic surface [34]. Therefore, the fabrication process to obtain the optical–chemical sensor and experimental results in terms of binding and selectivity tests are reported. Three herbicides, 4-chloro-2-methylphenoxyacetic acid, bentazon, and atrazine, were used as interfering molecules for selectivity measurements. The not-imprinted polymer (NIP) layer was tested instead of the MIP to demonstrate the sensor system’s selective optical response. Finally, a comparative analysis of other GLY sensors is reported.

2. Materials and Methods

2.1. Chemicals

N-(Phosphonomethyl)glycine (Glyphosate, GLY, Pestanal® analytical standard), 4-Chloro-2-methylphenoxyacetic acid, 4-Chloro-o-tolyloxyacetic acid (MCPA, Pestanal® analytical standard), 2-Chloro-4-ethylamino-6-isopropylamino-1,3,5-triazine (Atrazine, ATZ, Pestanal® analytical standard), 3-isopropyl-1H-2,1,3-benzothiadiazin-4(3H)-one 2,2-dioxide (Bentazon, BTZ, Pestanal® analytical standard), acrylamide (AAm, purity degree ≥99%) Ethylene Glycol Dimethylacylate (EGDMA, purity degree 98%,), 2,2′-azobisisobutyronitrile (AIBN, radical initiator), ethanol, chloroform (CHCl3), dimethyl sulfoxide (DMSO), and acetic acid, all from Merck Life Science S.r.l. (Milan, Italy) were used as received, except for EGDMA, which had to be purified by filtration on an aluminum oxide cartridge to remove stabilizers. The standard aqueous solutions of GLY were prepared by diluting the commercial analytical standard in MilliQ water.
Tap water from the lab sink (Department of Engineering, University of Campania—Luigi Vanvitelli) was fortified with GLY and other pesticides to simulate agricultural wastewater samples.

2.2. MIP and NIP Preparation

The preparation of the MIP’s pre-polymeric solution was adapted from a previous report [35], which aimed to reduce the amount of solvent by increasing the number of recognition cavities. The molar ratio GLY (template): AAm (functional monomer): EGDMA (cross-linker) = 1:60:90 was selected; accordingly, GLY (0.06 mmol), AAm (3.6 mmol), and EGDMA (5.4 mmol) were dissolved in 3 mL of CHCl3/DMSO = 1:1. The solution was kept in an ultrasound bath for 20 min and then under a small flow of N2 for another 10 min. Finally, 50 mg of the radical initiator AIBN was added before thermal polymerization. The NIP’s pre-polymeric solution was prepared using the same procedure but without GLY.

2.3. Measuring Protocol

The measurement protocol used for the SPR–POF–MIP sensor included, after adding the sample (60 μL) at increasing GLY concentrations, an incubation step of 10 min at room temperature. In this way, the interaction between the target analyte (GLY) and the MIP’s cavities occurs. A subsequent washing step with water was performed, and the SPR spectra were recorded when water (blank) was present in the bulk. The washing step removed non-specific binding to the MIP layer and obtained the spectra from the same bulk solution (water). The SPR spectra are obtained by normalizing the transmitted spectra acquired in water to the spectrum acquired in air, which is the reference spectrum since the SPR condition is not satisfied in air [25].

3. POF-Based GLY Sensor Chips

3.1. SPR–POF Probe Covered by MIP Layer

The SPR–POF platform was based on a previous protocol [36]. A 1 mm plastic optical fiber (PMMA, with a 980 µm thick core and a 20 µm thick fluorinated polymer coating) was fixed in a trench realized into a 1 cm long resin block. The trench dimensions were 1 mm in width, 1 mm in depth, and 10 mm in length. The POF (1 mm in total diameter) was fixed into the trench of the resin block by glue (liquid cyanoacrylate, ‘Super Attak Loctite’). The D-shape POF was obtained by removing the coating and part of the POF core using a polishing step with two different kinds of polishing papers (grit 5 and 1 µm). Then, a layer of Microposit S1813 photoresist was spin-coated on the exposed core and a 60 nm thin gold film was sputtered onto it using a sputter coater machine (Safematic CCU-010, Zizers, Switzerland). The S1813 layer was thick, about 1 µm, and presented a refractive index larger than the core (PMMA) to improve the SPR phenomenon [36]. The polishing procedure and photoresist buffer layer deposition were optimized in [36].
The MIP layer was prepared according to a method previously proposed for the 2-furaldehyde sensor reported in [37]. The same specific MIP was used, demonstrating that a sufficiently thin MIP layer can be obtained by spinning at 1000 rpm.
Here, 40 μL of the pre-polymeric mixture was dropped onto the gold SPR surface and spun for 2 min at 4000 rpm to prepare a MIP layer thinner than the one spun at 1000 rpm. Thermal polymerization was conducted overnight at 70 °C in a thermostatic oven. Polymerization time plays an important role in determining MIP’s morphology and performance. Increased polymerization time increases the rigidity of the polymer structure and facilitates the formation of recognition cavities with better-defined shapes.
GLY was removed from the MIP cavities and unreacted reagents were obtained by washing with ethanol and then ultra-pure water. In accordance with previous studies, ethanol was selected to remove the template (which can also be removed with water) and the unreacted monomers, according to previous works [27,33].
Figure 1 shows the SPR–POF–MIP sensor before (Figure 1a) and after (Figure 1b) the MIP deposition layer. Figure 1c depicts a cross-section of the sensor outline, including both the D-shaped POF-sensitive region and the MIP layer, which interacts with the analyte.
The same procedure was applied to obtain the SPR–POF–NIP sensor.

3.2. Experimental Setup

The experimental setup is shown in Figure 2, where the equipment and the GLY sensor are illustrated. More specifically, the developed optical–chemical sensor system consists of a halogen lamp (model HL-2000-LL, manufactured by Ocean Insight, Orlando, FL, USA, wavelength emission range from 360 nm to 1700 nm) that illuminates the SPR–POF–MIP sensor, previously described. The SPR–POF–MIP sensor output is connected to a spectrum analyzer (FLAME-S-VIS-NIR-ES, Ocean Insight), with a detection range from 350 nm to 1000 nm. SMA connectors are used to connect system components (the sensor with the light source and the sensor with the spectrometer). The spectrum analyzer resolution is 1.5 nm and calculated at full width and half maximum (FWHM), according to its datasheet. The data are acquired by proprietary software (SpectraSuite 6.2, Ocean Optics) by setting an integration time equal to 1 ms and several means equal to 150, and then processed by MATLAB R2022b software. More specifically, the SPR spectra were obtained via MATLAB by normalizing the spectra acquired when water (blank) was present as a bulk (after incubation and washing steps) with the reference spectrum from the air. The normalization process results in a dip at a specific wavelength, i.e., the resonance wavelength. To obtain the dose-response curve, all SPR spectra were smoothed through the “smooth” MATLAB function (smooth factor equal to 120). Then, a standard MATLAB function was used to determine the minimum of the windowed function and the resonance wavelength at a specific GLY concentration.

4. Results and Discussion

4.1. MIP Layer Characterization

To characterize the MIP layer, the thickness of the polymeric film, which plays a key role in sensor performance, was measured. Moreover, scanning electron microscope (SEM) analyses were performed on the MIP and NIP polymers prepared in bulk to characterize the MIP receptor from a morphological point of view.
As shown in Figure 1, the MIP layer is not homogeneous; however, MIP islands similar to those previously reported in MIPs for different templates with a similar overall composition are present [37]. For simplicity, the term “thin layer” indicates layers with relatively low amounts of MIP deposited as islands with gold surfaces exposed directly to the overlying dielectric.
To quantify the deposited MIP layer thickness, tests are performed with a profilometer (model DektakXT, manufactured by Bruker (Billerica, MA, USA)). The data are acquired via proprietary software (Bruker Vision64). The experimental results showed that the MIP islands were very similar, with a measured thickness of about 250 nm, as reported in Supplementary Materials, Figure S1.
SEM analyses are used to study the structure and morphology of MIP and NIP polymers synthesized in bulk. Figure S2 (Supplementary Materials) shows images at different magnification degrees.
As shown in the SEM images, particularly those at high magnification degrees, a porous sponge-like morphology characterizes both polymers. These characteristics are more evident for the MIP due to recognition cavities that make it more porous and less flaky.

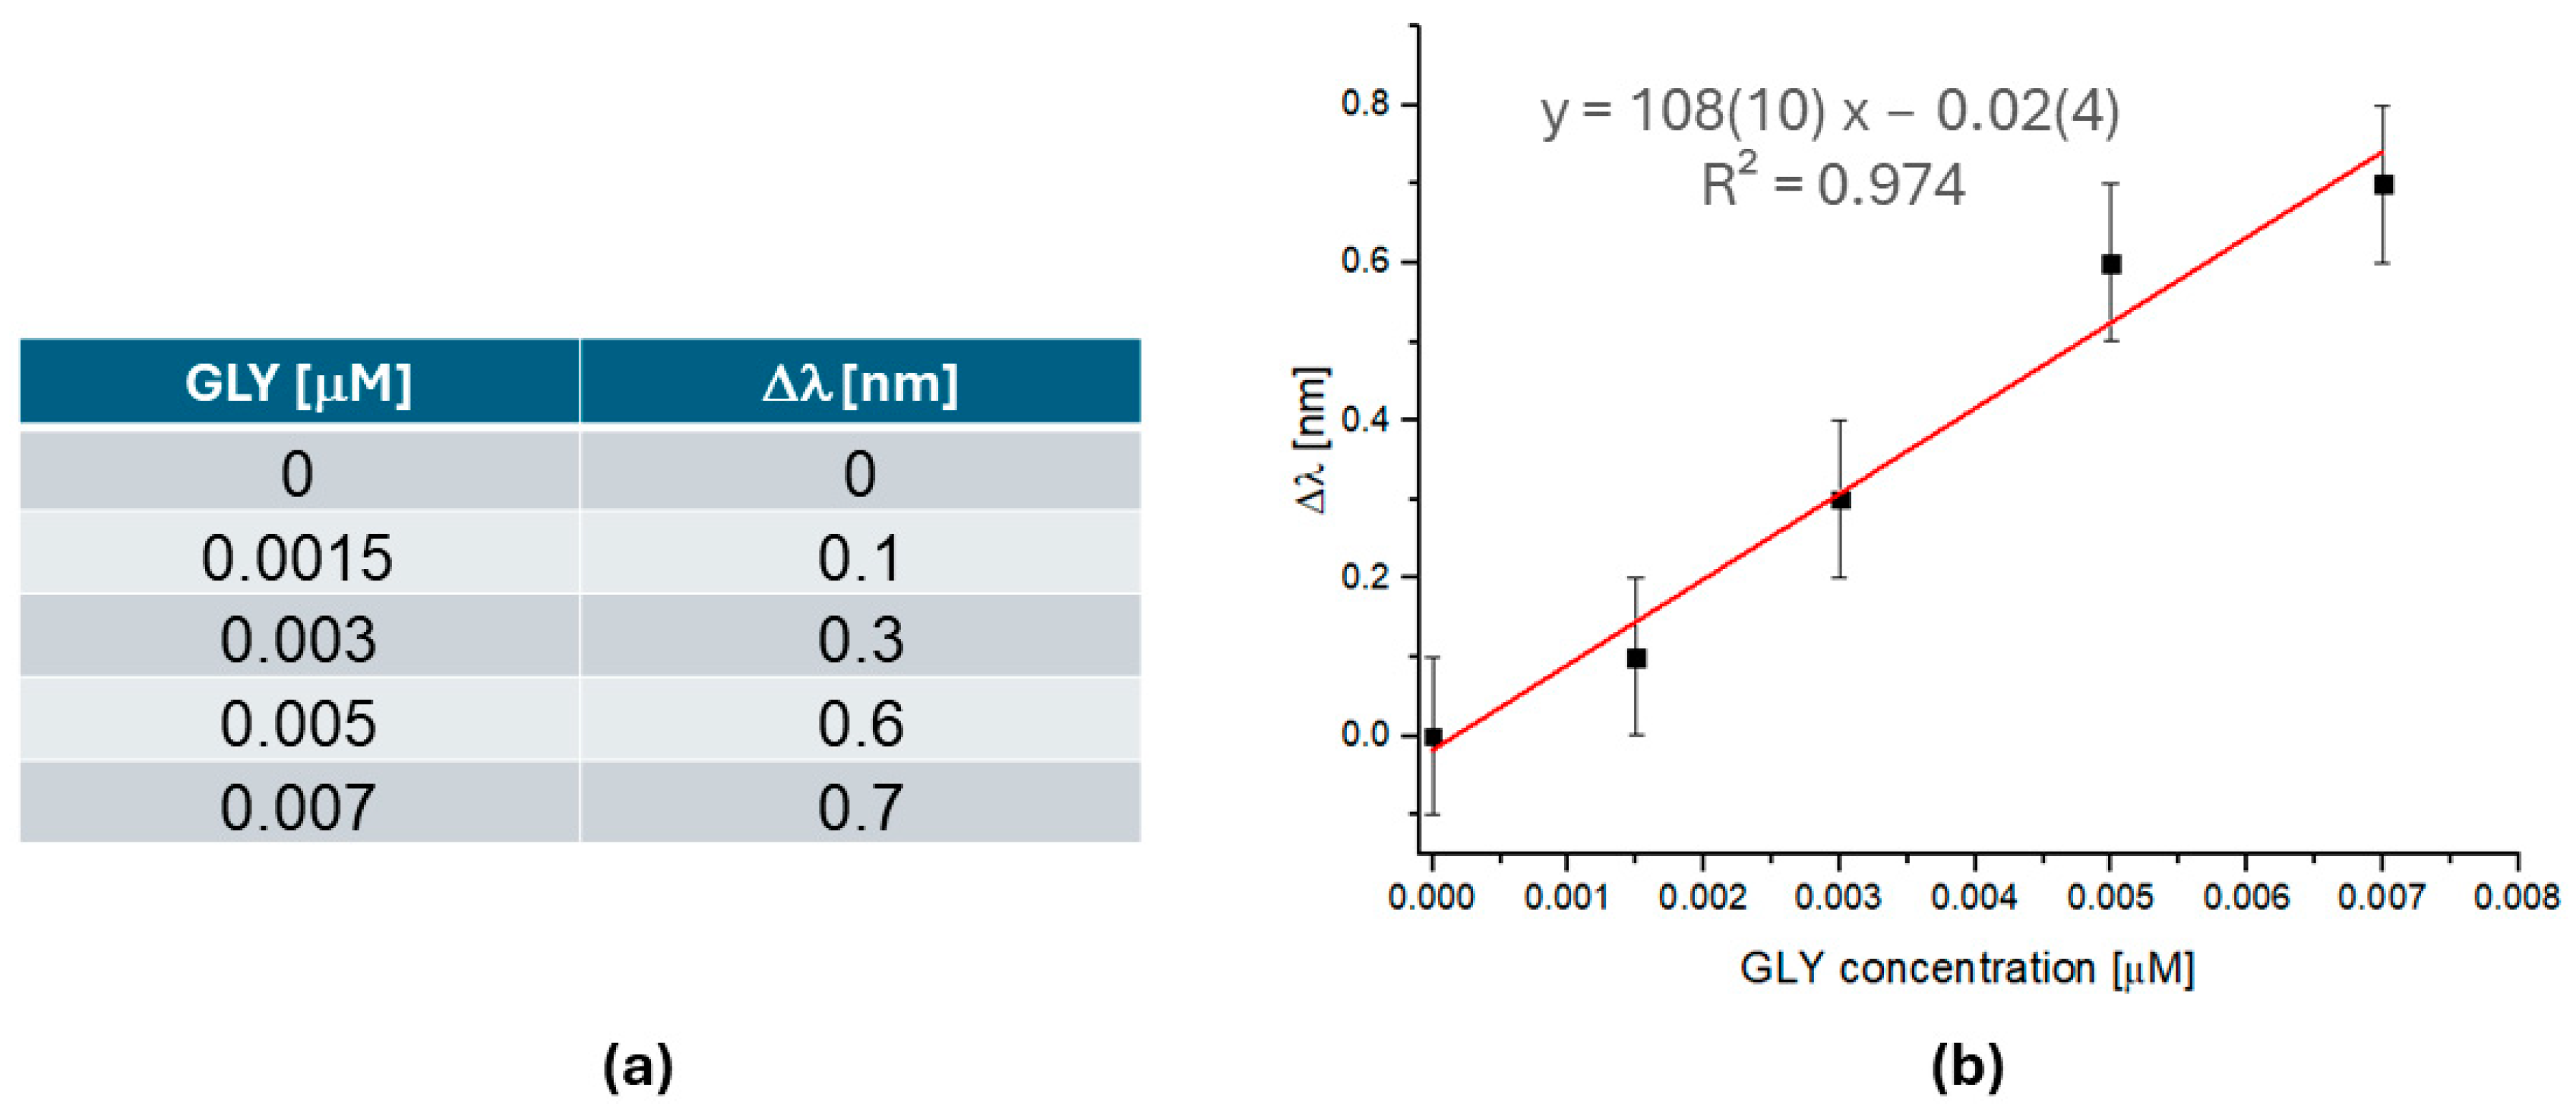
4.2. Experimental Results of the SPR–POF–MIP Sensor

As shown in Figure 3a, the SPR–POF chip presents an SPR wavelength value of the bare surface in water equal to about 600 nm. The resonance wavelength value is about 624 nm when water (blank) is dropped on the MIP layer. The resonance wavelength is slightly shifted toward the higher wavelengths compared to the bare configuration (without MIP), indicating that a thin layer of MIP was deposited on the gold.
Binding measurements of the proposed sensor are obtained by dropping on MIP-sensitive surface solutions at increasing GLY concentrations, ranging from 0.003 μM to 10 μM.
SPR spectra (Figure 3b) were obtained at different GLY concentrations in water, as previously described in Section 2.3 (Measuring Protocol) and in Section 3.2 (Experimental Setup). The sensor response to the GLY concentration consisted of a shift in resonance wavelength (∆λC) due to the interaction between the target analyte (GLY) and the MIP’s recognition sites.
As shown in Figure 3b, the resonance wavelength shifted toward higher values (red-shift) for increasing GLY concentrations. In other words, when GLY–MIP binding occurs, the MIP refractive index increases, and the SPR wavelength shifts to the right [38].
To demonstrate the capabilities of the proposed sensors in terms of ultra-wide detection range and low detection limit, two different analyses were carried out. A Bi-Langmuir model was used to study the ultra-wide detection range achieved with different MIP binding sites. A similar fitting equation was also used for a different MIP-based sensor in 2-FAL detection [39]. In particular, the resonance variation (ΔλC) with respect to the blank (water without GLY) vs. GLY concentration (c) is shown in Figure 4. This dose-response curve was modeled using a Bi-Langmuir equation (Equation (1)):
Δ λ c = Δ λ max 1 × c K 1 + c + Δ λ max 2 × c K 2 + c
As in [39], the developed GLY sensor presents an optical response (ΔλC) for two kinds of binding sites: a stronger binding site (site 1) and a weaker binding site (site 2).
In Equation (1), Δλc is the resonance wavelength variation at the concentration c of GLY; Δλmax i is the maximum value of the resonance wavelength variation Δλc achieved at the saturation of the sites “i” with the target analyte (1 or 2). Ki is the dissociation constant, the reciprocal of the affinity constant (Kaff i), of the target molecule for recognition sites “i” (1 or 2). In other words, Figure 4 shows the curve obtained by fitting the experimental data reported in Figure 3b to Equation (1). The error bar for each experimental value is the maximum measured standard deviation obtained by testing five similar sensors under the same conditions.
Table S1 (Supplementary Materials) reports the fitting parameters obtained using OriginPro 9 software (Origin Lab. Corp., Northampton, MA, USA), as shown in Figure 4.
A different analysis was carried out to estimate the sensor’s limit of detection (LOD) value and the linear range. More specifically, the LOD of the proposed GLY sensor was estimated via the sensor response at low concentrations and the linear fitting of these data, as shown in Figure 5. In this case, the sensitivity of this concentration range (b) can be approximated by the slope of the straight line, whereas the LOD can be computed by the following equation:
LOD = 3.3×sy/x/b
where sy/x is the standard deviation of y-residuals, which is not significantly different from the standard deviation of blank samples’ measurement replicates [40].
Therefore, from the data reported in Figure 5, the sensitivity values at low concentrations, LOD, and the limit of quantification (LOQ) can be obtained, as summarized in Table 1. The LOQ can be evaluated as the ratio between ten times the LOD value and 3.3. The dynamic range reported in Table 1, relative to concentrations exceeding the linear part of the standardization curve, can be described by the Bi-Langmuir equation (Equation (1)).

4.3. Selectivity Analysis

4.3.1. Test Based on SPR–POF–MIP Sensor

The proposed SPR–POF–MIP sensor was tested in tap water spiked with GLY and other pesticides (MCPA, bentazon, and atrazine) to simulate agricultural wastewater.
As shown in Figure 6, the three herbicides caused a slight resonance shift in the SPR wavelength even though they were ten times more concentrated than the GLY sample.
These results highlight the sensor’s selectivity as a huge variation in the resonance wavelength shift only occurred when GLY interacted with MIP recognition cavities.

4.3.2. Test Based on SPR–POF–NIP Sensor

To test the sensor system’s selectivity, an NIP layer was deposited on the SPR–POF platform instead of the MIP layer. The SPR–POF sensor modified with the NIP layer was tested with GLY concentrations from 0.001 μM to 0.2 μM. As shown in Figure 7, when the GLY concentration increases, the resonance wavelength shift does not occur, demonstrating that binding between MIP sites and GLY is responsible for the sensor system response.

4.4. Discussion

Table 2 summarizes the values of the affinity constant, LOD, and detection range to better compare the performances of the developed POF-based sensor to other methods/sensors of GLY determination [33,41,42,43,44,45,46,47].
The data reported in Table 2 show that the SPR–POF–MIP sensor exhibits a detection limit value one order of magnitude lower than the best-performing direct method among those that are not MIP-based [45]. Only one electrochemical sensor based on an indirect method [30] argued for exceptionally low sensitivity. However, since the authors did not provide details of the experimental conditions (when working with ultra-low concentration levels, ultra-clean laboratory and ultrapure reagents must be used; moreover, certified materials must be analyzed to prove the method’s reliability), a reliable comparison is difficult.
The colorimetric method [47] has comparable precision, but it does not have enough sensitivity for the quantitative detection of glyphosate at a trace level.
In addition, the proposed sensor can monitor GLY within a detection range of three orders of magnitude, achieved only by a fluorescence sensor (among reported sensors that do not use MIP). The latter, however, has other limitations, such as low sensitivity (conventional fluorescence methods still have higher sensitivity [42]) and application difficulties within a complex matrix [42].
The GLY sensor based on a POF with three micro-holes filled by MIP in series with an SPR-POF chip [33] had a better LOD for detecting GLY than the others. This result is due to MIP’s three-dimensional structure (3D-structure), which fills the three micro-holes of the sensor [33]. By contrast, several sites with higher affinity for GLY were formed in the receptor compared to the conventional SPR–POF–MIP platform in which the polymer layer develops horizontally (2D-structure). However, the proposed SPR–POF–MIP sensor presents a wider detection range than the three micro-holes sensor [33]. This aspect is due to the thin MIP layer over the SPR surface, which presents two specific binding sites (sites 1 and 2) with different affinity constants for GLY.
By comparing MIP-based sensors to biosensors, it is apparent that sensors functionalized with synthetic receptors, such as those based on acrylic materials, can be stored several times without degradation and denaturation problems at temperatures higher than 30–40 °C. Additionally, they resist solutions at a wider range of pH than biological receptors, which are typically prone to denaturation over time and need appropriate storage conditions (around 4 °C in phosphate buffer solution).
Regarding stability, the presented MIP-based sensor was tested by repeating the measurements ten times in the same external conditions, i.e., with the blank (solution without the analyte) over the MIP layer, denoting a maximum variation of the resonance wavelength equal to about 0.1 nm.
The repeatability is related to the efficiency of the regeneration process and removal of the analyte from the imprinted sites after the binding tests. This process was achieved with 96% v/v ethanol [27,33,48] and carried out in a similar way to template extraction. It proved fully effective in three/four different regeneration cycles and subsequent binding tests. More specifically, the effectiveness of the regeneration process was evaluated by analyzing the sensor response, which was defined as the resonance wavelength variation normalized to the maximal response obtained at first use [29].

5. Conclusions

The optical–chemical sensor presented in this study achieved an ultra-wide detection range for GLY quantification (linear range 0.0015–0.007 μM, dynamic range 0.0015–2 μM) using a simple and low-cost sensor system. This finding appears to be due to the ultra-thin layer of the synthetic receptor (MIP), which makes it possible to position the adsorbed molecules near the resonant surface in correspondence to the strong interaction sites in the MIP. Moreover, the developed sensor presents a detection limit of about 1 nM, lower than the maximum residue limit (MRL) of the herbicide established by the European Community (MRL = 0.1 μg/L) for drinking water [20].
The SPR–POF–MIP sensor proved to be a very selective tool for detecting GLY in aqueous solutions. It can be employed for on-site GLY analysis in environments with different contamination levels.

Supplementary Materials

The following supporting information can be downloaded at: https://www.mdpi.com/article/10.3390/chemosensors12070142/s1, Figure S1: Profilometer graph for MIP layer thickness determination; Figure S2: SEM images for MIP (a, c, and e) and NIP (b, d, and f) powder (bulk polymerization); Table S1: Bi-Langmuir fitting parameters relative to GLY determination in water via the proposed SPR–POF–MIP sensor. The number in parentheses is the standard deviation of the last digit.

Author Contributions

Conceptualization, N.C., L.P.R., I.T. and M.P.; methodology, G.A., M.P., N.C., L.Z. and I.T.; validation, L.P.R., N.C., I.T. and G.A.; formal analysis, L.P.R., I.T., G.A., M.P. and N.C.; investigation, L.P.R., I.T., G.A., M.P. and N.C.; resources, L.Z.; data curation, L.P.R., I.T., G.A., M.P. and N.C.; writing—original draft preparation, L.P.R., I.T., G.A., M.P., L.Z. and N.C.; writing—review and editing, L.P.R., I.T., G.A., M.P., L.Z. and N.C.; supervision, N.C. and L.Z. All authors have read and agreed to the published version of the manuscript.

Funding

This research received no external funding.

Institutional Review Board Statement

Not applicable.

Informed Consent Statement

Not applicable.

Data Availability Statement

The data are available upon reasonable request from the corresponding author.

Acknowledgments

The authors would like to thank Olivier Soppera and Amine Khitous from the Institut de Science des Matériaux de Mulhouse (IS2M) for the instrumentation required for profile measurements, and Camilla Zanoni and Daniele Callegari from the University of Pavia for SEM analysis.

Conflicts of Interest

The authors declare no conflicts of interest.

References

  1. Woodburn, A.T. Glyphosate: Production, pricing and use worldwide. Pest Manag. Sci. Former. Pestic. Sci. 2000, 56, 309–312. [Google Scholar] [CrossRef]
  2. Soares, D.; Silva, L.; Duarte, S.; Pena, A.; Pereira, A. Glyphosate use, toxicity and occurrence in food. Foods 2021, 10, 2785. [Google Scholar] [CrossRef] [PubMed]
  3. Bøhn, T.; Cuhra, M.; Traavik, T.; Sanden, M.; Fagan, J.; Primicerio, R. Compositional differences in soybeans on the market: Glyphosate accumulates in Roundup Ready GM soybeans. Food Chem. 2014, 153, 207–215. [Google Scholar] [CrossRef] [PubMed]
  4. Kolakowski, B.M.; Miller, L.; Murray, A.; Leclair, A.; Bietlot, H.; van de Riet, J.M. Analysis of glyphosate residues in foods from the Canadian retail markets between 2015 and 2017. J. Agric. Food Chem. 2020, 68, 5201–5211. [Google Scholar] [CrossRef] [PubMed]
  5. Zoller, O.; Rhyn, P.; Rupp, H.; Zarn, J.A.; Geiser, C. Glyphosate residues in Swiss market foods: Monitoring and risk evaluation. Food Addit. Contam. Part B 2018, 11, 83–91. [Google Scholar] [CrossRef] [PubMed]
  6. Ledoux, M.L.; Hettiarachchy, N.; Yu, X.; Howard, L.; Lee, S.O. Penetration of glyphosate into the food supply and the incidental impact on the honey supply and bees. Food Control 2020, 109, 106859. [Google Scholar] [CrossRef]
  7. Cook, K.; Fund, C.E. Glyphosate in Beer and Wine; California Public Interest Research Group (CALPIRG) Education Fund: Sacramento, CA, USA, 2019. [Google Scholar]
  8. Wang, Y.; Gao, W.; Li, Y.; Xiao, Y.; Song, W.; Yao, T.; Hou, R. Establishment of a HPLC–MS/MS detection method for glyphosate, glufosinate-ammonium, and aminomethyl phosphoric acid in tea and its use for risk exposure assessment. J. Agric. Food Chem. 2021, 69, 7969–7978. [Google Scholar] [CrossRef] [PubMed]
  9. Bandana, B.; Sharma, N.; Joshi, R.; Gulati, A.; Sondhia, S. Dissipation kinetics of glyphosate in tea and tea-field under northwestern mid-hill conditions of India. J. Pestic. Sci. 2015, 40, 82–86. [Google Scholar] [CrossRef]
  10. Duke, S.O. Glyphosate: Environmental fate and impact. Weed Sci. 2020, 68, 201–207. [Google Scholar] [CrossRef]
  11. Annett, R.; Habibi, H.R.; Hontela, A. Impact of glyphosate and glyphosate-based herbicides on the freshwater environment. J. Appl. Toxicol. 2014, 34, 458–479. [Google Scholar] [CrossRef]
  12. Sprankle, P.; Meggitt, W.F.; Penner, D. Absorption, action, and translocation of glyphosate. Weed Sci. 1975, 23, 235–240. [Google Scholar] [CrossRef]
  13. Samsel, A.; Seneff, S. Glyphosate’s suppression of cytochrome P450 enzymes and amino acid biosynthesis by the gut microbiome: Pathways to modern diseases. Entropy 2013, 15, 1416–1463. [Google Scholar] [CrossRef]
  14. Benachour, N.; Séralini, G.E. Glyphosate formulations induce apoptosis and necrosis in human umbilical, embryonic, and placental cells. Chem. Res. Toxicol. 2009, 22, 97–105. [Google Scholar] [CrossRef] [PubMed]
  15. Thongprakaisang, S.; Thiantanawat, A.; Rangkadilok, N.; Suriyo, T.; Satayavivad, J. Glyphosate induces human breast cancer cells growth via estrogen receptors. Food Chem. Toxicol. 2013, 59, 129–136. [Google Scholar] [CrossRef] [PubMed]
  16. Guyton, K.Z.; Loomis, D.; Grosse, Y.; El Ghissassi, F.; Benbrahim-Tallaa, L.; Guha, N.; Straif, K. Carcinogenicity of tetrachlorvinphos, parathion, malathion, diazinon, and glyphosate. Lancet Oncol. 2015, 16, 490–491. [Google Scholar] [CrossRef] [PubMed]
  17. Tarone, R.E. On the International Agency for Research on Cancer classification of glyphosate as a probable human carcinogen. Eur. J. Cancer Prev. 2018, 27, 82–87. [Google Scholar] [CrossRef]
  18. Rana, I.; Nguyen, P.K.; Rigutto, G.; Louie, A.; Lee, J.; Smith, M.T.; Zhang, L. Mapping the key characteristics of carcinogens for glyphosate and its formulations: A systematic review. Chemosphere 2023, 339, 139572. [Google Scholar] [CrossRef] [PubMed]
  19. Alcántara-de la Cruz, R.; Cruz-Hipolito, H.E.; Domínguez-Valenzuela, J.A.; De Prado, R. Glyphosate ban in Mexico: Potential impacts on agriculture and weed management. Pest Manag. Sci. 2021, 77, 3820–3831. [Google Scholar] [CrossRef]
  20. European Commission Brussels. Proposal for a Directive of the European Parliament and of the Council amending Directive 2000/60/EC Establishing a Framework for Community Action in the Field of Water Policy, Directive 2006/118/EC on the Protection of Groundwater against Pollution and Deterioration and Directive 2008/105/EC on Environmental Quality Standards in the Field of Water Policy 26.10.2022, COM(2022) 540 Final 2022/0344 (COD); European Commission: Brussels, Belgium, 2022; pp. 1–81. [Google Scholar]
  21. Valle, A.L.; Mello, F.C.C.; Alves-Balvedi, R.P.; Rodrigues, L.P.; Goulart, L.R. Glyphosate detection: Methods, needs and challenges. Environ. Chem. Lett. 2019, 17, 291–317. [Google Scholar] [CrossRef]
  22. Royer, A.; Beguin, S.; Tabet, J.C.; Hulot, S.; Reding, M.A.; Communal, P.Y. Determination of glyphosate and aminomethylphosphonic acid residues in water by gas chromatography with tandem mass spectrometry after exchange ion resin purification and derivatization. Application on vegetable matrixes. Anal. Chem. 2000, 72, 3826–3832. [Google Scholar] [CrossRef]
  23. Rawat, K.A.; Majithiya, R.P.; Rohit, J.V.; Basu, H.; Singhal, R.K.; Kailasa, S.K. Mg2+ ion as a tuner for colorimetric sensing of glyphosate with improved sensitivity via the aggregation of 2-mercapto-5-nitrobenzimidazole capped silver nanoparticles. RSC Adv. 2016, 6, 47741–47752. [Google Scholar] [CrossRef]
  24. Waiman, C.V.; Avena, M.J.; Garrido, M.; Band, B.F.; Zanini, G.P. A simple and rapid spectrophotometric method to quantify the herbicide glyphosate in aqueous media. Application to adsorption isotherms on soils and goethite. Geoderma 2012, 170, 154–158. [Google Scholar] [CrossRef]
  25. Cennamo, N.; Pesavento, M.; Zeni, L. A review on simple and highly sensitive plastic optical fiber probes for bio-chemical sensing. Sens. Actuators B Chem. 2021, 331, 129393. [Google Scholar] [CrossRef]
  26. Gupta, B.D.; Shrivastav, A.M.; Usha, S.P. Surface plasmon resonance-based fiber optic sensors utilizing molecular imprinting. Sensors 2016, 16, 1381. [Google Scholar] [CrossRef] [PubMed]
  27. Cennamo, N.; D’Agostino, G.; Porto, G.; Biasiolo, A.; Perri, C.; Arcadio, F.; Zeni, L. A molecularly imprinted polymer on a plasmonic plastic optical fiber to detect perfluorinated compounds in water. Sensors 2018, 18, 1836. [Google Scholar] [CrossRef] [PubMed]
  28. Haupt, K.; Mosbach, K. Molecularly imprinted polymers and their use in biomimetic sensors. Chem. Rev. 2000, 100, 2495–2504. [Google Scholar] [CrossRef] [PubMed]
  29. Kupai, J.; Razali, M.; Buyuktiryaki, S.; Kecili, R.; Szekely, G. Long-term stability and reusability of molecularly imprinted polymers. Polym. Chem. 2017, 8, 666–673. [Google Scholar] [CrossRef] [PubMed]
  30. Do, M.H.; Florea, A.; Farre, C.; Bonhomme, A.; Bessueille, F.; Vocanson, F.; Tran-Thi, N.T.; Jaffrezic-Renault, N. Molecularly imprinted polymer-based electrochemical sensor for the sensitive detection of glyphosate herbicide. Int. J. Environ. Anal. Chem. 2015, 95, 1489–1501. [Google Scholar] [CrossRef]
  31. Sawetwong, P.; Chairam, S.; Jarujamrus, P.; Amatatongchai, M. Enhanced selectivity and sensitivity for colorimetric determination of glyphosate using Mn–ZnS quantum dot embedded molecularly imprinted polymers combined with a 3D-microfluidic paper-based analytical device. Talanta 2021, 225, 122077. [Google Scholar] [CrossRef] [PubMed]
  32. Balciunas, D.; Plausinaitis, D.; Ratautaite, V.; Ramanaviciene, A.; Ramanavicius, A. Towards electrochemical surface plasmon resonance sensor based on the molecularly imprinted polypyrrole for glyphosate sensing. Talanta 2022, 241, 123252. [Google Scholar] [CrossRef]
  33. Alberti, G.; Spina, S.; Arcadio, F.; Pesavento, M.; De Maria, L.; Cennamo, N.; Zeni, L.; Merli, D. MIP-Assisted 3-Hole POF Chip Faced with SPR-POF Sensor for Glyphosate Detection. Chemosensors 2023, 11, 414. [Google Scholar] [CrossRef]
  34. Pesavento, M.; Marchetti, S.; De Maria, L.; Zeni, L.; Cennamo, N. Sensing by molecularly imprinted polymer: Evaluation of the binding properties with different techniques. Sensors 2019, 19, 1344. [Google Scholar] [CrossRef] [PubMed]
  35. da Mata, K.; Corazza, M.Z.; de Oliveira, F.M.; de Toffoli, A.L.; Tarley, C.R.T.; Moreira, A.B. Synthesis and characterization of cross-linked molecularly imprinted polyacrylamide for the extraction/preconcentration of glyphosate and aminomethylphosphonic acid from water samples. React. Funct. Polym. 2014, 83, 76–83. [Google Scholar] [CrossRef]
  36. Cennamo, N.; Massarotti, D.; Conte, L.; Zeni, L. Low cost sensors based on SPR in a plastic optical fiber for biosensor implementation. Sensors 2011, 11, 11752–11760. [Google Scholar] [CrossRef]
  37. Pesavento, M.; Cennamo, N.; Zeni, L.; De Maria, L. A Molecularly Imprinted Polymer Based SPR Sensor for 2-Furaldehyde Determination in Oil Matrices. Appl. Sci. 2021, 11, 10390. [Google Scholar] [CrossRef]
  38. Kushwaha, A.S.; Kumar, A.; Kumar, R.; Srivastava, S.K. A study of surface plasmon resonance (SPR) based biosensor with improved sensitivity. Photonics Nanostruct.-Fundam. Appl. 2018, 31, 99–106. [Google Scholar] [CrossRef]
  39. Cennamo, N.; Arcadio, F.; Zeni, L.; Alberti, G.; Pesavento, M. Optical-Chemical Sensors based on plasmonic phenomena modulated via micro-holes in Plastic Optical Fibers filled by Molecularly Imprinted Polymers. Sens. Actuators B Chem. 2022, 372, 132672. [Google Scholar] [CrossRef]
  40. Miller, J.N.; Miller, J.C. Calibration methods in instrumental analysis: Regression and correlation. In Statistics and Chemometrics for Analytical Chemistry, 6th ed.; Pearson Education Limited: Harlow Essex, UK, 2010; pp. 124–126. [Google Scholar]
  41. Butmee, P.; Samphao, A.; Tumcharern, G. Reduced graphene oxide on silver nanoparticle layers-decorated titanium dioxide nanotube arrays as SERS-based sensor for glyphosate direct detection in environmental water and soil. J. Hazard. Mater. 2022, 437, 129344. [Google Scholar] [CrossRef]
  42. Li, Z.; Liang, S.; Zhou, L.; Luo, F.; Lou, Z.; Chen, Z.; Yang, M. A Turn-On Fluorescence Sensor Based on Nitrogen-Doped Carbon Dots and Cu2+ for Sensitively and Selectively Sensing Glyphosate. Foods 2023, 12, 2487. [Google Scholar] [CrossRef]
  43. Qiu, C.; Zhang, L.; Miao, F.; Tao, B.; Li, H.; Qiu, Z.; Zang, Y. Development of a sensitive ZnO/CuO/Au electrochemical sensor for measuring glyphosate. Vacuum 2023, 214, 112138. [Google Scholar] [CrossRef]
  44. Costa, I.A.; Gross, M.A.; Alves, E.D.; Fonseca, F.J.; Paterno, L.G. An impedimetric e-tongue based on CeO2-graphene oxide chemical sensors for detection of glyphosate and its potential interferents. J. Electroanal. Chem. 2022, 922, 116719. [Google Scholar] [CrossRef]
  45. Chang, Y.C.; Lin, Y.S.; Xiao, G.T.; Chiu, T.C.; Hu, C.C. A highly selective and sensitive nanosensor for the detection of glyphosate. Talanta 2016, 161, 94–98. [Google Scholar] [CrossRef] [PubMed]
  46. Bera, M.K.; Mohapatra, S. Ultrasensitive detection of glyphosate through effective photoelectron transfer between CdTe and chitosan derived carbon dot. Colloids Surf. A Physicochem. Eng. Asp. 2020, 596, 124710. [Google Scholar] [CrossRef]
  47. Zheng, J.; Zhang, H.; Qu, J.; Zhu, Q.; Chen, X. Visual detection of glyphosate in environmental water samples using cysteamine-stabilized gold nanoparticles as colorimetric probe. Anal. Methods 2013, 5, 917–924. [Google Scholar] [CrossRef]
  48. Pesavento, M.; Zeni, L.; De Maria, L.; Alberti, G.; Cennamo, N. SPR-Optical Fiber-Molecularly Imprinted Polymer Sensor for the Detection of Furfural in Wine. Biosensors 2021, 11, 72. [Google Scholar] [CrossRef]
Figure 1. SPR–POF–MIP sensor. Top-view of the sensor: before (a) and after (b) the MIP layer deposition. (c) Cross-section view of sensor outline.
Chemosensors 12 00142 g001
Figure 2. Experimental setup used for testing the SPR–POF–MIP/NIP platforms.
Chemosensors 12 00142 g002
Figure 3. SPR spectra of the optical–chemical sensor: (a) SPR spectra of the bare surface (in blue) and the MIP thin layer (in red) in water; (b) SPR spectra of the SPR–POF–MIP sensor obtained at different concentrations of GLY in aqueous solutions.
Chemosensors 12 00142 g003
Figure 4. Dose-response curve of the GLY detection in water: resonance wavelength variation with respect to the blank (∆λ) versus the GLY concentration, together with a Bi-Langmuir fitting of the experimental values and the error bars.
Chemosensors 12 00142 g004
Figure 5. Sensor response at low GLY concentrations: (a) Experimental values from 0 to 0.007 µM; (b) resonance wavelength variation versus GLY concentration (at low concentrations) together with the linear fitting of the data (y fitting equation) and the error bars.
Chemosensors 12 00142 g005
Figure 6. Comparison between the resonance wavelength variation of three herbicides (MCPA, BTZ, and ATZ) with a concentration of 1.2 μM and GLY with a concentration of 0.1 μM.
Chemosensors 12 00142 g006
Figure 7. SPR spectra obtained via an SPR–POF platform covered by an NIP layer at different GLY concentrations in water (0.001–0.2 μM).
Chemosensors 12 00142 g007
Table 1. GLY determination by the SPR-POF-MIP sensor: the method’s figures of merit. The number in parenthesis is the standard deviation of the last digit.
SensorSensitivity
[nm µM−1]
R2LOD
[µM]
LOQ
[µM]
Linear Range
[µM]
Dynamic Range
[µM]
SPR-POF-MIP108(10)0.9740.00170.00520.0015–0.0070.0015–2
Table 2. Comparative analysis between different methods/sensors for GLY determination. n.r. = not reported.
Sensing MethodLOD [μM]Kaff [μM]−1Detection Range (μM)Reference
Surface-enhanced Raman scattering0.017n.r.29–296[41]
Fluorescence0.124n.r.0.59–590[42]
Electrochemical0.35n.r.6.9–230[43]
Electrochemical0.03n.r.0.11–0.29[44]
Fluorescence0.004n.r.0.01–0.06[45]
Photoluminescence 0.05n.r.0–0.1[46]
Electrochemical/indirect method5×10−9n.r.6 10−9–6 10−3[30]
Colorimetric0.06n.r.0.5–7[47]
MIP-Assisted 3-Hole POF Chip Faced with SPR–POF Sensor0.00022800.0003–0.05[33]
SPR–POF–MIP0.0015325 (site 1) *
1.4 (site 2) *
0.0015–2[This work]
* obtained by the Bi-Langmuir parameters reported in Table S1 of Supplementary Materials.
Disclaimer/Publisher’s Note: The statements, opinions and data contained in all publications are solely those of the individual author(s) and contributor(s) and not of MDPI and/or the editor(s). MDPI and/or the editor(s) disclaim responsibility for any injury to people or property resulting from any ideas, methods, instructions or products referred to in the content.

