Article

Electrochemical Determination of Tryptophan Based on Gly@CDs Clusters Modified Glassy Carbon Electrode

1
Department of Basic and Applied Sciences for Engineering (SBAI), Sapienza University of Rome, via Castro Laurenziano, 7, 00161 Rome, Italy
2
Dipartimento di Ingegneria Civile, Ambientale, del Territorio, Edile e di Chimica DICATECh, Politecnico di Bari, Via Orabona 4, 70125 Bari, Italy
3
Istituto per lo Studio dei Materiali Nanostrutturati (ISMN), Consiglio Nazionale delle Ricerche (CNR), via Castro Laurenziano, 7, 00161 Rome, Italy
4
Department of Chemistry, Sapienza University of Rome, Piazzale Aldo Moro, 5, 00185 Rome, Italy
*
Authors to whom correspondence should be addressed.
Chemosensors 2024, 12(8), 149; https://doi.org/10.3390/chemosensors12080149
Submission received: 4 June 2024 / Revised: 22 July 2024 / Accepted: 27 July 2024 / Published: 2 August 2024

Abstract

:
A simple sensor for the quantitation of tryptophan (Trp) has been developed using a glassy carbon electrode (GCE) modified with electro-synthesized carbon dots functionalized with glycine (Gly@CDs). The surface functionalization with an amino acid led to the formation of large clusters of nanostructures. To our knowledge, this is the first study in which a Gly@CDs clusters modified GCE is used for the analysis of Trp. Cyclic voltammetry (CV) and differential pulse voltammetry (DPV) are the techniques used to study Trp electrochemical behavior in an alkaline solution using such an electrode. A linear concentration range was found for Trp from 5 × 10⁻⁶ to 5 × 10⁻³ mol L−1 with a detection limit (LOD) of 5 × 10⁻⁶ mol L−1. The reproducibility and repeatability data were satisfactory in terms of RSD%. Moreover, the stability during the time of the modified electrode was considered, evidencing interesting results. The described sensor was used for the determination of Trp in herbal tea and a dietary supplement, and the results were compared with those obtained with HPLC-ESI-MS in the Selected Ion Recording (SIR) mode as an independent method. The electrochemical sensor presents significant advantages in terms of low cost, portability, ease of handling and not requiring skilled personnel.

1. Introduction

Essential amino acids have an important role in our life. As they cannot be synthesized endogenously in our bodies, they must be provided through food sources and an appropriate diet [1]. Essential amino acids are histidine (His), lysine (Lys), tryptophan (Trp), phenylalanine (Phe), methionine (Met), threonine (Thr), leucine (Leu), isoleucine (Ile) and valine (Val).
Among them, Trp is involved in protein synthesis and is the precursor for niacin, melatonin and serotonin (5-HT). Moreover, it plays a crucial role in many metabolic functions and, consequently, the Trp levels are considered fundamental in diagnosing various metabolic disorders. Furthermore, its supplemental intake is suggested for the treatment of depression and sleep disorders, with Trp being the main precursor of 5-HT and melatonin [2]. Moderate Trp supplementation in the diet helps to control the level of serotonin, and, consequently, the appetite and sleep patterns as well as mood changes [3]. Trp is generally found in proteins present in different foods including milk, chocolate, banana and yoghurt. Finally, the normal Trp level is between 25 and 73 µM in blood [1,4]
Some papers in the literature have reported the detection and quantitation of Trp using various techniques, such as near-infrared and Raman spectroscopy, UV-Vis spectroscopy, surface-enhanced Raman spectroscopy, electrochemiluminescence and tandem mass spectroscopy [1]. Despite such methodologies being considered robust, sensitive and highly selective, they usually require time-demanding sample pre-treatment processes like extraction, pre-concentration and derivatization, along with expensive instrumentation and personnel able to use it.
On the other hand, electrochemistry is usually considered an easy technique, and its equipment is, nowadays, quite cheap. Moreover, it is quite simple to obtain miniaturization and predisposition for real-time and on-site analysis. In addition, the possibility to functionalize the electrodes with micro- and nanostructured materials can enhance the performance of such electrochemical sensors, so that, actually, micro- and nanomaterials-modified electrodes are considered innovative diagnostic devices for monitoring and quantify specific analytes [1,3].
Different kinds of nanomaterials including noble metal, metal oxide, carbon nanomaterials and nanocomposites have been widely used for assembling electrochemical sensors for Trp determination [3].
Carbon dots are well-known “zero-dimensional” quasi-spherical carbon nanoparticles, whose use is mainly related to their fluorescence ability, representing an appealing alternative to the more conventional carbon nanomaterials [5,6]. Their application in imaging and biomedicine is becoming more and more frequent [7,8,9]. Recently, these particular nanoparticles have also been employed in the fields of electrocatalysis [10,11], photocatalysis [12], organic synthesis [13,14] and sensing [15,16].
The importance of such nanostructures has been recently consecrated by the 2023 Nobel Prize winners Moungi G. Bawendi, Louis E. Brus and Aleksey Yekimov “for the discovery and synthesis of quantum dots” [17].
The physicochemical characteristics of CDs depend on the starting material and the synthesis technique. In particular, two approaches can be applied for the preparation of CDs: a top-down approach, in which large structures are demolished by arc discharge, laser ablation, chemical oxidation or electrochemical oxidation, or a bottom-up approach, in which the nanoparticles are produced by carbonization/aggregation of small molecules by microwave or electrochemical, thermal, hydrothermal or plasma treatment [18,19].
CDs and/or graphene quantum dots have been seldom used to functionalize the electrode surface of electrochemical sensors for tryptophan [20] to enhance the sensor response. Using a carbon-unmodified electrode does not lead to sufficient sensitivity [21,22] and carbon dots could enhance the electron transfer ability of the electrode itself, facilitating the tryptophan oxidation and enhancing the active electrodic surface. He and co-workers exploited the potential of the couple poly(β-cyclodextrin)-CDs to modify a glassy carbon electrode for quantifying dopamine, uric acid and tryptophan in human urine [23]. In that work, CDs were prepared by pyrolysis of citric acid at 180 °C. Both β-cyclodextrin and carbon dots contributed to enhancing the sensor response. Luo and co-workers [24] synthesized carbon dots by ultrasound treatment of glucose. The as-prepared CDs were electrodeposited on a glassy carbon electrode and used for the simultaneous determination of dopamine, uric acid, L-tryptophan and theophylline in human serum. Abdel-aal and co-workers [25] used a carbon dots entrapped by overoxidated polypyrrole film to functionalize a pencil graphite electrode for the detection of tryptophan in human serum to demonstrate tryptophan as a biomarker for breast cancer diagnosis. In this case, CDs were prepared by pyrolysis of citric acid at 200 °C.
The analyte being an amino acid, we envisaged the possibility to obtain a selective interaction between Trp and electrode surface by CDs functionalization with an amino acid. In order to avoid any interference caused by enantioselective binding, we decided to use the only non-chiral amino acid, glycine. In this context, the present work aims to investigate the potentiality of glassy carbon electrodes (GCE) modified with electrosynthesized CDs post-functionalized with glycine (Gly) for the determination of Trp. It is anticipated that the surface functionalization led to large clusters of nanostructures, most probably due to the ability of Gly to form hydrogen bonds (vide infra). An herbal tea and a dietary supplement were chosen as a real matrix to test the resulting optimized sensor for the determination of Trp.

2. Materials and Methods

2.1. General Remarks

All chemicals of analytical grade were used as received. In detail, tryptophan (Trp), potassium ferricyanide (K3[Fe(CN)6]) and ethanol (EtOH) were purchased from Merck/Italy-Sigma-Aldrich (Milano, Italy); HPLC grade acetonitrile and methanol were purchased from Carlo Erba (Milano, Italy); HPLC grade water was freshly prepared by the Milli-Q purification system (Millipore, Vimodrone, Italy).
A Bruker Avance I 400 spectrometer (operating at a frequency of 100.6 MHz for 13C) was used to carry out Solid State NMR analyses, using a 4.0 mm HX MAS probe. The temperature was 298 K. Zirconia rotors (4 mm) were used, containing the samples, and they were spun at 9 kHz under airflow. The 1H-13C CP/MAS NMR experiments’ acquisition parameters were as follows: 3.25 μs proton π/2 pulse length, νCP of 55.0 kHz, contact time of 1.0 ms, νdec of 76.9 kHz and recycle delay of 6.0 s. A two-pulse phase-modulation (TPPM) decoupling scheme was used for the 1H decoupling. Chemical shifts were referenced by taking the methylene signal of adamantane as secondary reference at δ 38.48.
A Fluoromax-3 Horiba Jobin–Yvon fluorometer was used to record the fluorescence spectra of carbon dots in water solution at 25 °C (400–650 nm as range).
Infrared spectra were acquired in attenuated total reflection (ATR) using a Nicolet 6700 (Thermo Fisher Scientific, Waltham, MA, USA) equipped with a Golden Gate single reflection diamond ATR accessory. All spectra were recorded in absorption mode with the following parameters: 200 scans/spectrum; 4 cm−1 resolution; and 4000–650 cm−1 as range.
SEM analysis of CDs from EtOH have been performed with High-Resolution Field Emission Scanning Electron Microscope (HR-FESEM) AURIGA Zeiss (Zeiss, Oberkochen, Germany). Before measuring, a solution of CDs from EtOH in ultrapure water (0.01 mg/mL) was sonicated for 30 min (ultrasonic bath Branson 3200) and then deposited on silicon wafer by drop-casting. SEM measurements of Gly@CDs clusters were performed using FESEM TESCAN S9000G microscope [(Kohoutovice, Czech Republic); Microanalysis; OXFORD (Abingdon, UK); Detector: Ultim Max; Software: AZTEC Version 2.2.3 (Casole Bruzio CS, Italy)] equipped with Schottky emitter source (Resolution: 0.7 nm at 15 keV in beam mode, using accelerating voltages in the range of 0.2–30 keV). Before measuring, the samples have been sputtered with 20 nm of gold.

2.2. Bottom-Up Electrochemical Synthesis of CDs under Constant Current Conditions from CH3CH2OH

In a homemade undivided cell containing two platinum flat spirals electrodes (apparent area: 1 cm2) and a magnetic stirring bar, 10 mL of EtOH (96% v/v) mixed with a solution of 110 mg of NaOH in 1 mL of water was electrolyzed under galvanostatic conditions. In particular, a constant current of I = 30 mA·cm−2 was used, under stirring at room temperature, using an Amel Model 552 potentiostat equipped with an Amel Model 731 integrator. After 900 Coulombs (8 h and 20 min, dark orange solution), the current was switched off, and the electrolyzed solution was diluted with 10 mL of EtOH and left overnight at room temperature to salt out the NaOH. The mixture was then centrifuged (5000 rpm, 10 min, by an ALC Centrifuge 4222 MKII), using EtOH (3 × 5 mL) to wash the solid. The combined EtOH was evaporated under vacuum, diluted with about 6 mL of H2O and neutralized by the addition of HCl 1M, drop by drop, up to pH = 7. Then, the solution was dialyzed against ultrapure water (600 mL) through a dialysis membrane (Spectra/Por® Biotech cellulose ester membranes, MWCO 0.1–0.5 kD) against distilled water (minimum 48 h), substituting the dialysis water after 24 h. Then, water was eliminated from the dialysis solution, by vacuum and Smart Evaporator, obtaining about 60 mg of an orange solid.

2.3. Functionalization with Glycine of CDs from EtOH

The obtained EtOH-based CDs were subsequently functionalized with Glycine by acid-catalyzed esterification. Specifically, 60 mg of EtOH-based CDs dissolved in 10 mL of H2O, 75 mg (1 mmol) of Glycine and 73 μL of H2SO4 conc. (96% w/w) were added. The solution was stirred at reflux for 3 h (oil bath 115 °C). Then the reaction mixture was neutralized by adding solid NaHCO3 up to pH = 7 and dialyzed (using 600 mL of ultrapure water) through a dialysis membrane (Spectra/Por® Biotech cellulose ester membranes, MWCO 0.1–0.5 kD) for a minimum of 48 h, substituting the dialysis water after 24 h. After concentration under vacuum of the obtained solution, filtration through a 0.2 μm filter (CPS 25 mm syringe filter, cellulose regenerated) and drying by Smart Evaporator, 25 mg of a brownish solid were obtained.

2.4. Electrochemical Characterization

Electrochemical measurements were performed by an Autolab PGSTAT12 potentiostat/galvanostat (Metrhom Autolab BV, Utrecht, The Netherlands), by using a conventional two-compartment three-electrode cell, a glassy carbon electrode (GCE, 2 mm in diameter), purchased by Metrohm Autolab BV (Utrecht, The Netherlands), as working electrode, a Pt counter electrode and an Ag/AgCl reference electrode.
GCE was modified by the electrodeposition method. It was scanned in 5 mL Gly@CDs (1 mg/mL in H2O) solution from +0.8 to −0.8 V with a scan rate of 0.05 V s−1 for 50 cycles, following a method already reported in the literature [16]. After rinsing with distilled water, Gly@CDs-GCE was air dried for 20 min.
Before the modification, the GCE was polished with 10 nm aluminium oxide powders and subsequently immersed for 5 min in water and ethanol for ultrasonic cleaning. Next, it was electrochemically polished in H2SO4 0.01 mol L−1 by cyclic voltammetry (CV) for 100 cycles from 0.0 V to 1.6 V at 0.1 V s−1 [26,27]. Finally, it was immersed again in water and ethanol for the final ultrasonic cleaning.
The effectiveness of the electrode surface modification was evaluated by CV at the scan rate of 0.020 V s−1, using 1 × 10⁻² mol L−1 K3[Fe(CN)6] as a redox probe. The peak potential and peak current intensity data obtained at bare GCE and at Gly@CDs-GCE were compared. The redox probe electrochemical behavior at the bare and modified GCE was investigated by CV in the scan rate range 0.020–0.200 V s−1.
The electrochemical behavior of Trp (1.0 × 10⁻³ mol L−1) at bare GCE and Gly@CDs-GCE was studied in the anodic potential window from 0.30 to 1.80 V by CV at 0.020 V s−1 and by differential pulse voltammetry (DPV), using the following optimized parameters: step potential 0.004 V, modulation amplitude 0.025 V, modulation time 0.05 s and scan rate 0.02 V s−1. Phosphate buffer was used as a supporting electrolyte in the pH range of 3.0–9.0. The solution pH was measured before and after each electrochemical measurement and it was always unchanged. Due to a possible adsorption of Trp oxidation products on the electrode, the electrode was cleaned and re-functionalized before each measurement (as described above).
All the measurements were performed at room temperature and in the presence of oxygen, because oxygen does not represent a real interference in the investigated anodic potential window.
Data acquisition, data handling and instrument control were performed by the Autolab NOVA 1.10 software system.

2.5. Electrochemical Analysis

The calibration curves for Trp were obtained at Gly@CDs-GCE in the phosphate buffer (pH = 9.0), according to the standard addition method in the concentration range 5 × 10⁻⁶–5 × 10⁻³ mol L−1 [16,28]. Six measurements were carried out for each point. They were analyzed by linear least-square regression in Origin Pro 8.1 (Origin Lab Corporation, Northampton, MA, USA). The limit of detection (LOD) was obtained by using the equation:
LOD = 3Sx/y/b
where Sx/y and b are the estimated standard deviation and the slope of the analytical calibration function of the analyte, respectively, with a 95% (degrees of freedom = 3) confidence level [16,28]. Precision for each modified electrode was evaluated using seven electrodes (n = 7) [16,28]. The pH of the solution was controlled and adjusted, when necessary, before each measurement.
Gly@CDs-GCE was used to quantify Trp in Pineal Tens (Uriach Italy Srl, Assago, Italy), a dietary supplement purchased from a local pharmacy. The samples were prepared as follows: one bag (3 g) was dissolved in 75 mL buffer (pH = 9.0) for electrochemical measurements and in 75 mL pure water for HPLC-ESI-MS analysis. After three filtration steps on paper (Whatman filter paper grade 6) and on regenerated cellulose filters (Scharlau, Barcelona, Spain), by 0.45 μm and by 0.22 μm to remove the insoluble compounds, the solutions were used for the analysis.
Trp was also determined in herbal tea, prepared as follows. A commercial sample of Agropyron repens (L.) P. Beauv. rhizomes (commonly known as Quackgrass) was acquired from a local herbal store. Following the dosage and procedure outlined in the Official Pharmacopoeia of the Italian Republic, an herbal tea was prepared by adding 20.00 g of the rhizomes to 200 mL of Milli-Q purified water, previously boiled. After steeping for 10 min, the mixture was filtered through a 0.22 μm filter, brought to room temperature, and then frozen at −20 °C. Subsequently, the sample was freeze dried and a part of this was reconstituted in 10 mL of phosphate buffer at pH 9. The solution thus obtained was used for electrochemical measurements.

2.6. HPLC-ESI-MS in SIR Mode Analysis

A 1525μ HPLC system from Waters (Milford, MA, USA), coupled with a Quattro Micro Tandem Mass spectrometer equipped with an electrospray ionization (ESI) source Waters (Micromass, Manchester, UK), was used for the measurements. Separation was achieved using a Waters XBridge C18 analytical column (150 × 2.1 mm i.d.) with a 5 μm particle size. The mobile phases consisted of A (water/Formic acid 0.02%) and B (acetonitrile/formic acid 0.02%) and the flow rate was 0.20 mL min−1. Chromatographic conditions were previously reported [29] and slightly modified as follows: 5% B from 0 to 1 min, increasing to 16.5% B up to 20 min and to 80% B from 20 to 30 min, to elute other analytes present in the matrices, followed by a return to 5% B from 30 to 31 min and an equilibration period of 20 min at 5% B before each new run. Mass spectral data were acquired in negative ionization mode (ES) using the Selected Ion Recording (SIR) technique with one independent acquisition channel for recording the monoisotopic values of 203 m/z for the anion [M-H] of Trp. Source parameters were as follows: capillary voltage 2500 V, cone voltage 25 V, source temperature 120 °C, desolvation temperature 350 °C, cone gas flow 50 L/h, desolvation gas flow 550 L/h and dwell cell value of 0.200 s. For the analysis of the dietary supplement, samples were filtered by 0.22 μm, diluted 1:10,000 with the mobile phase (A:B, 95:5, v:v) and injected in triplicate (20 μL).
For the analysis of the herbal tea, an aliquot of the freeze-dried sample was diluted 1:100 with the mobile phase (A:B, 95:5, v:v) and then injected (20 μL) in triplicate. The matrix effect (ME) was assessed using HPLC-ESI-MS, where the matrix-matching calibration curve (ranging from 0.1 to 1 mg L−1) for the herbal tea sample was compared with the standard calibration curve of Trp as reported in the literature [16].
Results are reported as mean values ± standard deviation (SD). Data acquisition, data handling and instrument control were performed by MassLynx Software 4.1 v (Data Handling System for Windows, Micromass, Wilmslow, UK).

3. Results and Discussion

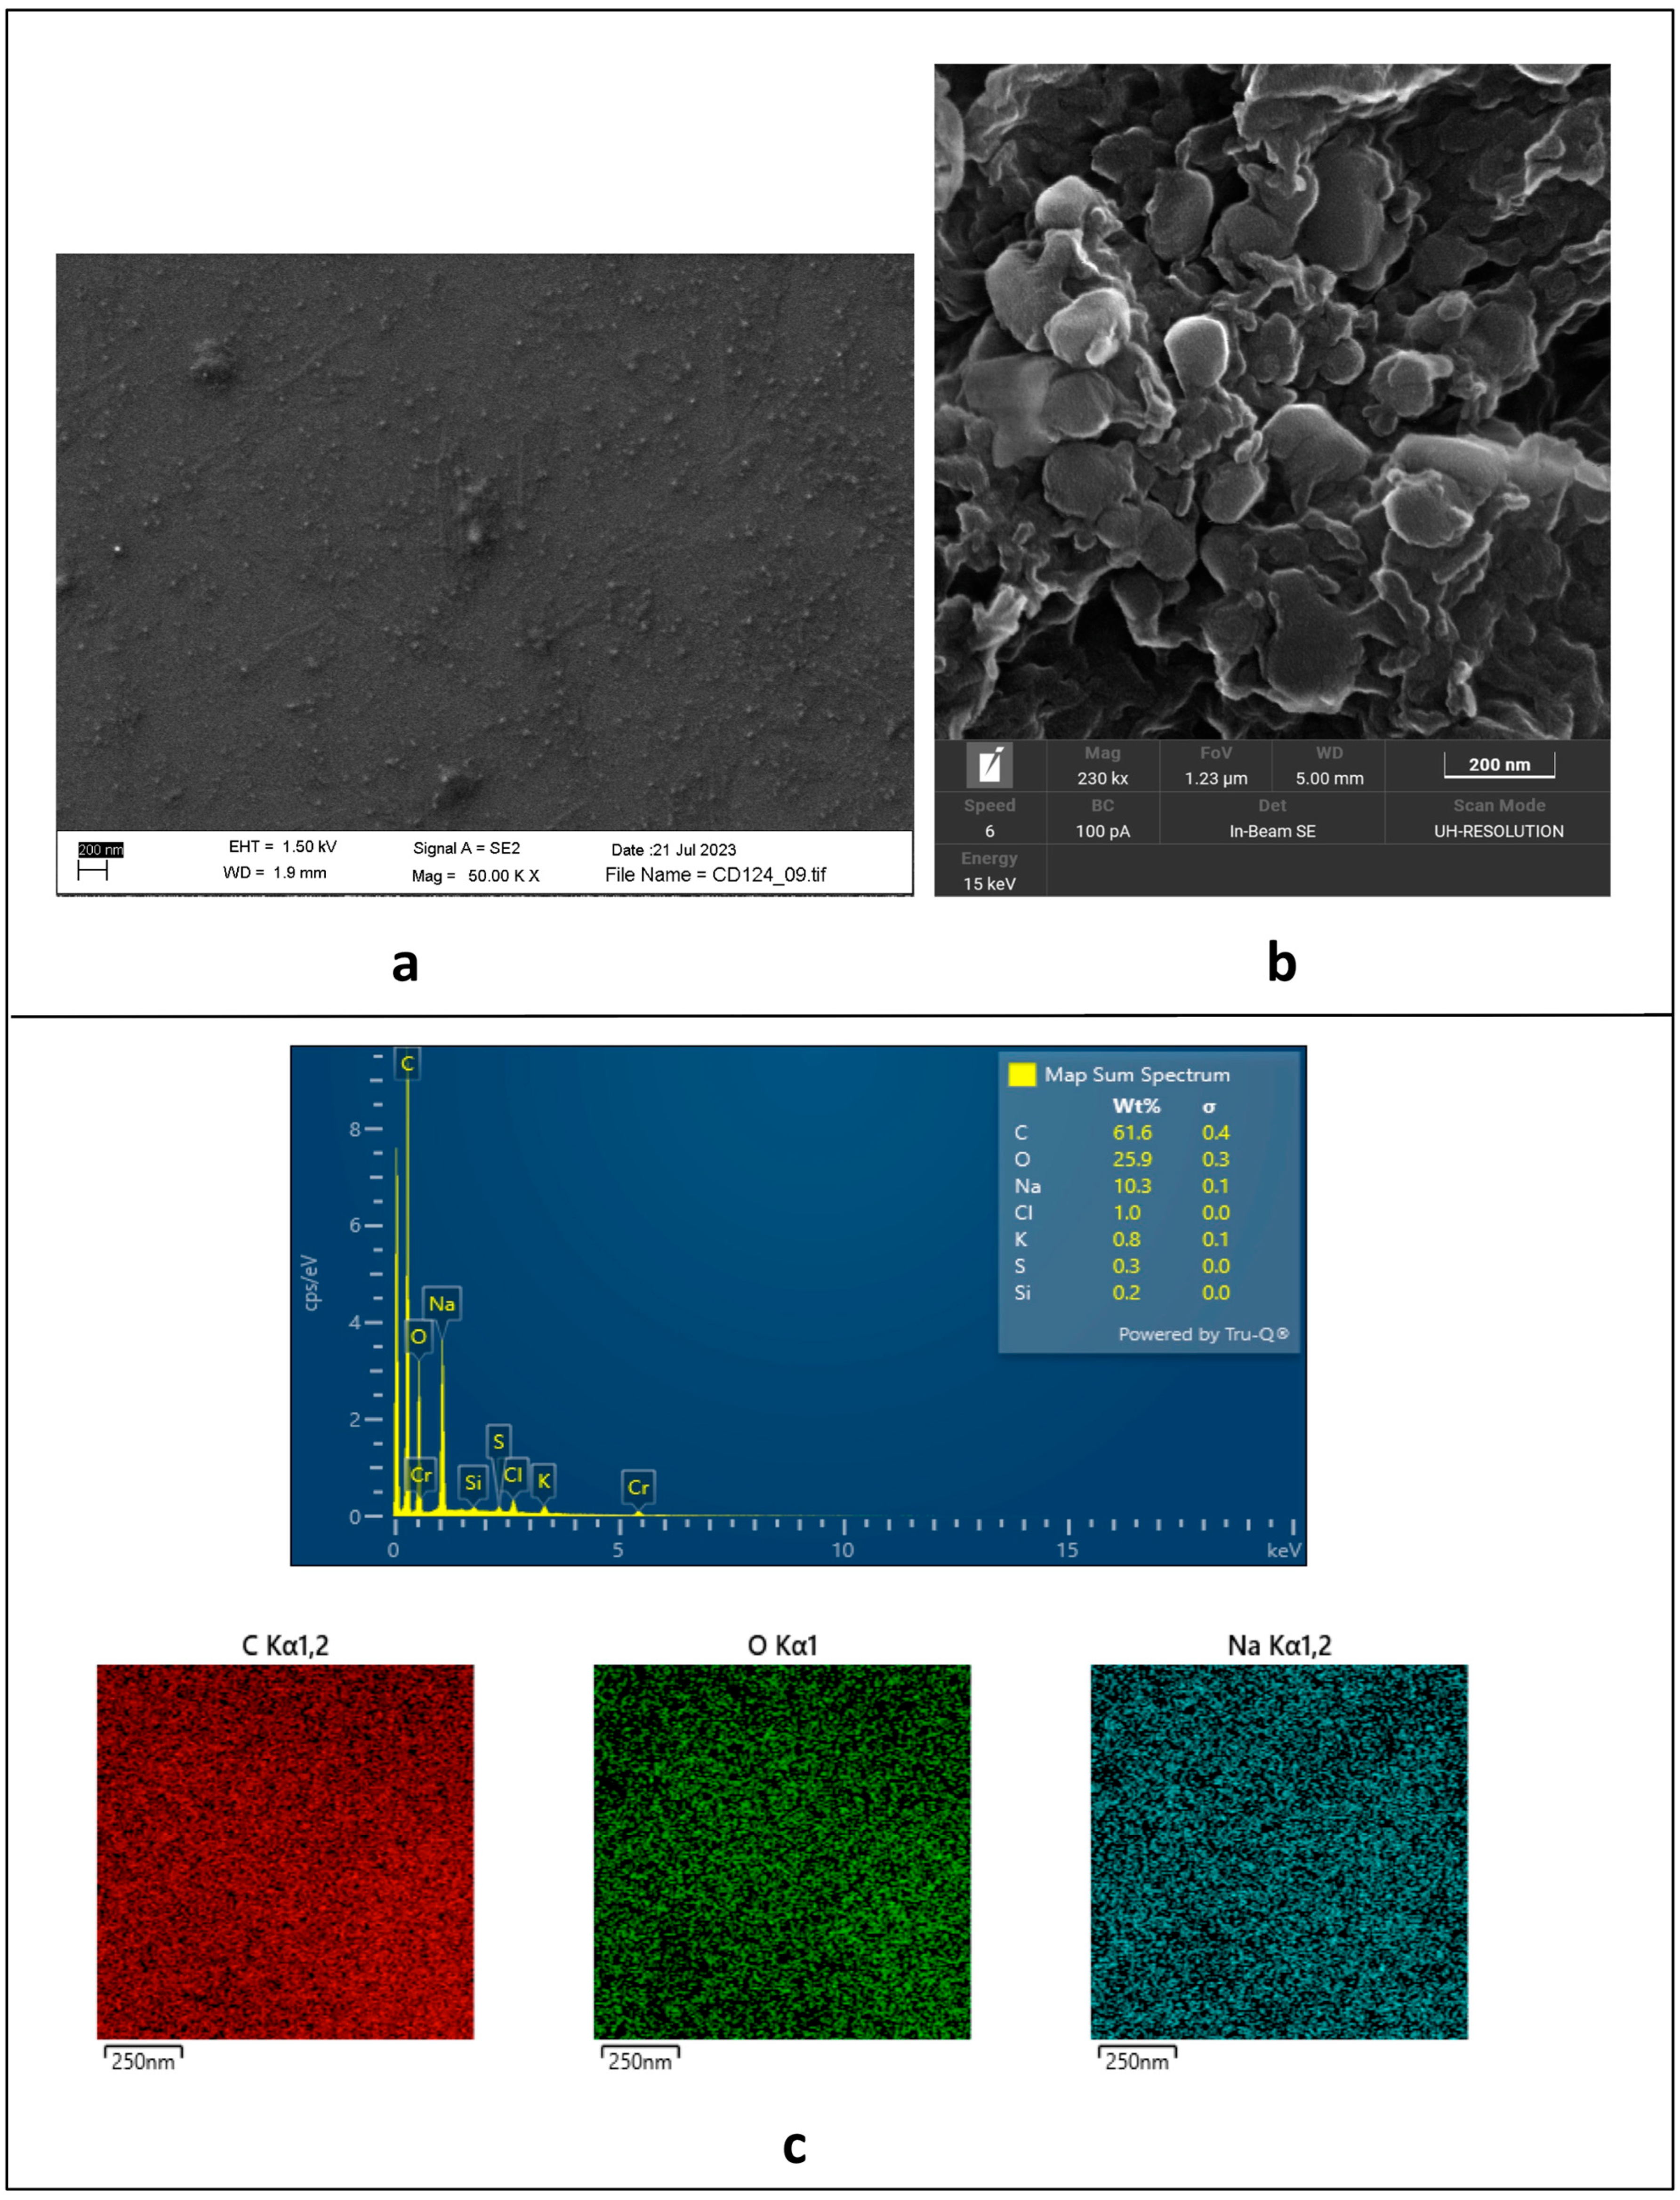
3.1. Gly@CDs Synthesis and Characterization

Gly@CDs were obtained by covalent surface functionalization of CDs previously synthesized from ethanol by anodic oxidation [13]. In particular, a solution of NaOH in ethanol was electrolyzed under galvanostatic conditions using an undivided cell equipped with two platinum electrodes. After the usual workup, the obtained pure CDs were treated with glycine in the presence of H2SO4 to covalently functionalize the oxygenated surface of carbon dots. After the workup, Gly@CDs were obtained and then characterized by IR, NMR, fluorescence, SEM and EDS techniques. As demonstrated by the SEM images (vide infra), the surface functionalization with an amino acid, prone to hydrogen-bonds formation, led to the aggregation of the nanostructures to form large clusters.
The presence of glycine on the surface of CDs is evidenced mainly by the IR and NMR spectra. The solid-state IR spectrum of Gly@CDs (Figure 1a, blue spectrum) shows an intense absorption peak at 1080 cm−1, corresponding to C-O stretching vibrations, less intense peaks around 1600 cm−1 (C=C stretching and N-H bending vibrations) and a broad (not intense) absorption between 2800 and 3500 cm−1, due to C-H, N-H and O-H stretching modes. A comparison with the solid-state IR spectrum of non-functionalized CDs (Figure 1a, red spectrum) highlights the successful surface functionalization. In fact, the intense broad band centered at 3400 cm−1 in non-functionalized CDs (corresponding to O-H stretching, red spectrum) is very attenuated in Gly@CDs (blue spectrum); at the same time, in Gly@CDs spectrum the band around 1080 cm−1 is more intense than the corresponding of CDs, evidencing the Gly covalent binding the surface oxygen atoms of CDs [16].
The solid-state 13C CP-MAS NMR spectrum (Figure 1b) evidenced the presence of oxygenated groups (as expected) and of sp2 carbon atoms (which should constitute the core of the CDs). Moreover, the Gly functionalization is confirmed compatible with the presence of a signal around 65 ppm, attributable to the CH2 group of this amino acid [30].
As regards the well-known ability of fluorescence emission of CDs, Gly@CDs show a fluorescence emission at about 450 nm (Figure 1c), nearly independent of the excitation wavelength (the shift to longer-emission λ with increasing the excitation wavelength corresponds simply to a cut of the emission spectrum due to the incident radiation). The sharp peaks at lower wavelengths are due to the Raman emission of water [31], whose emission wavelength depends on the excitation one.
A comparison between the SEM images of non-functionalized nanostructures (Figure 2a) and the solid aggregates of Gly-capped ones (Figure 2b) shows the formation of quite large clusters (around 100 nm) after covalent functionalization, as homogenous nanopetals, which are organized in a flower-like microstructure. This behavior is not unusual [32], so that some authors describe them as supra-CDs [33,34].
As expected, the EDS mapping of the solid aggregates of Gly-capped CDs (Figure 2c) shows the homogeneous presence of C and O as the main elements (61.6 w% and 25.9 w%, respectively) throughout the sampled area, with the only meaningful spurious signal assigned to the presence of Na (10.3 w%) as a residue of both the synthesis (NaOH) and the last neutralization step (NaHCO3) of the Gly@CDs. On the other hand, EDS analyses do not evidence the presence of N (ascribable to the glycine capping), likely due to the relatively low amount of the loaded amino acid.

3.2. Carbon Dots in Tryptophan Electrochemical Sensors

Generally, in the literature [20,21,22,23,24,25], a substrate non-specific interaction between the CDs surface and the analyte is exploited, as reported in the introduction. The surface covalent functionalization of carbon dots with an amino acid (e.g., glycine) should allow establishing a specific interaction with the amino acid tryptophan, permitting its determination with higher sensitivity. In particular, glycine, the only non-chiral amino acid has been selected to avoid possible enantioselective interactions.
This assumption has been demonstrated by the comparison between the differential pulse voltammetry (DPV) curves of a tryptophan solution (1.0 × 10⁻³ mol L−1) carried out using a GCE modified with CDs electrochemically obtained from ethanol (CDs-GCE) and another one modified with CDs electrochemically obtained from ethanol and post-functionalized with Gly (Gly@CDs-GCE) (Figure 3). The presence of glycine allowed for an increase in the peak current (27%) and a posticipation (66 mV) of the oxidation peak potential (vide infra).

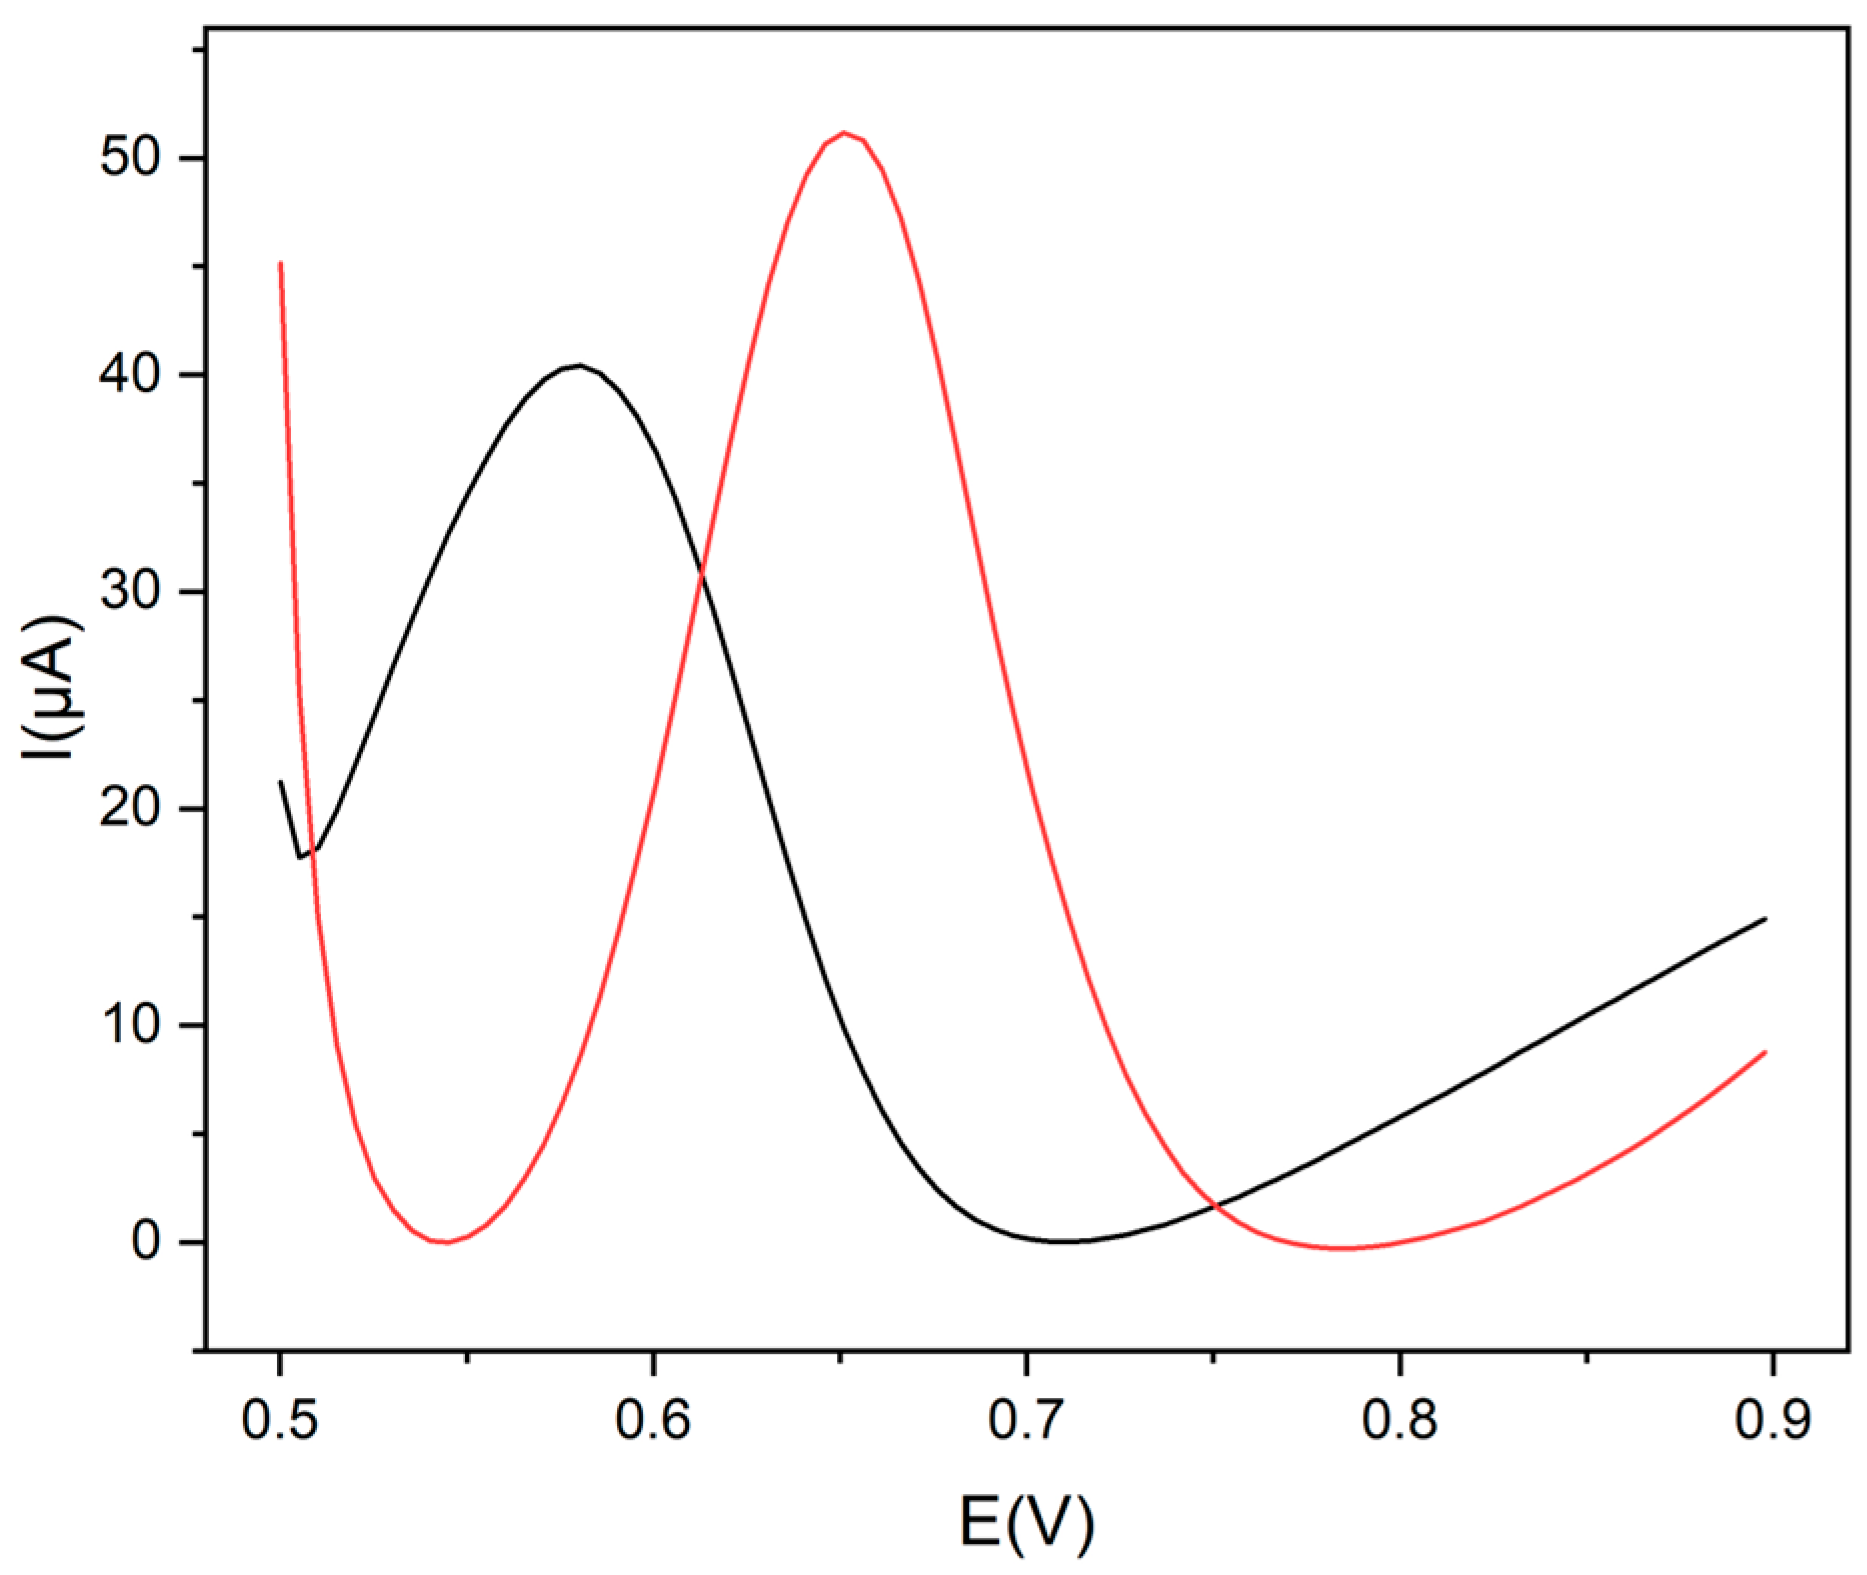
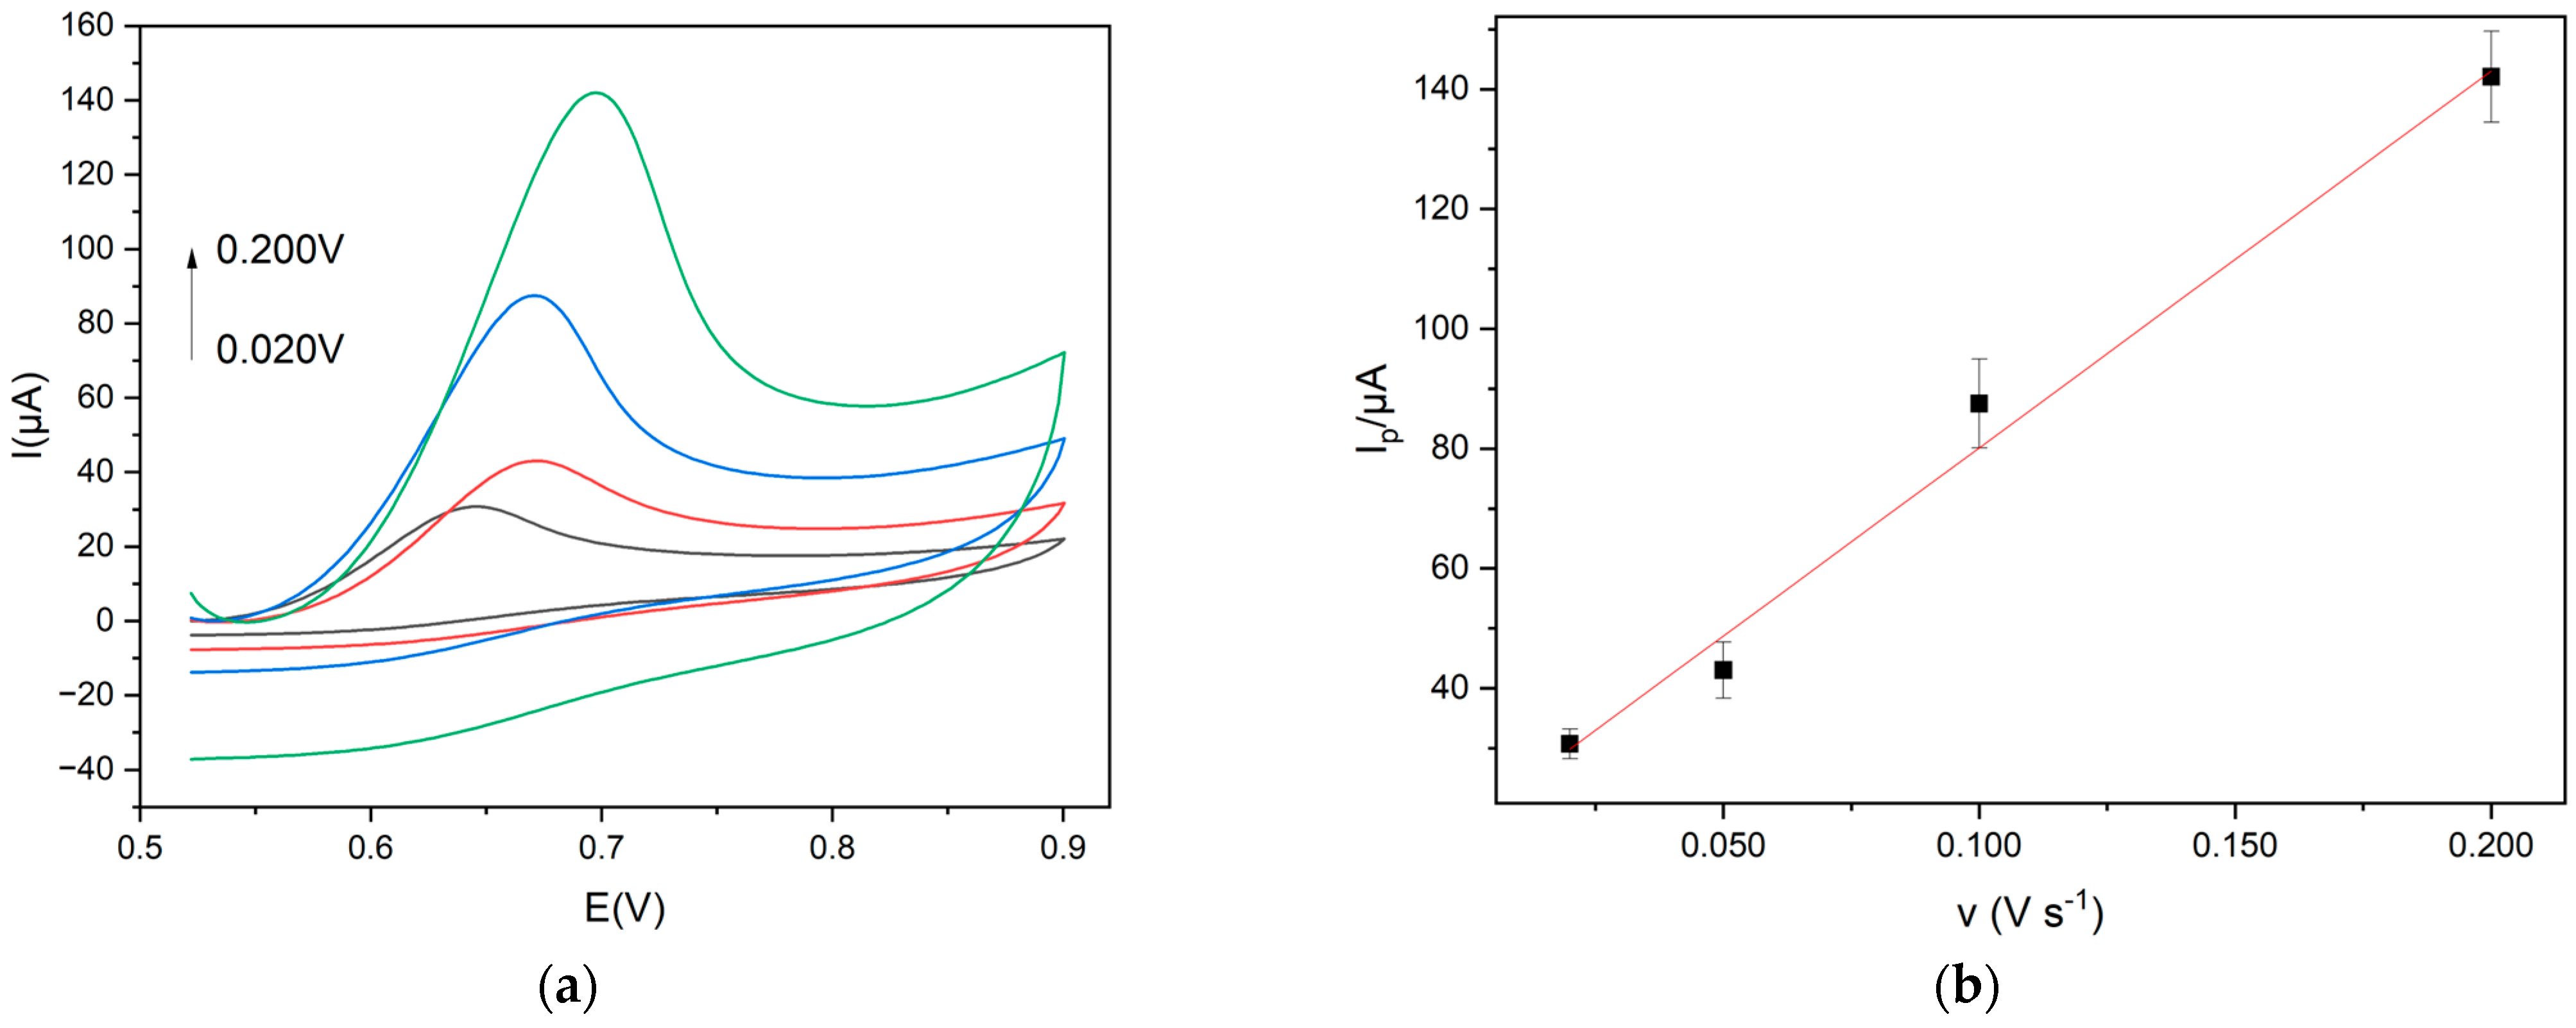
3.3. Electrochemical Characterization of Gly@CDs-GCE

The CDs functionalized with Gly were used as nanocarbon material for modifying the electrode surface. GCE was modified following the electrodeposition method [16], and the efficacy of the electrode modification was investigated by cyclic voltammetry (CV) at 0.020 V s−1 and K3[Fe(CN)6] (1 × 10⁻² mol L−1) was selected as a redox probe. The anodic peak current increased by 30.0%, indicating that an electrochemical activation of the electrode surface guarantees an effective CDs deposition. It is well known that the current increase is correlated with a higher surface area of electrodes modified with a nanomaterial [26]. The corresponding surface area of Gly@CDs-GCE, calculated using the Randles–Sevcik equation [35], was 2.40 × 10⁻² cm2, while the surface area of the bare electrode was 1.79 × 10⁻² cm2 with an increase of 34%.
A linear plot of Iap vs. v1/2 was obtained, indicating a diffusion-controlled process for the redox probe, which is in agreement with the literature [26,35], as reported in Figure 4. Iap is the anodic peak current intensity and v is the scan rate in the range 0.02–0.50 V s−1.

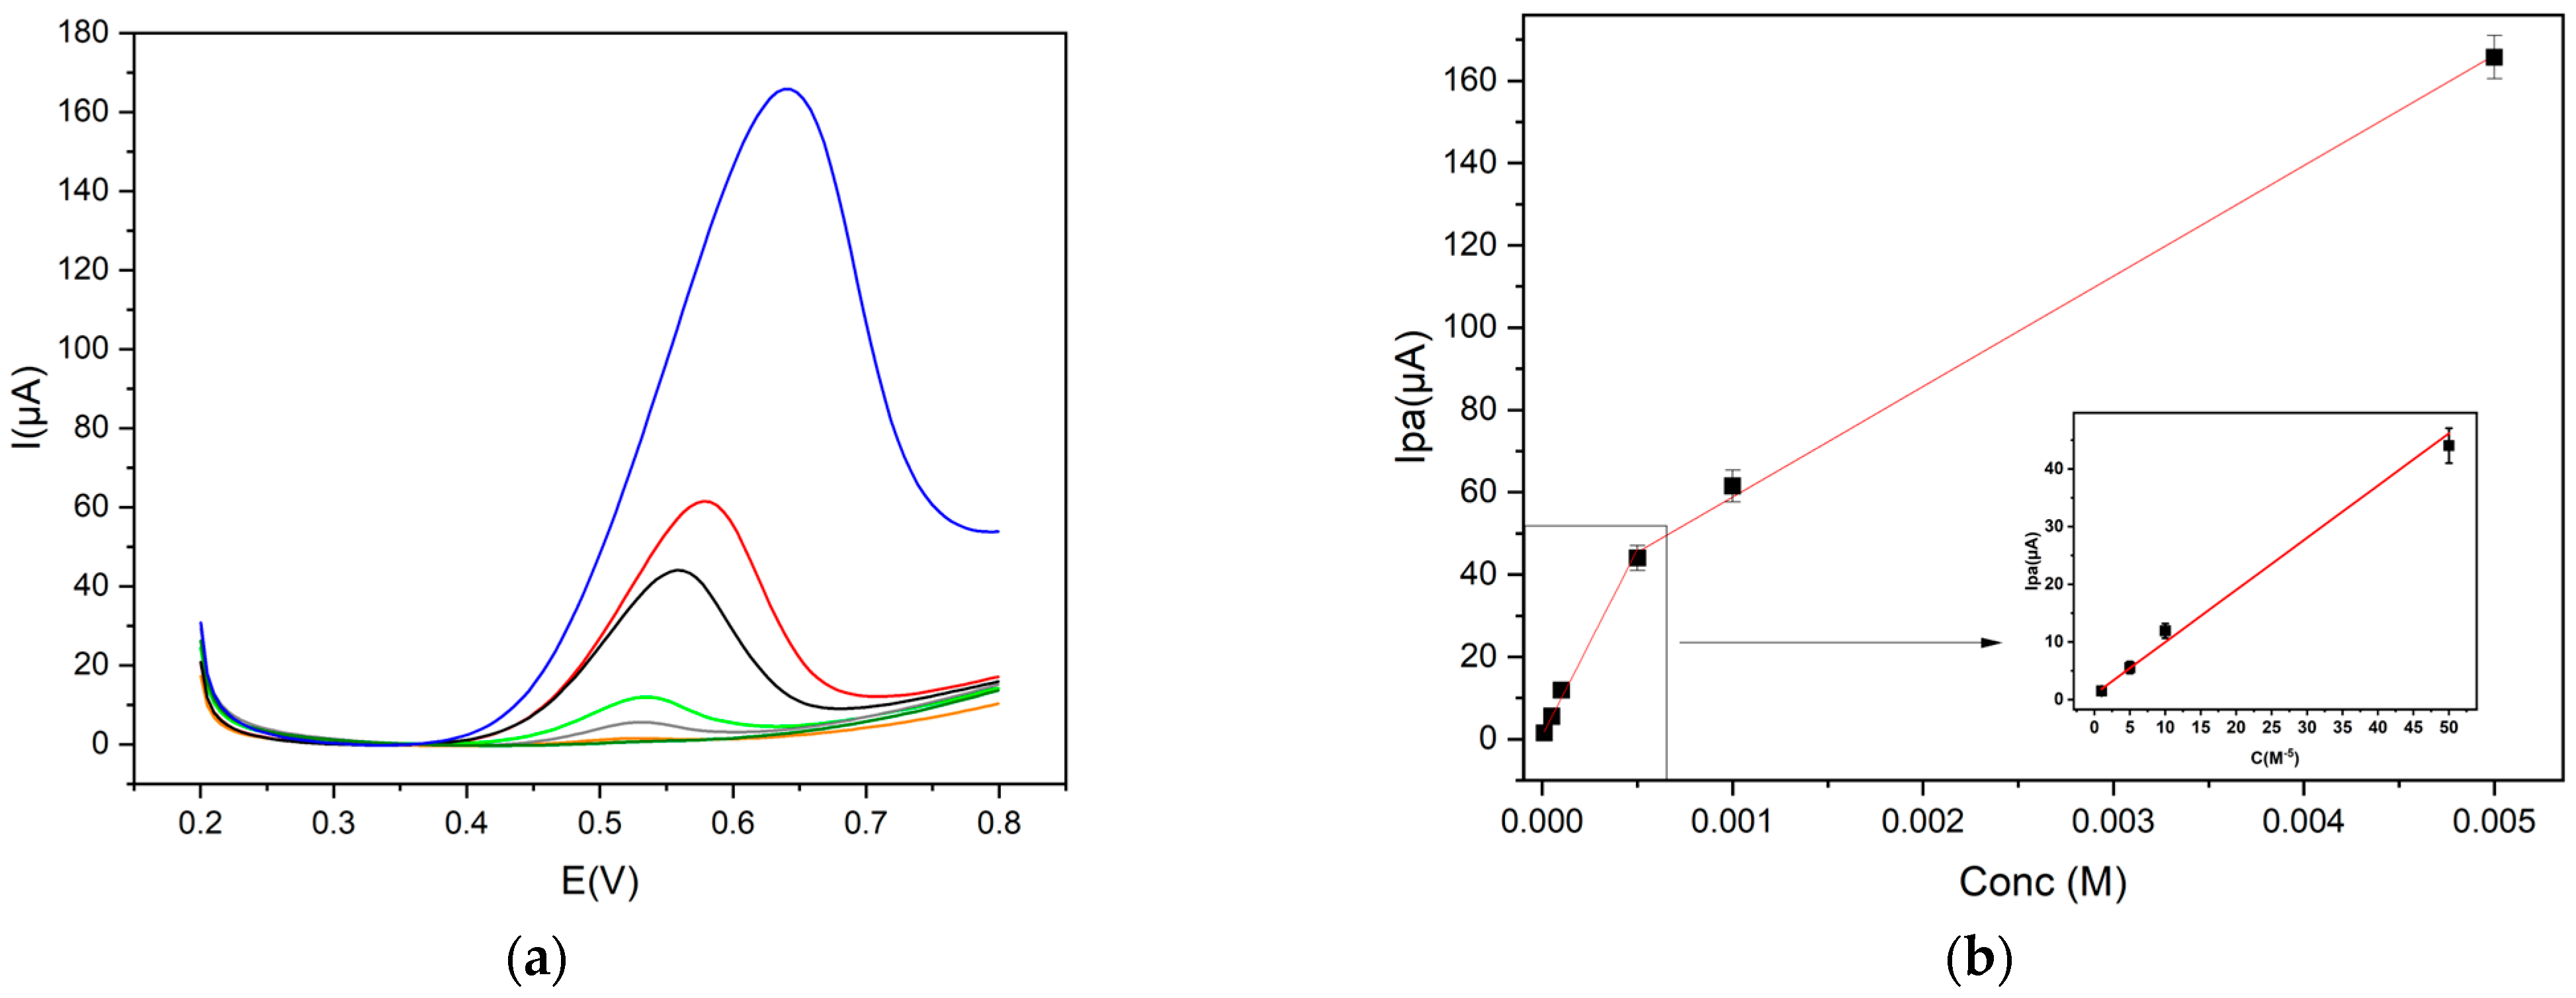
3.4. Electro-Oxidation Performance of Trp at Gly@CDs-GCE

It is well known in the literature [1] that the electrochemical oxidation mechanism of amino acids involves an irreversible and multistage reaction. To optimize the experimental conditions for the Trp detection, the influence of the pH value of the supporting electrolyte solution (in range of 3.0–9.0) on the electrochemical parameters of the Trp oxidation peak (such as current intensity and peak potential) was analyzed. A Trp solution (1.0 × 10⁻³ mol L−1) was examined, as reported in Table 1. In particular, the Trp behavior at bare and modified GC electrodes was analyzed. A general increase in current intensity was observed in the selected pH range at Gly@CDs-GCE compared to the unmodified GCE. Considering the potential peak value, a shift in the order of 30–40 mV at max has been evidenced. In light of these measurements, pH 9 was selected for two reasons: a more negative peak potential value and a higher current increase than the unmodified electrode. It should be noted that at pH 9, the peak current intensity is higher than at pH 3, in the case of both the bare and the modified electrode, even if the current increase is greater at pH 3.
To further analyze the electrochemical oxidation mechanism of Trp at the modified electrode, the effect of scan rate on the oxidation current of Trp was investigated. It is well-known that in the electroxidation of Trp on a pyrolytic graphite electrode (PGE), the adsorption of both Trp and its oxidation products was observed [36]. In the present case, the peak current increased linearly with the sweep rate from 0.02 to 0.2 V s−1 (Figure 5), indicating that an adsorption-controlled process of either Trp or its oxidation products rules the electrochemical oxidation of Trp, according to the literature for amino acids [37].
DPV, as a more sensitive electrochemical technique, was selected for the successive electrochemical analyses. Step potential, modulation amplitude, modulation time and scan rate were optimized as 0.004 V, 0.025 V, 0.05 s and 0.02 V s−1, respectively. The analysis of Trp was thus carried out by DPV at Gly@CDs-GCE in buffer 0.1 mol L−1 pH 9.
The calibration curves were obtained according to a protocol already reported in the literature [16,28], including six repeated DPV measurements for each point of the curve, in the concentration range 5 × 10⁻⁶–5 × 10⁻³ mol L−1.
Trp has two calibration curves, depending on the concentration range (Figure 6b). A satisfactory linearity was found in the range 1 × 10⁻⁵–5 × 10⁻⁴ mol L−1 and the corresponding linear equation was Ip = 90,454.37 C + 0.94 (R2 = 0.979), while in the range 5 × 10⁻⁴–5 × 10⁻³ mol L−1, the linear equation was Ip = 26,841.92 C + 32.06 (R2 = 0.996). The limit of detection (LOD) was 5.0 × 10⁻⁶ mol L−1, as shown in Figure 6.
Compared with the recent examples reported in Table 2, Gly@CDs-GCE shows interesting detection performance, especially the wide linear range.
The effect of possible interfering compounds was evaluated. Chlorogenic acid, caffeic acid, rutin, catechin, quercetin, gallic acid and ascorbic acid were tested as possible interfering molecules at the same concentration as Trp. They did not affect the determination of Trp because their oxidation peak potentials were quite different from those of Trp (see Figure 7).
The repeatability of the DPV measurements was investigated using 10 successive calibration curves for Trp [28]. A relative standard deviation (RSD%) value of 3.8 indicates good repeatability.
The reproducibility of the sensor response was evaluated for seven electrodes (n = 7) [28], using a 2.0 × 10⁻⁴ mol L−1 solution of Trp, a satisfactory RSD value of 2.8% was found, evidencing a reliable sensor assembling.
The storage stability was studied at +4 °C under wet conditions and at room temperature (RT) under dry conditions, according to a procedure reported in the literature [28]. The response of five sensors (n = 5) stored at +4 °C under wet conditions to 2.0 × 10⁻⁴ mol L−1 Trp concentration was examined every 2 days for 10 days. After 10 days, the electrochemical response decreased by 55% on average. The response of the sensor stored at RT in dry conditions was analyzed every 2 days for 10 days, with a final decrease of almost 80%.
The tryptophan sensor was then applied to a dietary supplement sample and it provided results consistent with those obtained by the HPLC-ESI/MS method. A Trp concentration of (3.03 ± 0.09) × 10−3 mol L−1 was determined by the electrochemical sensor and it was comparable to that determined by the HPLC-ESI/MS method [(2.89 ± 0.22) × 10−3 mol L−1].
Less satisfactory results were obtained for the determination of Trp in herbal tea, regarding the analyte amount between the electrochemical and the HPLC ESI-MS measurements.
For the detection of Trp in the herbal tea, a difference in the measurement was observed between electrochemical [(2.6 ± 0.36) × 10−4 mol L−1] and HPLC-ESI-MS [(3.1 ± 0.11) × 10−3 mol L−1] analysis. This was due to a matrix effect (ME). The ME was evaluated by HPLC-MS as detailed in the literature [16], using a calibration curve obtained in the matrix by spiking increasing amounts of Trp. An ME of −26.50% was obtained confirming a medium effect [42]. Furthermore, the recovery study carried out by electrochemical analysis provided a result of 47%, indicating a significant impact of the matrix on Trp quantification using the suggested sensor. This is probably due to the presence of sterically bulky molecules soluble or partially soluble in water, such as polysaccharides [29], and not electrochemically active, that could slow or even hinder the diffusion of the analyte to the electrode.
DPVs obtained from the sensor were recorded both before and after adding specified concentrations of Trp in the herbal tea solution, as illustrated in Figure 8.

4. Conclusions

In the present work, a glassy carbon electrode modified with clusters of glycine-capped carbon dots (Gly@CDs-GCE) has been assembled for determining Trp in a basic solution by DPV. To our knowledge, it is the first example of a GCE modified with Gly@CDs clusters used for the analysis of Trp in real samples.
A satisfactory linearity range, a limit of detection appropriate for Trp determination in a dietary supplement, and good results in terms of storage stability, reproducibility, repeatability and response towards some common interferent molecules were obtained.
The application of Gly@CDs-GCE to real samples of a dietary supplement provided analytical data in very good agreement with those obtained by HPLC-ESI/MS. In addition, the electrochemical sensor provides several advantages in terms of cheapness, portability, ease of use and not requiring sophisticated and expensive instruments and skilled personnel.
However, it must be stressed that the study carried out is preliminary for the realization of sensors for the determination of tryptophan in real matrices, using disposable screen-printed electrodes.

Author Contributions

Conceptualization, A.C., R.P. and M.F.; methodology, M.B., A.C. and M.F.; validation, M.B., A.C. and M.F.; investigation, M.B, P.D.M., P.M., A.T. and F.V.; data curation, P.D.M., P.M. and A.T.; writing—original draft preparation, A.C. and M.F.; writing—review and editing, A.C., M.B. and R.P.; supervision, R.P.; funding acquisition, M.F. All authors have read and agreed to the published version of the manuscript.

Funding

Sapienza University Project number RP123188D2918E8F funded this research.

Institutional Review Board Statement

Not applicable.

Informed Consent Statement

Not applicable.

Data Availability Statement

Data is contained within the article.

Acknowledgments

The authors thank Matteo Bonomo for his support with SEM-EDS analysis.

Conflicts of Interest

The authors declare no conflicts of interest.

References

  1. Moulaee, K.; Neri, G. Electrochemical Amino Acid Sensing: A Review on Challenges and Achievements. Biosensors 2021, 11, 502. [Google Scholar] [CrossRef] [PubMed]
  2. Kalzuna-Czaplinska, J.; Gatarek, P.; Chirumbolo, S.; Stanley Chartrand, M.; Bjørklund, G. How important is tryptophan in human health? Crit. Rev. Food Sci. Nutr. 2019, 59, 72–88. [Google Scholar] [CrossRef] [PubMed]
  3. Wang, H.; Jiang, S.; Pan, J.; Lin, J.; Wang, J.; Li, M.; Xie, A.; Luo, S. Nanomaterials-based electrochemical sensors for the detection of natural antioxidants in food and biological samples: Research progress. Microchim. Acta 2022, 189, 318. [Google Scholar] [CrossRef] [PubMed]
  4. Rejithamol, R.; Krishnan, R.G.; Beena, S. Disposable pencil graphite electrode decorated with a thin film of electro-polymerized 2, 3, 4, 6, 7, 8, 9, 10-octahydropyrimido [1, 2-a] azepine for simultaneous voltammetric analysis of dopamine, serotonin and tryptophan. Mater. Chem. Phys. 2021, 258, 123857. [Google Scholar] [CrossRef]
  5. Roy, P.; Chen, P.-C.; Periasamy, A.P.; Chen, Y.-N.; Chang, H.-T. Photoluminescent carbon nanodots: Synthesis, physicochemical properties and analytical applications. Mater. Today 2015, 18, 447–458. [Google Scholar] [CrossRef]
  6. Barman, M.K.; Patra, A. Current status and prospects on chemical structure driven photoluminescence behaviour of carbon dots. J. Photochem. Photobiol. C Photochem. Rev. 2018, 37, 1–22. [Google Scholar] [CrossRef]
  7. Sharma, A.; Das, J. Small molecules derived carbon dots: Synthesis and applications in sensing, catalysis, imaging, and biomedicine. J. Nanobiotechnol. 2019, 17, 92. [Google Scholar] [CrossRef] [PubMed]
  8. Yao, B.; Huang, H.; Liu, Y.; Kang, Z. Carbon Dots: A Small Conundrum. Trends Chem. 2019, 1, 235–246. [Google Scholar] [CrossRef]
  9. Sturabotti, E.; Camilli, A.; Moldoveanu, V.G.; Bonincontro, G.; Simonetti, G.; Valletta, A.; Serangeli, I.; Miranda, E.; Amato, F.; Marrani, A.G.; et al. Targeting the Antifungal Activity of Carbon Dots against Candida albicans Biofilm Formation by Tailoring Their Surface Functional Groups. Chem. Eur. J. 2024, 30, e202303631. [Google Scholar] [CrossRef]
  10. Wang, X.; Feng, Y.; Dong, P.; Huang, J. A Mini Review on Carbon Quantum Dots: Preparation, Properties, and Electrocatalytic Application. Front. Chem. Sec. Catal. Photocatal. 2019, 7, 671. [Google Scholar] [CrossRef]
  11. Yu, J.; Song, H.; Li, X.; Tang, L.; Tang, Z.; Yang, B.; Lu, S. Computational Studies on Carbon Dots Electrocatalysis: A Review. Adv. Funct. Mater. 2021, 31, 2107196. [Google Scholar] [CrossRef]
  12. Cui, L.; Ren, X.; Sun, M.; Liu, H.; Xia, L. Carbon Dots: Synthesis, Properties and Applications. Nanomaterials 2021, 11, 3419. [Google Scholar] [CrossRef] [PubMed]
  13. Bortolami, M.; Bogles, I.I.; Bombelli, C.; Pandolfi, F.; Feroci, M.; Vetica, F. Electrochemical Bottom-Up Synthesis of Chiral Carbon Dots from L-Proline and Their Application as Nano-Organocatalysts in a Stereoselective Aldol Reaction. Molecules 2022, 27, 5150. [Google Scholar] [CrossRef] [PubMed]
  14. Bortolami, M.; Rocco, D.; Simonis, B.; Feroci, M.; Vetica, F. Organocatalyzed Mannich reaction: Electrochemically synthesized prolinated carbon dots vs. prolinated graphene oxide. Synth. Commun. 2023, 53, 1647–1663. [Google Scholar] [CrossRef]
  15. Zulfajri, M.; Sudewi, S.; Ismulyati, S.; Rasool, A.; Adlim, M.; Huang, G.G. Carbon Dot/Polymer Composites with Various Precursors and Their Sensing Applications: A Review. Coatings 2021, 11, 1100. [Google Scholar] [CrossRef]
  16. Di Matteo, P.; Trani, A.; Bortolami, M.; Feroci, M.; Petrucci, R.; Curulli, A. Electrochemical Sensing Platform Based on Carbon Dots for the Simultaneous Determination of Theophylline and Caffeine in Tea. Sensors 2023, 23, 7731. [Google Scholar] [CrossRef] [PubMed]
  17. The Nobel Prize in Chemistry. Available online: https://www.nobelprize.org/prizes/chemistry/ (accessed on 25 June 2024).
  18. Rocco, D.; Moldoveanu, V.G.; Feroci, M.; Bortolami, M.; Vetica, F. Electrochemical Synthesis of Carbon Quantum Dots. ChemElectroChem 2023, 10, e202201104. [Google Scholar] [CrossRef] [PubMed]
  19. Xia, C.; Zhu, S.; Feng, T.; Yang, M.; Yang, B. Evolution and Synthesis of Carbon Dots: From Carbon Dots to Carbonized Polymer Dots. Adv. Sci. 2019, 6, 1901316. [Google Scholar] [CrossRef] [PubMed]
  20. Imanzadeh, H.; Sefid-Sefidehkhan, Y.; Afshary, H.; Afruz, A.; Amiri, M. Nanomaterial-based electrochemical sensors for detection of amino acids. J. Pharm. Biomed. Anal. 2023, 230, 115390. [Google Scholar] [CrossRef]
  21. Gautam, J.; Raj, M.; Goyal, R.N. Determination of Tryptophan at Carbon Nanomaterials Modified Glassy Carbon Sensors: A Comparison. J. Electrochem. Soc. 2020, 167, 066504. [Google Scholar] [CrossRef]
  22. Hassanvand, Z.; Jalali, F.; Nazari, M.; Parnianchi, F.; Santoro, C. Carbon Nanodots in Electrochemical Sensors and Biosensors: A Review. ChemElectroChem 2021, 8, 15–35. [Google Scholar] [CrossRef]
  23. Chen, J.; He, P.; Bai, H.; He, S.; Zhang, T.; Zhang, X.; Dong, F. Poly(β-cyclodextrin)/carbon quantum dots modified glassy carbon electrode: Preparation, characterization and simultaneous electrochemical determination of dopamine, uric acid and tryptophan. Sens. Actuators B 2017, 252, 9–16. [Google Scholar] [CrossRef]
  24. Wang, Z.; An, R.; Dai, Y.; Luo, H. A Simple Strategy for the Simultaneous Determination of Dopamine, Uric Acid, L-Tryptophan and Theophylline Based on a Carbon Dots Modified Electrode. Int. J. Electrochem. Sci. 2021, 16, 210450. [Google Scholar] [CrossRef]
  25. Abdel-aal, F.A.M.; Kamel, R.M.; Abdeltawab, A.A.; Mohamed, F.A.; Mohamed, A.-M.I. Polypyrrole/carbon dot nanocomposite as an electrochemical biosensor for liquid biopsy analysis of tryptophan in the human serum of normal and breast cancer women. Anal. Bioanal. Chem. 2023, 415, 4985–5001. [Google Scholar] [CrossRef] [PubMed]
  26. Tian, R.; Zhi, J. Fabrication and electrochemical properties of boron-doped diamond film–gold nanoparticle array hybrid electrode. Electrochem. Commun. 2007, 9, 1120–1126. [Google Scholar] [CrossRef]
  27. Dekanski, A.; Stevanovic, J.; Stevanovic, R.; Nikolic, B.Z. Glassy carbon electrodes I. Characterization and electrochemical activation. Carbon 2001, 39, 1195–1205. [Google Scholar] [CrossRef]
  28. Mocak, J.; Bond, A.M.; Mitchell, S.; Scollary, G. A statistical overview of standard (IUPAC and ACS) and new procedures for determining the limits of detection and quantification: Application to voltammetric and stripping techniques. Pure Appl. Chem. 1997, 69, 297–328. [Google Scholar] [CrossRef]
  29. Bortolami, M.; Di Matteo, P.; Rocco, D.; Feroci, M.; Petrucci, R. Metabolic Profile of Agropyron repens (L.) P. Beauv. Rhizome Herbal Tea by HPLC-PDA-ESI-MS/MS Analysis. Molecules 2022, 27, 4962. [Google Scholar] [CrossRef] [PubMed]
  30. Strohmeier, M.; Alderman, D.W.; Grant, D.M. Obtaining Molecular and Structural Information from 13C-14N Systems with 13C FIREMAT Experiments. J. Magn. Res. 2002, 155, 263–277. [Google Scholar] [CrossRef]
  31. Murphy, K.R. A Note on Determining the Extent of the Water Raman Peak in Fluorescence Spectroscopy. Appl. Spectrosc. 2011, 65, 233–236. [Google Scholar] [CrossRef]
  32. Vázquez-Nakagawa, M.; Rodríguez-Pérez, L.; Martín, N.; Ángeles Herranz, M. Supramolecular Assembly of Edge Functionalized Top-Down Chiral Graphene Quantum Dots. Angew. Chem. Int. Ed. 2022, 61, e202211365. [Google Scholar] [CrossRef] [PubMed]
  33. Li, D.; Han, D.; Qu, S.-N.; Liu, L.; Jing, P.-T.; Zhou, D.; Ji, W.-Y.; Wang, X.-Y.; Zhang, T.-F.; Shen, D.-Z. Supra-(carbon nanodots) with a strong visible to near-infrared absorption band and efficient photothermal conversion. Light Sci. Appl. 2016, 5, e16120. [Google Scholar] [CrossRef] [PubMed]
  34. Li, D.; Qu, Y.; Zhang, Y.; Zheng, W.; Rogach, A.L.; Qu, S. Supra-(carbon dots) with versatile morphologies and promising optical properties. Chem. Eng. J. 2023, 454, 140069. [Google Scholar] [CrossRef]
  35. Bard, A.J.; Faulkner, L.R. Electrochemical Methods Fundamentals and Application; John Wiley & Sons: New York, NY, USA, 2001. [Google Scholar]
  36. Nguyen, N.T.; Wrona, M.Z.; Dryhurst, G. Electrochemical oxidation of tryptophan. J. Electroanal. Chem. 1986, 199, 101–126. [Google Scholar] [CrossRef]
  37. Wopschall, R.H.; Shain, I. Effects of adsorption of electroactive species in stationary electrode polarography. Anal. Chem. 1967, 39, 1514–1527. [Google Scholar] [CrossRef]
  38. Mattioli, I.A.; Baccarin, M.; Cervini, P.; Cavalheiro, E.T.G. Electrochemical investigation of a graphite-polyurethane composite electrode modified with electrodeposited gold nanoparticles in the voltammetric determination of tryptophan. J. Electroanal. Chem. 2019, 835, 212–219. [Google Scholar] [CrossRef]
  39. Qian, J.; Yang, J.; Zhang, Y.; Zeng, T.; Wan, Q.; Yang, N. Interfacial superassembly of flower-like NiMn-LDH@poly-L-lysine composites for selective electrochemical sensing of tryptophan. Anal. Chim. Acta 2023, 1237, 340608. [Google Scholar] [CrossRef] [PubMed]
  40. Foroughi, M.M.; Jahani, S.; Rashidi, S. Simultaneous detection of ascorbic acid, dopamine, acetaminophen and tryptophan using a screen-printed electrode modified with woolen ball-shaped La3+/TiO2 nanostructure as a quadruplet nanosensor. Microchem. J. 2024, 198, 110156. [Google Scholar] [CrossRef]
  41. Kodakat, K.; Sam, S.; Kumar, K.G. A Poly(L-Arginine)-Based Electrochemical Sensor for Simultaneous Determination of Uric Acid, Tryptophan, and Hypoxanthine. J. Electrochem. Soc. 2024, 171, 017509. [Google Scholar] [CrossRef]
  42. Zhang, R.; Tan, Z.-C.; Huang, K.-C.; Wen, Y.; Li, X.-Y.; Zhao, J.-L.; Liu, C.-L. A Vortex-Assisted Dispersive Liquid-Liquid Microextraction Followed by UPLC-MS/MS for Simultaneous Determination of Pesticides and Aflatoxins in Herbal Tea. Molecules 2019, 24, 1029. [Google Scholar] [CrossRef]
Figure 1. (a) Superimposed IR spectra of Gly@CDs powder (blue curve) and of non-functionalized powder CDs (red curve). The transmittance scale is not the same for the two spectra, which are staggered for a better comprehension; (b) solid-state 1H-13C CP-MAS NMR of pure Gly@CDs obtained with a contact time of 1.0 ms; (c) fluorescence emission spectra of Gly@CDs (in water solution) at variable excitation wavelength. The color code corresponds to the excitation wavelength (nm).
Chemosensors 12 00149 g001
Figure 2. (a) SEM image of electrochemically synthesized non-functionalized CDs; (b) solid-state SEM of Gly@CDs powder; (c) EDS analysis of Gly@CDs powder.
Chemosensors 12 00149 g002
Figure 3. DPV voltammograms of Trp, 1.0 × 10⁻³ mol L−1, in 0.1 mol L−1 buffer pH 9 at Gly@CDs-GCE (red line) and at CDs-GCE (black line).
Chemosensors 12 00149 g003
Figure 4. (a) Cyclic voltammograms (scan rates: 0.020 V s−1 red line; 0.050 V s−1 green line; 0.100 V s−1 black line; 0.200 V s−1 blue line) and (b) linear plot Iap vs. v 1/2 of 1.0 × 10⁻² mol L−1 K3[Fe(CN)6] at Gly@CDs-GCE in 0.1 M KCl solution at different scan rates.
Chemosensors 12 00149 g004
Figure 5. (a) Cyclic voltammograms (scan rates: 0.020 V s−1 black line; 0.050 V s−1 red line; 0.100 V s−1 blue line; 0.200 V s−1 green line) and (b) linear plot Iap vs. v of Trp 1.0 × 10⁻³ mol L−1, in 0.1 mol L−1 buffer pH 9 at Gly@CDs-GCE at different scan rates.
Chemosensors 12 00149 g005
Figure 6. (a) DPV profiles (Trp concentration: 1 × 10⁻⁵ mol L−1 orange line; 5 × 10⁻⁵ mol L−1 grey line; 1 × 10⁻⁴ mol L−1 green line; 5 × 10⁻⁴ mol L−1 black line; 1 × 10⁻³ mol L−1 red line; 5 × 10⁻³ mol L−1 blue line) and (b) calibration curves of Trp in 0.1 mol L−1 buffer pH 9, concentrations range 5 × 10⁻⁶–5 × 10⁻³ mol L−1, at Gly@CDs-GCE by DPV measurements (step potential 0.004 V, modulation amplitude 0.025 V, modulation time 0.05 s and scan rate 0.02 V s−1, vs Ag/AgCl).
Chemosensors 12 00149 g006
Figure 7. DPV voltammograms of Trp 1.0 × 10⁻³ mol L−1 and rutin 1.0 × 10⁻³ mol L−1, in 0.1 mol L−1 buffer pH 9 at Gly@CDs-GCE.
Chemosensors 12 00149 g007
Figure 8. DPV voltammograms of Trp in herbal tea recorded at Gly@CDs-GCE: herbal tea sample (black line); herbal tea sample + Trp 2.6 × 10⁻⁴ mol L−1 (red line); and herbal tea sample + Trp 5.8 × 10⁻⁴ mol L−1 (blue line).
Chemosensors 12 00149 g008
Table 1. Cyclic Voltammetry (CV) data of tryptophan in different buffer solutions (pH 3, 5, 7, 9) at bare and modified electrodes. [Tryptophan] = 1.0 × 10⁻³ mol L−1, scan rate 0.02 V s−1.
Bare Electrode (GCE)Eap (V)Iap (μA)Modified GCE (Gly@CDs-GCE)Eap (V)ΔEap (V)Iap (μA)ΔIap (%)
pH 30.8292.43pH 30.8340.00510.05313
pH 50.74430.27pH 50.741−0.00330.591.05
pH 70.67512.72pH 70.6900.01515.4321.3
pH 90.60914.31pH 90.6410.03223.7165.70
Table 2. Performance comparison of different sensors for Trp monitoring.
ElectrodeTechniqueLinearity (mol L−1)LOD (mol L−1)ApplicationRef.
AuNPs/EGPUDPV2.0 × 10−6–1.0 × 10−55.3 × 10−8Urine, pharmaceutical formulation[38]
NiMn-LDH@PLL/GCEDPV0.1 × 10−6–1.3 × 10−45.3 × 10−8Urine, pharmaceutical formulation[39]
WB-S La3+/TiO2-NS/SPEDPV1.0 × 10−7–9.0 × 10−48.4 × 10−8Pharmaceutical formulation[40]
p-Arg/GCESWV6.0 × 10−7–6.0 × 10−54.4 × 10−8Dietary Supplement[41]
Gly@CDs-GCEDPV5.0 × 10−6–5.0 × 10−35.0 × 10−6Dietary Supplement, herbal teaThis work
AuNPs: gold nanoparticles; EGPU: graphite–polyurethane composite electrode; NiMn-LDH@PLL: NiMn-layered double hydroxide@poly-L-lysine; GCE: glassy carbon electrode; WB-S La3+/TiO2-NS: Woollen ball-shaped La3+/TiO2 nanostructure; SPE: screen-printed electrode; p-Arg: poly(L-Arginine); DPV: differential pulse voltammetry; SWV: square wave voltammetry.
Disclaimer/Publisher’s Note: The statements, opinions and data contained in all publications are solely those of the individual author(s) and contributor(s) and not of MDPI and/or the editor(s). MDPI and/or the editor(s) disclaim responsibility for any injury to people or property resulting from any ideas, methods, instructions or products referred to in the content.

