Article

Effects of Au Addition to Porous CuO2-Added SnO2 Gas Sensors on Their VOC-Sensing Properties

1
Graduate School of Integrated Science and Technology, Nagasaki University, 1-14 Bunkyo-machi, Nagasaki 852-8521, Japan
2
Graduate School of Engineering, Nagasaki University, 1-14 Bunkyo-machi, Nagasaki 852-8521, Japan
*
Author to whom correspondence should be addressed.
Chemosensors 2024, 12(8), 153; https://doi.org/10.3390/chemosensors12080153
Submission received: 30 June 2024 / Revised: 31 July 2024 / Accepted: 4 August 2024 / Published: 6 August 2024
(This article belongs to the Special Issue Advances in Gas Sensors and their Application)

Abstract

:
The effects of Au addition on the acetone response of Cu2O-added porous SnO2 (pr-Cu2O-SnO2) powders, which were synthesized by ultrasonic spray pyrolysis employing polymethyl methacrylate microspheres as a template, were investigated in this study. The 3.0 wt% Au-added pr-Cu2O-SnO2 sensor showed the largest acetone response among all sensors. In addition, the magnitude of the acetone response was much larger than those of the ethanol and toluene responses. The catalytic activities of these gases over Au-added pr-Cu2O-SnO2 powders were also examined to clarify the key factors affecting their acetone-sensing properties. The Au addition increased the complete oxidation activity of all gases, and the complete oxidation activity of acetone was much higher than those of ethanol and toluene. These results indicate that the oxidation behavior during the gas-diffusion process in the sensitive Au-added pr-Cu2O-SnO2 layer of the sensors is quite important in enhancing the acetone-sensing properties.

1. Introduction

Exhaled breath contains trace amounts of many volatile organic compounds (VOCs), and specific diseases are associated with higher concentrations of certain VOCs [1,2,3]. Especially, the concentration of acetone in the exhaled breath increases from 300 to 900 ppb for healthy people to more than 1800 ppb for diabetic patients [4,5,6,7,8]. This is related to insufficient insulin secretion, which requires the human body to use lipids as an energy source instead of carbohydrates [5,6,7]. Acetone is also produced as a byproduct of the lipid metabolism, and the increased acetone concentration in the blood results in its release from the body. Therefore, the development of sensitive and selective acetone sensors has been extensively studied for the non-invasive detection of diabetic patients. Semiconductor gas sensors are among the most studied all over the world owing to their advantages, such as compactness and low cost [8,9,10,11,12,13,14,15,16,17,18,19,20,21,22,23,24,25,26,27,28,29,30,31]. The sensor signal of semiconductor gas sensors arises from the resistance change of metal oxides attached to interdigitated electrodes. The resistance of n-type metal oxides decreases due to the oxidation of VOCs with negatively charged oxygen adsorbates on their surface, because free electrons are released back to the metal-oxide bulk. Therefore, the excellent gas diffusibility in the metal-oxide layers and the large specific surface area of the metal oxides effectively enhance the VOC-sensing properties [8,9,10,11,12,13,14,15,16,17,18,19,20,21,22,23,24,25,26,27,28,29,30,31]. Chen et al. reported that the sensor using the flower-like In2O3 powder fabricated by hydrothermal synthesis shows a four-time higher acetone response than the sensor using the conventional In2O3 powder [19]. Kim et al. reported the successful synthesis of mesoporous WO3-based nanofibers by using the electrospinning method employing apoferritin, which is a kind of protein as a nanocage template. The sensor using the Pt-loaded WO3 nanofiber which has well-developed mesopores with a diameter of ca. 23 nm shows the sensitive and selective acetone response (the ratio of the resistance in air (Ra) to that in the target gas (Ra) (Rg/Ra): ca. 59 for 1 ppm acetone) [25]. Kwak et al. studied the preparation of Tb-doped SnO2 yolk-shell powders by ultrasonic spray pyrolysis [28]. The fabricated sensor using the 5 mol% Tb-doped SnO2 powder detects a low concentration of acetone (as low as 50 ppb) under humidified conditions. Zhao et al. prepared porous (pr-) SnO2 wires by using one of mesoporous silicas, SBA-15, as a hard template. The response of the sensor using the pr-SnO2 wire to 100 ppm acetone is ca. 62 at 225 °C, which is much larger in comparison with that using the SnO2 powder fabricated without the template [29].
We synthesized spherical pr-SnO2 powders by ultrasonic spray pyrolysis employing polymethyl methacrylate (PMMA) microspheres as a template [32]. The specific surface area (SSA) of the pr-SnO2 powder is four times larger than that of the SnO2 powder fabricated by the same method without the PMMA template (denoted as d-SnO2), and the sensing response to 100 ppm acetone of the pr-SnO2 sensor is 7.3 times higher than that of the d-SnO2 sensor (ca. 8.01 at 300 °C). Furthermore, we reported that the addition of Cu2O to the pr-SnO2 powders enhances the acetone response and that the sensor using the 1.6 wt% Cu2O-added pr-SnO2 (pr-Cu2O-SnO2) powder shows the largest acetone response at 300 °C (ca. 11.4 for 100 ppm acetone). The resistance of the pr-Cu2O-SnO2 sensor is larger than that of the pr-SnO2 sensor both in N2 and in air, and the pr-Cu2O-SnO2 sensor shows a larger resistance increase than that of the pr-SnO2 sensor by changing the gas atmosphere from N2 to air. Therefore, the connections between Cu2O and SnO2 promote the transfer of free electrons from Cu2O to SnO2 and the amount of the negatively charged oxygen species on the surface of the pr-SnO2 powder. We also confirmed that the catalytic activity of acetone oxidation over the pr-SnO2 powder decreases with the addition of Cu2O, although the acetone response of the pr-Cu2O-SnO2 sensor is larger than that of the pr-SnO2 sensor. Therefore, an increase in the catalytic activity of acetone oxidation over the pr-Cu2O-SnO2 powder is expected to further increase in the acetone response [32].
In this study, we focused on the Au addition to the Cu2O-added pr-SnO2 powder in order to increase the acetone response of the sensor. Appropriate amounts of Au and Cu2O were co-added to the pr-SnO2 powders by ultrasonic spray pyrolysis employing home-made PMMA microspheres, and their sensing properties to three kinds of VOCs (acetone, ethanol, and toluene) were examined at 300–500 °C in air. In addition, the catalytic activity of VOC oxidation over the fabricated powders was evaluated, and the effects of Au addition to the Cu2O-added pr-SnO2 powders on the sensing properties were discussed on the basis of these obtained results.

2. Materials and Methods

2.1. Preparation of pr-wAu-SnO2 Powders

pr-Cu2O-added SnO2 (pr-Cu2O-SnO2) powders were synthesized by ultrasonic spray pyrolysis as reported previously [32,33,34,35,36]. The aqueous dispersion containing homemade PMMA microspheres (average particle size: 70 nm; 0.32 g dm−3; 40 cm3) was mixed with a SnCl4 aqueous solution (0.05 mol dm−3; 60 cm3) containing appropriate amounts of CuCl2 and HAuCl4. Precursor mists were obtained by ultrasonication of the aqueous precursor solution and introduced into an electric furnace at 1100 °C under flowing air (1500 cm3 min−1). After the evaporation of water and the thermal decomposition of SnCl4, CuCl2, HAuCl4, and PMMA microspheres, spherical porous SnO2-based powders were produced in an electric furnace. We have already confirmed that the Cu species mainly exists as Cu2O and that the Cu2O nanoparticles are highly dispersed in the SnO2 powder containing 1.6 wt% Cu [32]. The obtained powders were denoted as pr-wAu-Cu2O-SnO2 (w: 0.5–5.0 (wt%)), while the powder that did not contain Au (w: 0) was denoted as pr-0Au-Cu2O-SnO2. For comparison, 3 wt% Au was impregnated on the pr-Cu2O-SnO2 powder. The obtained powder was denoted as 3.0Au/pr-Cu2O-SnO2.

2.2. Sensor Fabrication and Gas-Sensing Measurements

The fabricated powder was mixed with an appropriate amount of α-terpineol, and the paste was screen-printed onto an alumina substrate equipped with a pair of interdigitated Pt electrodes (gap size: ca. 200 µm), covering an area of 10 × 10 mm2, followed by drying at 100 °C. The samples were then calcined at 550 °C for 5 h in ambient air. The fabricated sensor was assembled in a tube furnace. Gas responses of these sensors were measured to three kinds of VOCs (acetone, ethanol, and toluene; concentration: 2.5, 5.0, 10, 20, 50, and 100 ppm) balanced with dry air at a flow rate of 100 cm3 min−1 at operating temperatures of 300–500 °C. The total flow rate was fixed at 100 cm3 min−1. The resistance of the sensors was directly measured by using a data acquisition system (Keysight Technologies, Inc., Santa Rosa, CA, USA, DAQ 970A). The sensor response (Ra/Rg) was defined as the ratio of the sensor’s resistance in air (Ra) to that in VOCs balanced with air (Rg). The 90% response and recovery times (tres and trec) were defined as the time necessary to reach 90% of the steady state value of Rg and Ra, respectively.

2.3. Characterization

The microstructural images of the fabricated sensors were obtained by scanning electron microscopy (SEM; JEOL Ltd., Tokyo, Japan, JSM-7500F). The crystal phase of these powders was characterized by X-ray diffraction analysis (XRD; Rigaku Corp., Tokyo, Japan, Miniflex600-DX) using Cu Kα radiation (40 kV, 40 mA), and their crystallite size (CS) was calculated using the Scherrer equation. The specific surface area (SSA) of these powders was measured by the Brunauer–Emmett–Teller (BET) method using N2 adsorption-desorption isotherms (Micromeritics Instrument Corp., Norcross, GA, USA, Tristar3000).

2.4. Catalytic Combustion Activity

These powders were pressed into discs and then crushed into granules (ca. 20–60 mesh). The prepared granules of about 0.05 g, which were set in a fixed-bed reactor, were exposed to 100 ppm acetone, ethanol, and toluene balanced with dry air at a flow rate of 30 cm3 min−1 (gas hourly space velocity (GHSV): 12,732 h−1). The catalytic combustion behavior of the VOCs over the powders was then evaluated in the temperature range of 30–500 °C, by using a gas chromatograph-mass spectrometer (GC-MS; Shimadzu Corp., Tokyo, Japan, GCMS-QP2010SE with a capillary column, PoraPLOT Q) and a GC equipped with a flame ionization detector (GC-FID; Shimadzu Corp., GC-2010 with a capillary column, DB-5). The conversion ratio of VOCs was calculated using the GC-FID spectra of these gases in the inlet and outlet gases, while the CO2 production ratio was calculated using the GC-MS spectrum of CO2 in the outlet gas. In addition, the CO2 production ratio was estimated only when the peak area at 450 °C was the same as that at 500 °C, and the VOCs were considered to be completely oxidized at these temperatures. The temperatures at which 50% of the VOCs were converted and oxidized to CO2 were defined as T50(cv,x) and T50(CO2,x), respectively (x: the kind of target gases; ace was for acetone, tol was for toluene, and eth was for ethanol).

3. Results and Discussion

Figure 1 shows SEM photographs of representative pr-wAu-Cu2O-SnO2 and 3.0Au/pr-Cu2O-SnO2 powders. The pr-wAu-Cu2O-SnO2 powders were spherical particles with pores of ca. 20–30 nm in diameter. This clearly indicated that the PMMA microspheres were decomposed and the other components were crystallized in the mists to form the spherical porous particles, when the ultrasonically generated mists were introduced into an electric furnace. In addition, the addition of Au was almost independent of the pore size. On the other hand, the shape of the 3.0Au/pr-Cu2O-SnO2 powder was not spherical, and the well-developed pores, which were formed by the decomposition of the PMMA microspheres, were hardly confirmed on the surface, because Au-related species covered the pores on the surface.
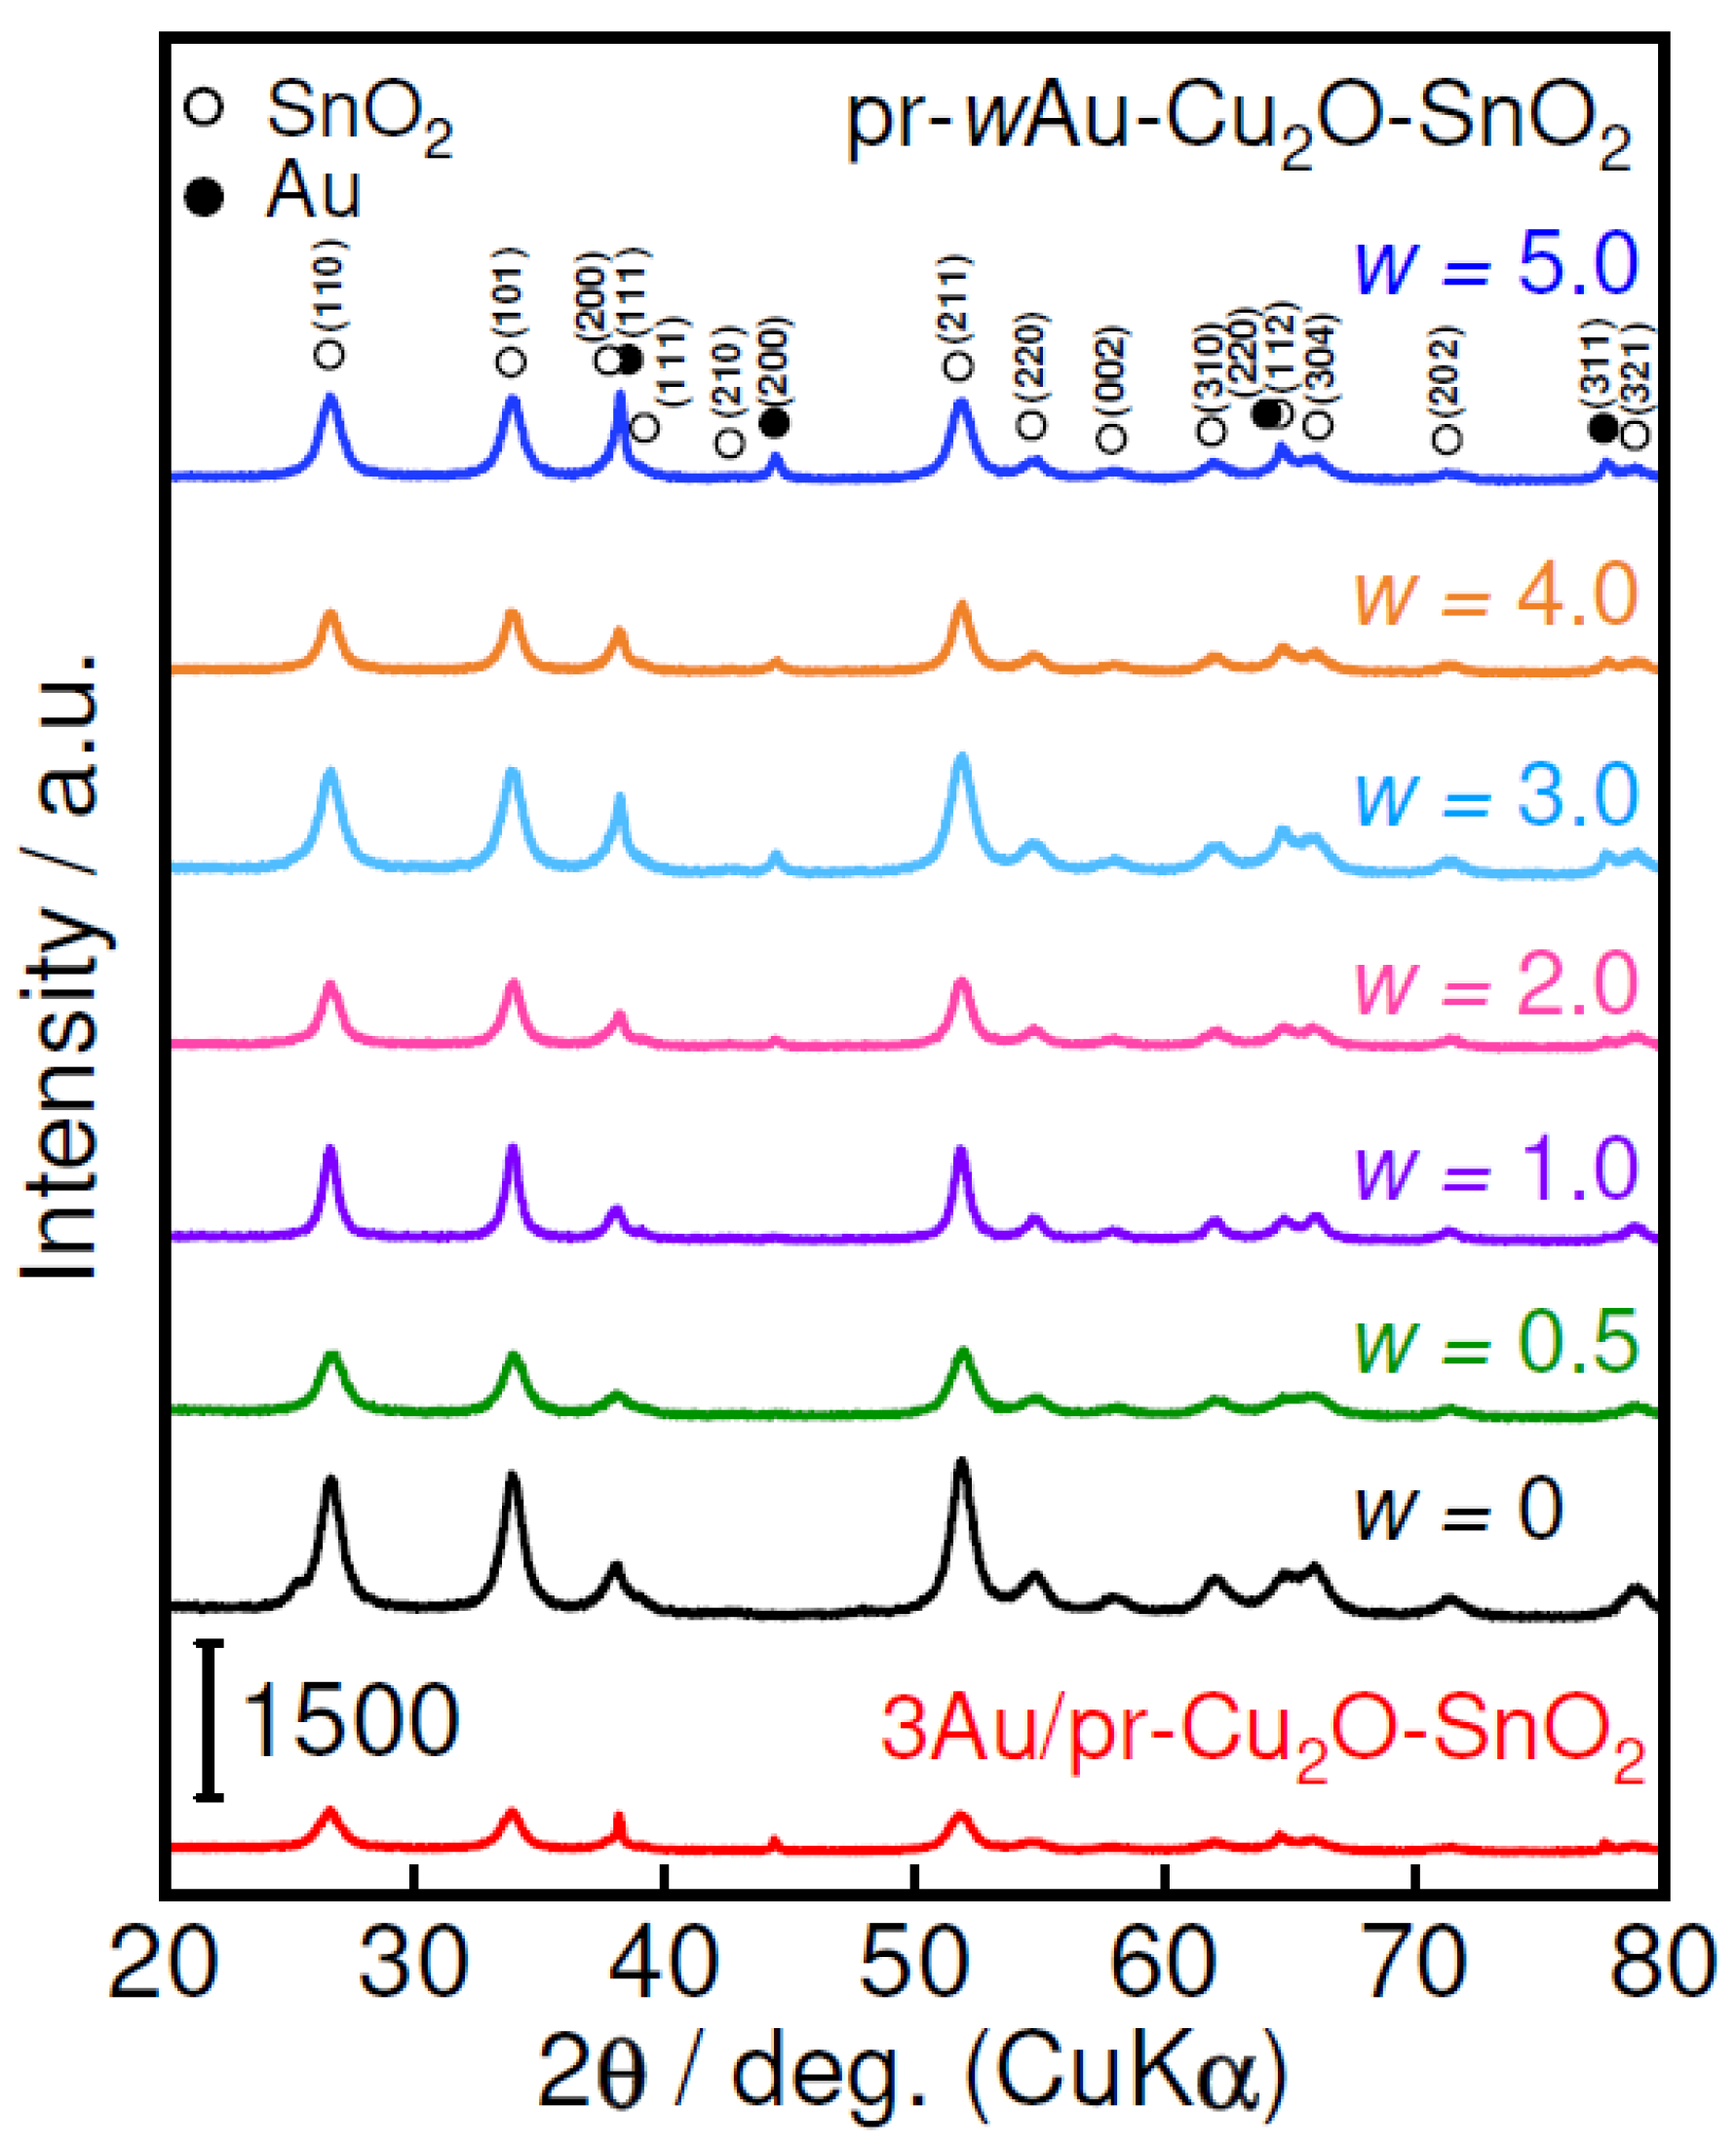
Figure 2 shows XRD spectra of the pr-wAu-Cu2O-SnO2 and 3.0Au/pr-Cu2O-SnO2 powders. The diffraction peaks were assigned to only SnO2 (cassiterite-type structure, JCPDS No. 00-021-1250), when the amount of Au added was 2.0 wt% or less in the pr-wAu-Cu2O-SnO2 powders. On the other hand, the XRD spectra of other pr-wAu-Cu2O-SnO2 (w ≥ 3.0) and 3.0Au/pr-Cu2O-SnO2 powders showed the presence of Au (JCPDS No. 01-077-9662). No Cu-based component was confirmed in all powders. However, we have already confirmed the presence of Cu2O in the pr-0Au-Cu2O-SnO2 powder by X-ray photoelectron spectroscopy, as mentioned above [32]. Therefore, these results suggested that the additive amounts of 2.0 wt% Au and 1.6 wt% Cu were not sufficient to observe the XRD spectrum of Au and Cu2O.
Table 1 summarizes crystallite sizes (CSs) of SnO2 in representative powders and the specific surface areas (SSAs). The CS of the pr-0Au-Cu2O-SnO2 powder was 7.08 nm, and the CS gradually tended to increase with an increase in the amount of Au. The SSA of the pr-0Au-Cu-SnO2 powder was 48.3 m2 g−1 and the addition of the small amount of Au hardly had an effect on the SSA. However, the addition of the larger amount of Au in the pr-wAu-Cu2O-SnO2 powder relatively reduced the SSA, and the SSA was not so much dependent on the amount of Au, which indicated that Au may be homogeneously dispersed in these powders. Figure 3 shows response transients of the pr-3.0Au-Cu2O-SnO2 sensors to acetone at 300, 400, and 500 °C in air. Figure 4 shows temperature dependences of response of the pr-wAu-Cu2O-SnO2 sensors to 100 ppm acetone at 350 °C. The resistance of the pr-3.0Au-Cu2O-SnO2 sensor in air decreased with an increase in the operating temperature. In addition, the resistance decreased upon exposure to acetone over the whole temperature range, and the acetone response increased with the increasing acetone concentration. When the gas flow was changed to dry air, the resistance of the sensor returned to the original value. The 90% recovery time (trec) was largely improved by increasing the operating temperature (ca. 3138 s, 896 s, and 129 s for 300, 400, and 500 °C, respectively). In addition, the 90% response time (tres) was much smaller than the trec values except for the value obtained at 500 °C (ca. 142 s, 84.6 s, and 137 s for 300, 400, and 500 °C, respectively). The acetone responses of the pr-wAu-Cu2O-SnO2 sensors were the largest at 350 °C when the w value was 3.0 or less, while the largest acetone responses of the pr-4.0Au-Cu2O-SnO2 and pr-5.0Au-Cu2O-SnO2 sensors were observed at 400 °C. Among them, the pr-3.0Au-Cu2O-SnO2 showed the largest acetone response, ca. 89.1 at 350 °C, which was much larger than that of the 3.0Au/pr-Cu2O-SnO2 sensor (ca. 11.4 at 300 °C). This indicated that the simple loading of Au on the pr-Cu2O-SnO2 surface was ineffective in enhancing the acetone response, because the Au components were terribly agglomerated on the surface (see Figure 2).
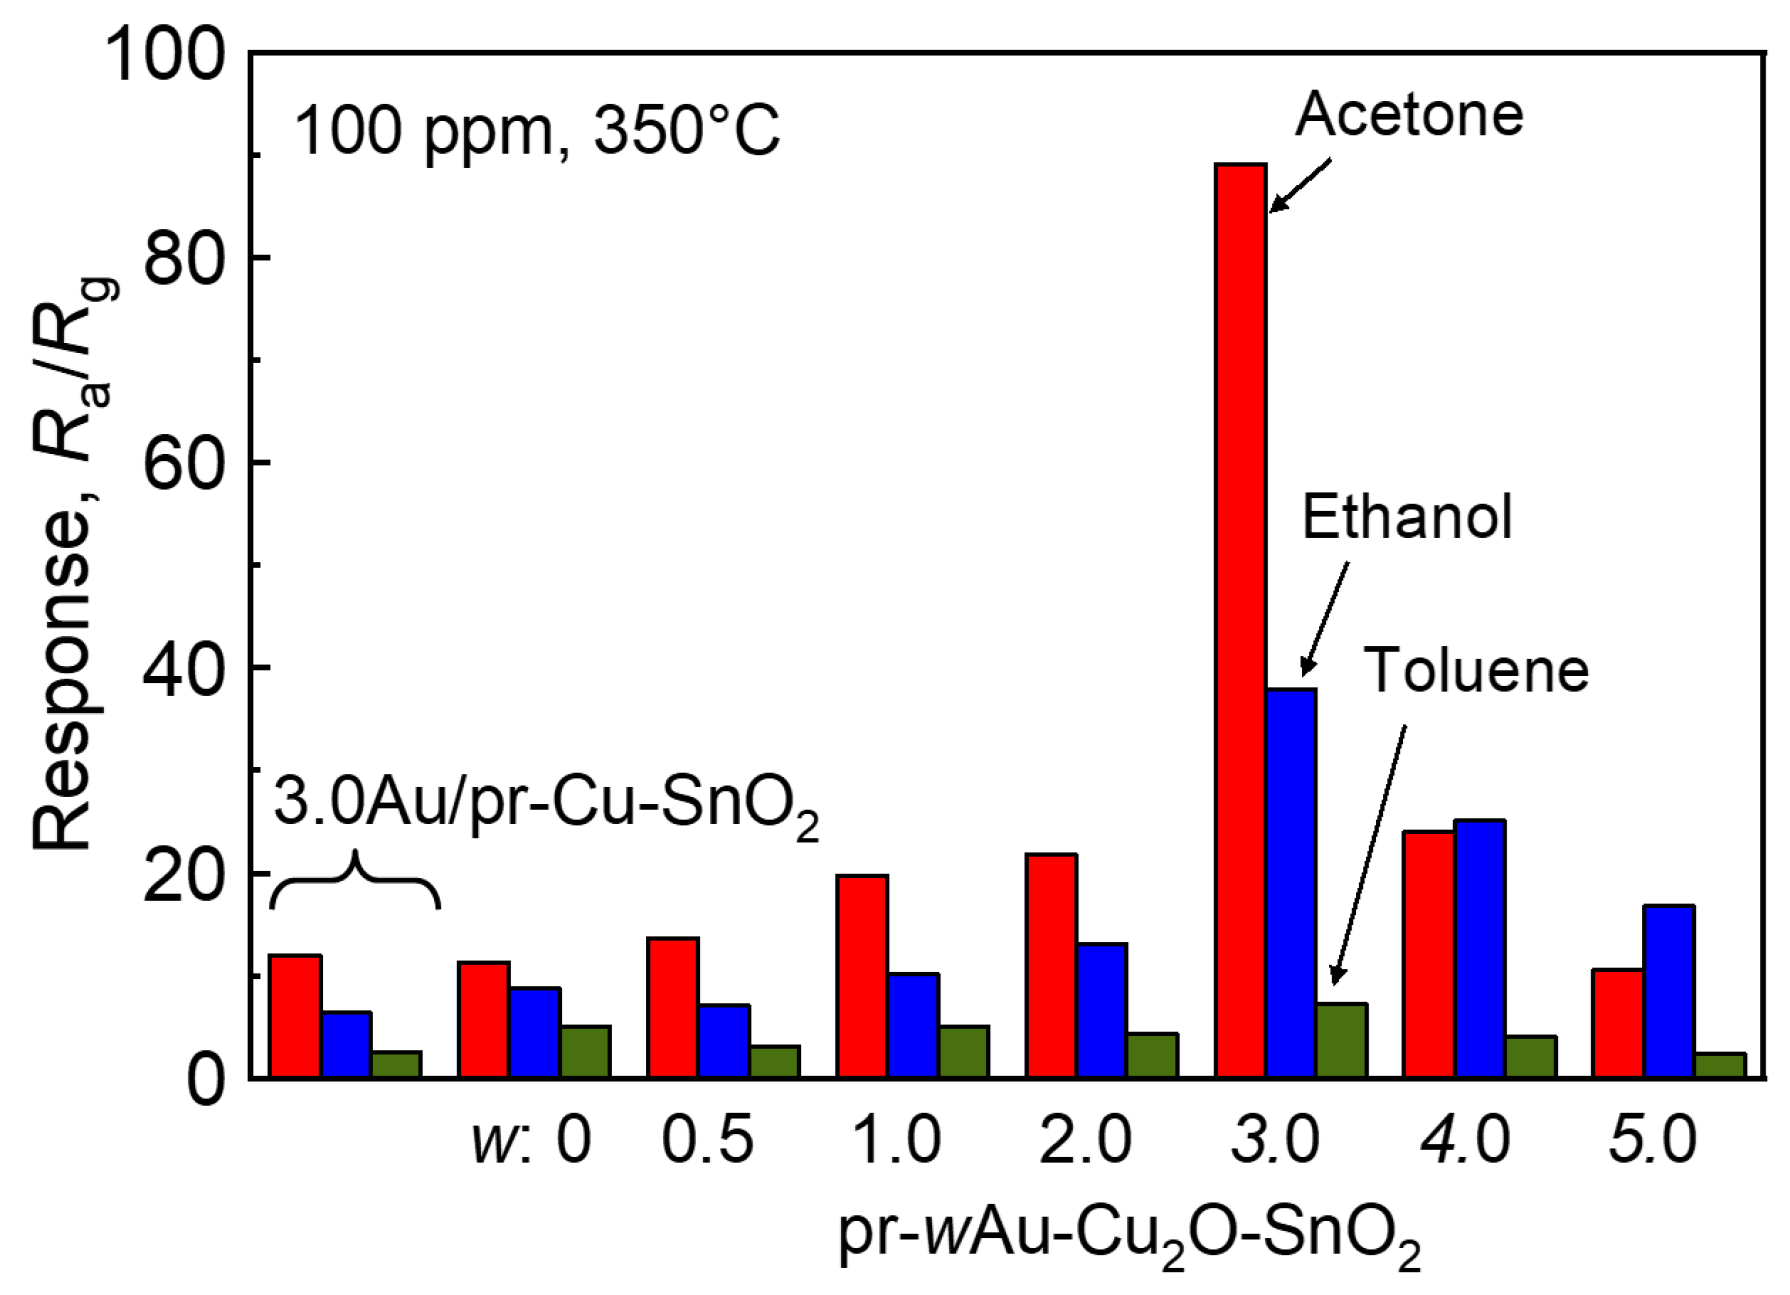
Figure 5 compares responses of the pr-wAu-Cu2O-SnO2 and 3.0Au/pr-Cu2O-SnO2 sensors to acetone, ethanol, and toluene (100 ppm) at 350 °C in air. The pr-3.0Au-Cu2O-SnO2 sensor showed the largest response to each gas among the examined sensors, and the acetone response of the pr-3.0Au-Cu2O-SnO2 sensor was 2.4 times and 12 times higher than its ethanol and toluene responses, respectively. Figure 6 shows the concentration dependences of responses of the pr-3.0Au-Cu2O-SnO2 sensor to acetone, ethanol, and toluene (100 ppm). The responses to these gases linearly increased with an increase in their logarithmic concentration in the examined concentration range, and the acetone response to 2.5 ppm acetone was as high as 11.0. The detection limit of a sensor is commonly defined as three times the standard deviation of its noise [37,38,39,40]. The detection limit to acetone of the pr-3.0Au-Cu2O-SnO2 sensor was expected to be less than 500 ppb considering the noise level in air (ca. 732 kΩ), which was much lower than those of ethanol and toluene.
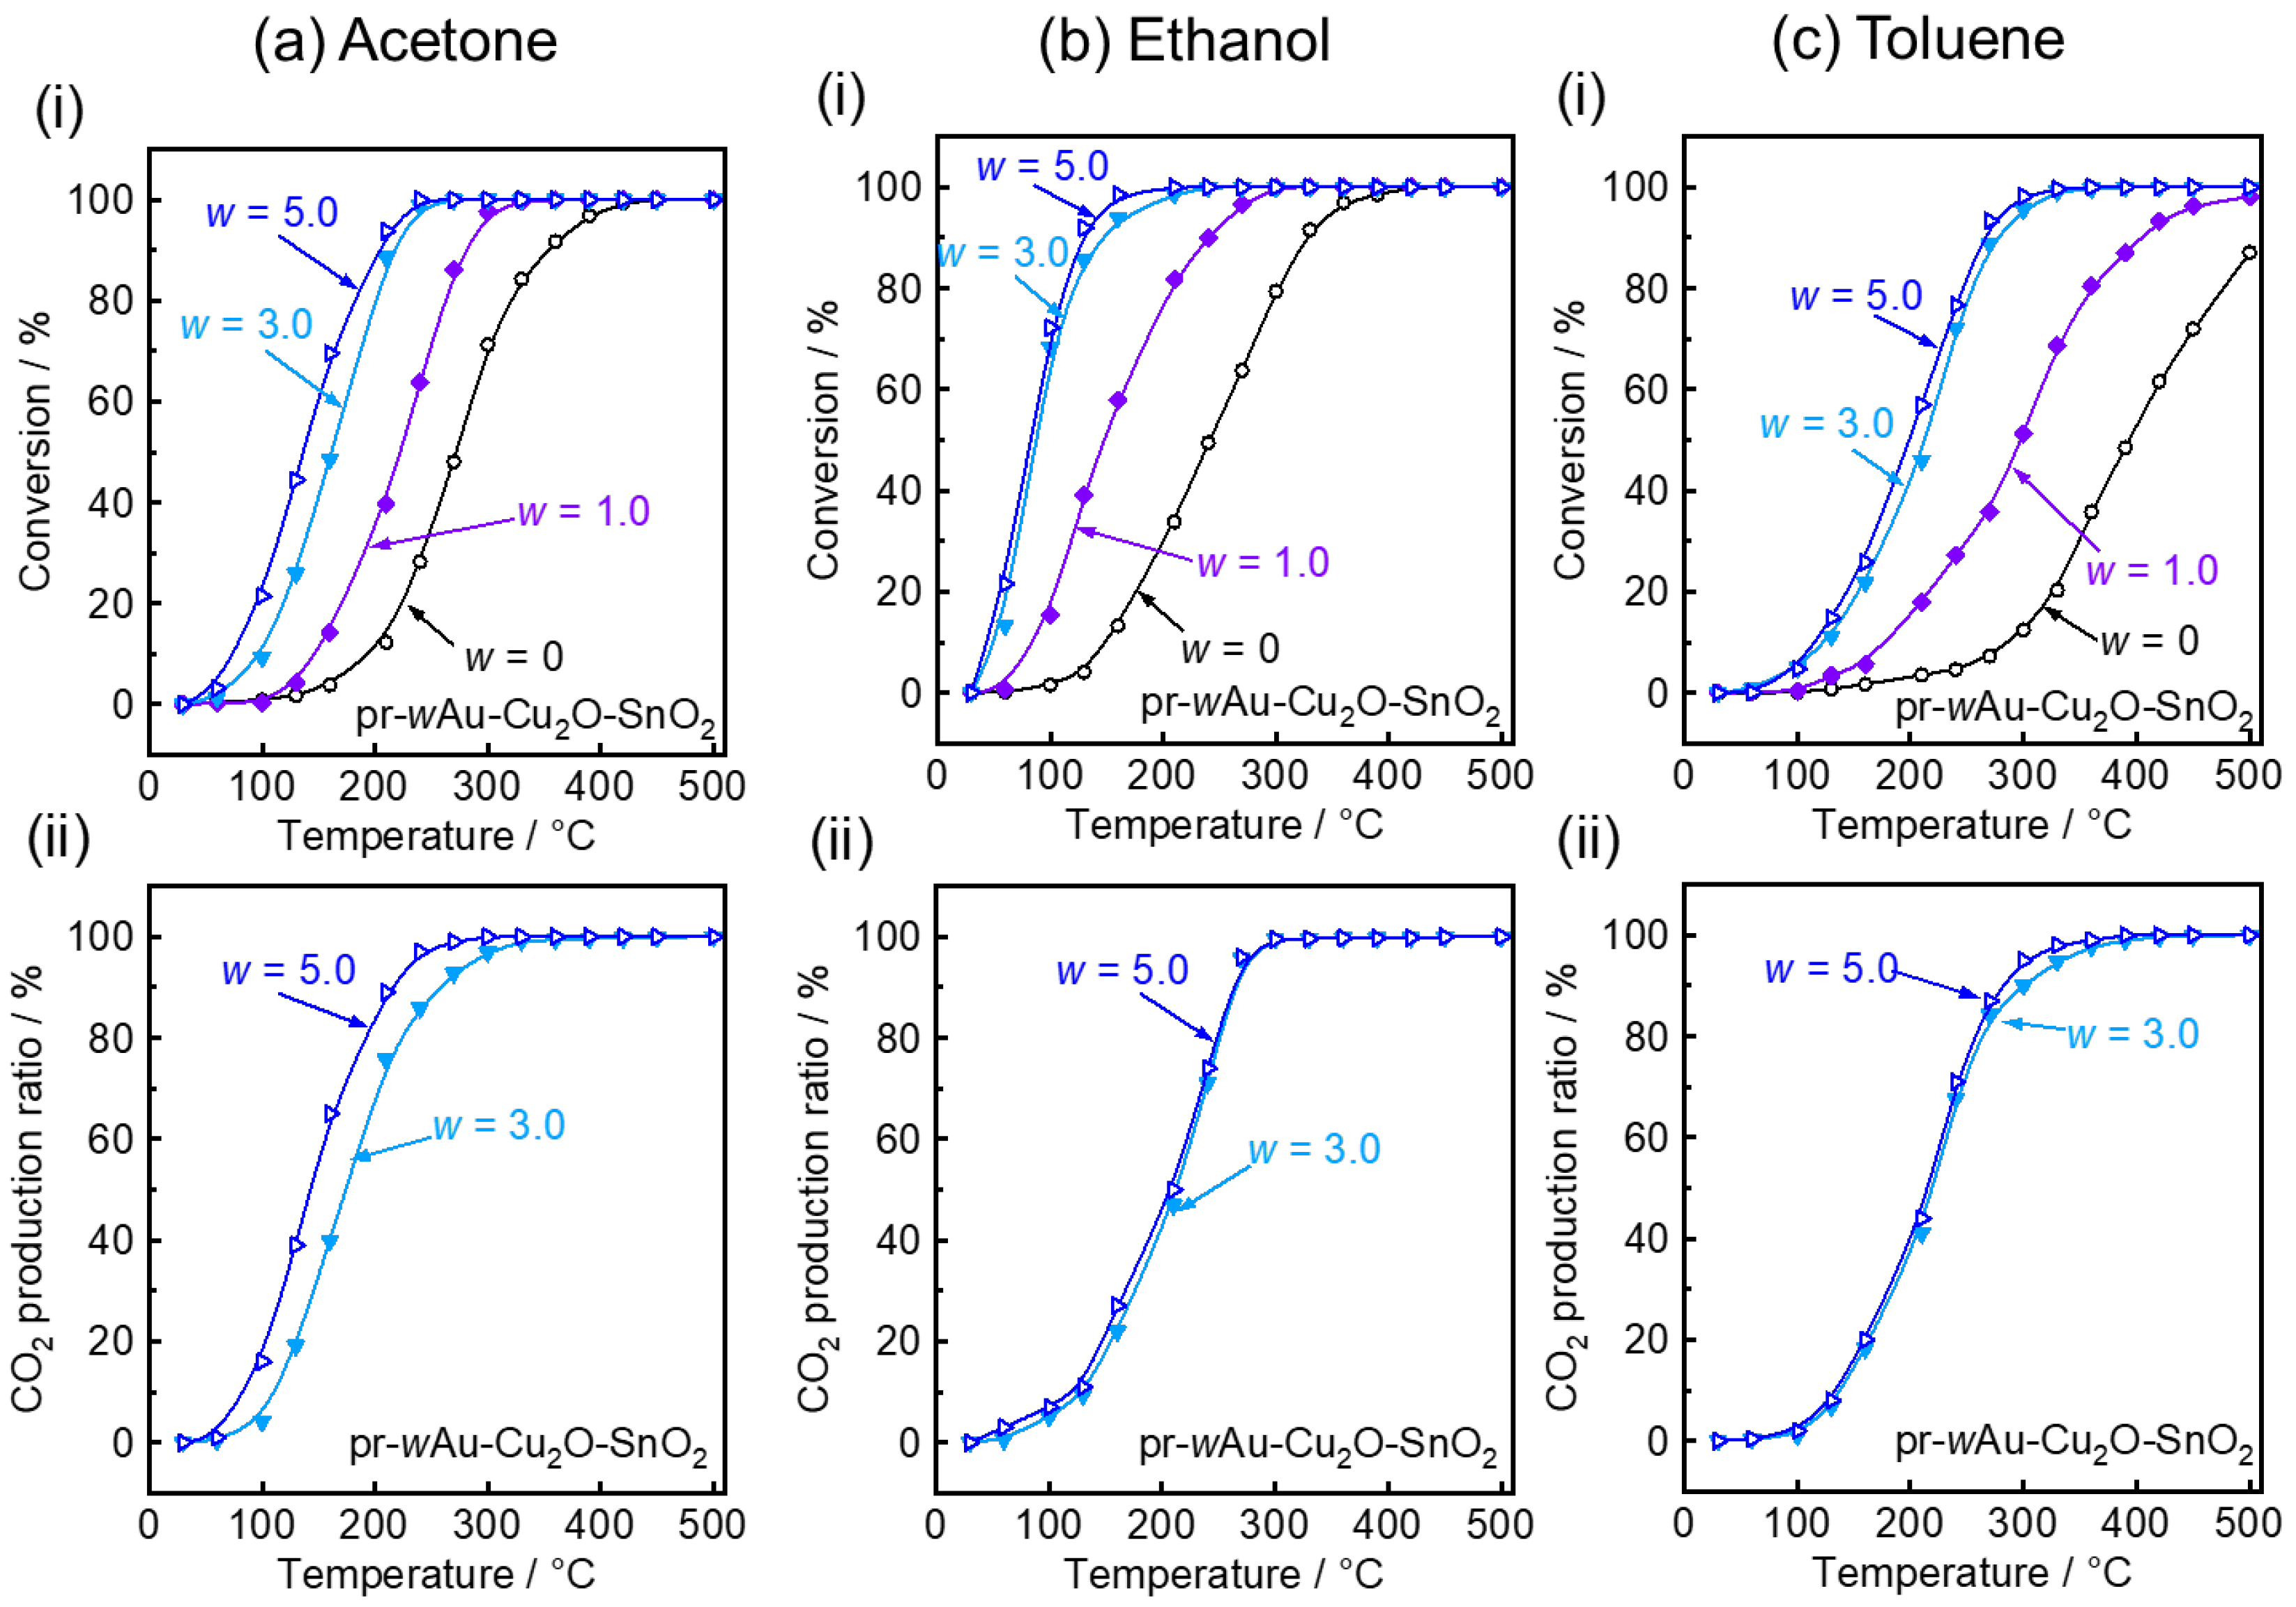
Figure 7 shows temperature dependences of conversion and CO2 production ratio of 100 ppm VOCs over the pr-wAu-Cu2O-SnO2 powders (w: 0, 1.0, 3.0, and 5.0) in air. The conversion ratio increased with the increasing temperature, due to their oxidation to CO2 and/or intermediate species. The onset temperature, at which the conversion ratio sharply increased, decreased with an increase in the w value. For example, the onset temperature of the pr-0Au-Cu2O-SnO2 powder for acetone was 130 °C and the conversion ratio reached 100% at 400 °C, while the onset temperature of the pr-3.0Au-Cu2O-SnO2 powder was 50 °C and all acetone was perfectly converted at 230 °C. On the other hand, the conversion ratio of the pr-0Au-Cu2O-SnO2 and pr-1.0Au-Cu2O-SnO2 powders for toluene did not reach 100% even at 500 °C. The CO2 production ratios of the pr-wAu-Cu2O-SnO2 powders (w: 0 and 1.0) could not be calculated for all gases, because their CO2 peak areas at 500 °C were larger than those at 450 °C. The CO2 production ratios of the pr-wAu-Cu2O-SnO2 powders (w: 3.0 and 5.0) for all gases also increased with an increase in the temperature, but most of the CO2 production ratios were smaller than the conversion ratios at all temperatures. Especially, the CO2 production ratios of the pr-wAu-Cu2O-SnO2 powders (w: 3.0, 5.0) for ethanol were much smaller than the conversion ratios. For example, ethanol was completely converted over the pr-3.0Au-Cu2O-SnO2 powder at 200 °C, while the CO2 production ratio was just about 41% at the same temperature. This fact explained that intermediate products were produced over the pr-wAu-Cu-SnO2 powders through the oxidation process of these gases.
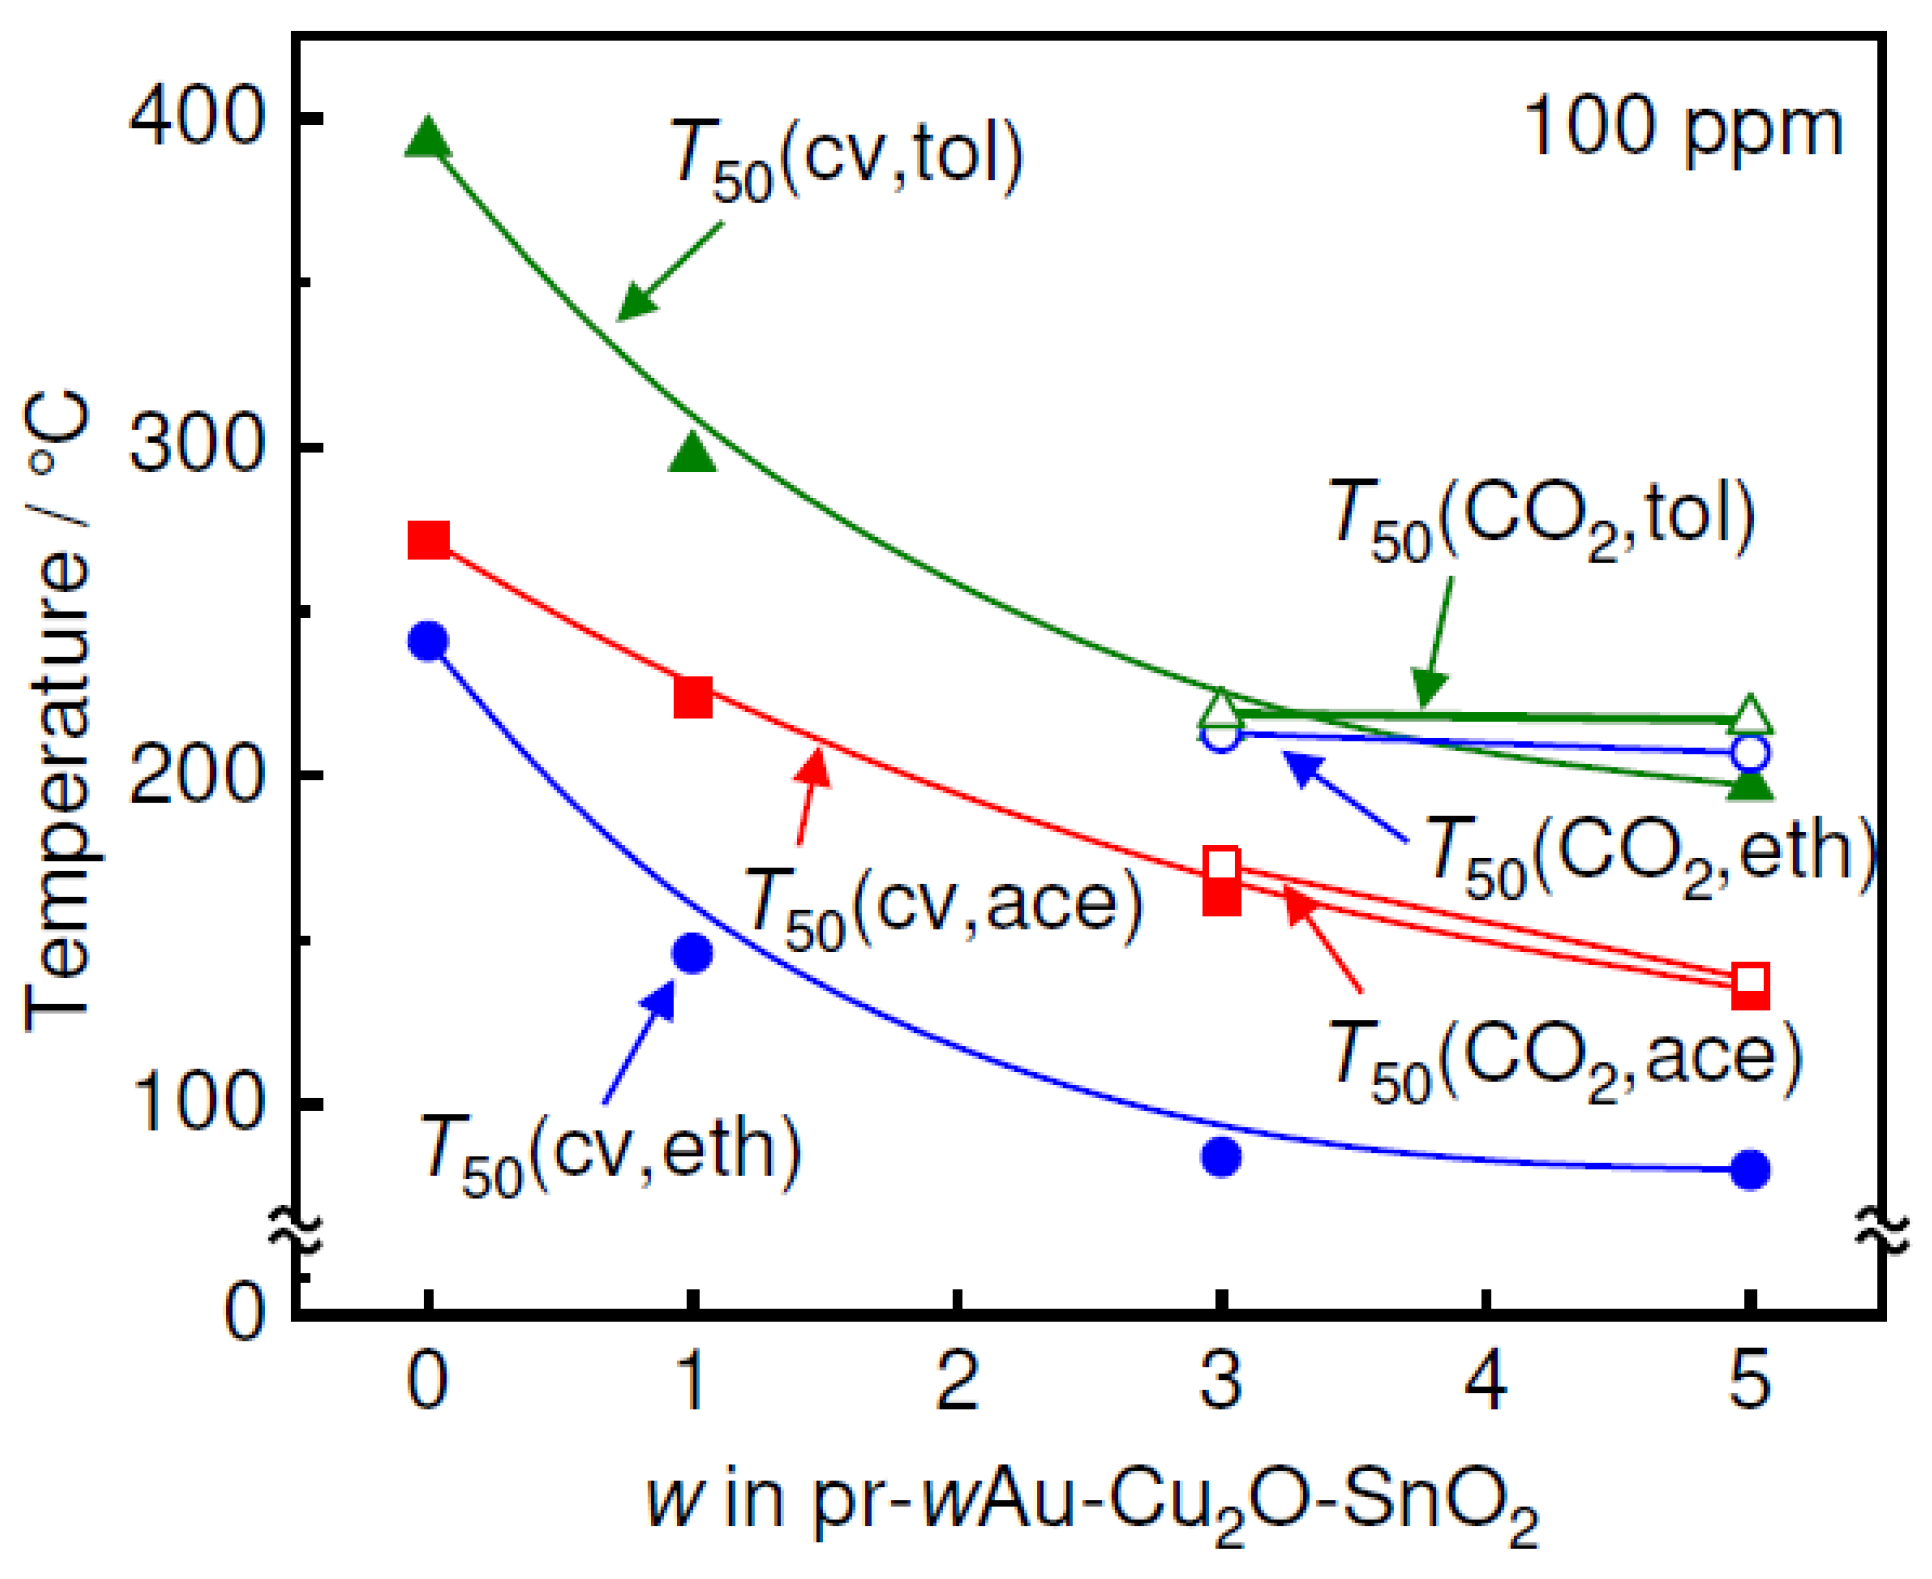
Figure 8 shows temperature dependences of T50(cv,x) and T50(CO2,x) values of the pr-wAu-Cu2O-SnO2 powders (w: 0, 1.0, 3.0, and 5.0) in air. All T50(cv,x) values decreased with an increase in the additive amount of Au, and the order of the T50(cv,x) values was as follows: ethanol < acetone < toluene. The order of the T50(CO2,x) values was as follows: acetone < ethanol < toluene. In addition, the order of the VOC responses of the pr-3.0Au-Cu2O-SnO2 sensor at 350 °C was as follows: acetone > ethanol > toluene. A certain amount of VOCs catalytically reacted with negatively adsorbed oxygen species to produce CO2 and/or intermediate species, and the decrease in the negatively adsorbed oxygen species reduced the sensor resistance. Therefore, the fact that the T50(cv,tol) and T50(CO2,tol) values were higher than the other T50(cv,x) and T50(CO2,x) values is the most important reason that the responses of the pr-wAu-Cu2O-SnO2 sensors to toluene were smaller than those to ethanol and acetone. On the other hand, the acetone response of the pr-3.0Au-Cu2O-SnO2 sensor at 350 °C was much larger than that of the ethanol response, which was related to the lower T50(CO2,ace) value than T50(CO2,eth). However, the T50(cv,ace) value was higher than the T50(cv,eth) value. The difference between T50(cv,ace) and T50(CO2,ace) of the pr-3.0Au-Cu2O-SnO2 powder was as little as 10 °C. On the other hand, the difference between the T50(cv,eth) and the T50(CO2,eth) was quite large (ca. 129 °C), which indicates that The low catalytic oxidation behavior on the surface is probably the main cause of the smaller ethanol response of the pr-3.0Au-Cu2O-SnO2 sensor.
Furthermore, both T50(cv,x) and T50(CO2,x) values of all pr-wAu-Cu2O-SnO2 powders (x: ace and eth) decreased with an increase in the w value. This indicated that the total effective concentration of both target gases and the related intermediates at the bottom part of the sensing layer decreased with an increase in the w value. Moreover, the T50(CO2,ace) value of the pr-5.0Au-Cu2O-SnO2 powder (138 °C) was much lower than that of the pr-3.0Au-Cu2O-SnO2 powder (173 °C), while the T50(CO2,eth) value of the pr-5.0Au-Cu2O-SnO2 powder (207 °C) was only slightly lower than that of the pr-3.0Au-Cu2O-SnO2 powder (213 °C). In addition, the T50(CO2,eth) values of the pr-wAu-Cu2O-SnO2 powders (w: 3.0 and 5.0) were higher than their T50(CO2,ace) values. Therefore, the effective concentration of ethanol and the related intermediates at the bottom part of the sensor was probably larger than that of acetone and the related intermediates. This must be the important reason why the ethanol responses of the pr-wAu-Cu2O-SnO2 sensors (w: 4.0 and 5.0) were larger than their acetone responses, as shown in Figure 5.
Another important factor influencing the responses to the VOCs is the adsorbability of the oxygen species on the oxide surface by Au addition. The response (i.e., the resistance decrease) of the pr-wAu-Cu2O-SnO2 sensor to target VOCs essentially resulted from the reduction in the negatively charged oxygen species due to the combustion of the VOCs. Therefore, the increase in the adsorbability of oxygen species on the oxide surface decreased the VOC response, even if the addition of Au increased the catalytic oxidation activity of VOCs. David et al. demonstrated that the addition of Au to the SnO2 powders increases the adsorbability of oxygen species on the SnO2 surface by Fourier-transform infrared spectroscopy [41,42]. We also confirmed that the addition of Au to the In2O3 powders increases the amount of oxygen species adsorbed on the surface [43]. Considering the competition between the adsorption of oxygen species and the VOCs on the oxide surface and the consumption of the adsorbed oxygen species due to the reaction with VOCs determines the magnitude of VOC responses, a too large amount of Au added to the oxides (w: 4.0 and 5.0), which promoted the negatively charged adsorption of oxygen qualitatively as well as quantitatively, resulted in the inhibition of the acetone response. This is probably the reason why the addition of 3.0 wt% Au was the most suitable for the sensitive (and selective) acetone response of the pr-wAu-Cu2O-SnO2 sensors in this study.

4. Conclusions

The pr-3.0Au-Cu2O-SnO2 sensor showed the largest response to acetone at 350 °C among the examined sensors, and the acetone response was significantly larger than those to ethanol and toluene. The conversion ratio of the pr-wAu-Cu2O-SnO2 powders for all VOCs increased with an increase in the additive amount of Au (w value). The CO2 production ratios of the pr-wAu-Cu2O-SnO2 powders (w: 3.0 and 5.0) for all gases also increased with the increasing temperature, but most of the CO2 production ratios were smaller than the conversion ratios at all temperatures. The order of the T50(CO2,x) values was as follows: acetone < ethanol < toluene, which corresponded to the largest acetone response of the pr-3.0Cu2O-SnO2 sensor. However, the order of the T50(cv,x) values was as follows: ethanol < acetone < toluene. The difference between the T50(cv,ace) and T50(CO2,ace) values of the pr-3.0Au-Cu2O-SnO2 powder was as little as 10 °C. On the other hand, the difference between the T50(cv,eth) and the T50(CO2,eth) was quite large (ca. 129 °C), which indicated that a large amount of ethanol was not completely decomposed on the pr-3.0Au-Cu2O-SnO2 surface. The low catalytic oxidation behavior of ethanol on the surface is probably the main cause of the smaller ethanol response of the pr-3.0Au-Cu2O-SnO2 sensor than the acetone response. In addition, the adsorbability of the oxygen species on the oxide surface may also affect the responses to the VOCs, because the competition between the adsorption of oxygen species and the VOCs on the oxide surface and the consumption of the adsorbed oxygen species due to the reaction with VOCs determined the magnitude of VOC responses.

Author Contributions

Conceptualization, T.U., S.T. and K.F.; funding acquisition, T.U. and Y.S.; investigation, S.T., K.F. and T.U.; project administration, T.H.; resources, Y.S. and T.H.; supervision, Y.S.; validation; T.U., S.T., Y.S. and T.H.; writing—original draft preparation, T.U.; writing—review and editing, T.H. All authors have read and agreed to the published version of the manuscript.

Funding

This study was partly supported by the Nagasaki University WISE Program Research Grant for Global Health Research.

Institutional Review Board Statement

Not applicable.

Informed Consent Statement

Not applicable.

Data Availability Statement

The data that support the findings of this study are available from the corresponding author upon reasonable request.

Conflicts of Interest

Author Soichiro Torai was employed by the company Fuji Electric. The remaining authors declare that the research was conducted in the absence of any commercial or financial relationships that could be construed as a potential conflict of interest.

References

  1. Koo, W.-T.; Choi, S.-J.; Kim, N.-H.; Jang, J.-S.; Kim, I.-D. Catalyst-decorated hollow WO3 nanotubes using layer-by-layer self-assembly on polymeric nanofiber templates and their application in exhaled breath sensor. Sens. Actuators B Chem. 2016, 223, 301–310. [Google Scholar] [CrossRef]
  2. Li, W.; Dai, W.; Liu, M.; Long, Y.; Wang, C.; Xie, S.; Liu, Y.; Zhang, Y.; Shi, Q.; Peng, X.; et al. VOC biomarkers identification and predictive model construction for lung cancer based on exhaled breath analysis: Research protocol for an exploratory study. BMJ Open 2019, 9, e028448. [Google Scholar] [CrossRef] [PubMed]
  3. Kalidoss, R.; Umapathy, R. An overview on the exponential growth of non-invasive diagnosis of diabetes mellitus from exhaled breath by nanostructured metal oxide Chemi-resistive gas sensors and μ-preconcentrator. Biomed. Microdevices 2020, 22, 2. [Google Scholar] [CrossRef] [PubMed]
  4. Shin, J.; Choi, S.-J.; Lee, I.; Youn, D.-Y.; Park, C.O.; Lee, J.-H.; Tuller, H.L.; Kim, I.-D. Thin-wall assembled SnO2 fibers functionalized by catalytic Pt nanoparticles and their superior exhaled-breath-sensing properties for the diagnosis of diabetes. Adv. Funct. Mater. 2013, 23, 2357–2367. [Google Scholar] [CrossRef]
  5. Kalapos, M.P. On the mammalian acetone metabolism: From chemistry to clinical implications. Biochim. Biophys. Acta 2003, 1621, 122–139. [Google Scholar] [CrossRef] [PubMed]
  6. Miekisch, W.; Schubert, J.K.; Noeldge-Schomburg, G.F. Diagnostic potential of breath analysis focus on volatile organic compounds. Clin. Chim. Acta 2004, 347, 25–39. [Google Scholar] [CrossRef] [PubMed]
  7. Cao, W.; Duan, Y. Breath Analysis: Potential for clinical diagnosis and exposure assessment. Clin. Chem. 2006, 52, 800–811. [Google Scholar] [CrossRef]
  8. Righettoni, M.; Tricoli, A.; Pratsinis, S.E. Si:WO3 Sensors for highly selective detection of acetone for easy diagnosis of diabetes by breath analysis. Anal. Chem. 2010, 82, 3581–3587. [Google Scholar] [CrossRef]
  9. Righettoni, M.; Tricoli, A.; Gass, S.; Schmid, A.; Amann, A.; Pratsinis, S.E. Breath acetone monitoring by portable Si:WO3 gas sensors. Anal. Chim. Acta 2012, 738, 69–75. [Google Scholar] [CrossRef]
  10. Güntner, A.T.; Sievi, N.A.; Theodore, S.J.; Gulich, T.; Kohler, M.; Pratsinis, S.E. Noninvasive body fat burn monitoring from exhaled acetone with Si-doped WO3-sensing nanoparticles. Anal. Chem. 2017, 89, 10578–10584. [Google Scholar] [CrossRef]
  11. Weber, I.C.; Braun, H.P.; Krumeich, F.; Güntner, A.T.; Pratsinis, S.E. Superior acetone selectivity in gas mixtures by catalyst-filtered chemoresistive sensors. Adv. Sci. 2020, 7, 2001503. [Google Scholar] [CrossRef] [PubMed]
  12. Gschwend, P.M.; Schenk, F.M.; Gogos, A.; Pratsinis, S.E. Acetone sensing and catalytic conversion by Pd-loaded SnO2. Materials 2021, 14, 5921. [Google Scholar] [CrossRef]
  13. Wang, Y.; Cheng, P.; Li, X.; Wang, C.; Feng, C.; Lu, G. Revealing the relationship between the Au decoration method and the enhanced acetone sensing performance of a mesoporous In2O3-based gas sensor. J. Mater. Chem. C 2020, 8, 78–88. [Google Scholar] [CrossRef]
  14. Yang, M.; Lu, J.; Wang, X.; Zhang, H.; Chen, F.; Sun, J.; Yang, J.; Sun, Y.; Lu, G. Acetone sensors with high stability to humidity changes based on Ru-doped NiO flower-like microspheres. Sens. Actuators B Chem. 2020, 313, 127965. [Google Scholar] [CrossRef]
  15. Weber, I.C.; Oosthuizen, D.N.; Mohammad, R.W.; Mayhew, C.A.; Pratsinis, S.E.; Güntner, A.T. Dynamic breath limonene sensing at high selectivity. ACS Sens. 2023, 8, 2618–2626. [Google Scholar] [CrossRef] [PubMed]
  16. Jin, R.; Jiang, Y.; Zhao, L.; Wang, T.; Liu, X.; Liu, F.; Yan, X.; Sun, P.; Lu, G. High sensitivity and low detection limit of acetone sensor based on Ru-doped Co3O4 flower-like hollow microspheres. Sens. Actuators B Chem. 2022, 363, 131839. [Google Scholar] [CrossRef]
  17. Yang, J.; Jiang, B.; Wang, X.; Wang, C.; Sun, Y.; Zhang, H.; Shimanoe, K.; Lu, G. MOF-derived porous NiO/NiFe2O4 nanocubes for improving the acetone detection. Sens. Actuators B Chem. 2022, 366, 131985. [Google Scholar] [CrossRef]
  18. Zhang, Y.; Zhou, L.; Liu, Y.; Liu, D.; Liu, F.; Liu, F.; Yan, X.; Liang, X.; Gao, Y.; Lu, G. Gas sensor based on samarium oxide loaded mulberry-shaped tin oxide for highly selective and sub ppm-level acetone detection. J. Colloid Interface Sci. 2018, 531, 74–82. [Google Scholar] [CrossRef]
  19. Chen, F.; Yang, M.; Wang, X.; Song, Y.; Guo, L.; Xie, N.; Kou, X.; Xu, X.; Sun, Y.; Lu, G. Template-free synthesis of cubic-rhombohedral-In2O3 flower for ppb level acetone detection. Sens. Actuators B Chem. 2019, 290, 459–466. [Google Scholar] [CrossRef]
  20. Zhang, S.; Jiang, W.; Li, Y.; Yang, X.; Sun, P.; Liu, F.; Yan, X.; Gao, Y.; Liang, X.; Ma, J.; et al. Highly-sensitivity acetone sensors based on spinel-type oxide (NiFe2O4) through optimization of porous structure. Sens. Actuators B Chem. 2019, 291, 266–274. [Google Scholar] [CrossRef]
  21. Kou, X.; Meng, F.; Chen, K.; Wang, T.; Sun, P.; Liu, F.; Yan, X.; Sun, Y.; Liu, F.; Shimanoe, K.; et al. High-performance acetone gas sensor based on Ru-doped SnO2 nanofibers. Sens. Actuators B Chem. 2020, 320, 128292. [Google Scholar] [CrossRef]
  22. Wu, E.; Xie, Y.; Yuan, B.; Hao, D.; An, C.; Zhang, H.; Wu, S.; Hu, X.; Liu, J.; Zhang, D. Specific and highly sensitive detection of ketone compounds based on p-Type MoTe2 under Ultraviolet Illumination. ACS Appl. Mater. Interfaces 2018, 10, 35664–35669. [Google Scholar] [CrossRef] [PubMed]
  23. Jeong, Y.J.; Koo, W.-T.; Jang, J.-S.; Kim, D.-H.; Kim, M.-H.; Kim, I.-D. Nanoscale PtO2 catalysts-loaded SnO2 multichannel nanofibers toward highly sensitive acetone sensor. ACS Appl. Mater. Interfaces 2018, 10, 2016–2025. [Google Scholar] [CrossRef] [PubMed]
  24. Jang, J.-S.; Choi, S.-J.; Kim, S.-J.; Hakim, M.; Kim, I.-D. Rational design of highly porous SnO2 nanotubes functionalized with biomimetic nanocatalysts for direct observation of simulated diabetes. Adv. Funct. Mater. 2016, 26, 4740–4748. [Google Scholar] [CrossRef]
  25. Kim, S.-J.; Choi, S.-J.; Jang, J.-S.; Kim, N.-H.; Hakim, M.; Tuller, H.L.; Kim, I.-D. Mesoporous WO3 nanofibers with protein-templated nanoscale catalysts for detection of trace biomarkers in exhaled breath. ACS Nano 2016, 10, 5891–5899. [Google Scholar] [CrossRef] [PubMed]
  26. Choi, K.-I.; Hwang, S.-J.; Dai, Z.; Kang, Y.C.; Lee, J.-H. Rh-catalyzed WO3 with anomalous humidity dependence of gas sensing characteristics. RSC Adv. 2014, 4, 53130–53136. [Google Scholar] [CrossRef]
  27. Kim, D.H.; Kim, T.H.; Sohn, W.; Suh, J.M.; Shim, Y.; Kwon, K.C.; Hong, K.; Choi, S.; Byun, H.; Lee, J.; et al. Au decoration of vertical hematite nanotube arrays for further selective detection of acetone in exhaled breath. Sens. Actuators B Chem. 2018, 274, 587–594. [Google Scholar] [CrossRef]
  28. Kwak, C.-H.; Kim, T.-H.; Jeong, S.-Y.; Yoon, J.-W.; Kim, J.-S.; Lee, J.-H. Humidity-independent oxide semiconductor chemiresistors using terbium-doped SnO2 yolk–shell spheres for real-time breath analysis. ACS Appl. Mater. Interfaces 2018, 10, 18886–18894. [Google Scholar] [CrossRef] [PubMed]
  29. Zhao, J.; Xu, H.; Yu, X.; Li, L.; Gao, Y.; Sun, P.; Lu, G. Detection of low concentration acetone utilizing semiconductor gas sensor. J. Mater. Sci. Mater. Electron. 2020, 31, 5478–5484. [Google Scholar] [CrossRef]
  30. Ahn, S.; Chun, K.W.; Park, C. Long-term stability test for femtosecond laser-irradiated SnO2-nanowire gas sensor for C7H8 gas sensing. Photonics 2024, 11, 550. [Google Scholar] [CrossRef]
  31. Sun, Y.; Wang, B.; Wang, B.; Zhao, Z.; Zhang, W.; Zhang, W.; Suematsu, K.; Hu, J. Construction of flower-like PtOx@ZnO/In2O3 hollow microspheres for ultrasensitive and rapid trace detection of isopropanol. ACS Appl. Mater. Interfaces 2023, 15, 12041–12051. [Google Scholar] [CrossRef]
  32. Torai, S.; Ueda, T.; Kamada, K.; Hyodo, T.; Shimizu, Y. Effects of addition of CuxO to porous SnO2 microspheres prepared by ultrasonic spray pyrolysis on sensing properties to volatile organic compounds. Chemosensors 2023, 11, 59. [Google Scholar] [CrossRef]
  33. Hieda, K.; Hyodo, T.; Shimizu, Y.; Egashira, M. Preparation of porous tin dioxide powder by ultrasonic spray pyrolysis and their application to sensor materials. Sens. Actuators B Chem. 2008, 133, 144–150. [Google Scholar] [CrossRef]
  34. Hyodo, T.; Fujii, E.; Ishida, K.; Ueda, T.; Shimizu, Y. Microstructural control of porous In2O3 powders prepared by ultrasonic-spray pyrolysis employing self-synthesized polymethylmethacrylate microspheres as a template and their NO2-sensing properties. Sens. Actuators B Chem. 2017, 244, 992–1003. [Google Scholar] [CrossRef]
  35. Ueda, T.; Ishida, K.; Kamada, K.; Hyodo, T.; Shimizu, Y. Improvement in NO2 sensing properties of semiconductor-type gas sensors by loading of Au into porous In2O3 powders. Front. Mater. 2019, 6, 81. [Google Scholar] [CrossRef]
  36. Tammanoon, N.; Iwamoto, T.; Ueda, T.; Hyodo, T.; Wisitsoraat, A.; Liewhiran, C.; Shimizu, Y. Synergistic effects of PdOx-CuOx loadings on methylmercaptan sensing of porous WO3 microspheres prepared by ultrasonic spray pyrolysis. ACS Appl. Mater. Interfaces 2020, 12, 41728–41739. [Google Scholar] [CrossRef] [PubMed]
  37. Sun, J.; Sun, L.; Han, N.; Chu, H.; Bai, S.; Shu, X.; Luo, R.; Chen, A. rGO decorated CdS/CdO composite for detection of low concentration NO2. Sens. Actuators B Chem. 2019, 299, 126832. [Google Scholar] [CrossRef]
  38. Mahdavifar, A.; Navaei, M.; Hesketh, P.J.; Findlay, M.; Stetter, J.R.; Hunter, W.G. Transient thermal response of micro-thermal conductivity detector (µTCD) for the identification of gas mixtures: An ultra-fast and low power method. Microsyst. Nanoeng. 2015, 1, 15025. [Google Scholar] [CrossRef]
  39. Struk, D.; Shirke, A.; Mahdavifar, A.; Hesketh, P.J.; Stetter, J.R. Investigating time-resolved response of micro thermal conductivity sensor under various modes of operation. Sens. Actuators B Chem. 2018, 254, 771–777. [Google Scholar] [CrossRef]
  40. Jung, G.; Shin, W.; Hong, S.; Jeong, Y.; Park, J.; Kim, D.; Bae, J.H.; Park, B.G.; Lee, J.H. Comparison of the characteristics of semiconductor gas sensors with different transducers fabricated on the same substrate. Sens. Actuators B Chem. 2021, 335, 129661. [Google Scholar] [CrossRef]
  41. Degler, D.; Wicker, S.; Weimar, U.; Barsan, N. Identifying the active oxygen species in SnO2 based gas sensing materials: An operando IR spectrsocopy study. J. Phys. Chem. C 2015, 119, 11792–11799. [Google Scholar] [CrossRef]
  42. Degler, D.; Rank, S.; Müller, S.; Carvalho, H.W.P.; Grunwaldt, J.-D.; Weimar, U.; Barsan, N. Gold-loaded tin dioxide gas sensing materials: Mechanistic insights and the role of gold dispersion. ACS Sens. 2016, 1, 1322–1329. [Google Scholar] [CrossRef]
  43. Ueda, T.; Boehme, I.; Hyodo, T.; Shimizu, Y.; Weimar, U.; Barsan, N. Effects of Gas adsorption properties of an Au-loaded porous In2O3 Sensor on NO2-Sensing Properties. ACS Sens. 2021, 6, 4019–4028. [Google Scholar] [CrossRef] [PubMed]
Figure 1. SEM photographs of representative pr-wAu-Cu-SnO2 and 3.0Au/pr-Cu-SnO2 powders (w: 1.0, 3.0, and 5.0).
Chemosensors 12 00153 g001
Figure 2. XRD spectra of the pr-wAu-Cu-SnO2 and 3.0Au/pr-Cu-SnO2 powders.
Chemosensors 12 00153 g002
Figure 3. Response transients of the pr-3.0Au-Cu2O-SnO2 sensors to acetone at (a) 300, (b) 400 and (c) 500 °C in air.
Chemosensors 12 00153 g003
Figure 4. Temperature dependences of response to 100 ppm acetone of the pr-wAu-Cu-SnO2 and 3.0Au/pr-Cu2O-SnO2 sensors.
Chemosensors 12 00153 g004
Figure 5. Comparisons of responses to acetone, ethanol, and toluene (100 ppm) of the pr-wAu-Cu-SnO2 and 3.0Au/pr-Cu-SnO2 sensors at 350 °C in air.
Chemosensors 12 00153 g005
Figure 6. Concentration dependence of the response to acetone of the pr-3.0Au-Cu2O-SnO2 sensor.
Chemosensors 12 00153 g006
Figure 7. Temperature dependencies of (i) conversion efficiency and (ii) CO2 production ratio of 100 ppm VOCs ((a) acetone, (b) ethanol and (c) toluene) over the pr-wAu-Cu-SnO2 powders (w: 0, 1.0, 3.0, and 5.0) in air.
Chemosensors 12 00153 g007
Figure 8. Temperature dependences of T50(cv) and T50(CO2) values of the pr-wAu-Cu-SnO2 powders (w: 0, 1.0, 3.0, and 5.0) in air.
Chemosensors 12 00153 g008
Table 1. The crystallite sizes and specific surface areas of the fabricated powders.
SamplewCS * of SnO2/nmSSA **/m2 g−1
pr-wAu-Cu2O-SnO207.0848.3
0.56.9850.0
1.07.8738.1
3.08.3239.6
5.08.4138.7
3.0Au/pr-Cu2O-SnO27.8848.9
* Crystallite size; ** specific surface area.
Disclaimer/Publisher’s Note: The statements, opinions and data contained in all publications are solely those of the individual author(s) and contributor(s) and not of MDPI and/or the editor(s). MDPI and/or the editor(s) disclaim responsibility for any injury to people or property resulting from any ideas, methods, instructions or products referred to in the content.